by Lara | Mar 26, 2021 | US Oil, US Oil Historical
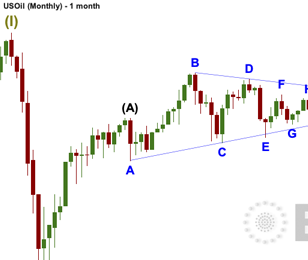
US OIL: Elliott Wave and Technical Analysis | Charts – March 26, 2021 Another downwards week was expected. Targets for the pullback to end remain the same. Summary: A pullback or consolidation may continue for a few to several weeks. A first target is at 54.86....

by Lara | Mar 19, 2021 | Gold, Lara's Weekly, S&P500, US Oil
Lara’s Weekly: Elliott Wave and Technical Analysis of S&P500 and Gold and US Oil | Charts – March 19, 2021 S&P 500 Last analysis expected a pullback to continue. Another downwards day exactly fits this expectation. Summary: The main wave count...

by Lara | Mar 19, 2021 | US Oil, US Oil Historical
US OIL: Elliott Wave and Technical Analysis | Charts – March 19, 2021 Downwards movement during the week is exactly what was expected. Targets remain the same. Summary: A pullback or consolidation may continue for several weeks. A first target is at 54.86....

by Lara | Mar 12, 2021 | Gold, Lara's Weekly, S&P500, US Oil
Lara’s Weekly: Elliott Wave and Technical Analysis of S&P500 and Gold and US Oil | Charts – March 12, 2021 S&P 500 Upwards movement this week fits expectations for the Elliott wave counts. Summary: The pullback may now be complete. Both main and...

by Lara | Mar 12, 2021 | US Oil, US Oil Historical
US OIL: Elliott Wave and Technical Analysis | Charts – March 12, 2021 A target for upwards movement to end for the week was at 68.49. Price reached 67.97, 0.52 short of the target. Summary: A pullback or consolidation may last several weeks. A first target is at...

by Lara | Mar 5, 2021 | Gold, Lara's Weekly, S&P500, US Oil
Lara’s Weekly: Elliott Wave and Technical Analysis of S&P500 and Gold and US Oil | Charts – March 5, 2021 S&P 500 An upwards day was expected from the main Elliott wave count in last analysis. Summary: The pullback may have continued lower as a...

by Lara | Mar 5, 2021 | US Oil, US Oil Historical
US OIL: Elliott Wave and Technical Analysis | Charts – March 5, 2021 Upwards movement continues. A new daily Elliott wave count is used this week. Summary: A target for upwards movement to end is now at 68.49. The next pullback or consolidation may last several...

by Lara | Feb 27, 2021 | Gold, Lara's Weekly, S&P500, US Oil
Lara’s Weekly: Elliott Wave and Technical Analysis of S&P500 and Gold and US Oil | Charts – February 26, 2021 S&P 500 In yesterday’s analysis members were warned that an 80% down day and bearish signals from the AD line and VIX suggested...

by Lara | Feb 26, 2021 | US Oil, US Oil Historical
US OIL: Elliott Wave and Technical Analysis | Charts – February 26, 2021 Downwards movement was expected, but without a breach of the channel on the daily chart this expectation did not have substantial confidence. Summary: Another bearish candlestick reversal...


