
Yesterday’s analysis expected downwards movement for Tuesday to complete a red candlestick. This is exactly what happened.
I have two hourly wave counts for you today.
Summary: Price should move higher over the next few hours, maybe to end between 1,247.04 to 1,249.21. Thereafter, downwards movement should resume and may end about 1,231. I am expecting to see another red candlestick for the next day.
Click on the charts below to enlarge.
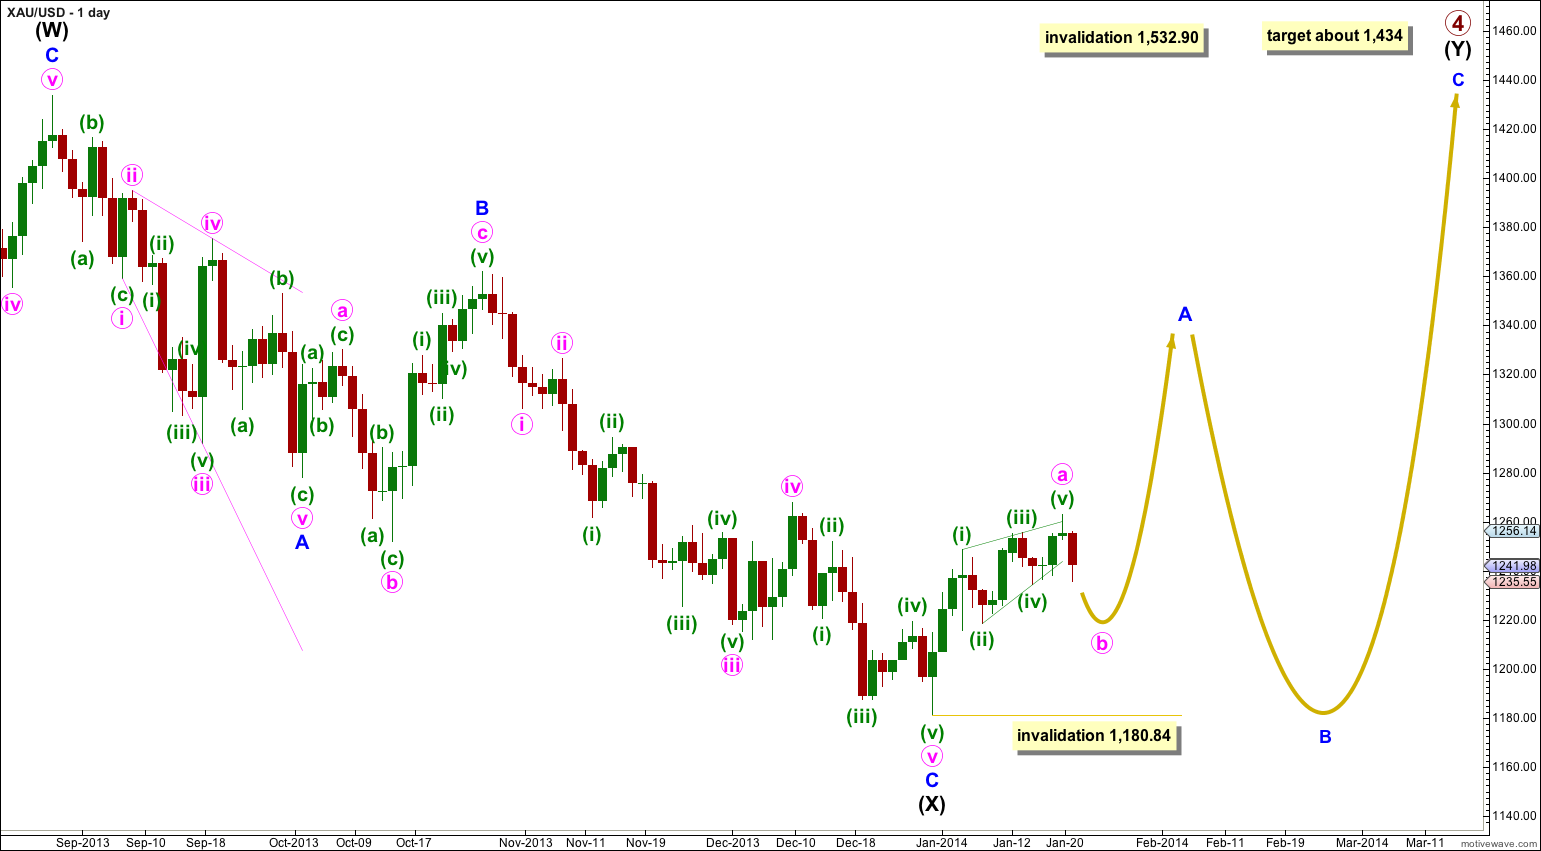
Gold is still within a large fourth wave correction at primary wave degree which is incomplete. To see a full explanation of my reasoning for expecting that primary wave 4 is not over and is continuing see this.
Movement above 1,277.97 would provide confirmation that primary wave 4 is not over. At that stage upwards movement could not be a fourth wave correction within primary wave 5 because it would be in its first wave price territory, and the downwards movement labeled intermediate wave (X) would be confirmed as a completed three wave structure.
Primary wave 2 was a rare running flat correction, and was a deep 68% correction of primary wave 1. In order to show alternation in structure primary wave 4 may be a zigzag, double zigzag, combination, triangle or even an expanded flat. We can rule out a zigzag because the first wave subdivides as a three. This still leaves several structural possibilities.
Primary wave 4 is most likely to be a combination or triangle in order to show structural alternation with the running flat of primary wave 2.
The downwards wave labeled intermediate wave (X) is 99% the length of the upwards wave labeled intermediate wave (W). Primary wave 4 is unlikely to be a flat correction because if it were it would be a regular flat. These have similar behaviour and a similar look to running flats, and so there would be little structural alternation between primary waves 2 and 4.
Primary wave 4 is most likely to be a combination rather than a double zigzag because of the depth of intermediate wave (X). Double combinations take up time and move price sideways, and their X waves can be very deep. Double zigzags are different because their purpose is to deepen a correction when the first zigzag does not move price deep enough, so their X waves are not normally very deep. Thus intermediate wave (Y) is most likely to be a flat correction, and less likely a triangle and least likely a zigzag. It is most likely to end about the same level as intermediate wave (W) at 1,434 so that the whole structure moves sideways. It may last about 43 to 89 days, depending upon what structure it takes.
If intermediate wave (Y) is a flat correction then within it minor wave B must retrace a minimum of 90% the length of minor wave A, and it may make a new low below 1,180.84.
If intermediate wave (Y) is a flat correction then within it minor wave A must subdivide as a three wave structure. At this stage it looks like minor wave A may be unfolding as a zigzag because minute wave a within it looks like it is unfolding as a leading diagonal which is a five wave structure.
Primary wave 4 may not move into primary wave 1 price territory. This wave count is invalidated with movement above 1,532.90.
Main Hourly Wave Count.
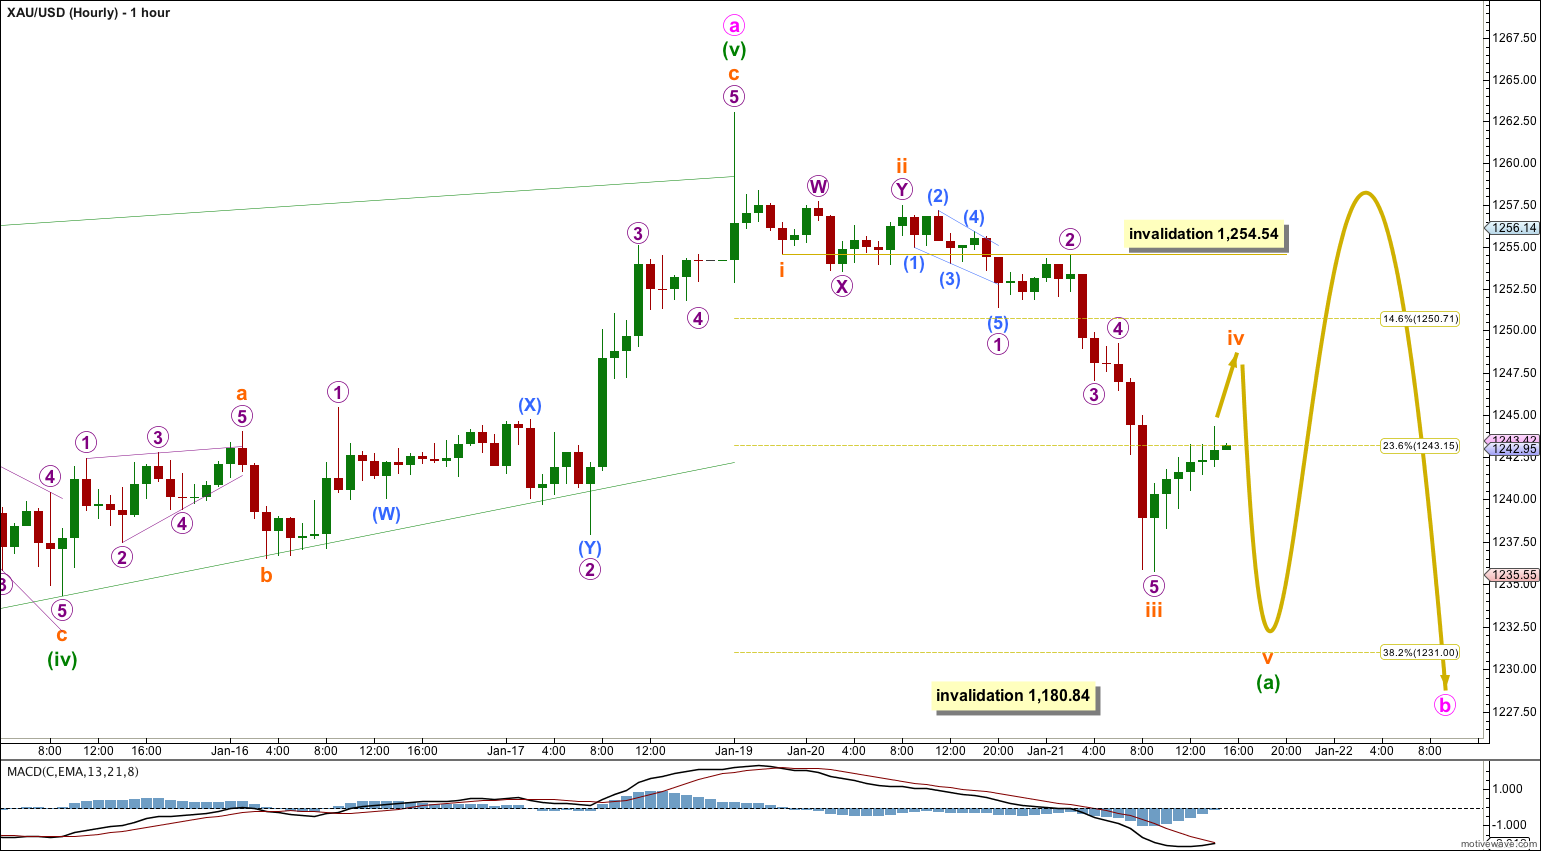
So far downwards movement may be either a complete three (alternate hourly wave count) or more likely an incomplete five as labeled here.
This main wave count has a higher probability than the alternate. A zigzag for minute wave b would be slightly more likely than a flat correction or combination, which means within it minuette wave (a) would subdivide as a five wave structure. So far this downwards movement looks most like an unfolding five because the third wave is so clear as it shows a clear increase in downwards momentum.
Subminuette wave iii is just 0.59 longer than 2.618 the length of subminuette wave i.
Within subminuette wave iii there are no adequate Fibonacci ratios between micro waves 1, 3 and 5.
Within this downwards movement subminuette wave ii lasted ten hours. So far subminuette wave iv has lasted just five hours and if it continues for a few more hours it would be nicely in proportion to subminuette wave ii. Subminuette wave ii was a sideways moving combination, and subminuette wave iv is showing alternation as a sharp zigzag correction. It is incomplete. It may end within the price territory of the fourth wave of one lesser degree, between 1,247.04 to 1,249.21.
Subminuette wave iv may not move into subminuette wave i price territory. This wave count is invalidated with movement above 1,254.54.
Because subminuette wave iv is incomplete I cannot use the ratios between subinuette waves i, iii and v to calculate a target for the next downwards wave to end. It may end about 1,231 as A waves within corrections sometimes end about the 0.383 Fibonacci ratio.
Overall I am expecting to see another red candlestick for the next day, which may reach down to about 1,231.
Minute wave b may not move beyond the start of minute wave a. This wave count is invalidated with movement below 1,180.84.
Alternate Hourly Wave Count.
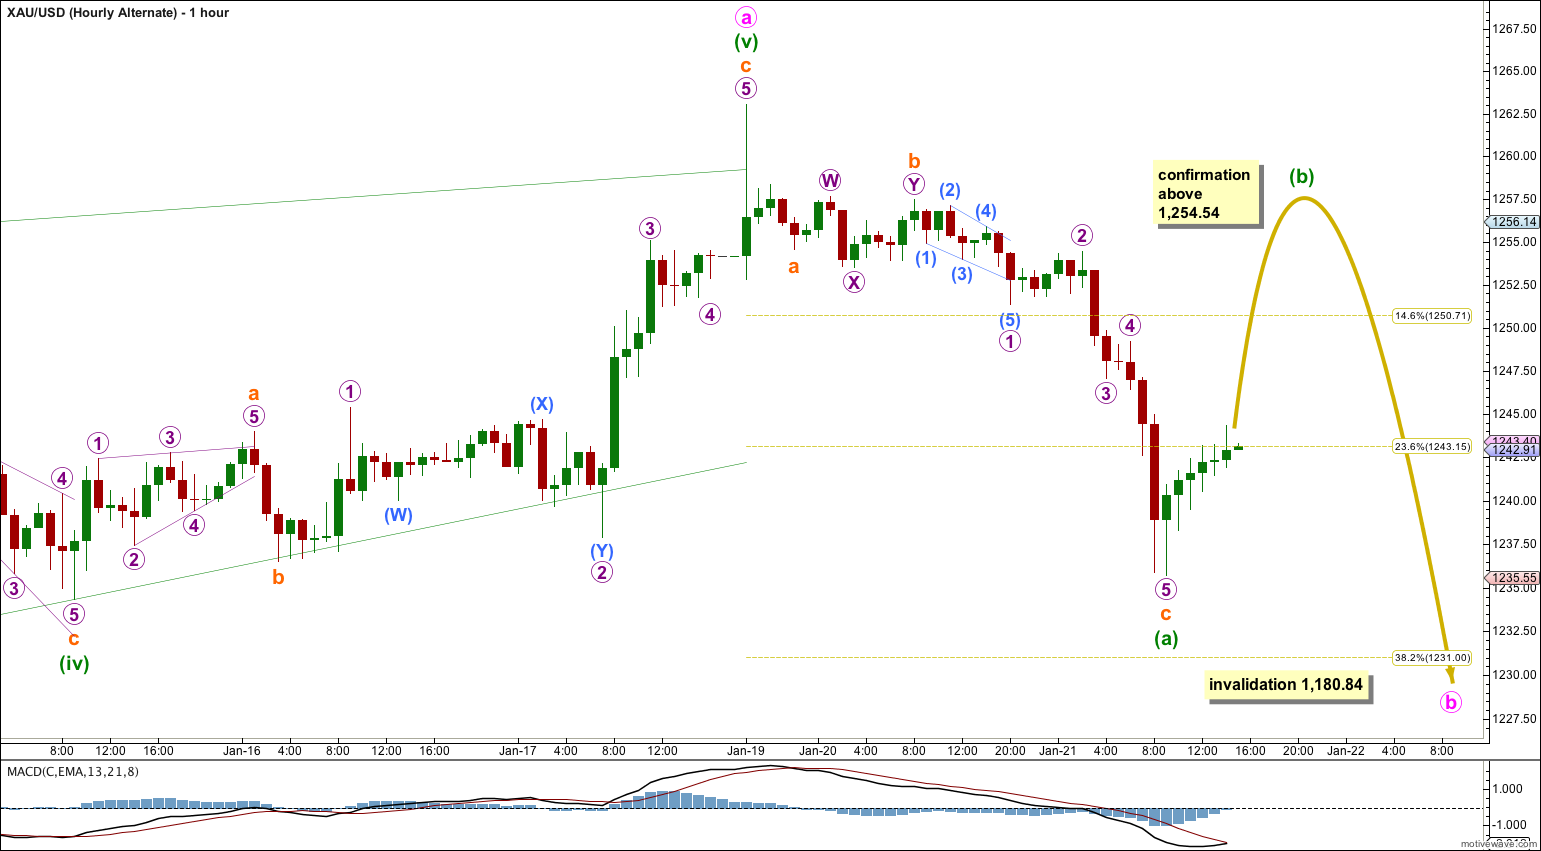
This alternate wave count is valid but it does not have as good a look as the main wave count. I would only use it if price moves above 1,254.54.
If this wave count is confirmed with upwards movement then we may see a new high above 1,263.06. If minute wave b is unfolding as a flat correction then the most common type of flat is an expanded flat which would see minuette wave (b) end at or above 1,264.43.
There is no upper invalidation point for this wave count because there is no maximum allowable length for a B wave within a flat correction.
Alternate Daily Wave Count – Triangle.
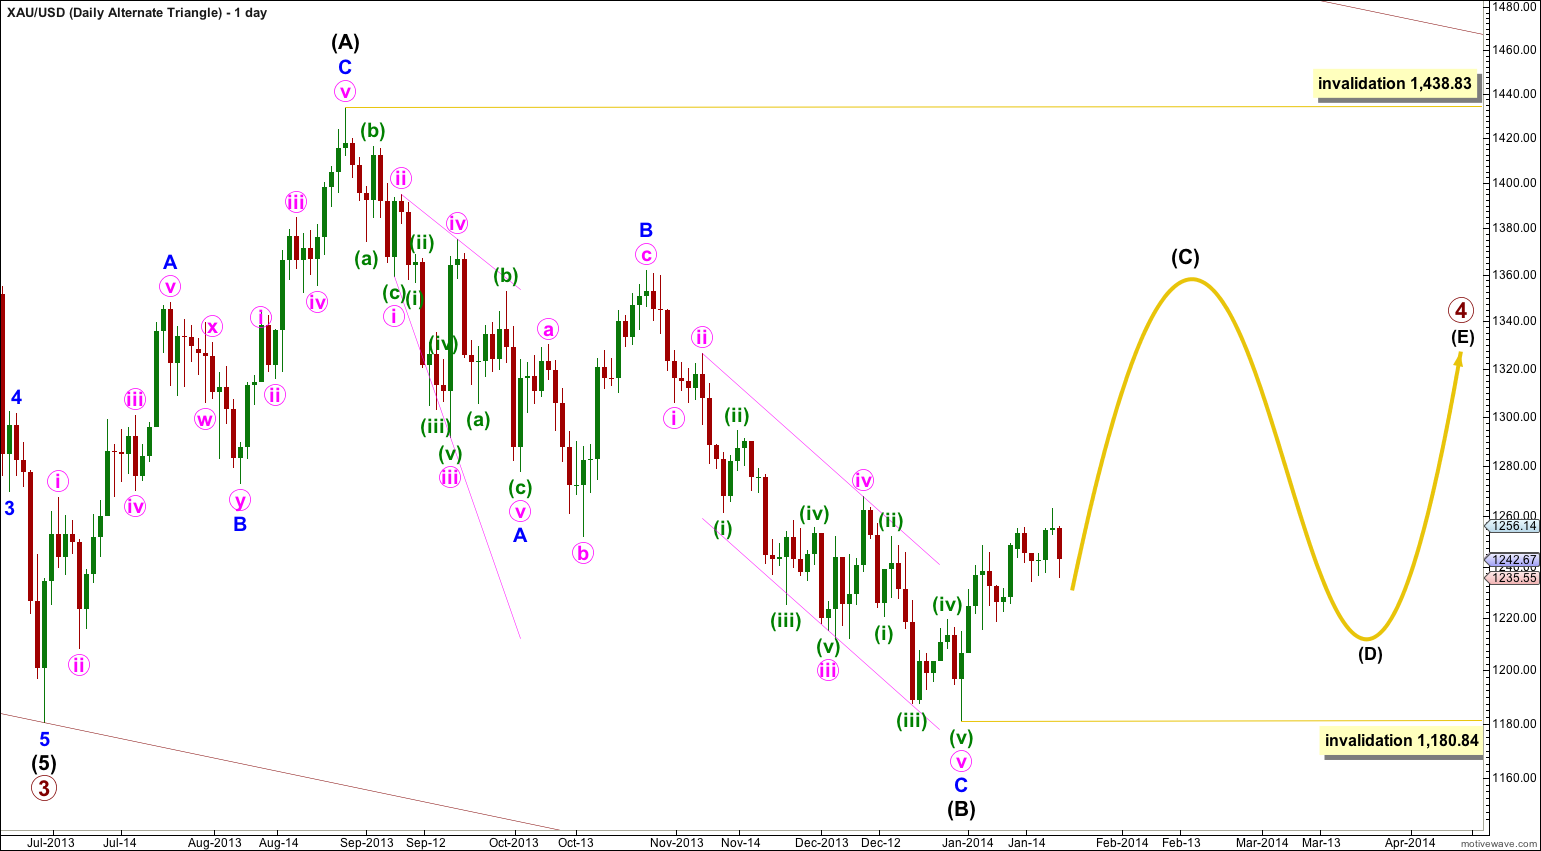
It is also possible that primary wave 4 may continue as a regular contracting (or barrier) triangle.
The expected direction of this next upwards wave is the same, but for this alternate intermediate wave (C) of the triangle may not move beyond the end of intermediate wave (A). The triangle is invalidated with movement above 1,438.83.
Intermediate wave (C) must unfold as either a single or double zigzag. Within it no second wave correction, nor wave B of the zigzag, may move beyond the start of the first wave or A wave. This wave count is invalidated with movement below 1,180.84.
The final intermediate wave (E) upwards may not move above the end of intermediate wave (C) for both a contracting and barrier triangle. E waves most commonly end short of the A-C trend line.
All five subwaves of a triangle must divide into corrective structures. If this next upwards movement subdivides as a zigzag which does not make a new high above 1,438.83 then this alternate would be correct.
Triangles take up time and move price sideways. If primary wave 4 unfolds as a triangle then I would expect it to last months rather than weeks.
that’s great, it’s working 🙂
I agree. The new summary is a nice addition. I also agree that it’s nice to see your analysis before the market closes when possible, especially when you don’t expect any extreme movements before the close.
Thanks for the great work Lara. Hope you enjoy your ‘ocean’ wave trip!
cheers.
no waves were found on this trip 🙁 but we have had a great time exploring one of the most remote spots in NZ
I’ll be back home tomorrow and hopefully next week there will be waves at my local
Lara, I really like that summary in bold–straight to the point, I can quickly see what is going on, then can study complete analysis as time permits.
Posting analysis a few minutes before NYSE closes with summary at top is great.