
Yesterday’s analysis expected one or two days of downwards movement towards a target at 1,211.60. We have had only one more day of a little downwards movement which ended at 1,231.69.
Summary: This upwards movement is close to an end for the short term and the channel on the hourly charts would indicate when it is over. The depth of the next wave downwards will decide which of the two hourly wave counts is correct.
Click on the charts below to enlarge.
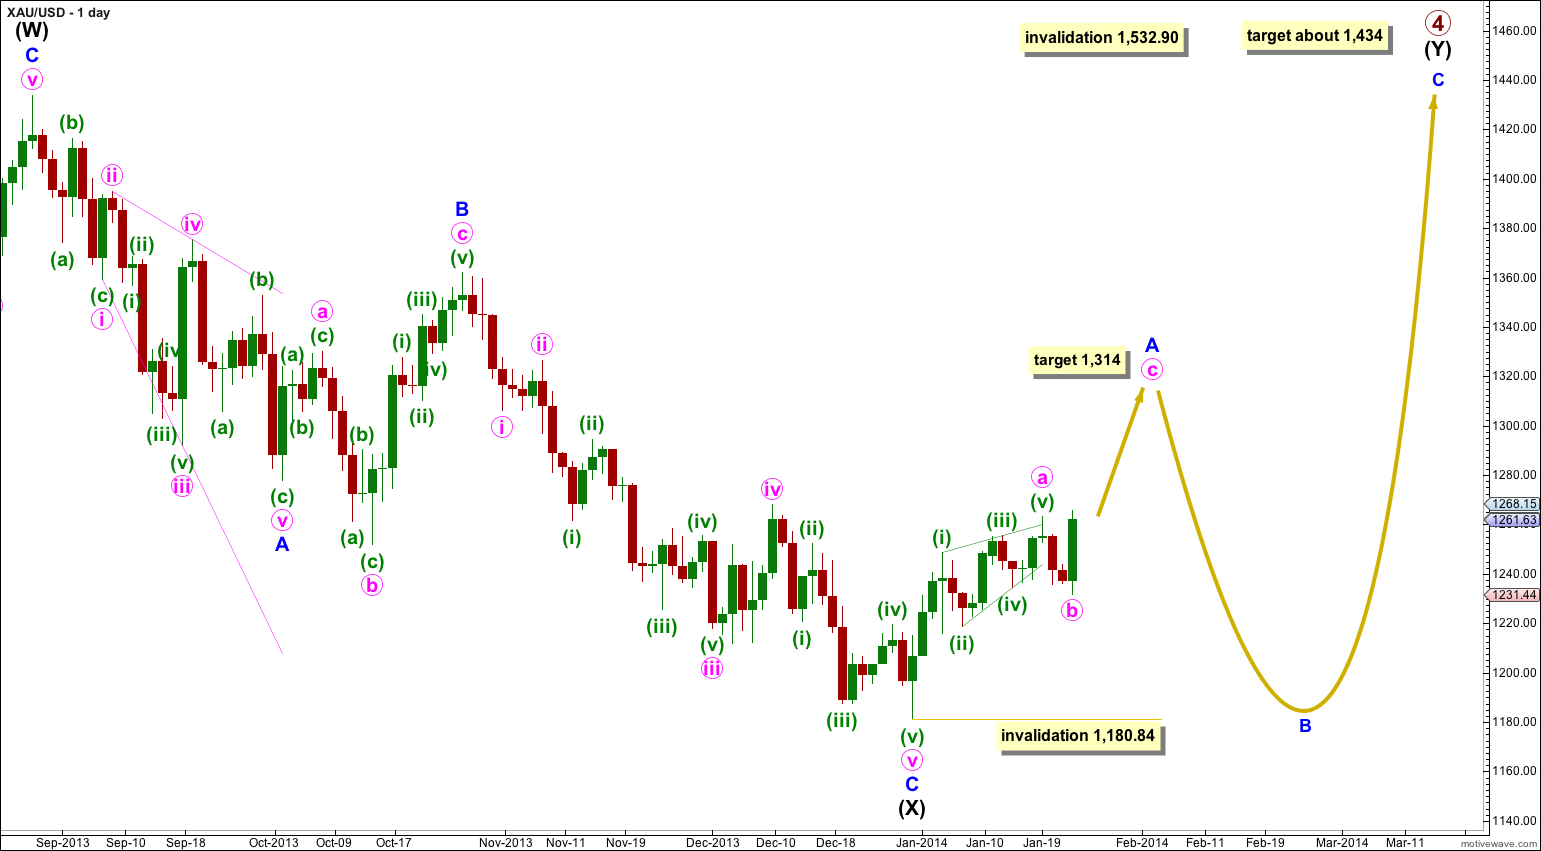
Gold is still within a large fourth wave correction at primary wave degree which is incomplete. To see a full explanation of my reasoning for expecting that primary wave 4 is not over and is continuing see this.
Movement above 1,277.97 would provide confirmation that primary wave 4 is not over. At that stage upwards movement could not be a fourth wave correction within primary wave 5 because it would be in its first wave price territory, and the downwards movement labeled intermediate wave (X) would be confirmed as a completed three wave structure.
Primary wave 2 was a rare running flat correction, and was a deep 68% correction of primary wave 1. In order to show alternation in structure primary wave 4 may be a zigzag, double zigzag, combination, triangle or even an expanded flat. We can rule out a zigzag because the first wave subdivides as a three. This still leaves several structural possibilities.
Primary wave 4 is most likely to be a combination or triangle in order to show structural alternation with the running flat of primary wave 2.
The downwards wave labeled intermediate wave (X) is 99% the length of the upwards wave labeled intermediate wave (W). Primary wave 4 is unlikely to be a flat correction because if it were it would be a regular flat. These have similar behaviour and a similar look to running flats, and so there would be little structural alternation between primary waves 2 and 4.
Primary wave 4 is most likely to be a combination rather than a double zigzag because of the depth of intermediate wave (X). Double combinations take up time and move price sideways, and their X waves can be very deep. Double zigzags are different because their purpose is to deepen a correction when the first zigzag does not move price deep enough, so their X waves are not normally very deep. Thus intermediate wave (Y) is most likely to be a flat correction, and less likely a triangle and least likely a zigzag. It is most likely to end about the same level as intermediate wave (W) at 1,434 so that the whole structure moves sideways. It may last about 43 to 89 days, depending upon what structure it takes.
If intermediate wave (Y) is a flat correction then within it minor wave B must retrace a minimum of 90% the length of minor wave A, and it may make a new low below 1,180.84.
If intermediate wave (Y) is a flat correction then within it minor wave A must subdivide as a three wave structure. At this stage it looks like minor wave A may be unfolding as a zigzag because minute wave a within it completed as a leading diagonal which is a five wave structure. If minute wave b within this zigzag is over then at 1,314 minute wave c would reach equality in length with minute wave a.
Primary wave 4 may not move into primary wave 1 price territory. This wave count is invalidated with movement above 1,532.90.
Hourly Main Wave Count.
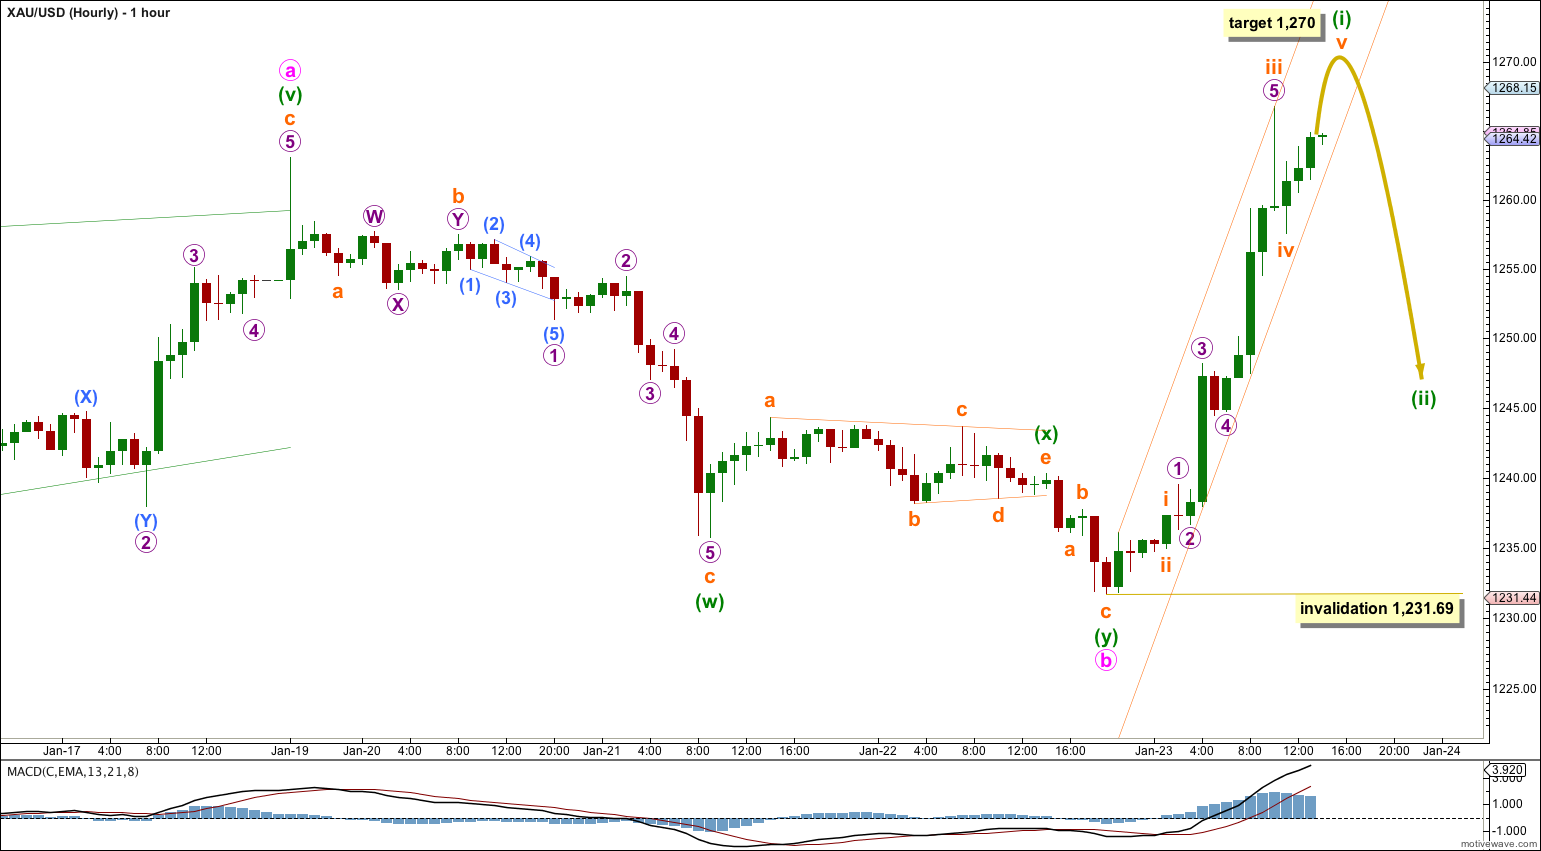
Minute wave b is now complete. It ended very close to the 0.382 Fibonacci ratio of minute wave a which was at 1,231, and did not make it down to the 0.618 Fibonacci ratio which was the target for yesterday.
Minute wave b subdivides as a double zigzag, with the second zigzag much shorter than the first which gives this structure an atypical look.
To the upside there is an incomplete five wave impulse. One final upwards fifth wave for subminuette wave v would complete it. When the impulse of minuette wave (i) is complete then I would expect to see a second wave correction which may show up on the daily chart as a doji or red candlestick (although it does not have to). This would give the wave count a more typical look on the daily chart.
At 1,270 subminuette wave v would reach 0.382 the length of subminuette wave iii.
I have drawn a small best fit channel about this upwards movement. When this channel is clearly breached by downwards movement with at least two full hourly candlesticks below the channel and not touching the lower trend line, then that may be taken as confirmation that minuette wave (i) is over and minuette wave (ii) is underway (whether or not the target is reached).
When minuette wave (i) is over draw a Fibonacci retracement along its length. Use the 0.382, 0.5 and 0.618 ratios as targets for minuette wave (ii) downwards to end.
When minuette wave (ii) is complete then I would expect minuette wave (iii) upwards to show a strong increase in upwards momentum.
Minuette wave (ii) may not move beyond the start of minuette wave (i). This wave count is invalidated with movement below 1,231.69.
Hourly Alternate Wave Count.
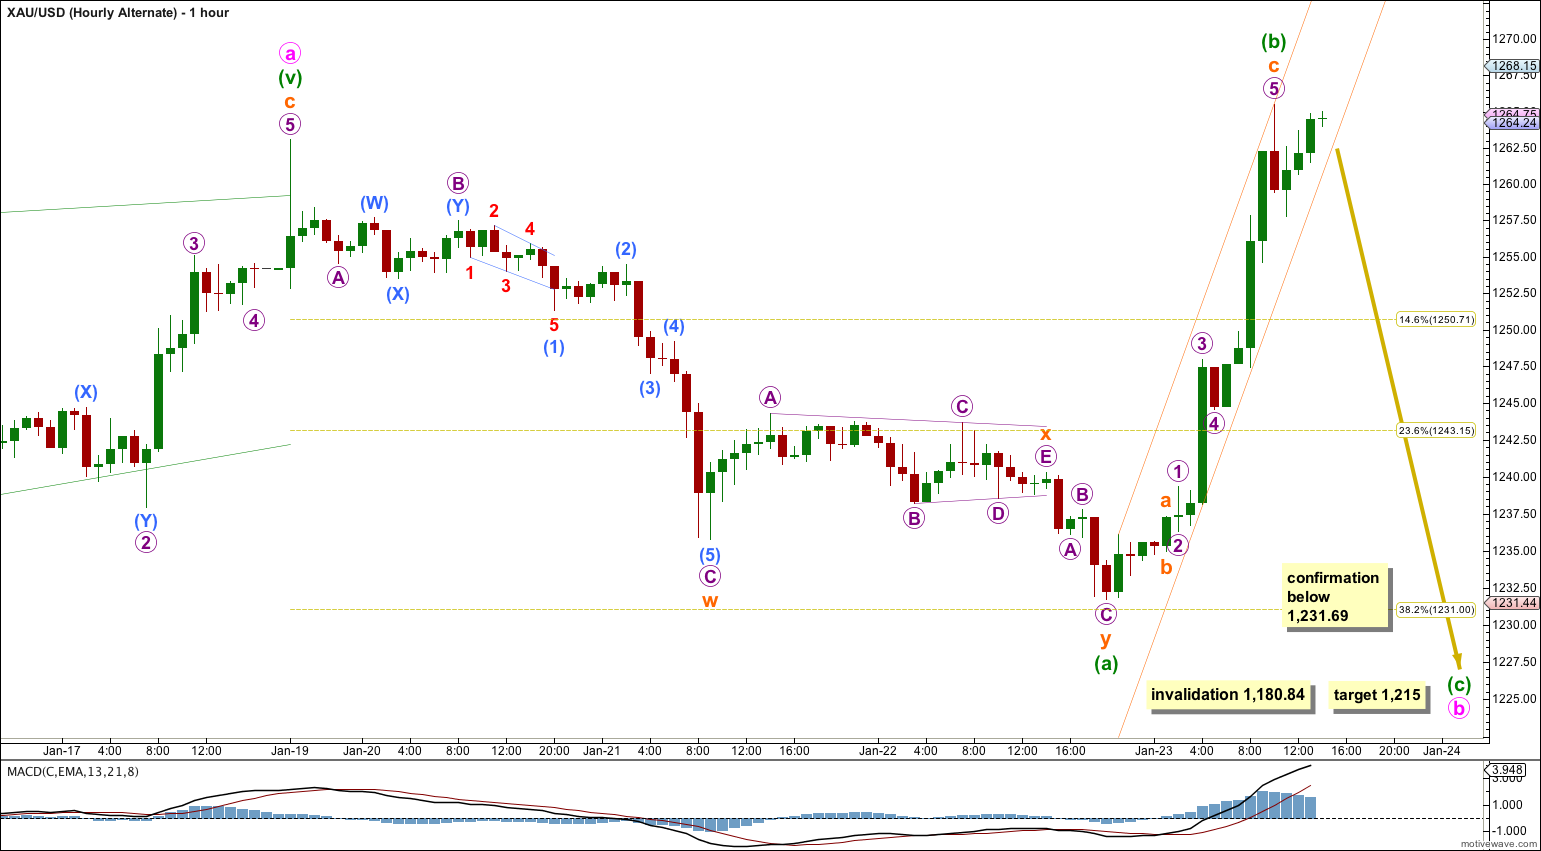
Until we have a clear completed five wave structure upwards on the hourly chart we must consider the possibility that minute wave b is not over and may be continuing as an expanded flat correction, which is a very common structure.
The main wave count sees minute wave b as a brief shallow double zigzag over in just three days. Because of the brevity of this movement this alternate must be considered.
If upwards movement which is incomplete ends as a three wave structure then this wave count would be correct. If it completes as a five wave structure then this wave count would be invalid and discarded.
At this stage upwards movement may be a completed zigzag for minuette wave (b) which is so far a 107% correction of minuette wave (a). At 1,215 minuette wave (c) would reach 1.618 the length of minuette wave (a).
When the best fit channel around this upwards movement is clearly breached by downwards movement then both wave counts expect a correction. At that stage if price moves below 1,231.69 the main hourly wave count would be invalidated and this alternate confirmed. At that stage more downwards movement would be expected and the target would be 1,215.
Alternate Daily Wave Count – Triangle.
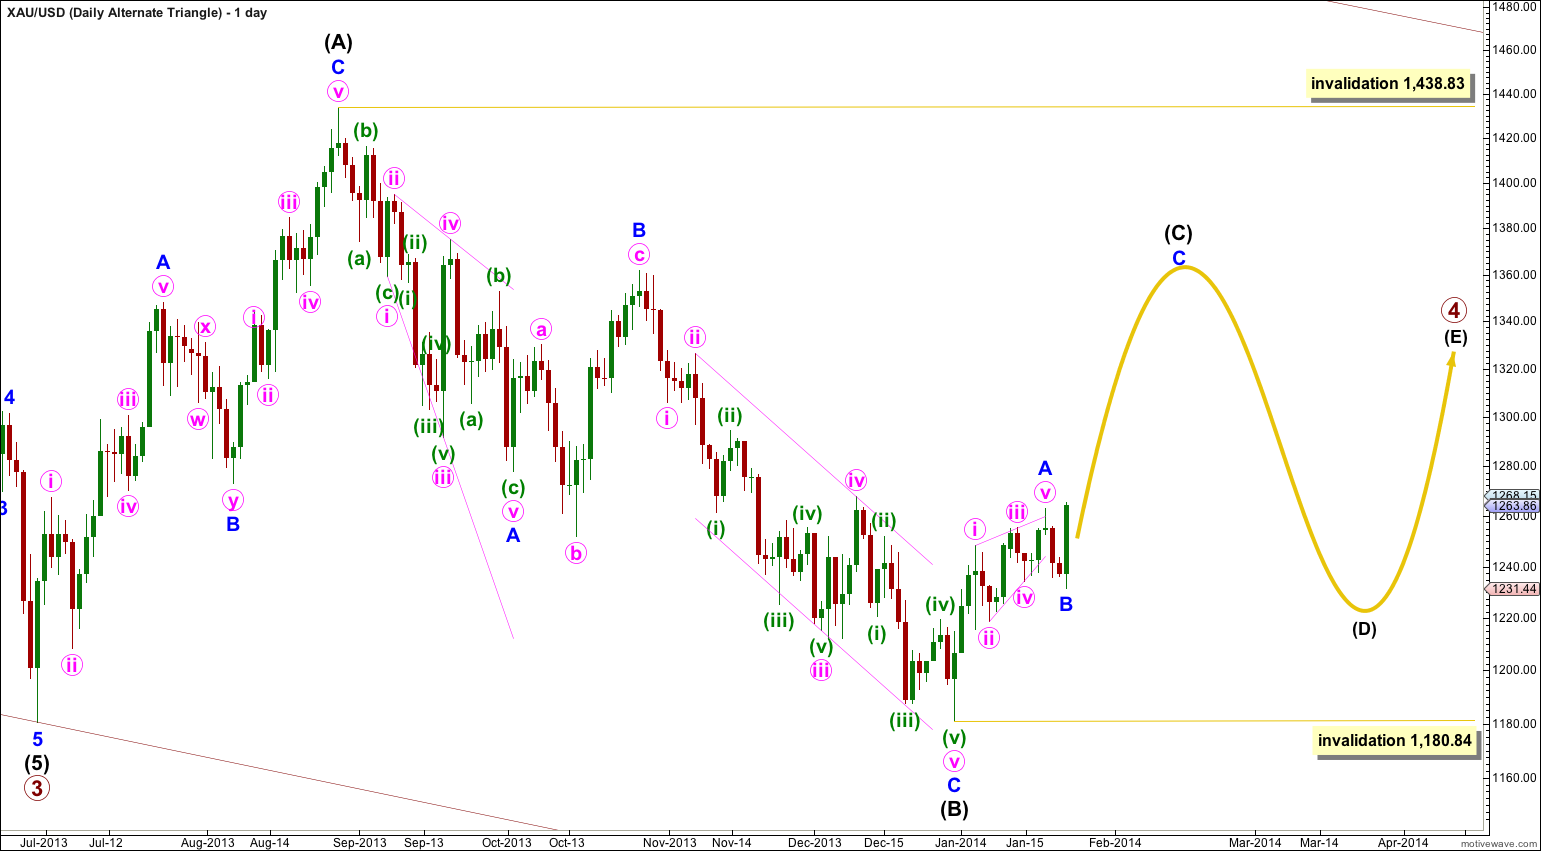
It is also possible that primary wave 4 may continue as a regular contracting (or barrier) triangle.
The expected direction of this next upwards wave is the same, but for this alternate intermediate wave (C) of the triangle may not move beyond the end of intermediate wave (A). The triangle is invalidated with movement above 1,438.83.
Intermediate wave (C) must unfold as either a single or double zigzag. Within it no second wave correction, nor wave B of the zigzag, may move beyond the start of the first wave or A wave. This wave count is invalidated with movement below 1,180.84.
The final intermediate wave (E) upwards may not move above the end of intermediate wave (C) for both a contracting and barrier triangle. E waves most commonly end short of the A-C trend line.
All five subwaves of a triangle must divide into corrective structures. If this next upwards movement subdivides as a zigzag which does not make a new high above 1,438.83 then this alternate would be correct.
Triangles take up time and move price sideways. If primary wave 4 unfolds as a triangle then I would expect it to last months rather than weeks.
that does not look right; that possible combination does not move sideways, it moves in the same direction as the main trend, not in a corrective direction. The subdivisions fit sure, but it does not achieve the purpose of a combination.
the alternate hourly wave count would see minute wave b continuing and as an expanded flat it would be a very common structure, and would move price lower.
Hello Lara, Could you please consider another possibility of wave count like this one: http://charts.mql5.com/3/677/golds-h4-x-trade-brokers-2.png ? Leading diagonal followed by such quick and shallow correction does not have a good look. In this count move from 1182 to 1248 was followed by zigzag structure then by x wave and finally by expanded flat. I am not sure if this combination is possible, but current problems with resistance around 1172 could prove it could be right. Another alternative count could be with [w] wave 1182-1248-1218-1255 followed again by expanded flat. This weeks downward move from 1263 to 1231 looks in my eyes much better as five waves impulse with nice fibonnaci relationships rather than quick second wave.
Does anyone else have a problem with using these analysis’? Gold is 24 hours a day but the ASX is only open for six of those hours. Alot goes on while the ASX is closed and trying to buy & hold gold stocks is giving me trouble. (and the alternate is usual correct makes it more difficult ). Intra-Day trading seems the only way to control things.