
In last analysis both hourly wave counts expected more upwards movement which is what happened. However, upwards movement was followed by a sharp spike below 1,227.11. The targets were not reached.
It is at this point the hourly wave counts diverge.
Click on the charts below to enlarge.
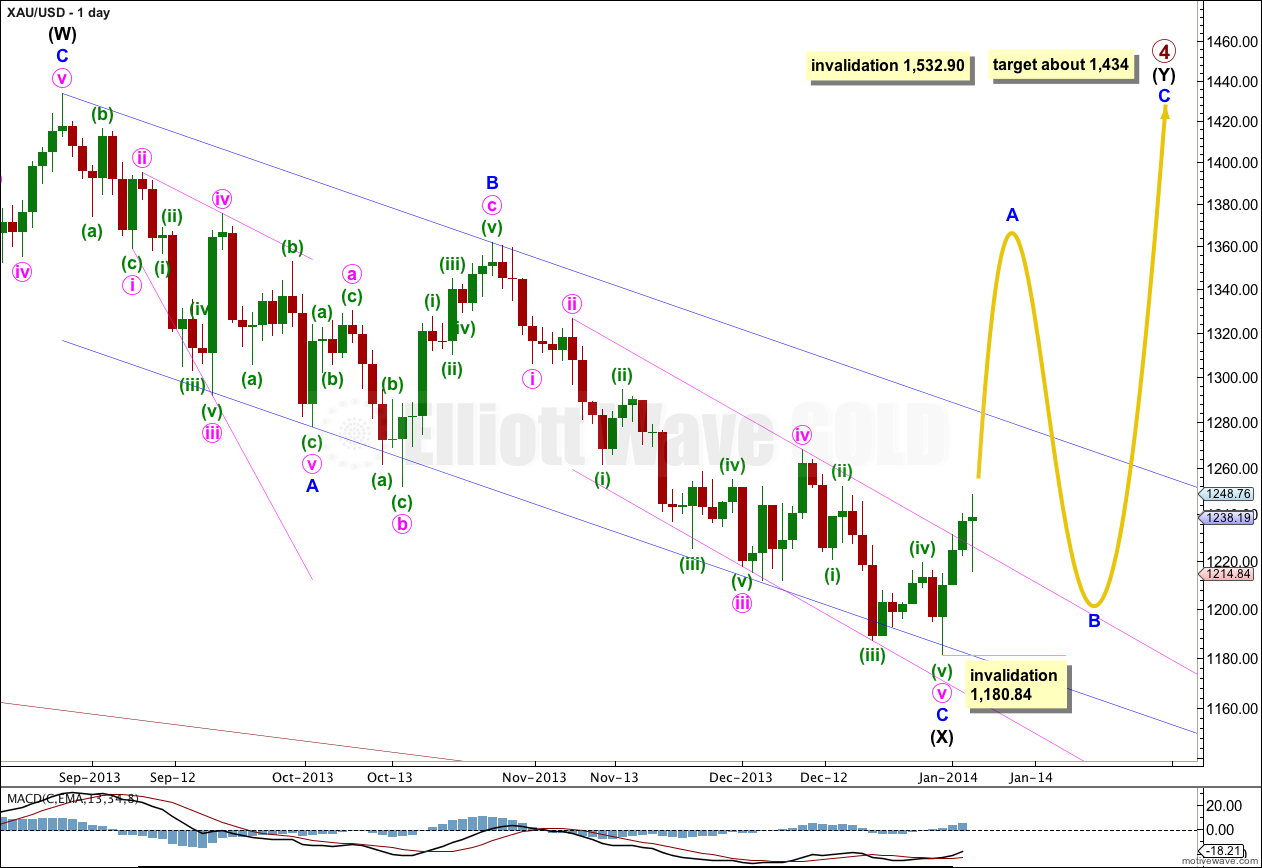
Gold is still within a large fourth wave correction at primary wave degree which is incomplete. To see a full explanation of my reasoning for expecting that primary wave 4 is not over and is continuing see this.
Movement above 1,277.97 would provide confirmation that primary wave 4 is not over. At that stage upwards movement could not be a fourth wave correction within primary wave 5 because it would be in its first wave price territory, and the downwards movement labeled intermediate wave (X) would be confirmed as a completed three wave structure.
Primary wave 2 was a rare running flat correction, and was a deep 68% correction of primary wave 1. In order to show alternation in structure primary wave 4 may be a zigzag, double zigzag, combination, triangle or even an expanded or regular flat. We can rule out a zigzag because the first wave subdivides as a three. This still leaves several structural possibilities.
The downwards wave labeled intermediate wave (X) is now 99% the length of the upwards wave labeled intermediate wave (W). Primary wave 4 is most likely to be a combination or triangle in order to show structural alternation with the running flat of primary wave 2.
Primary wave 4 is less likely to be a flat correction because if it were it would be a regular flat. These have similar behaviour and a similar look to running flats, and so there would be little structural alternation between primary waves 2 and 4.
Draw a parallel channel about minor wave C downwards (pink channel) with the first trend line from the highs labeled minute waves ii to iv, then place a parallel copy upon the low labeled minute wave iii. When this channel is clearly breached by upwards movement with a full daily candlestick above the channel and not touching the upper trend line, then we shall have trend channel confirmation that minor wave C is complete and the next wave is underway.
When the channel about intermediate wave (X) is finally breached by upwards movement then I would consider that final confirmation that intermediate wave (Y) is underway.
Primary wave 4 is most likely to be a combination rather than a double zigzag because of the depth of intermediate wave (X). Double combinations take up time and move price sideways, and their X waves can be very deep. Double zigzags are different because their purpose is to deepen a correction when the first zigzag does not move price deep enough, so their X waves are not normally very deep. Thus intermediate wave (Y) is most likely to be a flat correction, and less likely a triangle and least likely a zigzag. It is most likely to end about the same level as intermediate wave (W) at 1,434 so that the whole structure moves sideways. It may last about 43 to 89 days, depending upon what structure it takes.
If intermediate wave (Y) is a flat correction then within it minor wave B must retrace a minimum of 90% the length of minor wave A, and it may make a new low below 1,180.84. This invalidation point will only apply while minor wave A is incomplete.
If intermediate wave (Y) is a flat correction then within it minor wave A must subdivide as a three wave structure. This is most likely to be a zigzag, but it may also be a flat correction (or a double). It may not be a triangle. The main hourly wave count looks at the most likely structure of a zigzag. The alternate hourly wave count will look at the next likely structure of a flat correction. The new second alternate hourly wave count will look at the possibilities of a combination or double zigzag.
Primary wave 4 may not move into primary wave 1 price territory. This wave count is invalidated with movement above 1,532.90.
Main Hourly Wave Count.
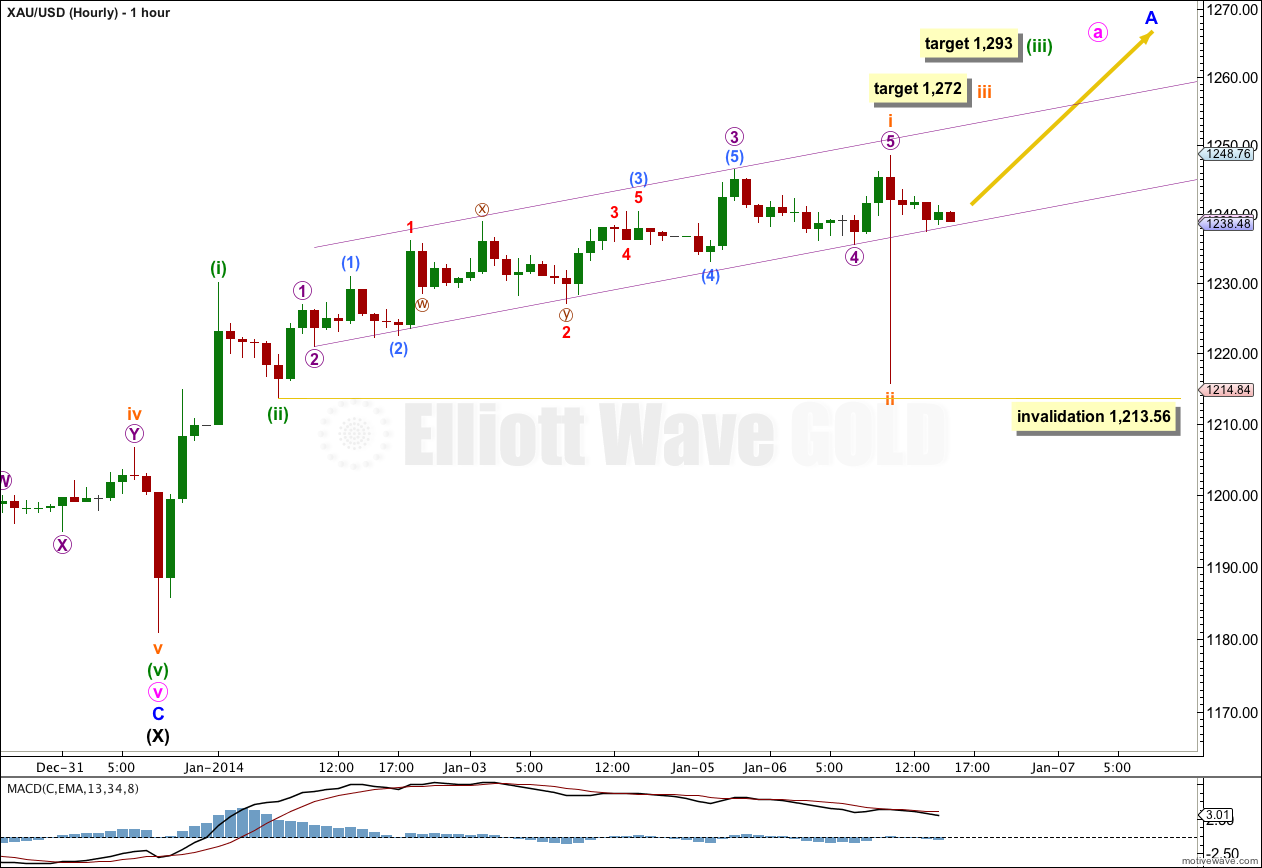
Minor wave A has most likely begun and is most likely unfolding as a zigzag, subdividing 5-3-5. This main hourly wave count has the highest probability of all three hourly wave counts because it expects the most common structure to unfold.
Within minute wave a of the zigzag the structure can only be an impulse or a leading diagonal. The most likely structure is an impulse.
Upwards movement labeled subminuette wave i is very difficult to analyse. The only thing for certain is this movement is over because the sharp spike labeled subminuette wave ii retraced almost all of this slow upwards movement. Subminuette wave i can only be one of two structures, an impulse or a leading diagonal. It does not look at all like a diagonal and does not subdivide as one. It does subdivide as an impulse, although within it there is a problem of proportion between minuscule waves 2 and 4 within the middle of the third wave.
Ratios within subminuette wave i are: there is no Fibonacci ratio between micro waves 3 and 1, and micro wave 5 is 0.46 short of equality with micro wave 1.
Because the spike labeled subminuette wave ii moved price back into minuette wave (i) territory it cannot be minuette wave (iv), and so minuette wave (iii) must be incomplete.
At 1,272 subminuette wave iii would reach 1.618 the length of subminuette wave i. This target may be reached within a day.
At 1,293 minuette wave (iii) would reach 1.618 the length of minuette wave (i). This target may be two to three days away.
On the five minute and one minute charts it is unclear if the sharp spike of subminuette wave ii is a three or a five wave structure; the movement was so swift the subdivisions within it are difficult to see. If it is a five then only wave A within subminuette wave ii would be complete. If subminuette wave ii moves further sideways and a little lower it may not move beyond the start of subminuette wave i. This wave count is invalidated with movement below 1,213.56.
Alternate Hourly Wave Count.
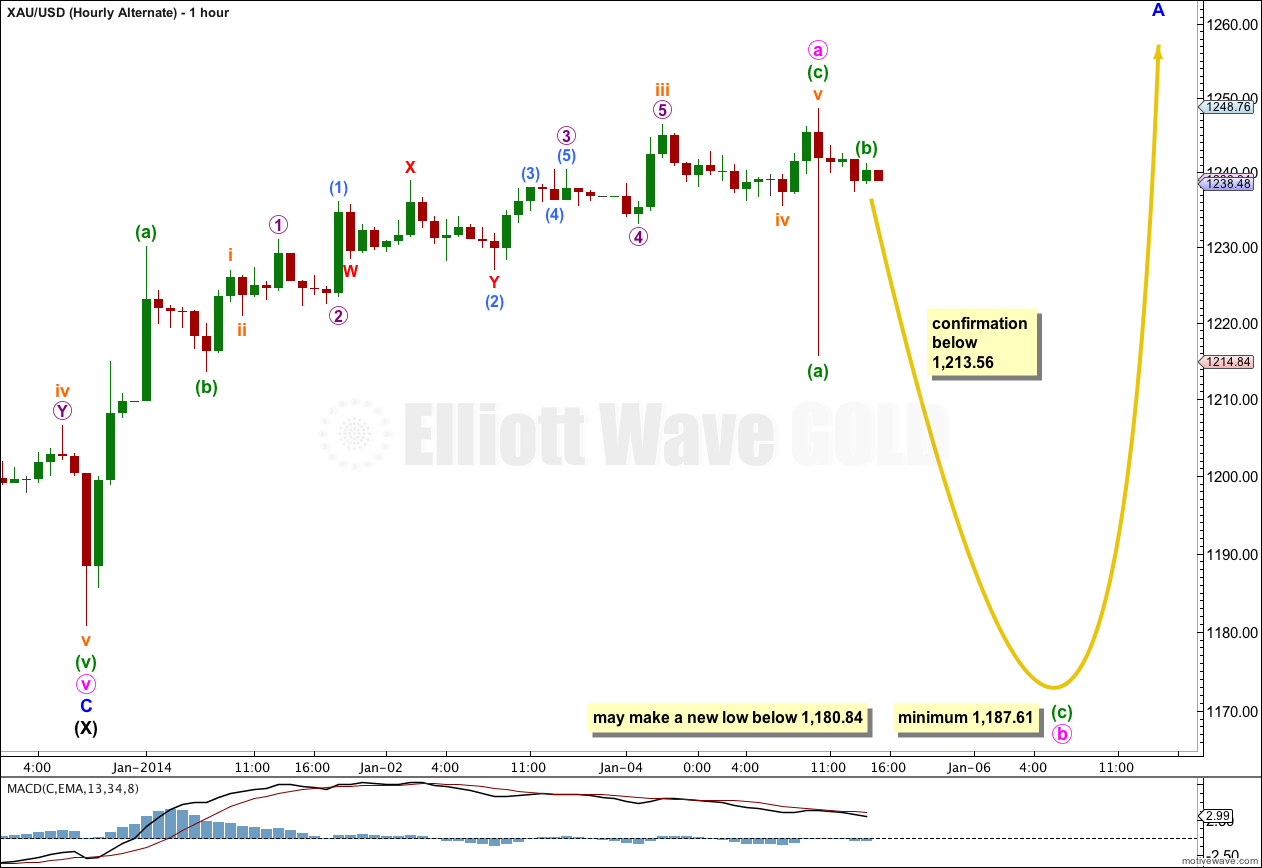
If minor wave A is subdividing as a three wave structure then it may be unfolding as a flat correction. Within the flat correction minute wave a is a completed three, and minute wave b must also subdivide as a three. Within a flat correction minute wave b must retrace a minimum of 90% the length of minute wave a so must reach down to 1,187.61.
If the flat correction of minor wave A is an expanded flat then minute wave b would reach down to 1,177.46 or below. A new low below 1,180.84 is entirely possible for this wave count.
Minute wave a lasted three days. I would expect minute wave b to be a minimum duration of three days, and maybe five days. B waves are often more time consuming.
If price moves below 1,213.56 within the next 24 hours then I would use this alternate and the second alternate below.
Second Alternate Hourly Wave Count.
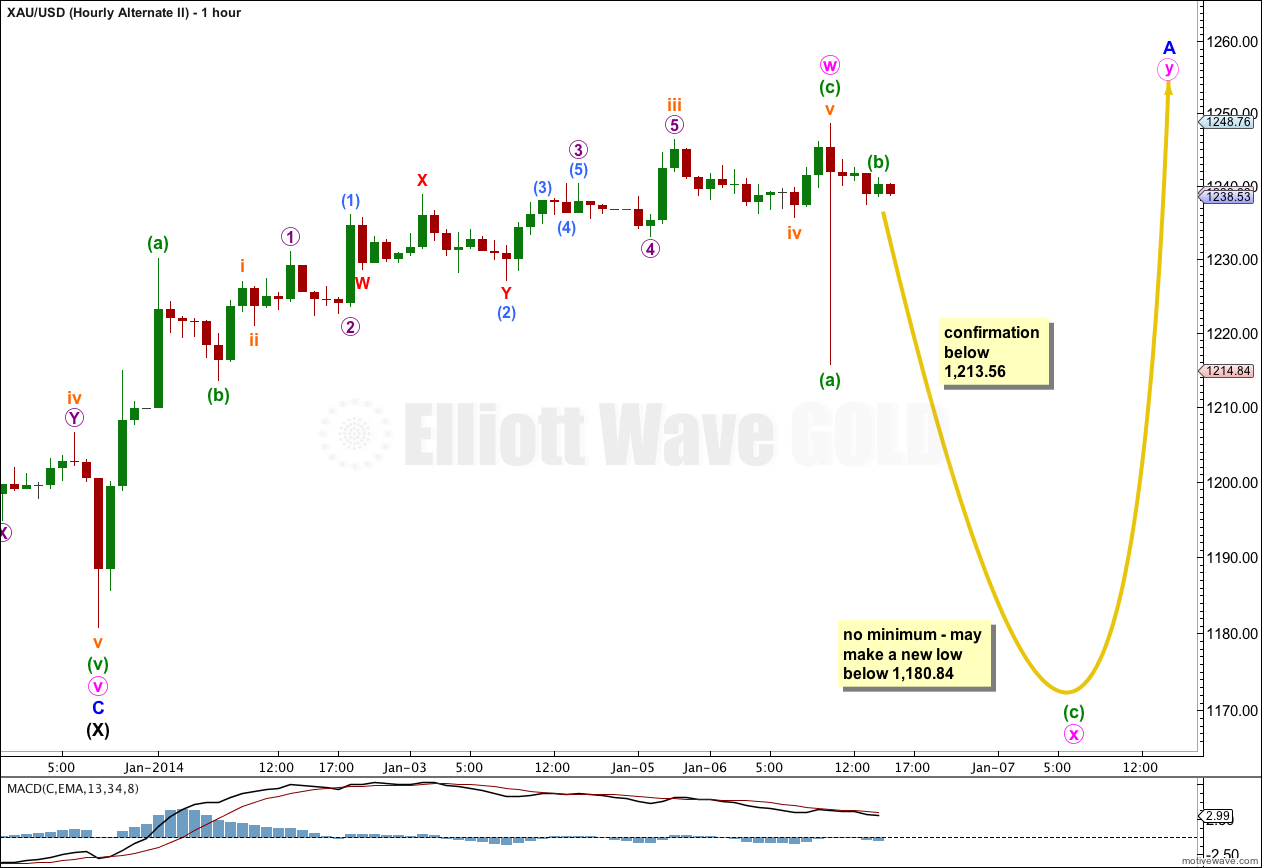
If minor wave A is subdividing as a three wave structure then it may also be unfolding as a double combination or double zigzag. Within the double the first structure labeled minute wave w is a zigzag.
Minute wave x should be a three in the opposite direction. X waves do not have a minimum requirement in relation to the length of W waves, and there is no minimum price point to the downside. X waves also have no maximum length, and minute wave x may make a new low below the start of minute wave w at 1,180.84.
X waves are most commonly zigzags (almost all the time, this is very common), but they may subdivide into any corrective structure.
X waves are most often more brief than W, Y and Z waves. Minute wave w lasted three days, and minute wave x would be expected to be over within two or three days.
Alternate Daily Wave Count – Triangle.
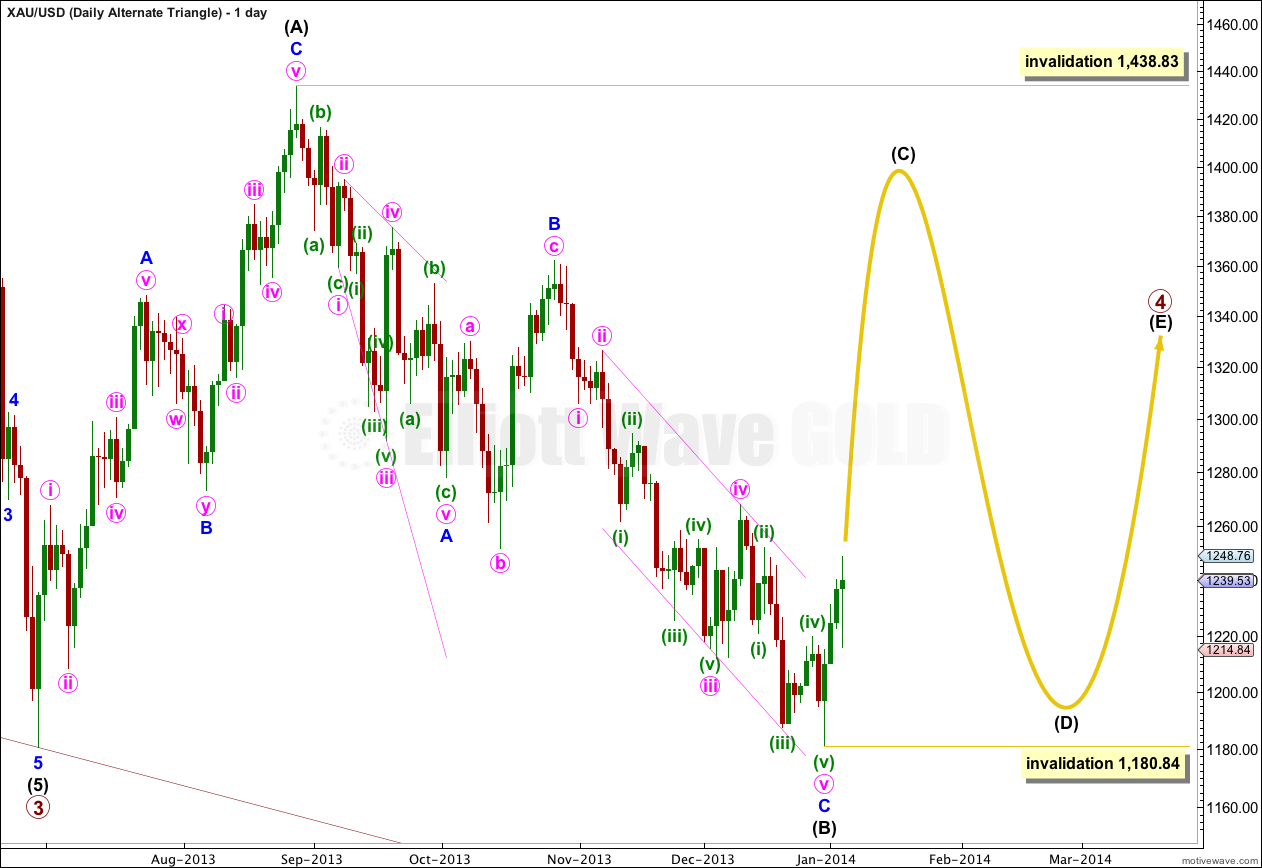
It is also possible that primary wave 4 may continue as a regular contracting (or barrier) triangle.
The expected direction of this next upwards wave is the same, but for this alternate intermediate wave (C) of the triangle may not move beyond the end of intermediate wave (A). The triangle is invalidated with movement above 1,438.83.
Intermediate wave (C) must unfold as either a single or double zigzag. Within it no second wave correction, nor wave B of the zigzag, may move beyond the start of the first wave or A wave. This wave count is invalidated with movement below 1,180.84.
The final intermediate wave (E) upwards may not move above the end of intermediate wave (C) for both a contracting and barrier triangle. E waves most commonly end short of the A-C trend line.
All five subwaves of a triangle must divide into corrective structures. If this next upwards movement subdivides as a zigzag which does not make a new high above 1,438.83 then this alternate would be correct.
Triangles take up time and move price sideways. If primary wave 4 unfolds as a triangle then I would expect it to last months rather than weeks.
I have a question relate to elliott wave principle in the area enclosed within the red box in the image . The wave i & v (circled) are 3 waves, but according to the wave principle they are supposed to be composed of 5 waves right? Even in the case of a leading diagonal they are supposed to be composed of 5 waves. But here i see something different. Is it a new observation in EWP or something else? Please explain.
“Elliott Wave Principle” Frost & Prechter, 10th edition, pg 88: “waves 1, 3 and 5 of a leading diagonal usually subdivie into zigzags but sometimes appear to be impulses”
thanks a lot for referring the page to me. !
yes. a leading diagonal is either 5-3-5-3-5 or 3-3-3-3-3, not a mix of that
I have never heard that interpretation of the rules. And that’s not how I interpret. It’s also not how I’ve noticed leading diagonals subdivide; if one of the actionary waves is an impulse it is often the third wave, while the first and fifth are still zigzags.
Lara, when EW was developed it’s not likely high frequency computer trading was considered, is it possible to just ignore the spike down as some sort of electronic anomaly?
I do not think that HFT changes the behaviour of human beings. And it is our behaviour as a group upon which the Elliott wave theory is based.
In my experience such spikes conform to EW patterns in terms of price, but they may affect the proportions of structures by compressing time.
It is also my experience that spikes like this always form part of an EW structure, and should never be ignored.