Yesterday’s analysis had three hourly wave counts. The main wave count expected upwards movement, and the two alternates expected downwards movement. Price has moved lower but not low enough to invalidate yesterday’s main hourly wave count. All three wave counts remain valid.
Now that there is a little more structure to analyse recent movement is becoming clearer. The probability of yesterday’s alternate wave counts has increased.
Click on the charts below to enlarge.
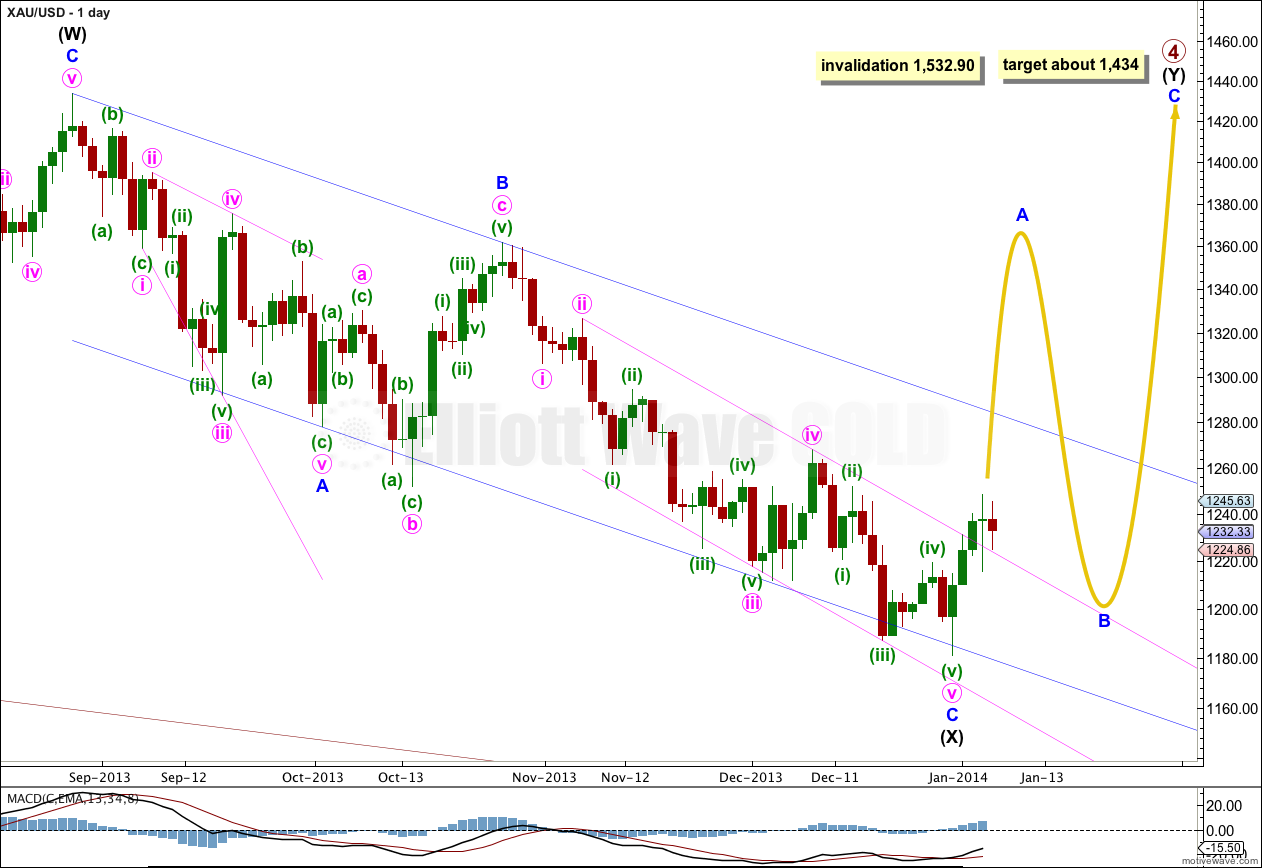
Gold is still within a large fourth wave correction at primary wave degree which is incomplete. To see a full explanation of my reasoning for expecting that primary wave 4 is not over and is continuing see this.
Movement above 1,277.97 would provide confirmation that primary wave 4 is not over. At that stage upwards movement could not be a fourth wave correction within primary wave 5 because it would be in its first wave price territory, and the downwards movement labeled intermediate wave (X) would be confirmed as a completed three wave structure.
Primary wave 2 was a rare running flat correction, and was a deep 68% correction of primary wave 1. In order to show alternation in structure primary wave 4 may be a zigzag, double zigzag, combination, triangle or even an expanded or regular flat. We can rule out a zigzag because the first wave subdivides as a three. This still leaves several structural possibilities.
The downwards wave labeled intermediate wave (X) is now 99% the length of the upwards wave labeled intermediate wave (W). Primary wave 4 is most likely to be a combination or triangle in order to show structural alternation with the running flat of primary wave 2.
Primary wave 4 is less likely to be a flat correction because if it were it would be a regular flat. These have similar behaviour and a similar look to running flats, and so there would be little structural alternation between primary waves 2 and 4.
Draw a parallel channel about minor wave C downwards (pink channel) with the first trend line from the highs labeled minute waves ii to iv, then place a parallel copy upon the low labeled minute wave iii. When this channel is clearly breached by upwards movement with a full daily candlestick above the channel and not touching the upper trend line, then we shall have trend channel confirmation that minor wave C is complete and the next wave is underway.
When the channel about intermediate wave (X) is finally breached by upwards movement then I would consider that final confirmation that intermediate wave (Y) is underway.
Primary wave 4 is most likely to be a combination rather than a double zigzag because of the depth of intermediate wave (X). Double combinations take up time and move price sideways, and their X waves can be very deep. Double zigzags are different because their purpose is to deepen a correction when the first zigzag does not move price deep enough, so their X waves are not normally very deep. Thus intermediate wave (Y) is most likely to be a flat correction, and less likely a triangle and least likely a zigzag. It is most likely to end about the same level as intermediate wave (W) at 1,434 so that the whole structure moves sideways. It may last about 43 to 89 days, depending upon what structure it takes.
If intermediate wave (Y) is a flat correction then within it minor wave B must retrace a minimum of 90% the length of minor wave A, and it may make a new low below 1,180.84.
If intermediate wave (Y) is a flat correction then within it minor wave A must subdivide as a three wave structure. This is most likely to be a zigzag, but it may also be a flat correction (or a double). It may not be a triangle. The main hourly wave count looks at the most likely structure of a zigzag. The alternate hourly wave count will look at the next likely structure of a flat correction. The new second alternate hourly wave count will look at the possibilities of a combination or double zigzag.
Primary wave 4 may not move into primary wave 1 price territory. This wave count is invalidated with movement above 1,532.90.
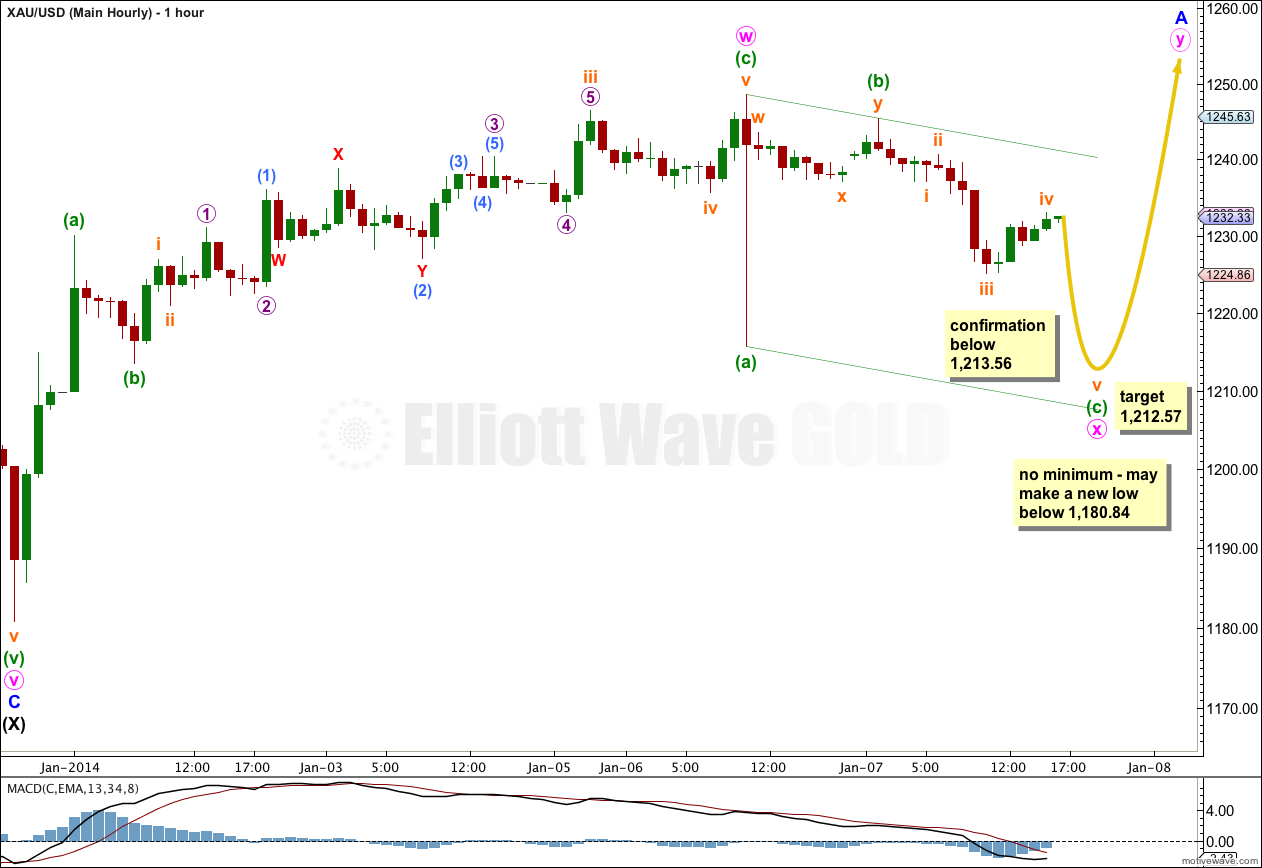
Main Hourly Wave Count.
At this stage this wave count has the best fit and overall look.
What is clear is that the upwards movement labeled minute wave w is a three wave structure, not a five. This subdivides perfectly as a zigzag.
Minor wave A may be unfolding as a double zigzag, which is termed a “three” and is a possible structure for an A wave within a flat correction.
Within the double zigzag minute wave x is most likely to be shallow. Minute wave x is an incomplete zigzag. At 1,212.57 minuette wave (c) would reach equality with minuette wave (a). It is extremely likely that minuette wave (c) would at least move a little below 1,215.68 in order to move beyond the end of minuette wave (a) and so avoid a truncation.
Within double zigzags X waves are often shallow and sometimes more brief than W, Y or Z waves. However, there is no maximum length for an X wave within a double zigzag or double combination. Minute wave x may make a new low below 1,180.84 although this has a low probability.
Movement below 1,213.56 would invalidate the second alternate hourly wave count and so increase the probability of this main wave count.
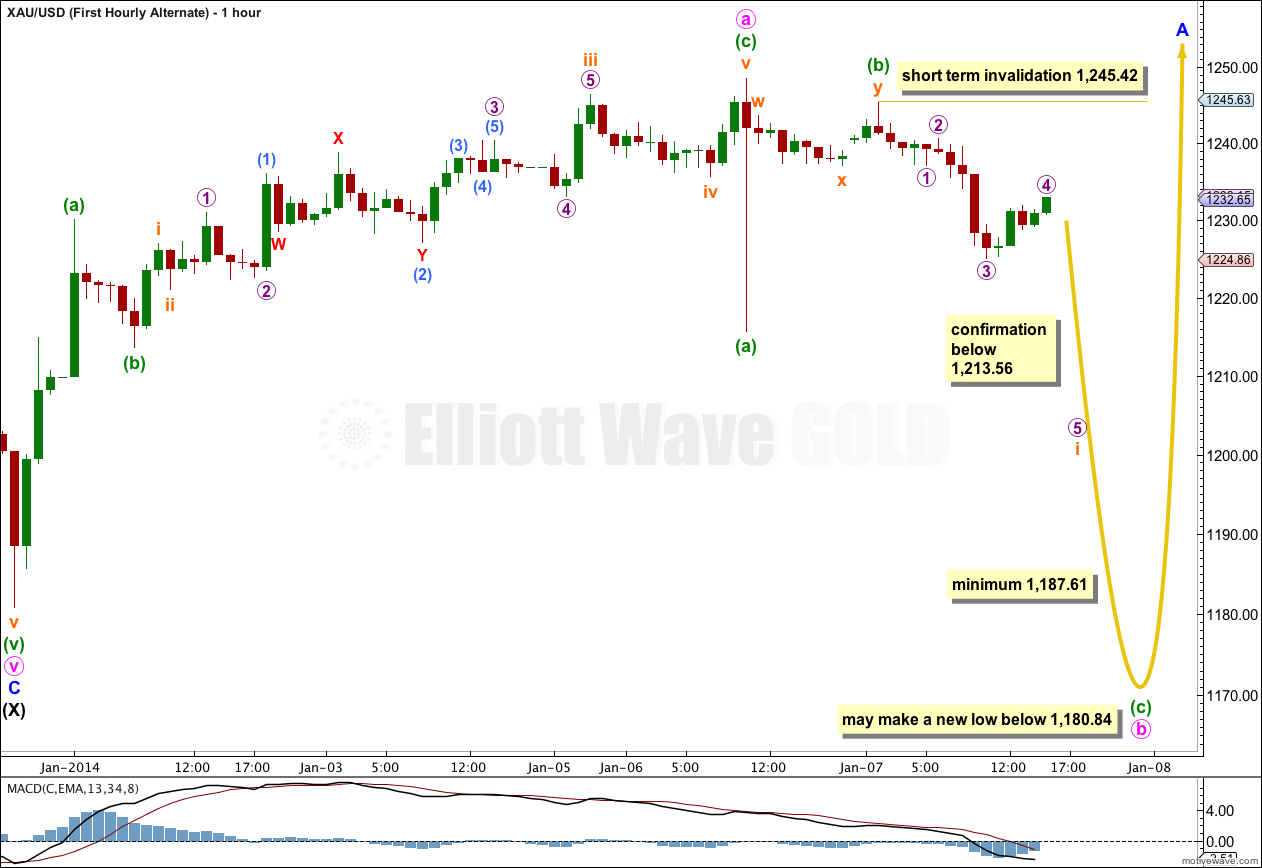
Alternate Hourly Wave Count.
If minor wave A is subdividing as a three wave structure then it may be unfolding as a flat correction. Within the flat correction minute wave a is a completed three, and minute wave b must also subdivide as a three. Within a flat correction minute wave b must retrace a minimum of 90% the length of minute wave a so must reach down to 1,187.61.
If the flat correction of minor wave A is an expanded flat then minute wave b would reach down to 1,177.46 or below. A new low below 1,180.84 is entirely possible for this wave count.
Minute wave a lasted three days. I would expect minute wave b to be a minimum duration of three days, and maybe five days. B waves are often more time consuming.
If price moves below 1,213.56 then the probability of this alternate wave count would increase.
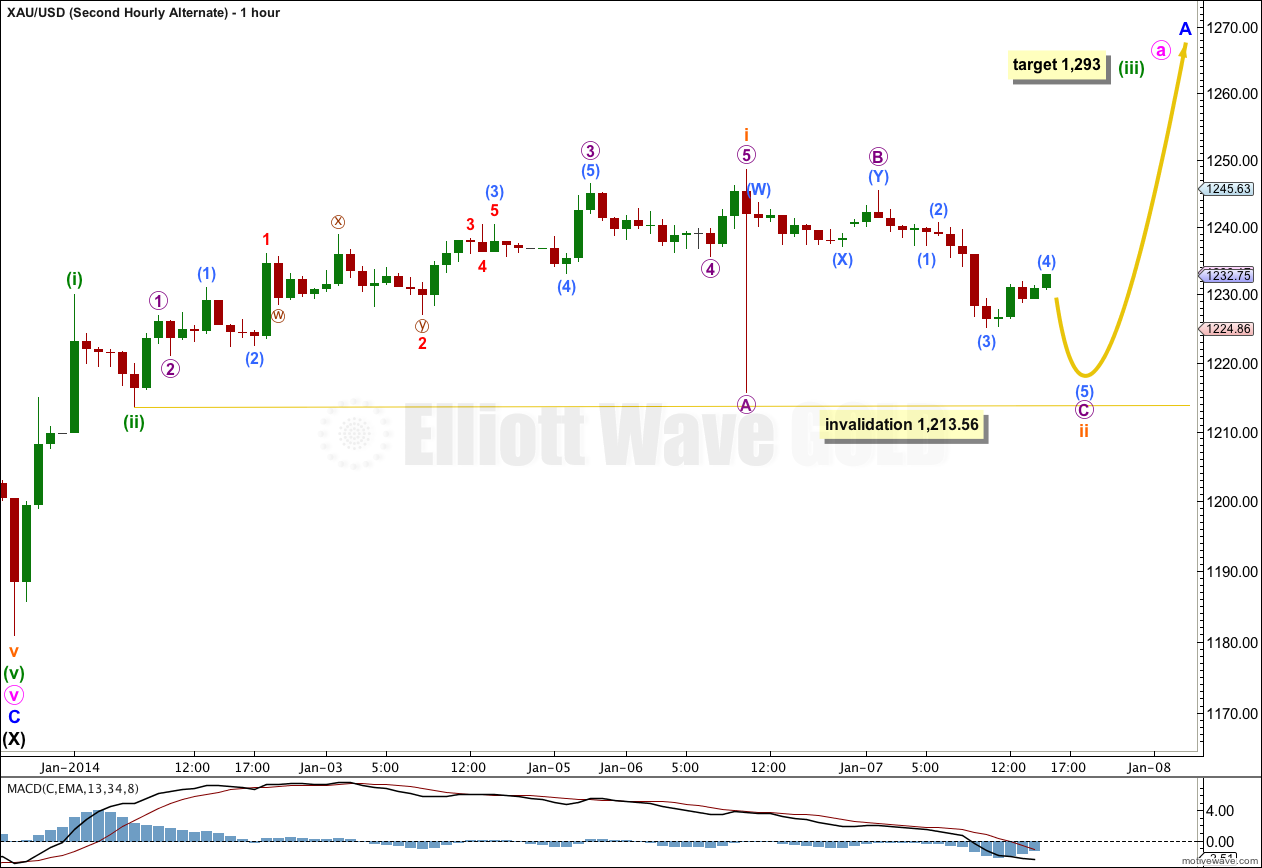
Second Alternate Hourly Wave Count.
The size of subminuette wave ii now is out of proportion to minuette wave (ii) one degree higher. This wave count no longer has the right look. It has a low probability and I expect it should be invalidated within the next 24 hours, before next analysis.
Subminuette wave ii would be incomplete. It may not move beyond the start of subminuette wave i. This wave count is invalidated with movement below 1,213.56.
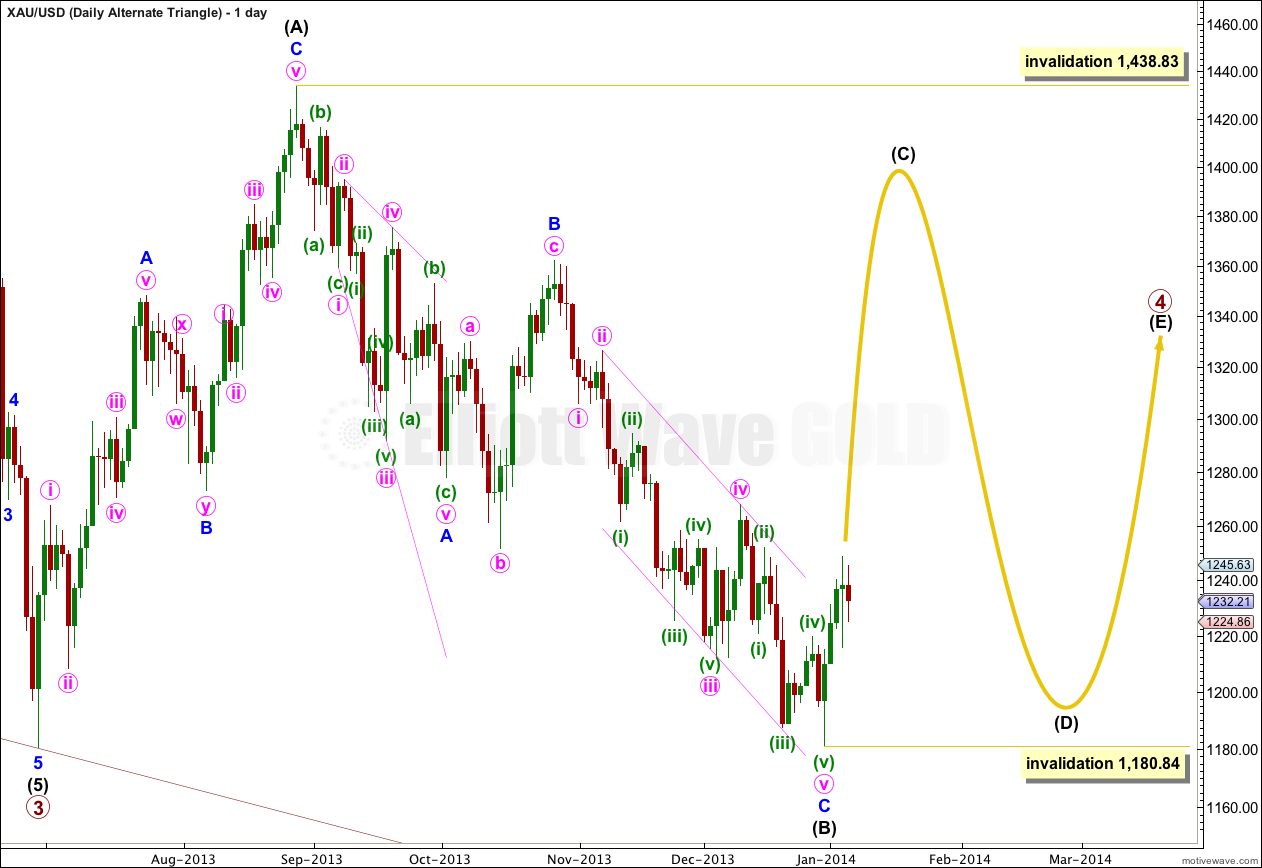
Alternate Daily Wave Count – Triangle.
It is also possible that primary wave 4 may continue as a regular contracting (or barrier) triangle.
The expected direction of this next upwards wave is the same, but for this alternate intermediate wave (C) of the triangle may not move beyond the end of intermediate wave (A). The triangle is invalidated with movement above 1,438.83.
Intermediate wave (C) must unfold as either a single or double zigzag. Within it no second wave correction, nor wave B of the zigzag, may move beyond the start of the first wave or A wave. This wave count is invalidated with movement below 1,180.84.
The final intermediate wave (E) upwards may not move above the end of intermediate wave (C) for both a contracting and barrier triangle. E waves most commonly end short of the A-C trend line.
All five subwaves of a triangle must divide into corrective structures. If this next upwards movement subdivides as a zigzag which does not make a new high above 1,438.83 then this alternate would be correct.
Triangles take up time and move price sideways. If primary wave 4 unfolds as a triangle then I would expect it to last months rather than weeks.

Hi Lara,
This is a 30min chart of Gold from my broker terminal. I suspect you are using free data like Google or Yahoo. Which is why I think I cant see a pullback from 1214 to 1198 in your data. Using my chart – what do would your reading be? I’m guessing the 2nd alternate would sport the right look.
Best,
I’m using a data feed from my broker, FXCM.
The data in that chart looks identical to the data I have? I’m not seeing any difference, and I’m not sure which piece you refer to as a pullback from 1,214 to 1,198?
From the start of X wave at 1181 the first bounce marks a high at 1214 and then pulls back to 1198. And then bounces to 1229 and pulls back to 1212. In your charts the first 1214-1198 leg seems to be missing
Thank you, I see now.
I think it may be because the data from FXCM is session only data, and your data may include after hours? That’s the only possible reason I can think of…