
Price has moved sideways in a small range for Tuesday’s session, which fits the alternate hourly wave count perfectly and will now be my main wave count which I strongly favour.
Summary: Minute wave b is very likely to be over as a triangle. The upwards breakout has just begun. I would have confidence in this idea when price moves above 1,266.42. At that stage I would expect price to continue to move higher towards either 1,295 or 1,330. As more structure unfolds I can get a clearer picture of which target is more likely.
Click on the charts below to enlarge.
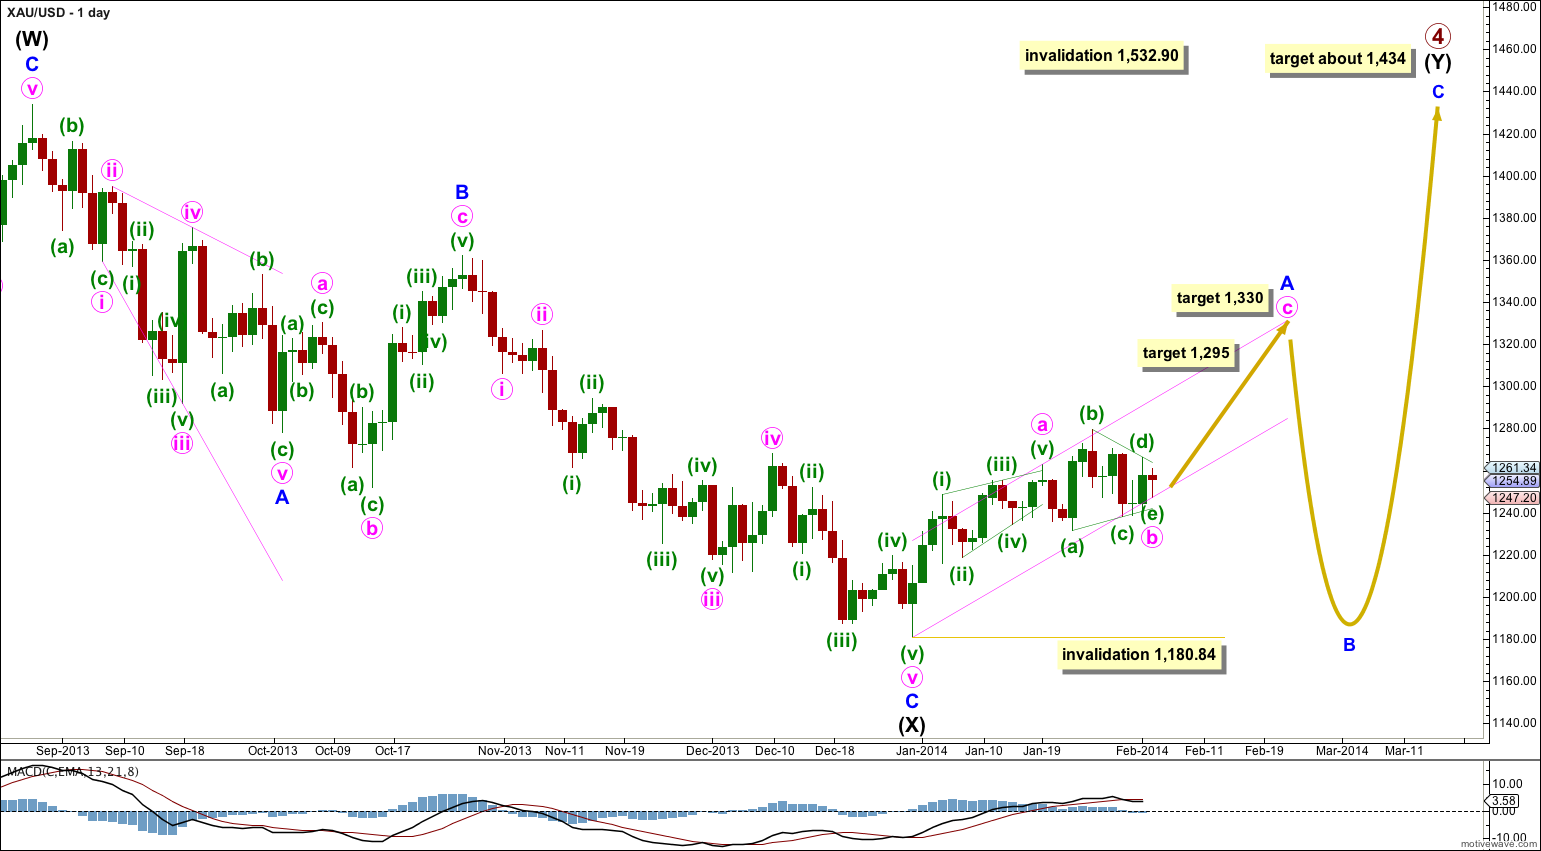
Gold is still within a large fourth wave correction at primary wave degree which is incomplete. To see a full explanation of my reasoning for expecting that primary wave 4 is not over and is continuing see this.
Movement above 1,277.97 has provided confirmation that primary wave 4 is not over. This upwards movement cannot be a fourth wave correction within primary wave 5 as it has now moved into what would be its counterpart first wave price territory. The wave down from the high labeled intermediate wave (W) to the low labeled intermediate wave (X) is now confirmed as a three wave structure. Primary wave 5 cannot subdivide as a three, it can only subdivide as a five.
Primary wave 2 was a rare running flat correction, and was a deep 68% correction of primary wave 1. In order to show alternation in structure primary wave 4 may be a zigzag, double zigzag, combination, triangle or even an expanded flat. We can rule out a zigzag because the first wave subdivides as a three. This still leaves several structural possibilities.
Primary wave 4 is most likely to be a combination or triangle in order to show structural alternation with the running flat of primary wave 2.
The downwards wave labeled intermediate wave (X) is 99% the length of the upwards wave labeled intermediate wave (W). Primary wave 4 is unlikely to be a flat correction because if it were it would be a regular flat. These have similar behaviour and a similar look to running flats, and so there would be little structural alternation between primary waves 2 and 4.
Primary wave 4 is most likely to be a combination rather than a double zigzag because of the depth of intermediate wave (X). Double combinations take up time and move price sideways, and their X waves can be very deep. Double zigzags are different because their purpose is to deepen a correction when the first zigzag does not move price deep enough, so their X waves are not normally very deep. Thus intermediate wave (Y) is most likely to be a flat correction, less likely a triangle and least likely a zigzag. It is most likely to end about the same level as intermediate wave (W) at 1,434 so that the whole structure moves sideways. It may last about 43 to 89 days, depending upon what structure it takes.
If intermediate wave (Y) is a flat correction then within it minor wave B must retrace a minimum of 90% the length of minor wave A, and it may make a new low below 1,180.84.
If intermediate wave (Y) is a flat correction then within it minor wave A must subdivide as a three wave structure. At this stage it looks like minor wave A may be unfolding as a zigzag because minute wave a within it completed as a leading diagonal which is a five wave structure.
Primary wave 4 may not move into primary wave 1 price territory. This wave count is invalidated with movement above 1,532.90.
Draw a channel about the zigzag of minor wave A: draw the first trend line from the start of minute wave a to the end of minute wave b, then place a parallel copy upon the end of minute wave a.
Main Hourly Wave Count.
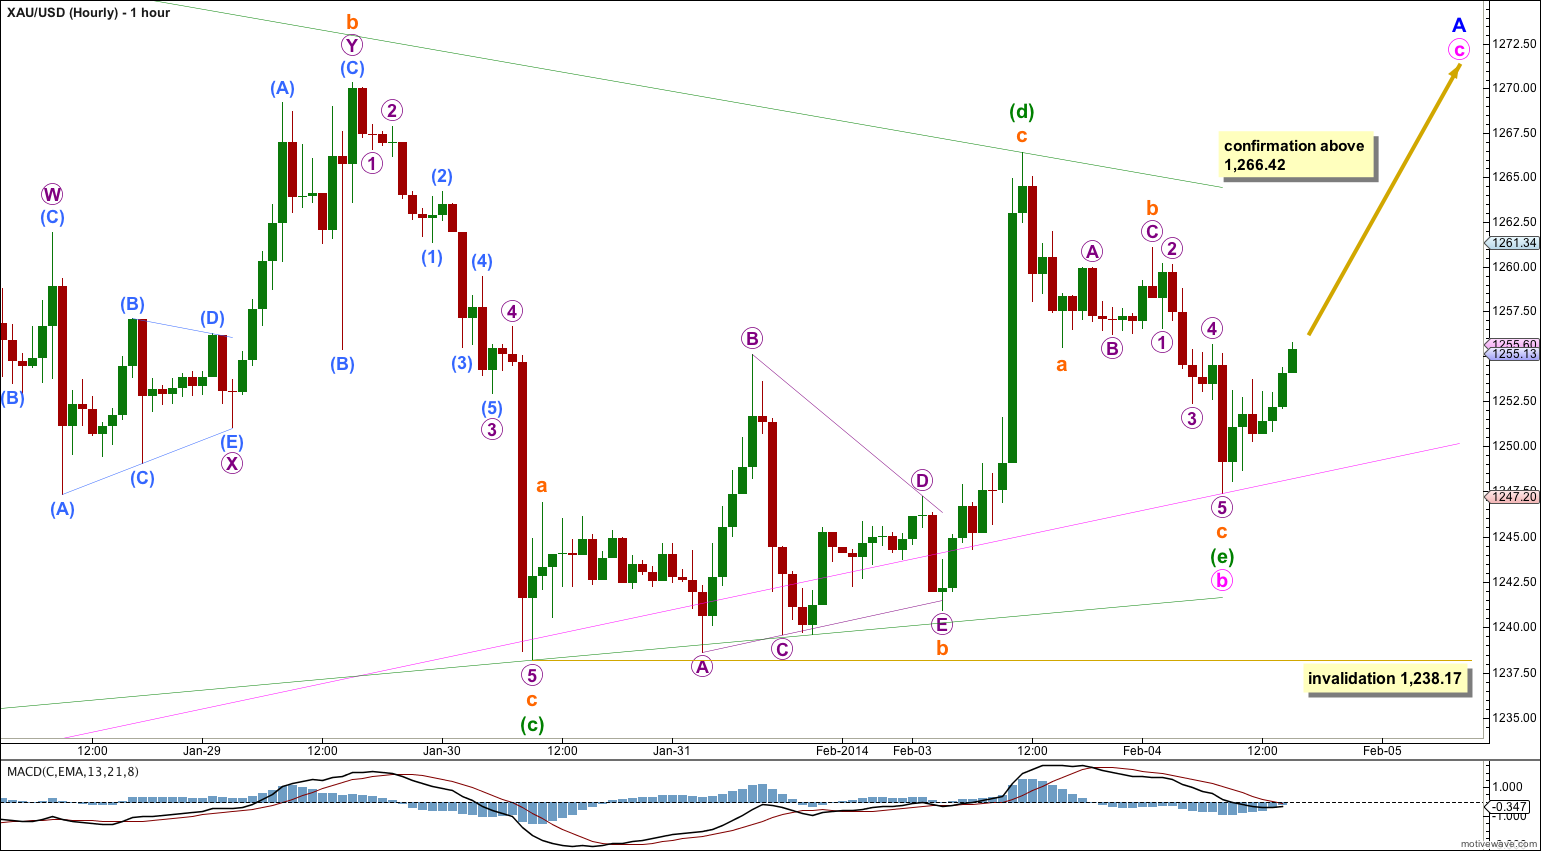
There are thirteen possible corrective structures that a B wave can take. Often it is not until the end, or just before the end, that the structure is clear. Of all the waves to analyse B waves are the most challenging.
Sideways and slightly lower movement for the last 24 hours fits this wave count perfectly. Downwards movement fits as a zigzag and the subdivisions are correct on the five minute chart. The final wave of minuette (e) may have fallen short of the lower A-C trend line which is typical. This structure fits and has a typical look.
If price breaks above 1,266.42 then I would have confidence that the triangle is complete and minute wave c upwards has begun.
At 1,295 minute wave c would be equal in length to the widest part of the triangle. It may end there.
If price keeps going upwards through the first target, or when it gets there the structure of minute wave c is incomplete, then the next target is at 1,330 where minute wave c would reach equality in length with minute wave a.
As more structure within minute wave c unfolds I will add to the target calculation at minuette wave degree, so it may change.
The channel drawn about minor wave A on the daily chart may also be a useful guide to where upwards movement may end. Minute wave c may end about the upper edge of the channel.
If minuette wave (e) continues further it may not move beyond the end of minuette wave (c). This wave count is invalidated with movement below 1,238.17.
Alternate Hourly Wave Count.
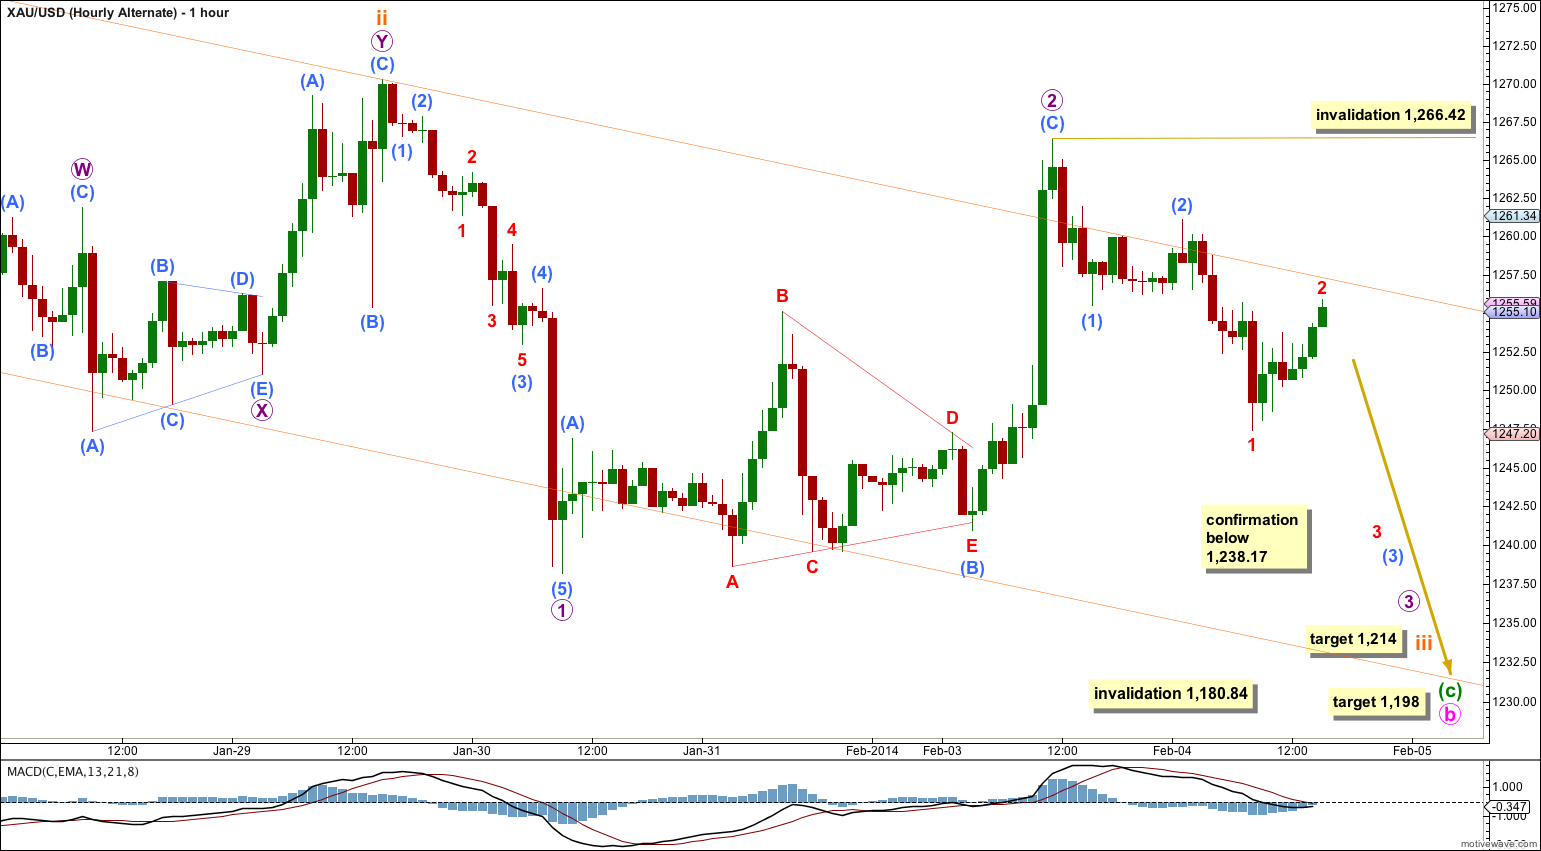
This wave count now has a very low probability. It required an increase in downwards momentum. Sideways movement simply does not fit the idea that the middle of a third wave downwards is unfolding. However, the subdivisions still fit. If price moves below 1,238.17 then I would consider this may be a viable explanation.
Targets remain the same. At 1,214 subminuette wave iii would reach 1.618 the length of subminuette wave i. This target should be met within another day or so.
At 1,198 minuette wave (c) would reach 2.618 the length of minuette wave (a). This target would be about a week away still.
Alternate Daily Wave Count – Triangle.
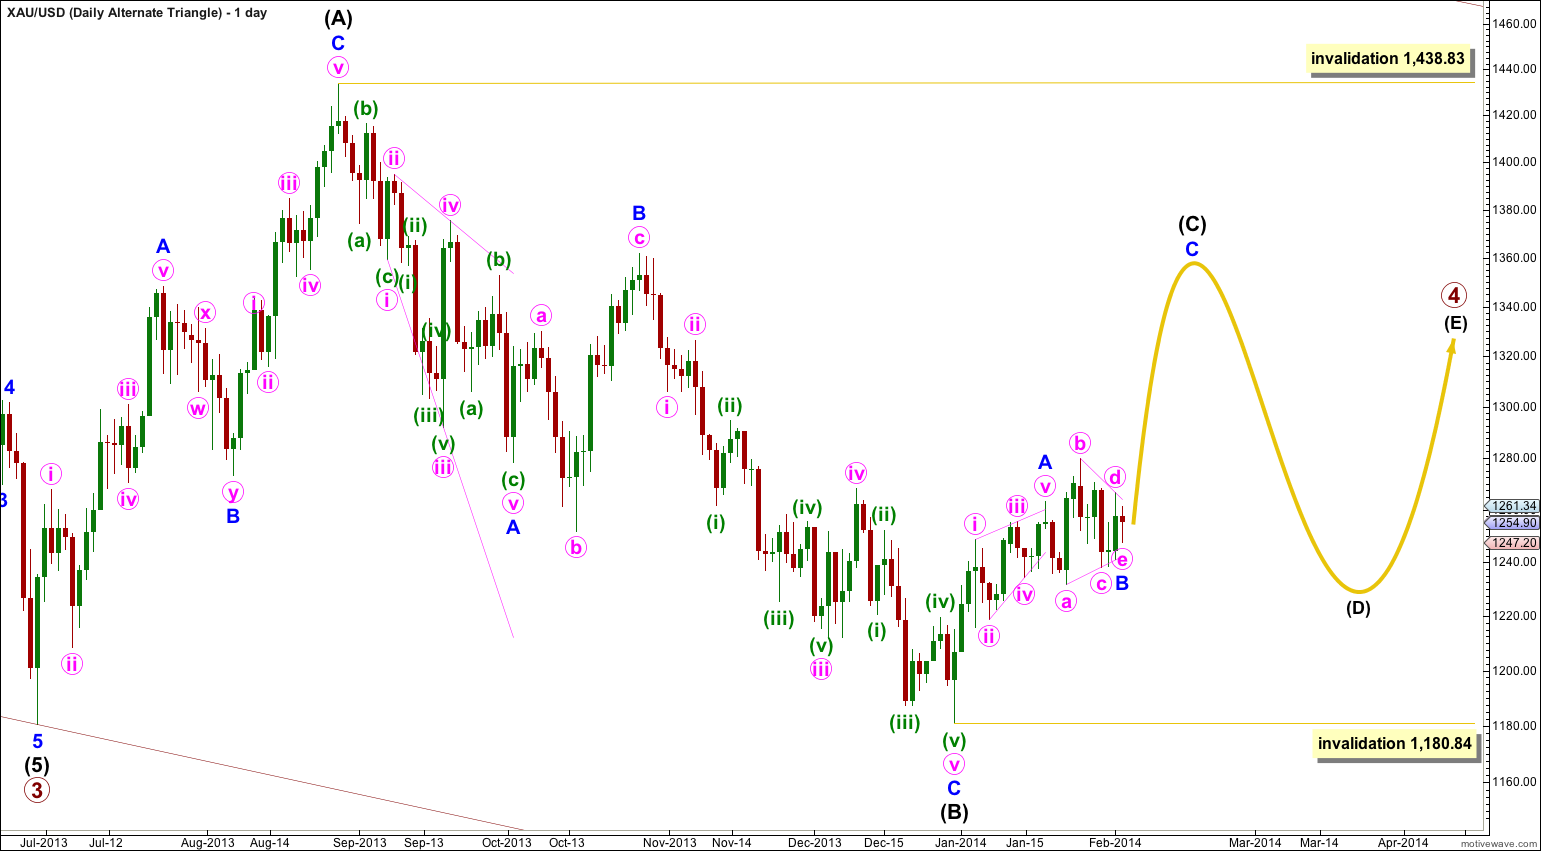
It is also possible that primary wave 4 may continue as a regular contracting (or barrier) triangle.
The expected direction of this next upwards wave is the same, but for this alternate intermediate wave (C) of the triangle may not move beyond the end of intermediate wave (A). The triangle is invalidated with movement above 1,438.83.
Intermediate wave (C) must unfold as either a single or double zigzag. Within it no second wave correction, nor wave B of the zigzag, may move beyond the start of the first wave or A wave. This wave count is invalidated with movement below 1,180.84.
The final intermediate wave (E) upwards may not move above the end of intermediate wave (C) for both a contracting and barrier triangle. E waves most commonly end short of the A-C trend line.
All five subwaves of a triangle must divide into corrective structures. If this next upwards movement subdivides as a zigzag which does not make a new high above 1,438.83 then this alternate would be correct.
Triangles take up time and move price sideways. If primary wave 4 unfolds as a triangle then I would expect it to last months rather than weeks.
Hi Lara,
Thank you for another great analysis.
Would it be possible to give another session of you labelling the graphs? I still have trouble finding enough room on the hourly charts and knowing which degrees to get rid of in order not to squeeze the screen too much, after creating one based on the daily.
Also I would be intrigued to see how you put in your yellow curves etc…
Sure.
I’ll update my NZDUSD wave count and record what I do then for you.