
Downwards movement was expected as 60% likely, which is what happened.
Summary: I expect Gold has just completed a small correction two hours ago. It is extremely likely that the next few days will see strong upwards movement with an increase in momentum and high volume. The target for the next wave up is at 1,272. Initially a new high above 1,206.49 and then a breach of the small downwards sloping channel on the hourly chart are required to confirm that this small correction is over. When that happens I will have confidence in the target. Prior to confirmation the risk exists that price could move lower, but not below 1,178.59.
Click on charts to enlarge.
Main Daily Wave Count
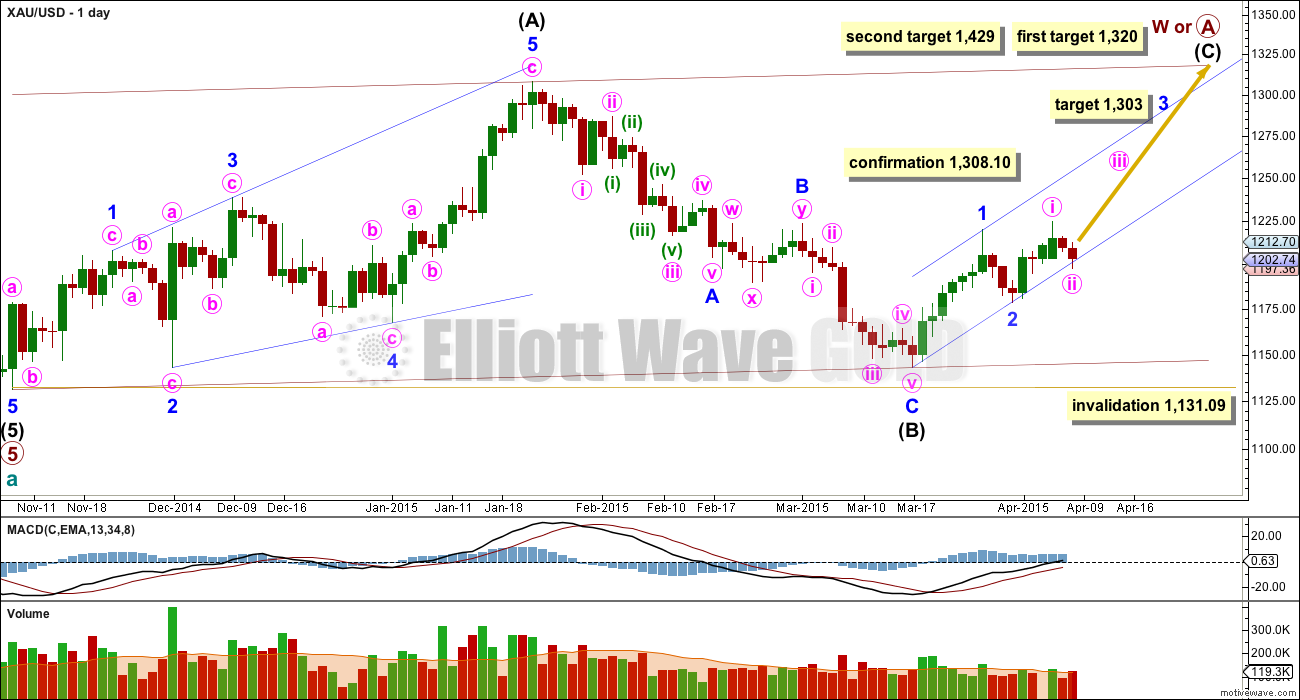
There are more than thirteen possible corrective structures that cycle wave b may take. At this stage it is unclear what degree to label this big movement. Primary wave A (or W) is an incomplete zigzag.
It is also possible that primary wave A will subdivide as a five wave impulse if cycle wave b is a big single zigzag. This idea would relabel intermediate waves (A), (B) and (C) to intermediate waves (1), (2) and (3) within primary wave A trending upwards. The length of this current upwards move labelled intermediate wave (C) on the chart will indicate if this scenario is possible.
Cycle wave b may be a flat correction where primary wave A is a zigzag. Cycle wave b may be a triangle where primary wave A is a zigzag. Cycle wave b may be a combination where primary wave W is a zigzag. Cycle wave b may be a double zigzag with the first in the double, primary wave W, incomplete.
When the big zigzag now labelled primary wave A is complete, it is also possible that cycle wave b could be over there with the degree of labelling within it moved up one degree.
When intermediate wave (C) is a complete five wave structure alternate wave counts will be required to manage the various possibilities of cycle wave b continuing.
A new high above 1,308.10 would invalidate the alternate and confirm this main wave count at primary and cycle degree.
The upwards wave labelled intermediate wave (A) fits only as a five wave structure, a leading expanding diagonal. Within a leading diagonal the first, third and fifth waves are most commonly zigzags, and the fourth wave should overlap first wave price territory.
Because intermediate wave (A) subdivides as a five, intermediate wave (B) may not move beyond its start below 1,131.09.
At 1,320 intermediate wave (C) would reach equality in length with intermediate wave (A). If price keeps rising through this first target, or if when it gets there the structure is incomplete, then I would use the second target. At 1,429 intermediate wave (C) would reach 1.618 the length of intermediate wave (A).
Because intermediate wave (A) is a diagonal then it is highly likely intermediate wave (C) will be an impulse in order to exhibit alternation. Intermediate wave (C) may end about the upper edge of the channel drawn about primary wave A.
This wave count sill has problems of structure within primary wave 5 of cycle wave a:
– within primary wave 5 intermediate wave (2) is a running flat with its C wave looking like a three and not a five.
– within intermediate wave (5) the count is seven which is corrective; either minor wave 3 or 5 will look like a three wave structure on the daily chart where they should be fives.
It is for these reasons that I will retain the alternate until price confirms finally which wave count is correct and which is invalidated.
Volume for Wednesday’s session is slightly up which would be expected at the end of a correction, but it is still lower than the prior upwards day which ended minute wave i. This fits perfectly with this wave count. If the last two days are a correction and not the start of a new trend then volume should be lower.
Minor wave 1 lasted seven days (no Fibonacci number) and minor wave 2 lasted a Fibonacci three days. If minor wave 3 exhibits a Fibonacci duration it may last thirteen days, which would see it end in seven more sessions (depends on how long the corrections within it last).
At 1,303 minor wave 3 would reach 1.618 the length of minor wave 1.
Draw a base channel about minor waves 1 and 2 as shown. Minor wave 3 may have the power to break through resistance at the upper edge of the blue channel. Today, downwards movement is finding support just below the blue channel, because it is unusual for a lower degree second wave correction to breach a base channel drawn about a first and second wave one or more degrees higher this lower trend line should provide very strong support. This is where the middle of a third wave up should begin.
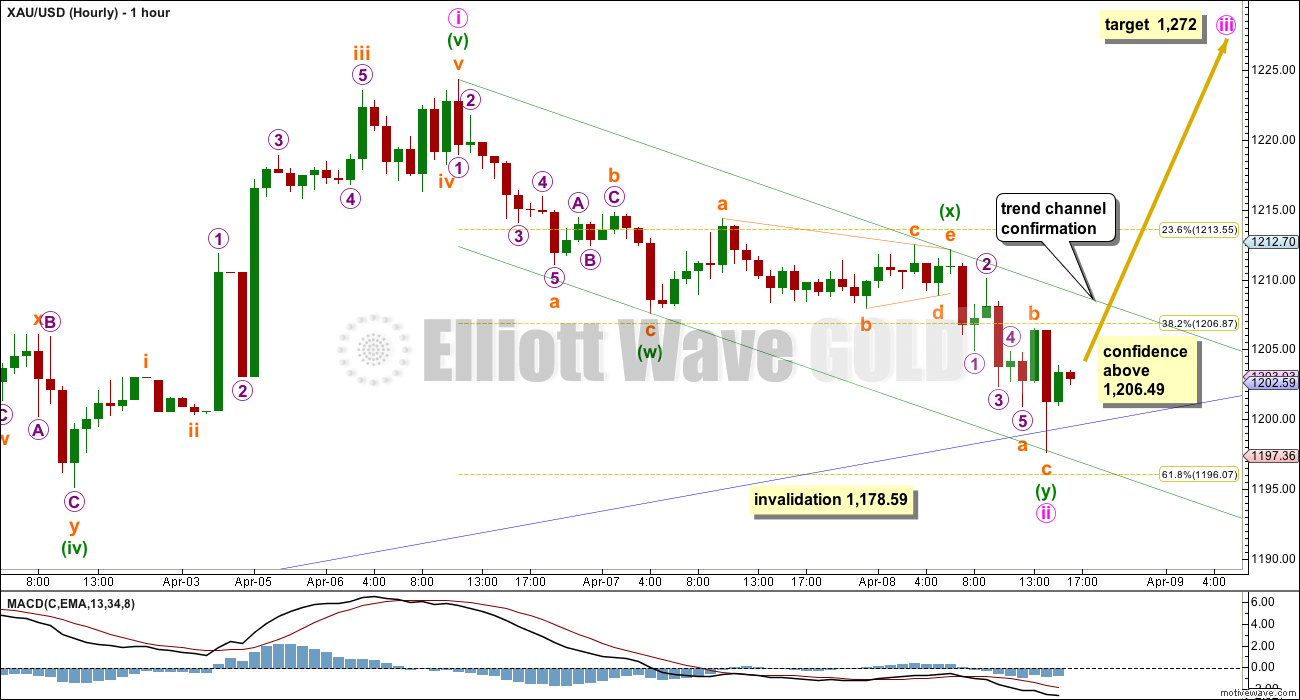
The base channel copied over to the hourly chart shows an overshoot but not yet a breach. At this stage with only an overshoot the wave count looks like it is highly likely minute wave ii is over here and minute wave iii has just begun.
Minute wave ii subdivides perfectly as a double zigzag. The first zigzag in the double reached only to about the 0.382 Fibonacci ratio, so the second zigzag in the double was necessary to deepen the correction to the 0.618 Fibonacci ratio. Minuette wave (x) subdivides perfectly as a regular contracting triangle which fits the purpose of a shallow X wave nicely. This is supported by MACD hovering just below zero and flat while the triangle unfolded.
The second zigzag in the double is a perfectly complete zigzag.
Draw a best fit channel about minute wave ii: draw the first trend line from the start of minute wave ii to the end of minuette wave (x), then place a parallel copy on the end of minuette wave (w). Minuette wave (y) ends perfectly on the lower trend line.
There is not enough upwards movement at this stage to confirm that minute wave ii is over. The risk exists that it could continue lower. It is possible that within minuette wave (y) subminuette wave c is not over and will continue. A new high above the start of subminuette wave c at 1,206.49 could not be a second wave correction within subminuette wave c, and so at that stage I would have confidence that subminuette wave c would be over and minute wave ii would be extremely likely to be over. At that stage I would have enough confidence to move the invalidation point up to the end of minute wave ii at 1,197.63.
While we have no confirmation that minute wave ii is over the invalidation point must remain at 1,178.59. Minute wave ii may not move beyond the start of minute wave i.
A clear breach of the green best fit channel about minute wave ii would provide further confidence in a trend change.
Depending upon your risk appetite you may want to use one or both of these tools before you have confidence in this wave count and the target. While we have no confirmation of this trend change the risk exists that price could move lower to 1,178.59 but not below.
Alternate Daily Wave Count
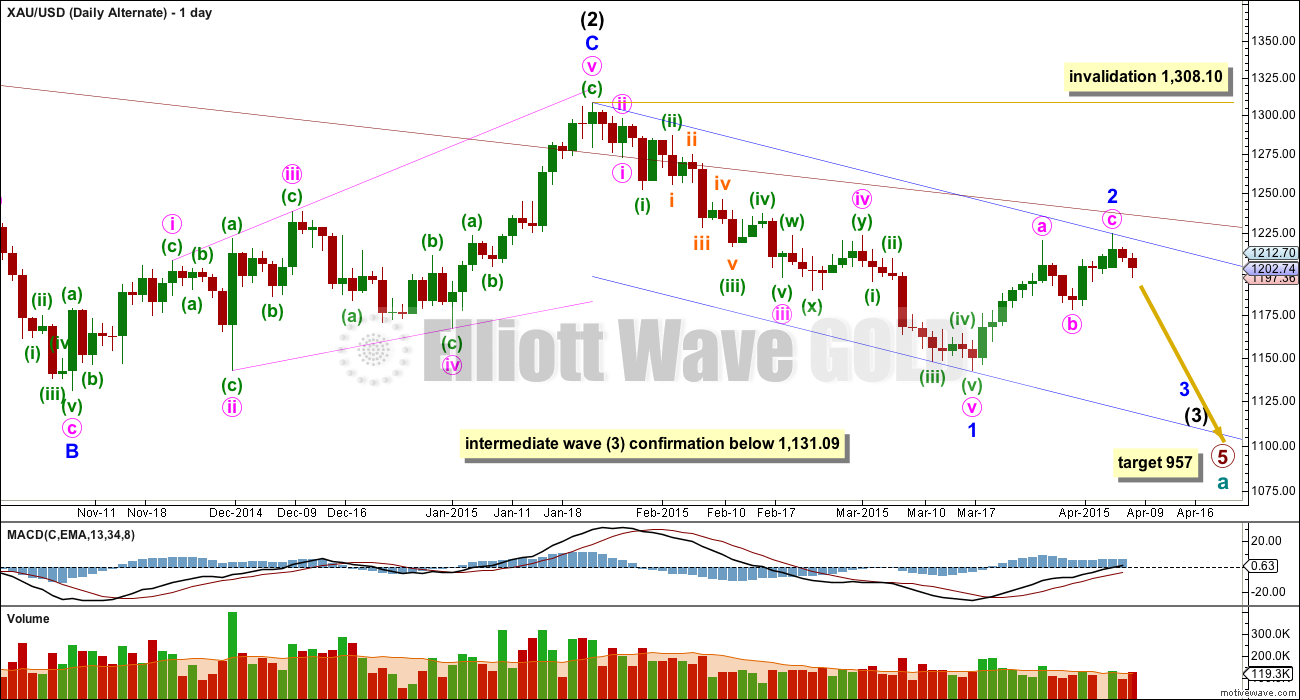
This alternate wave count sees Gold as still within a primary degree downwards trend, and within primary wave 5 intermediate wave (3) has begun.
At 957 primary wave 5 would reach equality in length with primary wave 1. Primary wave 5 may last a total Fibonacci 55 weeks. It is now in its 39th week.
The maroon channel about cycle wave a from the weekly chart is now breached by a few daily candlesticks and one weekly candlestick. If cycle wave a is incomplete this channel should not be breached. The breach of this channel was the first warning this wave count may be wrong.
This wave count still has a better fit in terms of better Fibonacci ratios, better subdivisions and more common structures within primary wave 5, in comparison to the main wave count above.
Within intermediate wave (3) minor wave 1 is a long extension. Within minor wave 1 minute waves iv and ii are grossly disproportionate, with minute wave iv more than 13 times the duration of minute wave i. This also reduces the probability of this wave count.
Although the invalidation point is at 1,308.10, this alternate wave count should be discarded long before that price point is reached. If the maroon channel is breached again by one full daily candlestick above it and not touching it then I would discard this alternate wave count.
A new low below 1,131.09 would confirm that intermediate wave (3) down is underway.
Minor wave 2 would now be a completed zigzag. If this alternate is correct it should show itself this week. It now expects a big increase in downwards momentum as a third wave at two degrees begins to gather momentum. An increase in volume as price moves lower would support this wave count. A new low below 1,178.59 would be a strong indication this wave count may be correct.
Volume over the last 14 days is lower for down days and higher for up days. Volume is strongly indicating the current trend is up, which does not support this wave count.
This alternate wave count remains technically possible. Because the implications are important I will continue to publish it at this stage.
This analysis is published about 04:39 p.m. EST.
Okay, I’ve finally had the “aha” moment. That took a while, and I had to go out first thing this morning.
I think minor wave 2 is continuing as an expanded flat, that will be my main wave count. The target for more downwards movement would be at least just below 1,178.59, maybe to 1,157.
My alternate wave count will continue with the idea that minor wave 2 was over and now minute wave ii within minor wave 3 is completing. The base channel is breached so that reduces in probability, but it’s still viable.
The price point to differentiate the two is 1,178.59.
Off to write that up now. My apologies for the late analysis today.
The target is changed from 1,157 to 1,172. That looks more likely.
Thanks for the posts. Always good to get an update while we wait for the full analysis.
Yes Lara thanks for the quick helpful posts.
I’m glad I sold my gold ETF already today.
Now I can trade going down.
But you said below they’re oversold..
I bought a little silver futures @16.17 + 16.18
This might turn up on friday….. or not.
silver: oversold
http://bit.ly/18EkAhr
gold: almost oversold
http://bit.ly/1CAfs5w
US dollar , oil, gold : correlation:
http://bit.ly/1CAfs5y
9 Apr, 06:00 PM
I’m not seeing an obvious correlation between USD and Gold. If there is one it’s pretty rough.
I see a current correlation between USD and USOil, but it doesn’t seem to have been persistent for the first 2/3 of the chart.
Lara, there is inverse correlation between the US 10-yr yield and the gold price.
Lara look at Wednesday 2 pm and you will see gold or /GC head down and US dollar or /DXY head up.
Look as last few Wednesday FED 2 pm news releases. Also look at March 18th and they are instantly inverse and fast and furious.
Richard, yes, there are short term timeframes and even longer timeframes where gold has a strong inverse correlation with gold, but overall, the correlation is not consistent. Lara has proven that she can provide accurate EW analysis without concerning the USD. Also, look at Oil. Lara was calling for a strong downtrend last July before the USD started it’s strong up trend.
http://elliottwavegold.com/2014/07/us-oil-elliott-wave-technical-analysis-15th-july-2014-2/
What does oversold mean, going further south or correcting north?
It implies that the direction will change, but unless you are investing longer-term, it’s not very practical because in the short-term it can get more oversold.
Gold Falls Again On Greenback Strength
April 9, 2015 – 4:27pm by Gary Wagner
http://thegoldforecast.com/video/gold-falls-again-greenback-strength
Basic GDX structure looks bullish and constructive. Sometimes charts are best viewed from 10 feet away. The bullish flags and basing are key markers for a big move up shortly in my view.
Crows set a bull trap. 3 black crows.
Still net short. See me charts 4-5 hrs ago
Still think the ALT looks better here but there needs to be a powerful downdraft to ‘kick it off’ The action of the past few days is good but a nice 20 point gap down over night would make things more clear. Perhaps tomorrow will be our lucky day
Lara, is it possible that minor 2 is continuing as a flat?
Good question , been waiting to ask it .
That is what I thought about as well. Looking at silver made me play with this idea.
It’s nice you repeat the same question I just asked 15 min below.
I don’t think so, because you’d have to see the upwards wave which I have minute wave i as a zigzag. It subdivides absolutely perfectly as an impulse.
And when I went into the hourly chart and checked the subdivisions…. particularly that wave down… it now has a nice fit. Finally. The “aha” moment happened this morning. Yep. I think it’s an expanded flat. Target 1,172.
The one thing that’s concerning that Lara has not mentioned is minute i looks like a 3 on the daily chart. I just noticed this. Is Minor 2 still ongoing as a flat and will end near $1175? It would be on it’s 10th day meaning it could last another 2-4 days?
I have been wondering about that since minute i ended .
11 days incl Apr 6, when both Shanghai and Tokyo Gold were open and up. Shanghai is largest gold exchange of all
There is a minor turn window tomorrow, and as I stated last week, twice, I expected a Monday high, then 3 full days down lower and after that a turn higher. We’ll see.
The good news for bulls is that gold rose in terms of EUR and some other FX, but gold must rise in terms of all currencies to be truly bullish.
Yeah, it does. But on the hourly chart it looks very strongly like a five.
Waves just don’t always look the same in different time frames.
I’m going to try the idea that minor 2 is continuing as an expanded flat and see how the subdivisions fit.
Lara
It appears that a strong US dollar is stalling the start of minute wave 3.
Since Wednesday afternoon and also 8 am today the US dollar went up and gold went down when expected to rally.
Is it possible to get an Elliott Wave on the US dollar to assist us with seeing turning points in the US dollar so more probability that our gold trades will be successful?
Gold as gone down instead of up due to a increase in the US Dollar since 2 pm Wednesday FED FOMC minutes releases about possible US interest rate hike in June. I follow the US dollar index $DXY and gold /GC together on the same chart and gold goes the opposite way the US dollar goes, it is clear when I see them together on one chart.
Here is a live real time chart on US dollar index.
You can see that since 8 am today the US dollar got stronger, which stalled gold’s minute wave iii
http://www.investing.com/quotes/us-dollar-index-streaming-chart
I don’t have enough data for USD and I don’t have a wave count for it.
forget the bull and the bear
Right.
And you just gave me faith in my new diet! lol
I’m still bullish. Here’s the NUGT 15-min chart and I will post the GLD hourly which looks like it just needs more time sideways to get STO back up and channel.
GLD chart.
And lastly, here’s my take on the GDX hourly if Lara’s main wave count is still maintained. This is the camp I am currently still in.
Great GDX chart. Please keep them coming.
Follow-up from below. Wedge pattern on small t/f. Added few longs @1193.xx
I dont know if it moves inverse to gold but it is one of many economic indicator the FMOC said they would use to gauge the headwinds. look back to the rate on 03/06/2015
Indeed there has been a very strong negative correlation between the 10-yr yield and the gold price.
EW theory says you must ignore correlations, LOL. In my experience, that’s rubbish. Witness both silver and yields.
Lara , minute ii is taking as long or longer than minor 2 . Look of the waves is similar as well . In addition , we are below the daily trendline which is also the ew trendline . If we are still bullish on the weekly timeframe , do you see any other bullish count on the daily or hourly timeframe that can overcome these issues ?
I’m working on it. That trend line breach is a really big concern, but then base channels don’t always work perfectly. That is the problem with probability. Almost always means you should expect the market to do what it almost always does, and when it doesn’t the probability is so low but still exists that its one of those times which are an exception.
Ugh. Not a good morning. May need more coffee 🙁
30yr yields up today +++
does anyone have the hourly wave count?
strong line of resistance so far.
broke down from there!
3rd. time testing the mid 1193.6
The Swiss franc is significantly overvalued and while it is expected to weaken over time, until it does, this substantial – and above all abrupt – appreciation of the currency will present considerable challenges…My colleagues on the Governing Board and I have great respect for the business community whose task it will be to make these difficult adjustments.” – Fritz Zurbrügg, Member of the Governing Board, Swiss National Bank (SNB) in “After the minimum exchange rate: new monetary policy challenges”, a speech delivered at the SNB’s Money Market Event in Zurich, March 26, 2015
http://monetary-metals.com/the-swiss-franc-will-collapse/
Good read but not an easy one; it’s for your inner dweeb.
Gold may have just broke out of intraday consolidation. http://bit.ly/1Fr96Y9
Mark you may be right, however I’m going to be cautious and wait for both above 1,206.49 and trend channel breach confirmations before going bullish in gold. If I knew the US dollars was peaking in EW 5th wave I’d buy back in now. Until then I’ll wait for solid trend proof.
“Depending upon your risk appetite you may want to use one or both of these tools before you have confidence in this wave count and the target. While we have no confirmation of this trend change the risk exists that price could move lower to 1,178.59 but not below.”
Sounds prudent. If you’re already long, you can add a short of equal amount, then punt one when you’re confident of direction. Straddling like this can also be tax-advantageous. Remember it’s what you keep after tax that counts.
My best guess is that Minute 2 is not complete yet. It is still playing out, and at current analysis could bottom at 1188-1189.
My trade philosophy is never to go in a lot at the market top or bottom. Who knows the wave count may be wrong. The safer play is to go all in at the beginning of the third wave. You earn less but the insurance is worth it. Additionally, third waves have strong momentum which makes it easier to trade.
Yep. Below 1188 is more bearish, as I posted here two days ago (to chapstick), and again 2 hours ago with my Chart – plus other issues
thumb up
I think that 3 hour consolidation today was a 4-th wave triangle and we are now in the 5-th wave (down) which could be short and quick.
If
I were to invest without the fear of financial instability and keep in mind I
base this on the current facts as we sit here today. The EU (QE) started first
round, just as the US has ended. This has the FMOC worried it will strengthen the
dollar which is affecting domestic exports so they think an interest rate
increase will slow the dollar down Throw in the fact we have just entered an earning
and election cycle, Iran peace outlook is on the up, Greek debt restructured. To
me it looks like a completely different climate than it did in January. The geo
political and economic outlook favor an interest rate hike right around the
date with which 957 primary wave 5 would reach equality
in length with primary wave 1. Primary wave 5 may last total Fibonacci 55 weeks.
It is now beginning its 39th week, plus or minus 2 weeks. Translation: Interest rate hike sometime in June July also correlates
with the ALT bottom. Any thoughts?
Sorry I pasted from my word diary.
Prospector I would agree with your “Interest rate hike sometime in June July also correlates with the ALT bottom.”
Gold has been very close to swinging from main daily to alternate daily for months. A confirmed rate increase in June I believe would rocket up the US dollar and doom any gold rally and send gold deep enough to confirm the alternate daily. Lara thinks 957 may be 16 weeks away so may be beginning of August for 957 if June interest rate hike becomes front page news as going to be a reality and happen.
There’ll be no hike in june. I’ve been doing this since 2007, and fed only talks,never acts. No hike since 2006, can’t-do as western govt are all broke. They’ve promised & borrowed way more than they can possibly ever repay. The collapse will be epic.
8 years ago the pendulum was swinging the other way and the FMOC was using outdated data analysis. Today revising the numbers to account for weather and port strike related lags may prompt the fed to act sooner than later.
Hmm, maybe. But I don’t know if the conditions will ever be in a better set-up to announce an imminent hike than they were in March, when markets expected it and instead the Fed back-pedaled.
As for Fed models, they are broken as their forecasts are always wrong. And their “data-driven” decision-making is BS because the Fed keeps changing their data target for a hike.
Central bankers are academics, not traders, so they don’t understand markets. How can they when they never traded a day in their life, lol. Exception is China, whose CB staff is full of traders that worked the trading desks of leading investment banks in the west. China will be the financial capital of the world after 2030, and the rest won’t matter much anymore. My two-cents.
I concur, except that I give the Fed credit for the ability to read the markets. I think the real story is that they are not independent but are politically suppressed as well as being beholden to the big banks and financial institutions. They must do their masters’ bidding, or else!
I dont think they can read markets. They are just government employee-hacks. They couldn’t trade their way thru a perfect set-up. Greenspan said stocks were “irrationally exuberant” when the Dow made 6000. Weeks before the 2008 crash, Bernanke said the subprime crisis was over and couldn’t possibly spread. Every year since, their growth targets are wrong. Trichet was hiking at the EBC as europe was going into recession. And the list goes on.
Sad to say but Globalists Banksters own the monopoly board and just change the rules as they like–logic, data and reality no longer apply–unless they benefit the Banksters.
I often wonder why so many traders get so besotted with the Fed. The reality is that America incurred and is still incurring a humongous debt. The interest payment alone is staggering. The more they raise rates, the more they cannot afford to pay the interest. If not for the fact that the US dollar is the world’s reserve currency, they would have been bankrupt long ago. The printing of money (or its equivalent to keep the velocity of money moving) is tantamount to rendering indefinite life support. Well, this cannot go on forever, Sooner or later, some country will challenge the US for currency supremacy. China may be able to do it, what with inking treaties with countries to make trade payment bypassing the US dollar as well as the setting up of a world bank to challenge the IMF. Saudi Arabia may remove the petrodollar soon as they feel that America has reneged on the deal forged by Henry Kissinger. This can be exacerbated by the US setting up a deal with Iran vis-a-vis nuclear power which will further erode Arabia’s energy revenues.
But, the Fed must be seen to be doing something in order to hoodwink people into buying US dollars. That’s why they double-speak about rate hikes. They cannot, and certainly will not, raise rates, at most only by a token amount with plenty of provisos and caveats. Sooner or later, the people will wise up, and then the balloon will burst. You can’t keep crying wolf ad infinitum and hope to get away every time.
“I often wonder why so many traders get so besotted with the Fed”
Cycles. This is the golden age of central bankers. It never used to be this way. Sad. Like central planning, this doesn’t work. And like all other big central planning previously, this shall lose all credibility and its time will pass… On with the cycle…
When the Federal Reserve ended the central bank’s bond-buying program, I would love to know is buying US debt. I can’t imagine who sees it as a good investment?
great discussion, I am in alignment with Richard here and Tham. But please forgive my ignorance — what is the 957 — to what are you referring? Thanks.
Also, thanks for posting Kimble’s perspective above. Love that Kimble.
$957 is the gold lower target for the alternate daily wave count in 16 weeks if gold breaks below 1,131.09
LOL. I thought he was referring to some ominous worldly economic concept I had been missing all this time! thanks
Yes the secret is that $957 is the hidden conspiracy code against gold bulls. LOL
Still holding some prime gold shorts ~1220 and silver which leads the way. Shorts favoured but added a long @1195 as a hedge.
1) Big HnS potentially drawing out below. Neckline is at that comex gold gap of 1151-60 that I’ve warned about… below that targets 980 by rule, yee-haw
2) Rect PF shark. Upper pf rx @1203 held and shows likely target of 1182-78 if the 78.6% at 1188 fails to hold (not shown) and the upwards TL (chart 3) breaks.
Gold could challenge the 1240-50 rx zone (not shown) without invalidating the bear case, but a move over 1250 with momentum would favour an alt bullish case in which the upper TL drawn from 2013 (chart 1) will be tested.
Yes, I agree and will remain a gold bear until there is a clear break up and over the 1240-50 zone. An intraday move into the 1250s would still be acceptable. I’m still scratching my head why so many are bullish right now. Gold held the 1130-40 support area only once and bounced up for a few days. Big deal! I think traders need to look at a weekly chart again for a wake-up call. Gold is clearly still in a bear market.
However it goes, the final low is NOT in yet
If you have a stockcharts membership, you will be able to see my mark up of the NUGT 15-min chart. It looks really good here (bullish). http://scharts.co/1CYUkcF
I will try to post an image file shortly so everyone can see. I cant do it from where I am right now.
It does look solid.
Wed 1:57 pm $DXY was .97803 now $DXY at 11:05 is at 98.868 up 1.065%
Wed 1:57 pm Gold was 1,206.26 now gold at 11:05 is 1,195.04 down 11.24 down .93%
If possible on your trading platform, go under studies/indicators and add compare with $DXY to your gold chart and WOW, no denying the inverse $DXY versus /GC gold. Since Wednesday 2 pm gold struggles as US dollar rises. I even checked weekly and you can see the inverse effect going back to 2012 where my chart ended. I want gold to rally, just see that being in jeopardy until US dollar weakens somehow. When is the next big US event that might drop the US dollar and get gold to rally?
Thanks for the heads up on the gold/dollar relationship. I didn’t realize that it had become so strong.
Thanks Scott. I’m glad to help myself and the other traders here.
This week’s FED minutes made me really wake up to making sure I invest more wisely in gold to ensure more profits.
Perhaps there is someway Elliott Wave could be used for both the US dollar and gold so our gold trading is more accurate. I honestly think doing that may reward all of us. Perhaps Lara could clarify that possibility.
If anyone knows how I’m interested in that higher degree of accuracy as offers less risk and more opportunity to invest in confidence for more profits.
Does anyone know how to do an Elliott Wave combination for gold and US dollar or dollar index or do them separately and look at both so we can see where better gold trading opportunities are?
I agree…if it goes over 99.30 it may keep going.
Everyone is watching the dollar now.
On the UUP chart, you can see a gap left over from March 19th. It appears that gap is just about filled now. A drop down in USD soon from here would make sense.
I agree…however, if it goes over 99.30 it may keep going..
To fill the gap is it based on the closing price of the 19th or the low of the day?
Intraday fills the gap.
Thanks
I’m not sure if this link will work, but on the 5-min charts, it appears that gold broke DT resistance at 5:30am and now has backtested the breakout which also forms a double bottom. Gold really needs to move up from here to maintain the bullish structure in my view.
http://bit.ly/1FqOf7d
Gold cycle week of March 5th
Some blogger notes:
Next week, Gold’s 6 month Intermediate Cycle (IC) enters the Timing
Band for an Intermediate Cycle LOW. Next week is number 22 since the
early Nov 2014 IC LOW (Ave timing band is 22-26 weeks).
So is the IC LOW in and have we started a new Intermediate Cycle? We
can’t say just yet for sure but the late stage action of this 6 month
IC has been out of the norm compared to other IC’s during the Bear. The
LOW so far for this IC was on March 17th which was only week 19. So,
the Cycle possibilities provide for 2 possible options:
1) an IC LOW over the next 1-4 weeks based on normal cycle Timing Bands or
2) that the IC LOW was on March 17th (much shorter than ave Timing
Band) and we have already started a new IC. Sorry that I can’t be more
definitive but no TA methodology is bulletproof.
The first confirmation of a new IC will be for Gold to move above
1224.
That said, we have not seen the kind of volume that typically marks the capitulation of an IC LOW.
Based on his Gann Cycle work, Sir Norvast has LOW dates for Gold between Apr 6 and 14th.
From Martin Armstrong, the last read that I have from his posts and
Lady Athena is that the week of Apr 6 is a Direction Change for at least
a week (3 week trend has been up, so does this mean down?)
BTW, MA had identified March 17 as the last Trend Change for Gold which has been spot on so far.
Yes March 17th last trend change as March 18th was the day Janet Yellen made the US dollar have it’s biggest daily drop since 2013. Then Gold took off for 8 days of green candlesticks.
Dollar Drop Is Worst Since 2011 as Investors Rethink Fed Policy
http://www.bloomberg.com/news/articles/2015-03-21/dollar-drop-is-worst-since-2011-as-investors-rethink-fed-policy
April 8th Wednesday’s FED FOMC minutes did the reverse it pumped up the US dollar about possible June interest rate hike and down goes gold who who knows how long? I won’t fight that trend by trying to be bullish in gold. JDST is already up over 4% today.
Will it test the channel again?
I sold my GDX at 9:31 down 9 cents over when bought it yesterday. Still made profits last two days. I have no shares. Not looking good, something is wrong. US dollar is too strong since FED FOMC and knocks gold down too much when gold supposed to be bullish. Yeah, I know not supposed to effect it. I said that for 2 years until saw proof myself last few months and how it throws forecasts around. The US Dollar and gold inverse might change in the future, but not doing it yet.
JDST anyone?
Something is not right here.
Market Vectors Global Junior Gold Miners Index
Volume is grossly larger in DUST over GLD, considering the average on these ETFs
Greece just made loan payment to EU.
did they use funny money?
Does gold do better when vix is up?
Markets sound like they are gearing up for a strong day all around. would they move out of gold for better prospects?
Good morning!
Good morning!
good morning – though i think i’m going back to bed.
Can some one post a Lara’s 1 hour current chart with the green TL?
Thanks.
Nice 5 wave up from 1192 to 1202 on the 10 minute chart.
Yes, but already retraced more than 61.8%. I’m stumped right now.
We may have just completed a DZZ for a wave 2 after the 5 up.
It’s possible that subminuette c continued down as a 5 wave structure on the hourly chart and that the bottom is in at 1191.3 (KITCO). As I write this, we are back up around 1198. We need to continue higher and close back within the blue channel on Lara’ main daily count and then move above the green channel on the hourly chart for more confidence.
I should have trusted my chart. Gold negated the bottom HnS.
-Gold tested the triangle apex and breakout w/high volume
– Gold tested high volume high w/low volume and reversed.
gold came off high w/low volume and next day dropped on accelerated volume
Gold now trading below the ole neckline resistance
gold also is trading below important 9ema at 1199.
If today’s volume higher than yesterday and down day gold will run to the bottom NL at 1141.
The chart has all alt wave count turning points at ,Head, shoulders R/L and necklines.
Gold looks very bearish here unless it goes above the NL extension.
I guess I just don’t see the charts the same. The structure looks very bullish to me but I guess that’s what makes a market. I think Lara’s main count has the best odds by far and it coincides well with my non-Elliott charts. According to my charts, a new intraday uptrend began around 5:35am EST. One thing is for certain….we will see soon enough!
Gold just back tested 1200 NL from below and is down. Once closes below 9ema 1178 will be in sight,
Unless gold closes above 1200.
Mark gold looked like a new intraday uptrend for just under 3 hours until 8:21 am gold high 1202.73 and that is when the US dollar woke up and went up .70 and gold dropped $9 since then.
Looks weak, unfortunate about FED FOMC mentioning a possible June interest rate hike. The market is jumping back into US dollar and gold gets knocked down again just when expecting a strong 3rd wave. I think that isn’t strong enough right not with the US dollar being pumped up for who knows how long. I’m on the fence with my profits out of harms way enjoying the view for now watching the street/market fight.
Lara
Is there any way to consider an Elliott Wave analysis of the US dollar index as the way it moves has a huge effect on gold
Compare Wednesday US FED FOMC news release had a lot on the FED officials thinking of increasing the interest rates as soon as June and that has been pushing up gold since the 2 pm meeting and down went gold more than expected.
With TOS platform I compare /GC and $DXY and instantly you will see how they have an inverse effect on each other.
I used to ignore the US dollar when thinking about gold until I added the US dollar index $DXY to my /GC gold chart on TOS and there is no way I can be in denial of it anymore.
I think that is effecting the accuracy of the Elliott Wave forecasts and perhaps including some analysis like Elliott Wave of the US dollar index could increase the accuracy of gold forecasts.
Compare some of the US major events and how they moved the US dollar and gold. Even the big run up in gold from March 18th to March 26th.
Gold had a big rally on March 18th and the US Dollar lost the most percentage in years March 18th.
http://www.investing.com/quotes/us-dollar-index-streaming-chart
http://stockcharts.com/h-sc/ui
http://www.pmbull.com/gold-price/
A few months ago this topic was prominent in comments and at that time Lara said that she would not be providing EW for the USD. While you can find a lot of analysts talking about an inverse relationship between USD and Gold, there are others that debunk that such a relationship exists over a longer period of time. Here’s one such article from 2014:
http://seekingalpha.com/article/2447055-debunking-the-theory-that-the-u-s-dollar-and-gold-have-an-inverse-relationship
Peter Hug Still Calling For A 2016 Rate Hike Apr 08, 2015
http://www.kitco.com/news/video/show/For-Petes-Sake/959/2015-04-08/Peter-Hug-Still-Calling-For-A-2016-Rate-Hike
Avi Gilburt – Silver & Gold Prices Support Holding — As Still Looking Higher – April 8, 2015
http://www.gold-eagle.com/article/silver-gold-prices-support-holding-%E2%80%94-still-looking-higher
SENTIMENTS: Close but no cigar – was hoping to see a break below 1192 to somewhat negate the uptrend. Expecting a top to not be too far off though unless the top of an up move has already been seen… The downward pressure ought to remain as long as Gold price is under 1198/99. Upside move is expecting and It would require a convincing break above 1211-12 (subject to rise through 1204-08) to possibly target 1222/23 subject to a break above 1216-17…Down side support comes in at 20dma 1186/85 to keep the longs in it to try and win it!
The time now is 3:00 am and gold is at 1,195.72. Gold has thankfully bounced up from the low since the close, which was 1,192.73 at 1:53 am.
That is lower than what was expected. I checked as best I could and there has been no breach of any full hourly candlestick below the lower green base channel. Be aware that at the 5:30 mark in today’s video Lara does mention that “There are instances where 2nd waves do breach base channels and we still go on to see that nice strong 3rd wave (up).”
I only have a small amount of GDX and am looking for gold to move above 1,206.49 and breach the upper green hourly channel before buying more GDX. Perhaps the US dollar will co-operate and drop and gold can confirm the main daily wave count this week. It would help if maybe some US Fed officials can make comments this week that perhaps the interest rate hikes may not happen until 2016. That would pump up gold.
Gold hit a low of 1,196.37 at 10:00 pm although it was not needed in anyway, except perhaps that it finally ended minute wave 2. Hopefully that is the bottom and gold heads up from there above 1,206.49 then next a trend channel confirmation would come with a clear breach of the upper green best fit channel about minute wave ii would provide further confidence in a trend change. Once we get trend channel confirmation I’ll buy more of my bullish ETF. Come on you US dollar drop down for 7 sessions to 1,303 for minor wave 3, except you can jump up for a few days in minute wave 4.
We just keep sinking lower . At this point , I will be happy to exit my long with a profit and not see a big plunge in the morning . Should have listened to my gut today . Now we are below daily trendline . I don’t see much positive for bullish scenario unless we miraculously rally tomorrow . As far as I am concerned the wave count makes no sense anymore .
Have no fear Alex as $1196 is still holding. I use a closing basis for my targets. I will be curious to see how Lara labels c of Y….ED possibly? Trade below $1192.60 and NOW all bets are off.
Sorry I dumped at market just now . Maybe it is a mistake but I have no choice because gold is not acting according to Lara’s count . If I am wrong then unfortunately the count gave me no confidence to keep the trade .
I also sold at 9:31. Let gold and US dollar fight it out and settle it. I’ll go bullish when US dollar is bearish instead of on a FED Bull rally again with no time limit.
Two price points to watch:
needs to cross above 1206 after a low of 1196.
OR If gold continues down in 3rd of 3rd wave below 1178 in alt wave count.
This week is critical for gold :
Thanks Lara for this clarity.
New low after hours . OK , is it alright that minute ii is about to take as long or longer than minor 2 ? If I don’t see a green candlestick tomorrow , I will have to bail from my long .
Just got rid of my shorts before market close. I wish gold had made this low during market hours.
Long will be better once gold moves above 1206.
papudi, did you write that tomorrow is a turn date?
papudi’s post from April 1 :
Cycle dates by a blogger:
GOLD
Members who have read my recent comments would have noted that GOLD hit resistance on 31 Mar at the Fibonacci Number ratio 3/5 = 1178 and climbed to a HIGH on 01 Apr as I predicted some time ago.
GOLD would normally turn and move lower here making a….
LOW on 06 Apr (based on 72 month time count from 2009)
HIGH on 09 Apr
LOW on 14 Apr
“Inversion” is possible but I am pretty confident, from long time triangulation, that the 14 Apr will be a LOW
Will the 14 Apr be a directional turn date?
Remember TIME is the key to successful trading so whether it be GOLD or EQUITIES I hope these turn dates add a new dimension to your trading skills.
EQUITIES
As previously discussed the DOW will bottom shortly, maybe as early as the first trading day after the FULL MOON or maybe 07 Apr but remember there will be no respite (for some time) from this period where there is no trend (either up or down).
Thanks Alex. I’ve read someone else calling a top on 4/14, so maybe its inversion, maybe not. The first date on here appears to be inverted, maybe the second also if we go up tomorrow.
I replied to that when originally posted that it would be an inversion. And I seem right. Means of HIGH apr.1, LOW apr.6, HIGH apr.9, it would be LOW, HIGH, LOW.
JUST A VIEW: Expecting a pullback/short term decline within the next few bars. It will remain to be seen if the expected drop/downturn will break below 1198-96/95…. A break below 1192 will likely turn the tables on this one…. Subject to a rise through 1203-04, upside 1210 appears limiting with 1214 on the outside. A top does not appear to be far off; upside move is expecting and remains to be seen if Gold price can rise past 1214 for 1222/23…. //// I must commend Lara on the fascinating accuracy of E/W analysis which has helped me tremendously. Thank you.
Lara- Great report with lot of clarity and EW teaching.
By providing alternate hour counts helped me determine which wave count is unfolding. i hope when ever in future if you have multiple hour wave counts to publish will help us during 24 hr trading period.
Thanks for your hard work.
GLD and GDX both in the top 9 Buying on Weakness list on wsj.com.