
Yesterday’s analysis expected downwards movement to be over at yesterday’s low or shortly thereafter.
Price has continued substantially lower.
Summary: In the short term, a new high above 1,122.95 would indicate a bounce up most likely from here. A bounce may last about three days, but keep in mind that for the bear wave count any surprises may be to the downside as the middle of a strong third wave approaches. Expect more downwards movement towards the target at 1,080 while price remains below 1,122.95. A new low below 1,104.69 would invalidate the final bull wave count confirming Gold remains in a bear market.
To see weekly charts click here.
New updates to this analysis are in bold.
BEAR ELLIOTT WAVE COUNT

Click chart to enlarge.
Gold has been in a bear market since September 2011. There has not yet been confirmation of a change from bear to bull, and so at this stage any bull wave count would be trying to pick a low which is not advised. Price remains below the 200 day moving average and below the blue trend line (copied over to the daily chart). The bear market should be expected to be intact until we have technical confirmation of a big trend change.
The final line of resistance (bright aqua blue line copied over from weekly charts) is only overshot and not so far properly breached. While this line is not breached the bear wave count will remain possible. Simple is best, and the simplest method to confirm a trend change is a trend line.
The most likely possibility is that minute wave ii is a complete double zigzag and deep at 0.75 the length of minute wave i for the bear wave count. It has breached the dark blue base channel drawn about minor waves 1 and 2, one degree higher. When a lower degree second wave correction does this it reduces the probability of the wave count but does not invalidate it. Base channels most often work to show where following corrections find support or resistance, but not always.
At 932 minute wave iii would reach 1.618 the length of minute wave i.
A new high above 1,191.66 would necessarily come with a clear breach of the bear market trend line, and so at that stage a bear wave count should be discarded. Within minute wave iii, no second wave correction may move beyond its start above 1,191.66.
Gold often exhibits swift strong fifth waves, particularly its fifth waves within its third waves. When price moves towards subminuette wave v of minuette wave (iii) it may be explosive. For this wave count look out for surprises to be to the downside.
At 1,080 minuette wave (iii) would reach 4.236 the length of minuette wave (i).
Today I have two hourly charts that look at downwards movement differently from the high labelled minuette wave (ii). The trend should be assumed to remain the same until proven otherwise, so the first hourly wave count expects more downwards movement. The second hourly wave count expects a correction to begin from here which may be either subminuette wave ii or minuette wave (iv).
FIRST HOURLY CHART
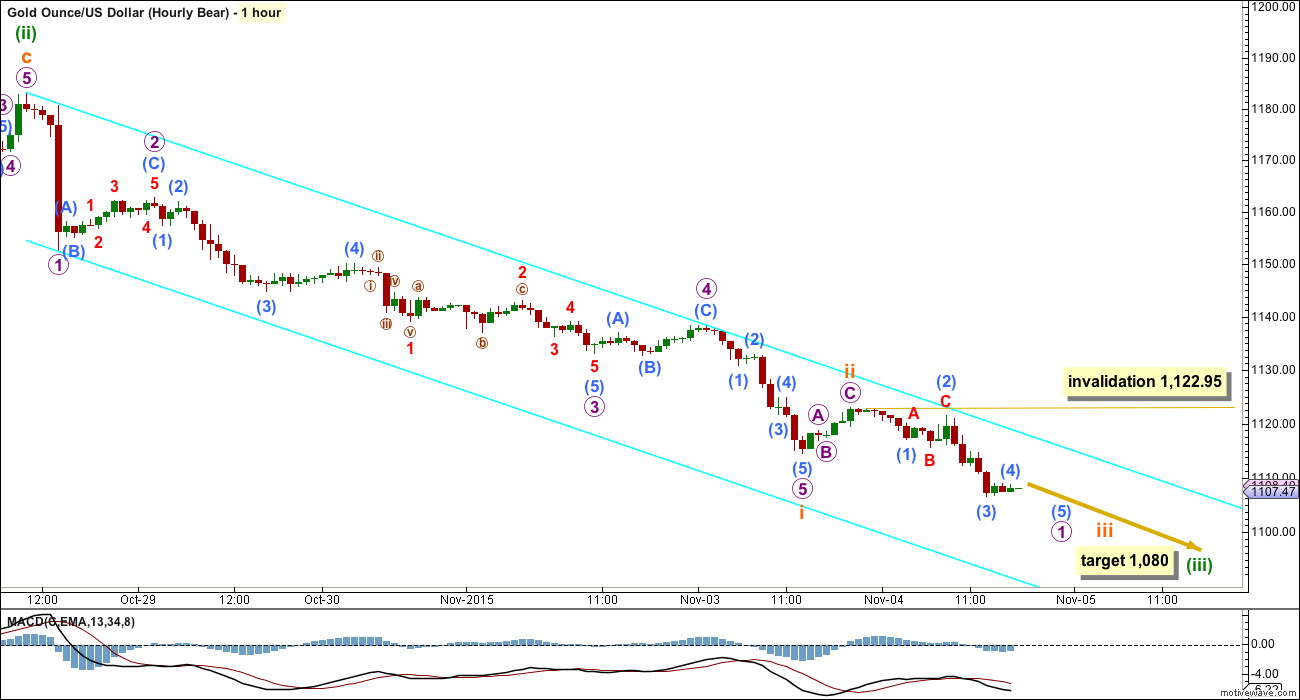
Click chart to enlarge.
It may be that only subminuette waves i and ii now complete within minuette wave (iii). Subminuette wave ii may have been remarkably quick and shallow. Sometimes this happens when the middle of a big third wave is approaching; the strong downwards pull can force corrections to be more brief and shallow than normal.
Ratios within subminuette wave i are: micro wave 3 is 0.97 short of equality in length with micro wave 1, and micro wave 5 has no Fibonacci ratio to either of micro waves 1 or 4. There is good alternation between the shallow zigzag of micro wave 2 and the more shallow flat correction of micro wave 4. Micro wave 3 is stronger than micro wave 1, and micro wave 5 is strongest. This looks like a typical impulse for gold.
Subminuette wave ii may have been over very quickly as a very shallow 0.09 correction of subminuette wave i. Although sometimes corrections approaching the middle of a third wave can be brief and shallow, this part of the wave count does not look right. This is why I am considering the second idea below.
If subminuette wave ii is complete, then within subminuette wave iii no second wave correction may move beyond its start above 1,122.95.
I would not consider the possibility that subminuette wave ii is continuing further sideways as an expanded flat correction because within it the B wave would be almost twice the length of the A wave. That is possible, but it has a very low probability. If price moves above 1,122.95, then the second idea below would be more likely.
SECOND HOURLY CHART
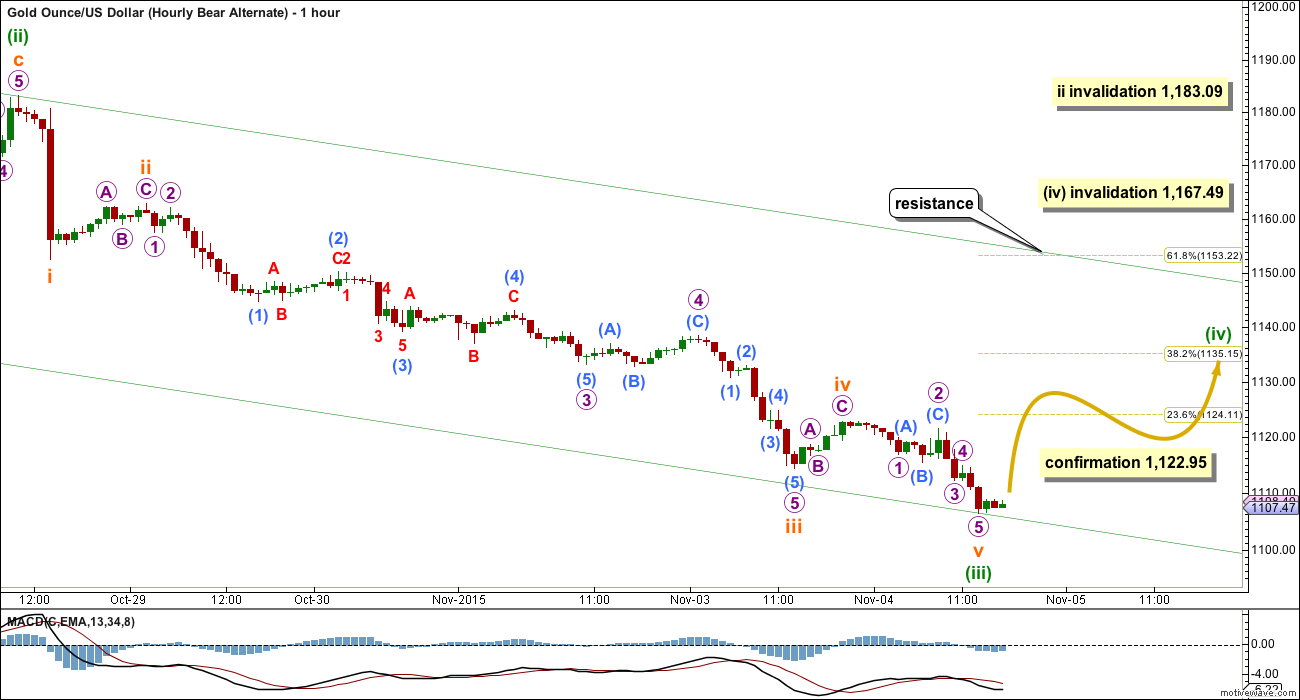
Click chart to enlarge.
This idea expects the the five wave impulse downwards has just ended at Wednesday’s low and a bounce up from here may begin.
The degree of labelling within this impulse may also be moved up one degree (from labelling on the first hourly wave count), because minuette wave (iii) may have just ended. This idea would expect minuette wave (v) to be a strong extension.
The degree of labelling may also be moved back down one degree. The five wave impulse may have been only subminuette wave i.
Ratios within minuette wave (iii) are: subminuette wave iii is 1.3 short of 1.618 the length of subminuette wave i, and subminuette wave v has no Fibonacci ratio to either of subminuette waves i or iii. There is little alternation between subminuette waves ii and iv: subminuette wave ii is a shallow 0.34 zigzag with a long A wave and short C wave and subminuette wave iv is a more shallow 0.13 zigzag with a short A wave and a long C wave.
Although there is not perfect alternation between subminuette waves ii and iv (the biggest problem with this wave count), seeing the correction labelled subminuette wave iv as a fourth wave and not a second wave (as the first wave count does) makes more sense.
At this stage, a new high above 1,122.95 would provide some confidence that downwards movement is likely over for now and a bounce upwards has begun.
The 0.382 or 0.618 Fibonacci ratios would be likely targets for the bounce to end.
If it is a fourth wave correction for minuette wave (iv), then it would be likely to exhibit alternation with the deep 0.65 expanded flat of minuette wave (ii). Minuette wave (iv) would most likely be a shallow triangle or zigzag. It may not move into minuette wave (i) price territory above 1,167.49. The most likely target for a fourth wave correction would be the 0.382 Fibonacci ratio at 1,135.
If the bounce is a second wave correction for subminuette wave ii, then it would most likely be a zigzag and most likely end about the 0.618 Fibonacci ratio at 1,153. It may not move above the start of subminuette wave i at 1,183.09.
BULL ELLIOTT WAVE COUNT
DAILY – TRIANGLE
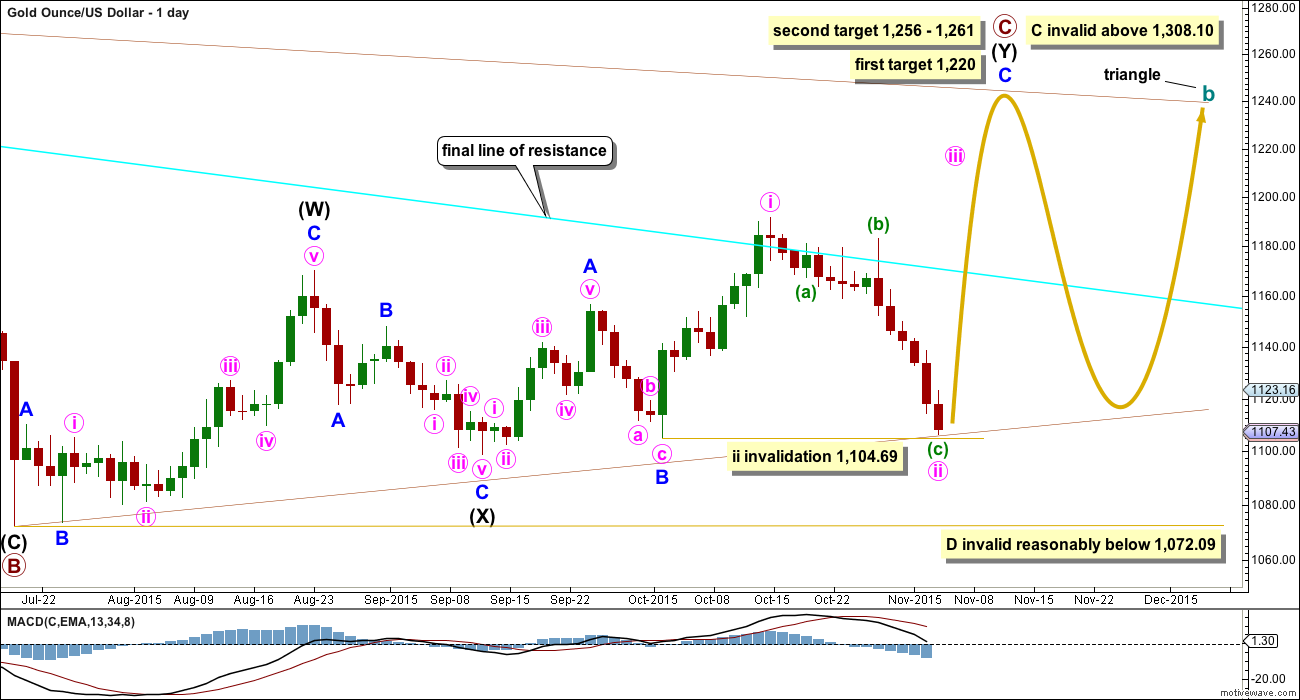
Click chart to enlarge.
Within cycle wave b, primary wave A subdivides perfectly as an expanded flat, which is a very common structure. Primary wave B subdivides as a zigzag, also a common structure. Primary wave B is 1.89 the length of primary wave A. This is longer than the normal maximum of 1.38, but within allowable convention of 2.
When an A wave subdivides as a three the correction may not be a zigzag. It may be a flat, combination or triangle. This first chart looks at what a triangle would look like. The triangle would be a running contracting or barrier triangle. Within the triangle, primary wave C up must be a single or multiple zigzag. Primary wave C may not move beyond the end of primary wave A above 1,308.10.
The only option now left that I can see at this stage for a bull wave count is that cycle wave b is unfolding as a triangle.
This daily chart looks at what a triangle would look like for cycle wave b. The triangle would be a running contracting or barrier triangle. Within the triangle, primary wave C up must be a single or multiple zigzag. Primary wave C may not move beyond the end of primary wave A above 1,308.10.
Primary wave C may not now be a zigzag with a leading contracting diagonal unfolding for intermediate wave (A). The leading diagonal is invalid. The only structure now for primary wave C would be a double zigzag.
If a triangle is unfolding, then at the weekly chart level primary wave C looks unlikely to be complete and should move higher for the triangle to have the right look. This wave count sees upwards movement as incomplete for minor wave C. At 1,220 primary wave C end close to 0.618 the length of primary wave B. One of the five sub waves of a triangle is commonly about 0.618 the length of its predecessor.
The second target at 1,256 is where minor wave C would reach 2.618 the length of minor wave A, and at 1,261 primary wave C would reach 0.8 the length of primary wave A.
For the triangle idea, for cycle wave b, a five wave impulsive structure only needs to complete upwards. The next wave down for primary wave D should be fairly time consuming, lasting about 2 to 6 months. Primary wave D may not move beyond the end of primary wave B at 1,072.09 for a contracting triangle. Alternatively, primary wave D may end about the same level as primary wave B at 1,072.09 for a barrier triangle, as long as the B-D trend line remains essentially flat. In practice this means primary wave D can end slightly below 1,072.09 and this wave count remains valid. This is the only Elliott wave rule which is not black and white.
The depth and duration of minute wave ii now does not look right. It is larger in length and duration than minor wave B one degree higher. If price continues sideways from here in an ever decreasing range, then I would consider the possibility that minor wave B was not over as a single zigzag but may be continuing sideways as a triangle. The invalidation point would still be the same at 1,104.69, so there is no divergence between that idea and the chart presented here at this stage.
HOURLY – TRIANGLE
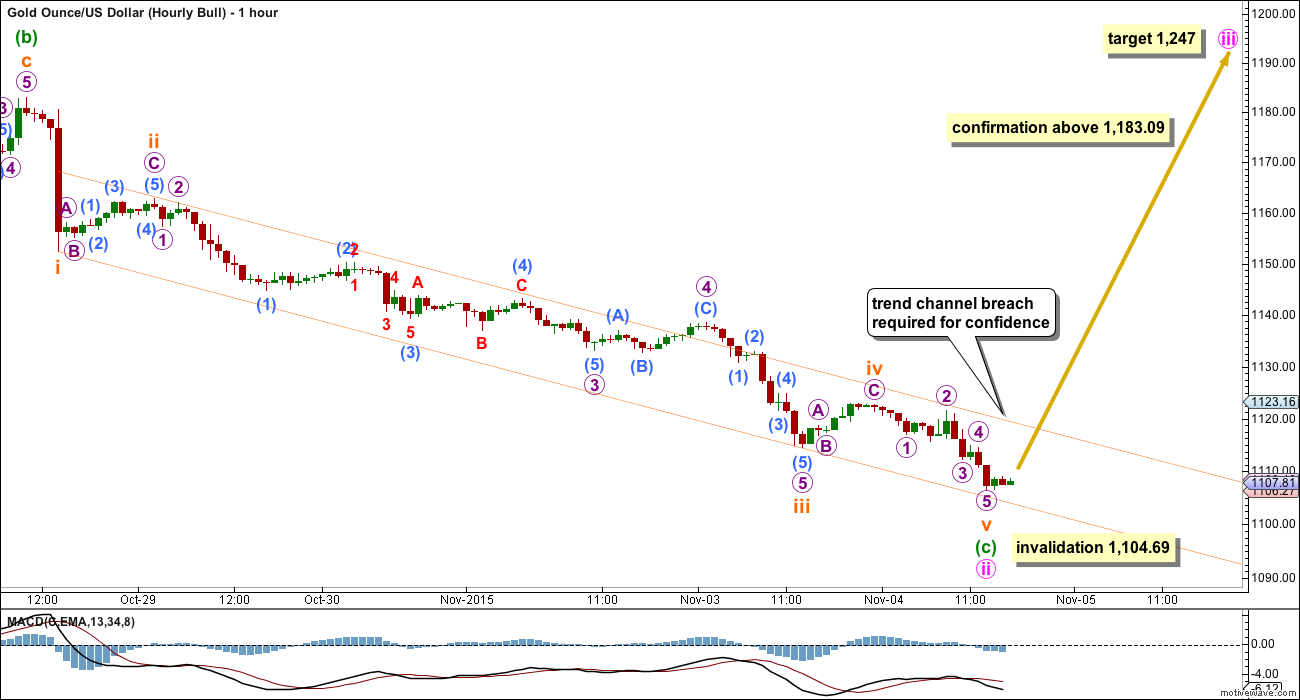
Click chart to enlarge.
Subdivisions within this downwards impulse are exactly the same as the second idea presented for the bear wave count.
A new high above 1,183.09 would strongly favour this bull wave count.
The bull wave count expects the next movement up may be a third wave.
TECHNICAL ANALYSIS
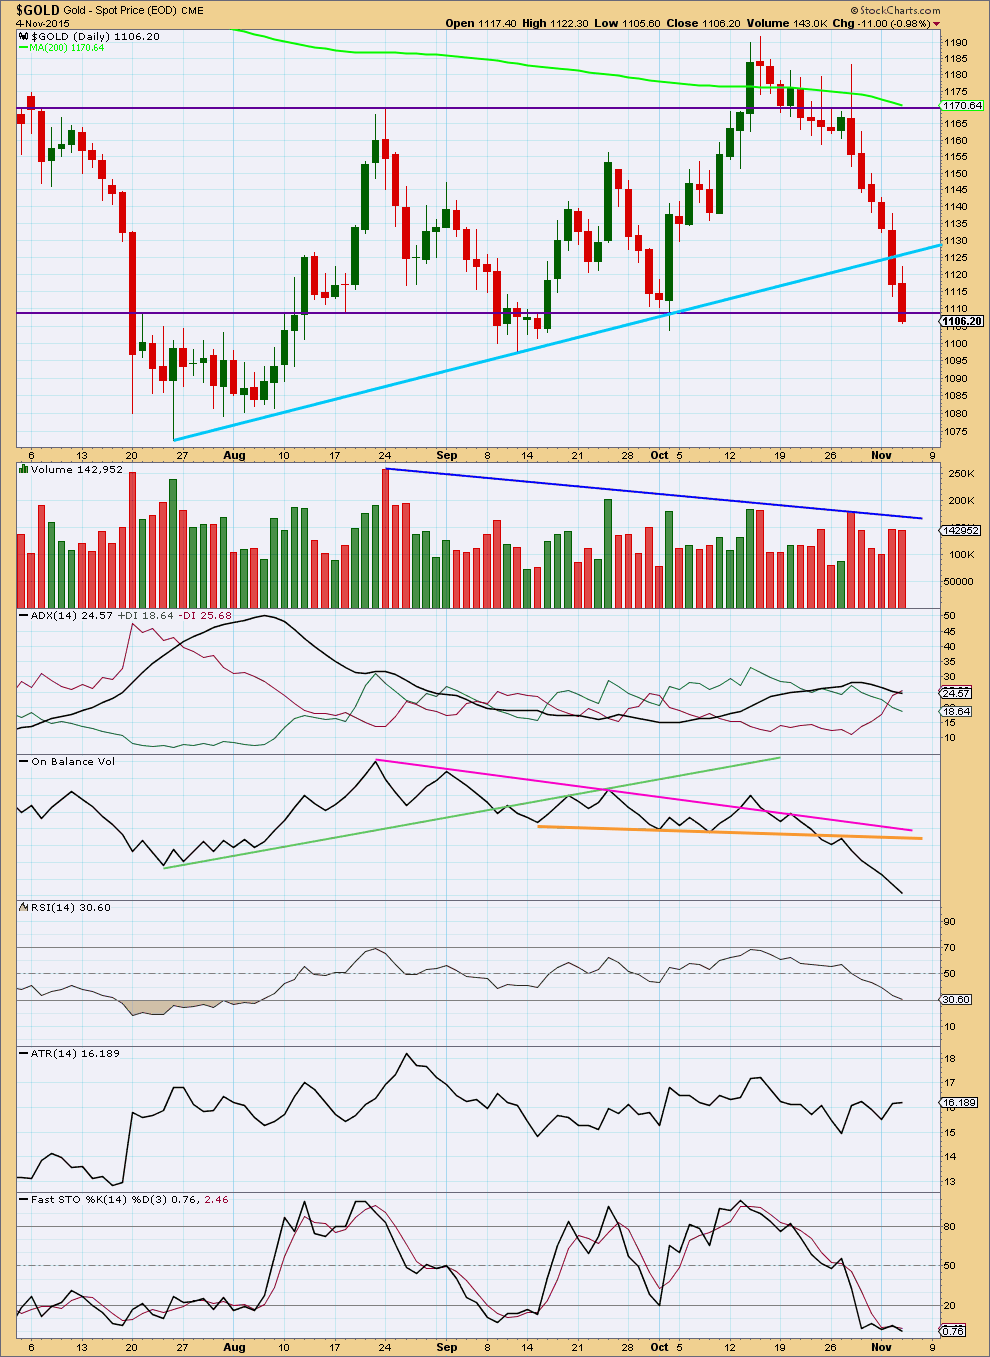
Click chart to enlarge. Chart courtesy of StockCharts.com.
Daily: Downwards movement comes on a slight decrease in volume today. The market has been falling now for six days, mostly of its own weight, and may well continue to do so. Volume is not required for price to keep falling.
The last big downwards move from Gold began on declining volume. It was not until over halfway through that volume picked up. That could happen again.
Price closed below the lower horizontal trend line. This line has been overshot before, and so a full daily candlestick below that line is required for a clear breakout. If that happens on a downwards day with an increase in volume, then a downwards breakout would be clearer. While more confidence in a downwards breakout may be had if volume spikes when price breaks below the trend line, this is not necessary.
It was a downwards day which had strongest volume during the consolidation. This indicates a downwards breakout is more likely than upwards. This does not always work, but it works more often than not. It is a useful indicator.
ADX is flat today. If the black ADX line turns upwards from here a new downwards trend would finally be indicated. ADX does tend to be a lagging indicator.
Average True Range is mostly flat. This is more typical of price during a consolidation than a trend.
A downwards breakout has not yet been clearly indicated because ADX and ATR do not clearly indicate a downwards trend as yet, and because price has not properly broken below the lower horizontal trend line. It looks likely price may break out downwards, but it may bounce up from support about here first.
Stochastics now more clearly diverges with price; Stochastics is flat and oversold while price has made new lows for the last three days. An upwards bounce may begin about here to resolve this divergence.
On Balance Volume is very bearish. This gives some confidence that when price does break out of the consolidation zone it is likely to break out downwards.
This analysis is published about 06:21 p.m. EST.
Gold just broke down another $1 to 1103.54 at 3:33 pm, just when I was going to mention a double bottom at 3:26. It looks like gold is weaker than many expected.
So next stop is 1080????
It very well may be. $1,080 is actually very close.
We’ll find out more Friday at 8:30 am USnon farm payroll is out and gold will respond to it.
Tonight’s Lara analysis should be exciting and simplified over the multiple choice options for too long lately.
Come on gold give us a trend easier to trade and profit with.
Hopefully a drop to the gold bear bottom $900 then up to a golden moon $1,300+. I may be daydreaming but it feels good.
Gold just dropped another 2 cents for a new low of 1,104.53 at 1:30 pm.
That is more bearish as I was expecting it was a 2nd wave down that would stay above the low of 1,104.55 at 10:15 am.
It may be a double bottom at 1104???
I’d agree if it didn’t make a new low.
Avi Gilburt -EW – Making a 25-year bet on gold miners – Nov 5, 2015 11:40 a.m. ET
http://www.marketwatch.com/story/making-a-25-year-bet-on-gold-miners-2015-11-05?siteid=yhoof2
In one chart: What other reports say about the October jobs situation
– Nov 4, 2015 2:46 p.m. ET
Here in an article about job situation ahead of Friday’s 8:30 am job report
http://www.marketwatch.com/story/in-one-chart-what-other-reports-say-about-the-october-jobs-situation-2015-11-04?mod=MW_video_latest_news
FRIDAY, NOV. 6
8:30 am Nonfarm payrolls Oct. 177,000 142,000
8:30 am Unemployment rate Oct. 5.1% 5.1%
8:30 am Average hourly earnings Oct. 0.2% 0.2%
Richard
Time to buy GDX at the close for minuette wave iv correction to 1122???
At 1104.44 minuette wave iii may have ended.
Ok to buy as long as you choose the correct direction bull or bear ahead of Friday 8:30 am job report as that will move gold.
1,122.95 is not the target it is the confirmation point for the 1,135 target which might have changed today?
Daily and hourly bear wave count have been confirm now below 1,104.69 at 10:15 when it dropped to 1,104.55. Daily and hourly bull counts have been invalidated as per pmbull.com
Now lets see if Lara’s gold price feed provider confirms it for Lara as it may have slightly different price. Highly likely
pmbull.com October 15th high 1,191.64 and Lara had 1,191.66 on her high that day. That is only a 2 cents difference.
pmbull.com had 1,104.70 as low for October 2nd and Lara has it as 1,104.69. that is only a 1 cent different. pmbull.com low at 10:18 am today 1,104.55 is 14 cents below 1,104.69 invalidation point. So I declare the bear wave counts confirmed and the bull wave counts invalidated.
Is there a bounce here for gold to 1122????
The low I have from FXCM is 1,104.55.
The bull has been invalidated. Only the bear left now.
And so the focus now is on figuring out when the next bounce / correction along the way down will come.
Price remains within the channel I have on the first bear hourly chart. Finding resistance at the upper edge.
That channel may be earliest indication of an end to downwards movement short term and the start of a bounce.
Lara’s EW analysis is the BEST and excellent. To remind every one:
Oct 29th analysis summary:
———————————————————————————————
“Summary: All wave counts expect more downwards movement. The middle of a third wave may end about 1,132. The following fourth wave correction may be brief and shallow and may not move above 1,152.43. If targets are wrong, they may not be low enough. The bear wave count is valid and may see explosive downwards movement, so look out for surprises to the downside.”
—————————————————————————–
If this not beauty I do not know what is????? WOW!!!!!
Have good day!!!
Glad you’re happy Papudi, thanks.
Now that the bull wave counts have been invalidated by price the analysis should be clearer.
Silver and Oil are behaving nicely as well.
Where are we with oil Lara?
The first daily chart looks right so far. A leading diagonal may be unfolding. The second wave for minute ii finished in the normal range.
The last two days downwards movement for US Oil look like the start of a small third wave down within the leading diagonal. It has to make a new low below 42.60, it has to move below the end of minute wave i.
Thank you!
Super Bearish COT for silver and gold article from 10/31.
Nice read.
http://www.clivemaund.com/article.php?art_id=3614
GOLD COT report on 10/23 flashed bearishness. Plus MTSLD’s report was bearish.
Gold has dropped from 1141 to 1106 since the report.
HI Papudi…thanks for your posts…your enthusiasm is certainly compelling…
I must have missed the post from MTSLD to which you make reference…could you provide a link?
Thanks…
It is in the comment section of Oct 29th.
http://elliottwavegold.com/2015/10/gold-elliott-wave-technical-analysis-29th-october-2015/
Gold possible HnS in the making. A bounce to 1133 to right shoulder and then down as Lara’s bear wave expects.
Plus note Lara’s ADX is going side ways and once the red D moves higher gold will slide down hard in down trend.
Gold’s 9 ema at 1133 will act as resistance.
EW – Avi Gilburt – “Are we in the final run to lower lows – Or will the market offer another fake out?” First published Sat Oct 31 for members
http://news.goldseek.com/GoldSeek/1446635354.php
Since gold put in the top at 1080 COT has been flashing bearishness week after week. So far it has.
If this Friday COT shows bullish data than a brief consolidation next week gold may go higher. So for next two days expect the same down.
Gold is in bear market and it is showing the its hand. Surprises are always in the direction of major trend that is down.
“Never trade against the major trend”
Off topic – BITCOIN – Looks like another speculative move is taking place. Some are saying its because of a pyramid scheme by a company called MMM that is using Bitcoin to skirt the law.
http://www.cnbc.com/2015/11/04/bitcoin-rockets-higher-some-blame-pyramid-scheme.html
Another reason for Bitcoin gains or is it just social mood?
Chinese moving money out of the mainland.
http://www.marketwatch.com/story/why-the-value-of-bitcoin-is-on-an-absolute-tear-2015-11-04?dist=beforebell
Looks like a wave 3 or c wave move