
A little downwards movement was expected to begin for Monday before a trend change to upwards.
Price has moved lower.
Summary: The trend is up. The target remains at 1,582. Confidence in targets may be had with price movement above 1,349.25. There is still some bearish indication from volume to warrant extreme caution with any long positions at this time. Stops are absolutely essential (as always) and may be set just below 1,310.84. Invest no more than 3% of equity on any long positions entered here. If entering a long position today, the possibility of a loss must be accepted and risk managed.
New updates to this analysis are in bold.
Grand SuperCycle analysis is here.
Last weekly chart is here.
DAILY ELLIOTT WAVE COUNT
Click chart to enlarge.
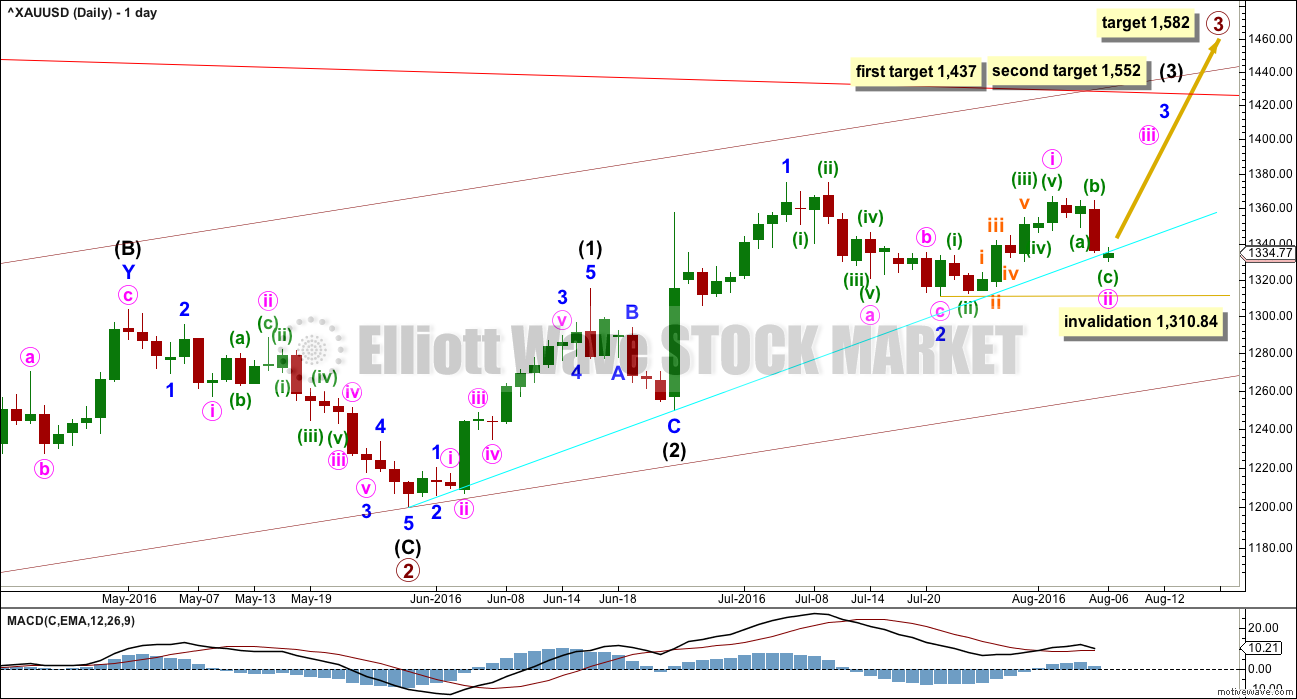
Primary wave 2 is a complete expanded flat correction. Price from the low labelled primary wave 2 has now moved too far upwards to be reasonably considered a continuation of primary wave 2. Primary wave 3 is very likely to have begun and would reach 1.618 the length of primary wave 1 at 1,582.
Primary wave 3 may only subdivide as an impulse.
So far intermediate waves (1) and (2) may be complete within primary wave 3. The middle of primary wave 3 may have begun and may also only subdivide as an impulse.
Within intermediate wave (3), the end of minor wave 1 is moved up to the last high. This fits on the hourly chart although it looks odd here on the daily chart. There was a small fourth wave correction up at the end of minor wave 1 and it subdivides on the hourly chart as an impulse. Minor wave 2 may be a complete zigzag, also subdividing as a zigzag on the hourly chart. If minor wave 2 is over, it would be 0.50 the depth of minute wave i.
No second wave correction may move beyond the start of its first wave below 1,310.84 within minor wave 3.
At 1,437 intermediate wave (3) would reach 1.618 the length of intermediate wave (1). If price keeps going upwards through this first target, or if it gets there and the structure is incomplete, then the next target would be at 1,552 where intermediate wave (3) would reach 2.618 the length of intermediate wave (1).
The support line in cyan is adjusted today. Draw it from the start of intermediate wave (1) to the end of intermediate wave (2). Downwards corrections may bounce upwards from about this support line.
The analysis of minute wave i is adjusted today. The correction which may have ended today may have been minute wave ii. This has a better look on the daily chart, and it fits well on the hourly chart. If this is correct, then there may now be four overlapping first and second waves complete: primary, intermediate, minor and now minute. This wave count expects to see an increase in upwards momentum beginning this week.
HOURLY ELLIOTT WAVE COUNT
Click chart to enlarge.
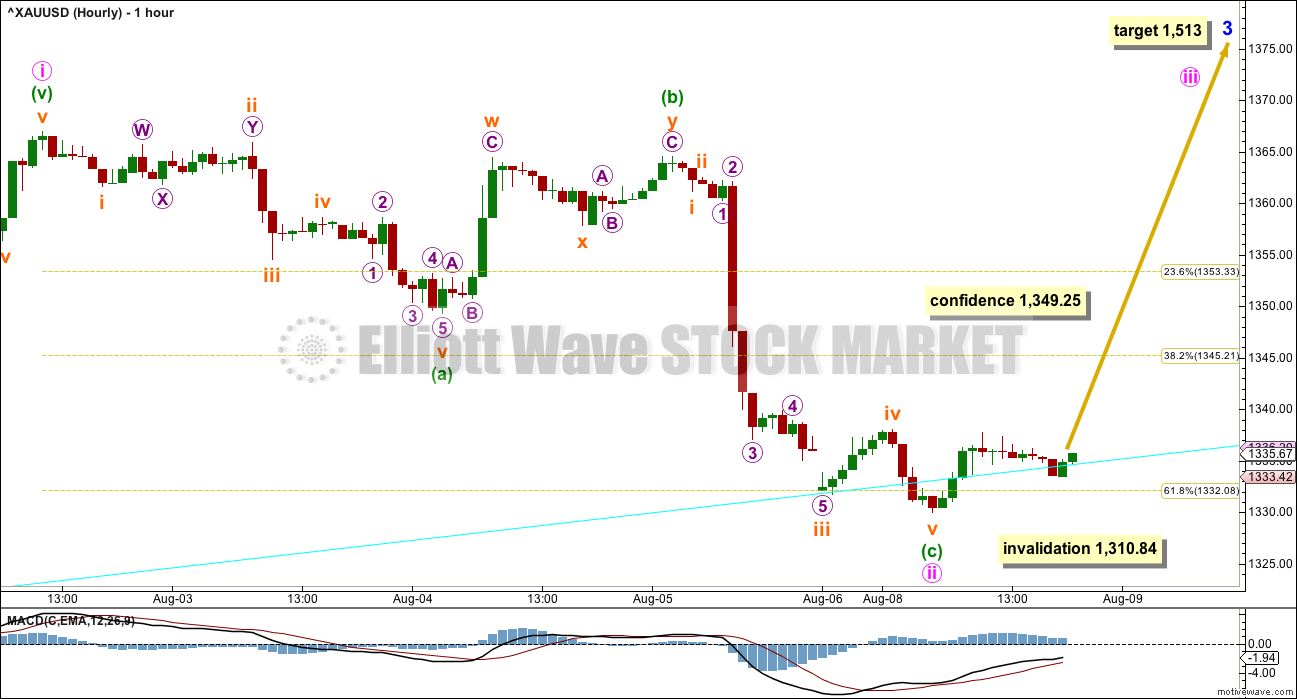
If the cyan support line copied over here from the daily chart is working, then minute wave ii should be over today. Minute wave iii upwards should have begun.
At 1,513 minor wave 3 would reach 1.618 the length of minor wave 1.
Within minor wave 3, minute waves i and now ii may be complete. Minute wave ii is a deep 0.66 zigzag, ending close to the cyan support line. At 1,420 minute wave iii would reach 1.618 the length of minute wave i, and at 1,476 minute wave iii would reach 2.618 the length of minute wave i. If minute wave ii moves any lower, then these targets must also move correspondingly lower.
Within minute wave ii, 1,349.25 is the low labelled minuette wave (a). A new high above this point could not be a fourth wave correction within an impulse developing lower. A new high above 1,349.25 would confirm that the downwards wave labelled minute wave ii was a three and was over. At that stage, more confidence may be had in targets and the overall upwards direction expected from this wave count.
The invalidation point will remain at the start of minute wave i while price remains below this confirmation point. If minute wave ii continues lower, it may not move beyond the start of minute wave i below 1,310.84.
THIRD WAVE EXAMPLE – DAILY CHART
Click chart to enlarge.
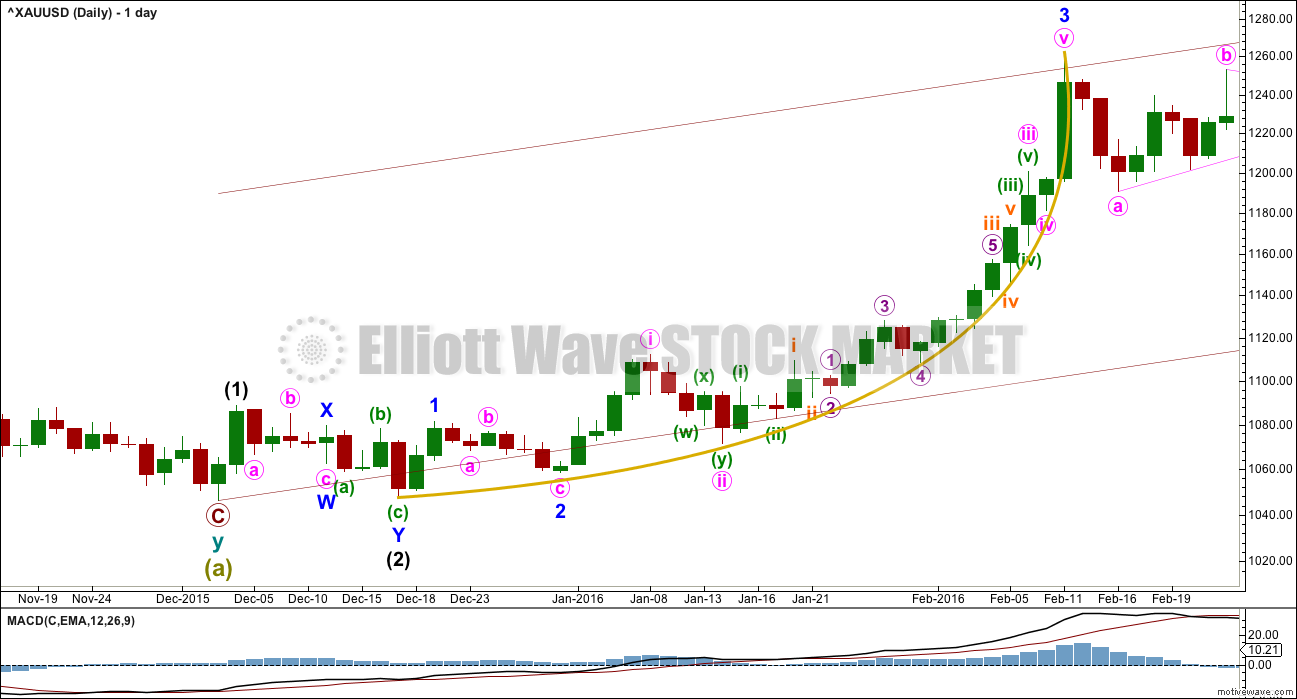
In discussing the curved look to Gold’s impulses, particularly for its third waves, here is an example.
Within primary wave 1, the third wave of minor wave 3 had a strong curved look to it. The impulse begins more slowly and has deep and relatively time consuming second wave corrections: Minor wave 2 was 0.68 of minor wave 1, minute wave ii was 0.76 of minute wave i, minuette wave (ii) was 0.56 of minuette wave (i), and subminuette wave ii was 0.64 of subminuette wave i.
The curved look comes from the disproportion between second and fourth wave corrections within the impulse. Here, minute wave ii lasted 4 days and shows clearly on the daily chart yet minute wave iv was over within one day and does not show up with any red candlesticks or doji on the daily chart.
Momentum builds towards the middle of the impulse, continuing to build further during the fifth wave and ending in a blowoff top. This is typical of Gold and all commodities.
This tendency to blowoff tops and curved impulses is particularly prevalent for Gold’s third waves.
TECHNICAL ANALYSIS
WEEKLY CHART
Click chart to enlarge.
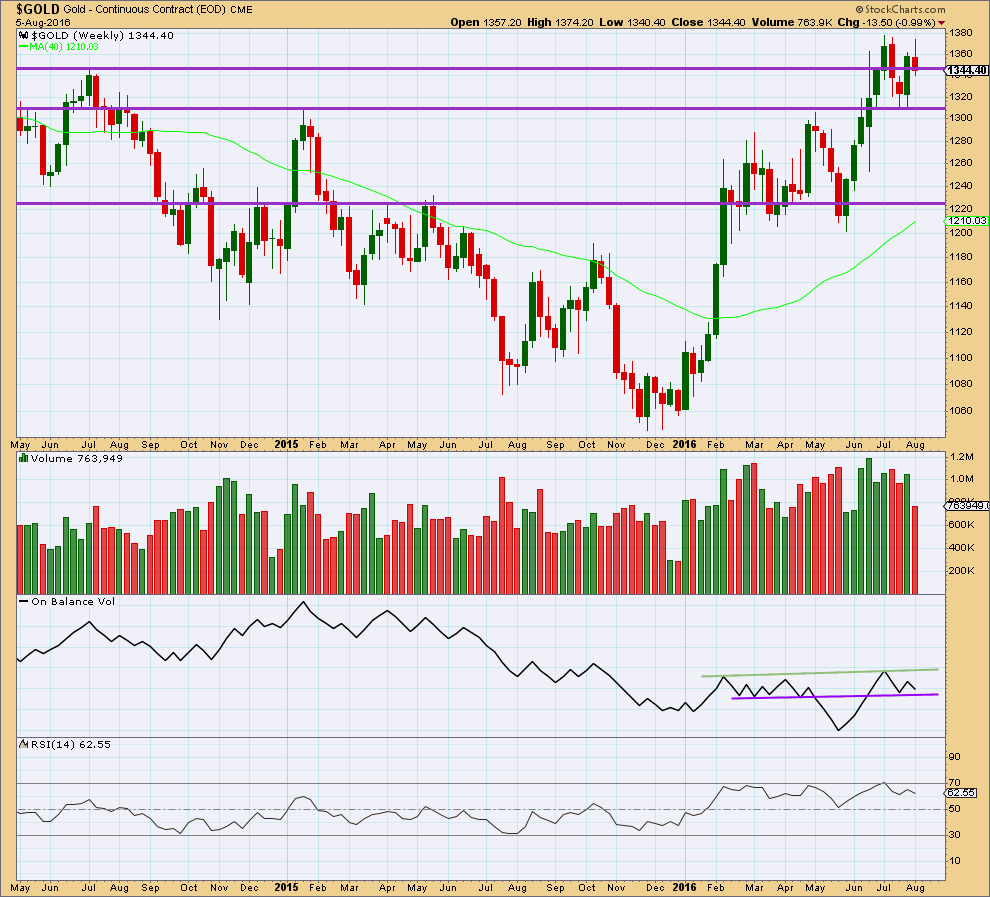
The week before last completed a bullish engulfing candlestick pattern supported by stronger volume than the prior downwards week. Last week made a new high, then completed a red candlestick on lighter volume. Overall, the fall in price last week is not supported by volume at the weekly chart level. Last week looks to more likely be a corrective movement than a new trend.
On Balance Volume is still relatively bullish above the purple trend line, which is redrawn at the end of last week. A break below the purple line would be bearish. A break above the green line would be bullish.
RSI is not extreme. There is room for price to rise or fall.
DAILY CHART
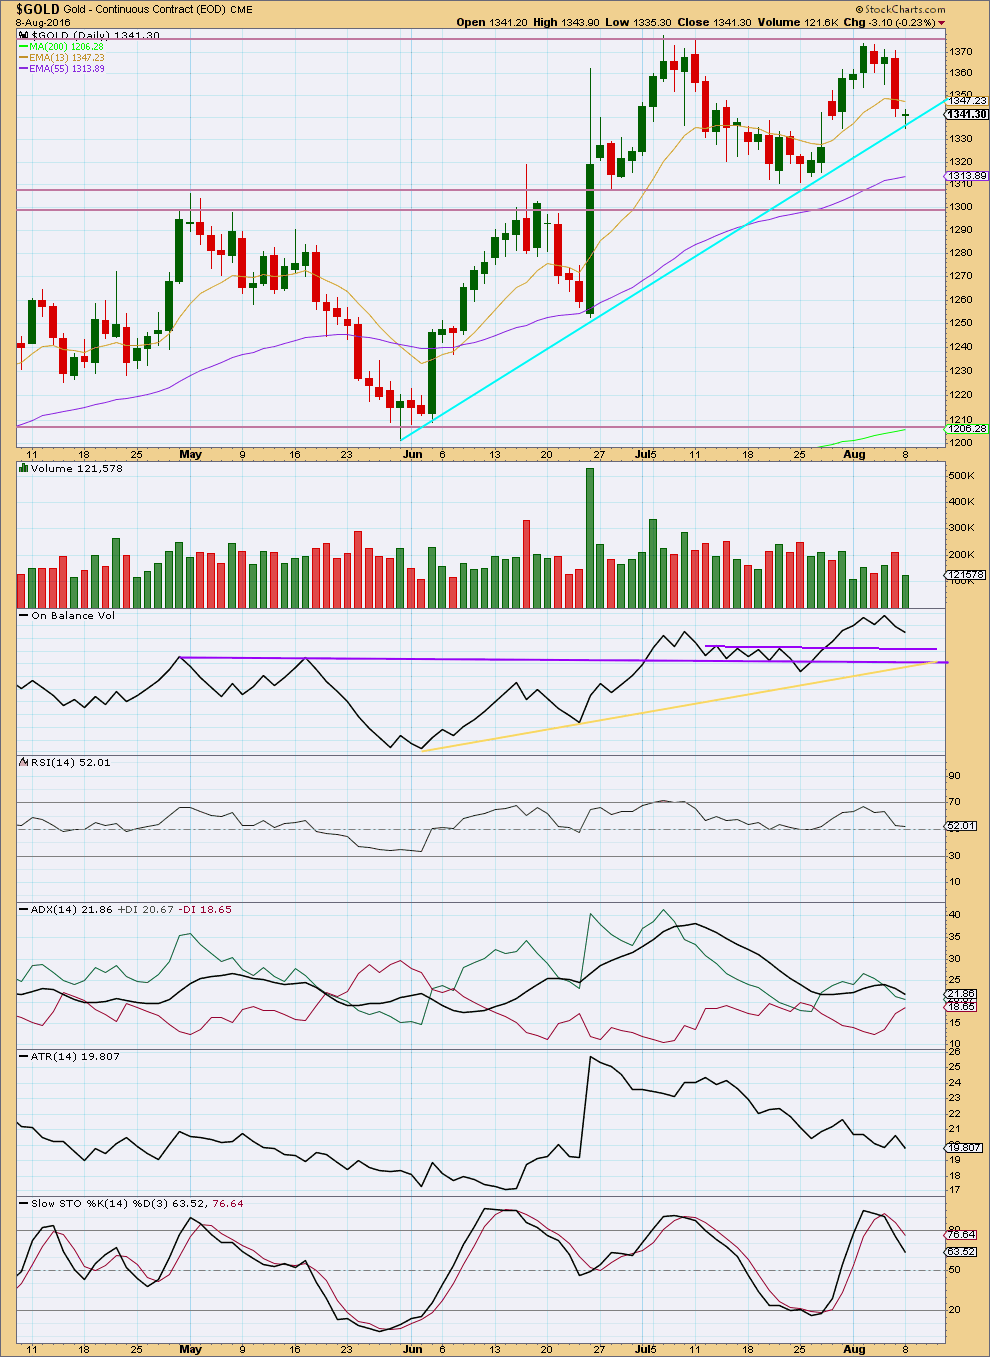
Click chart to enlarge.
First impression of Friday’s candlestick is a strong downwards day that is well supported by volume. With the fall in price over three days having support from volume, the initial impression is that this movement may be a new downwards trend and not a counter trend movement. Price has closed below the 13 day moving average, which often (not always) provides support or resistance for smaller corrections during Gold’s trends.
Looking back over this bull market that started on 3rd December, 2015, the multi day corrections may assist to see how Friday’s volume spike should be interpreted.
During the upwards trend from 3rd of December, 2015, 14 multi day corrections are noted. Of those 14 multi day corrections, 8 ended with strong volume on the final day and six did not. Gold has a tendency to blowoff tops and volume spikes at the end of downwards waves. It is possible that this is what happened on Friday.
There are two ways to read Friday’s strong volume: as a spike at the end of a movement, which is a bullish interpretation, or as support for downwards movement, which is a bearish interpretation.
Monday completes a small green doji on light volume. The bulls and bears today were very evenly balanced, with the bulls very slightly winning to complete a green candlestick. With light volume for overall a sideways day, the message is unclear but may slightly favour a bearish outlook.
On Balance Volume is bullish while it remains above the purple trend lines. There is some hidden bearish divergence between price and OBV at the last high: OBV made a new high but price did not. This indicates some weakness in price. This weakness may now be resolved by overall four days of downwards movement.
RSI is sitting very close to neutral. There is room for price to rise or fall.
ADX is still declining today indicating no clear trend. ADX has not indicated a trend change: the +DX line remains above the -DX line.
ATR is still overall declining in agreement with ADX. This market is not currently trending, so it should be assumed to be consolidating.
Stochastsics is returning from overbought. If the market is still consolidating, then some more downwards movement would be expected to continue until price finds support about 1,305 – 1,310 and Stochastics is oversold at the same time. This approach works for most swings within a consolidation, except the last, which is when the trend returns.
This analysis is published @ 08:40 p.m. EST.
[Note: Analysis is public today for promotional purposes. Member comments and discussion will remain private.]
Good Morning Lara,
would it be possible to update Oil please.
Are we turning south again from here?
Thanks Ursula
Yes, I should have done it yesterday but ran out of time.
It will be done today, as soon as I’ve done S&P
Well, we have upwards movement but it’s not really hugely convincing. Sometimes Gold’s waves start out like this, but I would prefer to see a stronger upwards day with strong volume for confidence in this wave count.
Only because members are requesting it, and because alternates should always be considered, will I publish one today.
I have spent some time considering “what if?” what if the wave count is invalidated? what else could be happening?
My bottom line is primary 2 is over. Price has moved too high now to reasonably be part of primary 2. So primary 3 is beginning.
So alternate options are either intermediate (2) or minor 2 are continuing.
For intermediate (2) to continue it looks very strange. I guess it could be a combination: zigzag – X – triangle, with the triangle now in D up. That would fit, but it would be extremely unlikely and would look awful.
So the other idea, minor 2 continuing is the one I’ll publish. But I warn you, it looks awful too.
But TBH with this lingering bearishness… something else could be happening. So I’ll publish an alternate.
I’ll keep looking and thinking. If anyone sees anything I’ve not mentioned, let me know. I’ll chart it and see if it fits.
I don’t believe this to be very probable, at least at this time anyway, but one alternate that hasn’t been mentioned is that cycle B could be complete
It’s cycle a unfolding, not cycle b.
Within Super Cycle (b). Which is what I think you meant?
Super cycle (a) only fits as a double zigzag. It can’t be seen as a five, that breaches an EW rule.
This means Super Cycle (b) should be very deep. There’s no minimum if it’s within a triangle, but there is a minimum if it’s within a flat correction.
Even if Super Cycle (b) is complete within a triangle at the weekly chart level that just looks ridiculous. It would be only 0.37 of Super Cycle (a) down. That is far too shallow to be a decent looking B wave within a triangle.
Thanks Eli for considering the alternate idea though.
It is something I did look at… but I wouldn’t want to publish it.
But again, no rules are breached. Technically…. it fits.
You can make pretty much anything you like fit technically (often, not always) but if you ignore the right look you’re pretty much guaranteed to get it wrong.
Hi yes sorry I went back to look at the historical charts. I did mean Super Cycle B. I know it would be really short and not very likely but with sentiment kind of high and the COT structure really extreme, I thought it would be worth looking at. A lot of times the market does what most do not expect, so I’m always on the lookout for something possible that would be a surprise.
It’s been a while since I focused in on the historical chart and didn’t realize the move down from the all time high was judged a 3 wave structure. For some reason i had it in my mind it was a 5, so this was a good exercise. I’ll go back and study that again
After your comment I’ve gone back to the weekly chart and again looked at the idea. I have something I can publish which meets all EW rules.
It still doesn’t look right, but it’s the best I can come up with so far.
The guys at EWI are calling this upwards movement a primary B wave. I think the difference from Lara’s count is the way they label the ED at last year’s low.
It seems like an awful lot of miners are trading above their BB so we may yet have some additional pull-back….
Hi Lara,
Thanks for posting some alternate ideas about intermediate (2) and minor 2. You might have already addressed this, but could minute ii be continuing, and, if so, what could that look like?
It could, as a double zigzag. Which is why the invalidation point is left at 1,310.84
GDX and NUGT are struggling today even though gold has climbed. Do you think this is because the price for GDX is at the top of Dreamer’s channel and hasn’t busted through yet or is this because of the bearish undertones discussed in Lara’s summary?
GDM is continuing it’s upwards trend but starting to give up some of it’s earlier gains even as gold climbs. GDM now at +0.72%; $853.33.
Interesting movement, nonetheless. Please feel free to offer your thoughts.
Gold and NUGT did well until the 10:13 am gold high of 1342.69 and NUGT high of 165.42 at 10:09 am then gold and NUGT dropped until noon then both moved up a little until 2:00 but no new high then got weak again.
NUGT Bottomed Friday at 151.81 after a very long down day Friday with fear very high and bullish sentiment very low and investors bailing heavily out of miners on the type of day the brave buyers buy cheap.
Then gold bottomed Tuesday 5:30 am at 1329.95. GDX and NUGT are doing well considering gold is still so low. Too much fear in an unstable gold bottom for GDX and NUGT to move higher until gold gets it’s MOJO back and moves higher then the sentiment will move the buyers strongly back into GDX and NUGT again.
One might think miners are weak now but they are not.
August 4th gold low was 1355.10 and NUGT 168.85.
Today gold high only 1342.69 and NUGT at 165.42, which indicates when gold moves back up then miners continue to move up stronger than gold with miners time and time again higher than they were at that previous gold price..
These Three Junior Gold Miners are Outperforming the Junior Miners ETF GDXJ
August 9th, 2016
GDXJ, which is the largest ETF targeting small- and mid-cap gold mining companies, has gained 165% year-to-date.
http://etfdailynews.com/2016/08/09/these-three-junior-gold-miners-are-outperforming-the-junior-miners-etf/
Fill of GDX closing gap today at 31.23 from August 4 today would be auspicious for the bullish case imo…
Lara,
thanks for your excellent analysis, impulsive move is here now. Likely to exceed 1349.25 by tomorrow?
It should do, yes. That’s what I would expect anyway.
Looking for an upwards break of the correction channel to signal the uptrend resumes.
Lara,
If tomorrow shows weakness or lack of momentum, could you post a daily alternative reflecting a new downtrend as opposed to a countertrend correction. Thanks.
I second that motion. Looking for the “what if” scenario, as Lara makes reference to
” A new high above this point [1349.25] could not be a fourth wave correction within an impulse developing lower”. And how would an impulse developing lower be charted?
Stochastics is returning from overbought. If the market is still consolidating, then some more downwards movement would be expected to continue until price finds support about 1,305 – 1,310 and Stochastics is oversold at the same time.
okay, I do have an alternate I’m keeping an eye on, but it looks really awful
it’s minor 2 continuing, I’ve published it before
but the problem is proportion. minor 2 is now hugely grossly disproportionate to intermediate (2).