
Slightly higher movement from Gold for Friday’s session fits the main Elliott wave count.
Price continues to bounce up off support at the lower trend line.
Summary: The bottom line is still that it must be accepted there is no indication yet of an end to this upwards wave while Gold remains within the channel and above the confidence point of 1,198.79. Targets are now 1,234 or 1,288. If price breaks below the lower edge of the gold channel, then a target for a deep correction would be at or below 1,160.
New updates to this analysis are in bold.
Last monthly and weekly charts are here. Last historic analysis video is here.
Grand SuperCycle analysis is here.
MAIN ELLIOTT WAVE COUNT
DAILY CHART
Click chart to enlarge.
This main wave count has a better fit for prior movement. To see the difference between this main wave count and the alternate below please refer to last historic analysis linked to above.
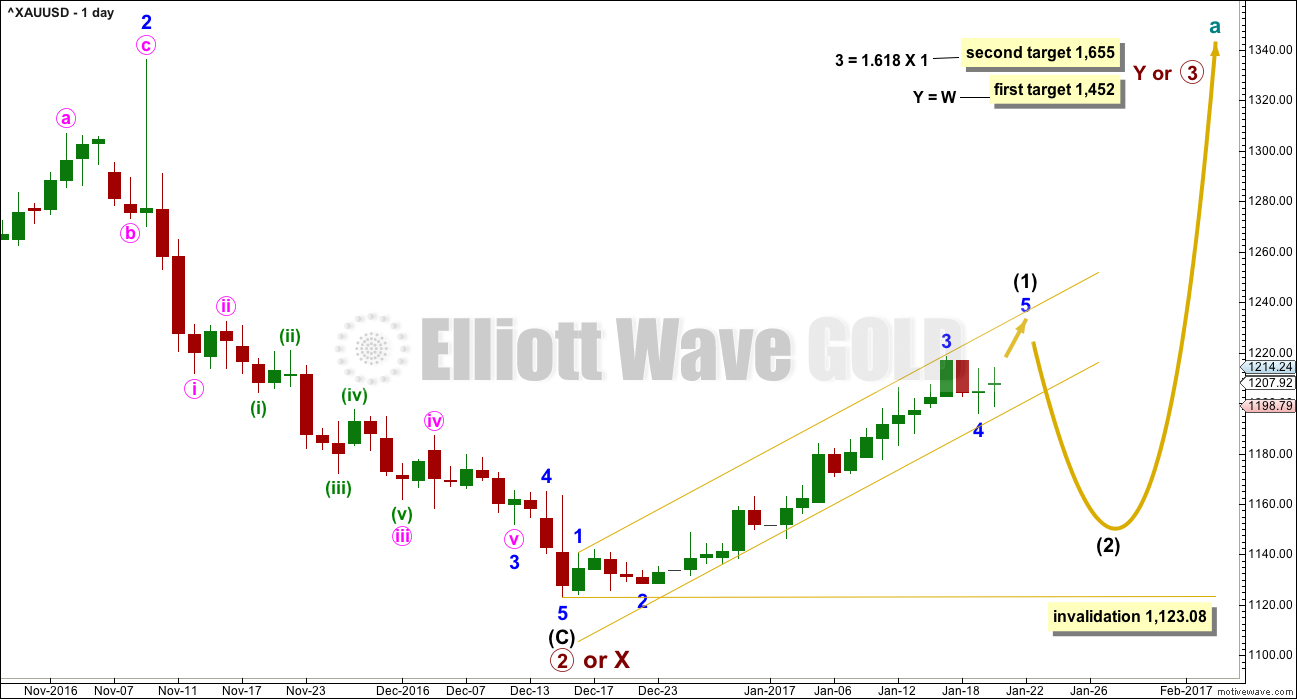
This main wave count expects Gold has had a primary degree trend change in December 2016. The new upwards wave is either a primary degree third wave, or a primary degree zigzag to complete a double zigzag.
Intermediate wave (1) has so far lasted 27 days. If it continues for another 7, it may complete in a total Fibonacci 34. This would see intermediate wave (1) end on the 31st of January.
So far price remains within the gold channel. A breach of the gold channel on the daily chart would provide strong indication of a trend change.
While price remains within the gold channel, then it must be accepted that it is likely to continue higher. A breach of the gold channel would indicate intermediate wave (1) is over and intermediate wave (2) has arrived.
The first in a series of second wave corrections for Gold’s new impulses is usually very deep. Intermediate wave (2) is expected to be at least 0.618 the depth of intermediate wave (1), and very likely may be deeper. It may not move beyond the start of intermediate wave (1) below 1,123.08.
Intermediate wave (2) may be at least as long in duration as intermediate wave (1), and fairly likely it may be longer. Corrections are often more time consuming than impulses.
Gold often exhibits swift strong fifth waves, but this does not have to happen for minor wave 5. But it is a common tendency, so traders should look out for it.
HOURLY CHART
Click chart to enlarge.
To see detail of all of intermediate wave (1) so far on the hourly chart click here.
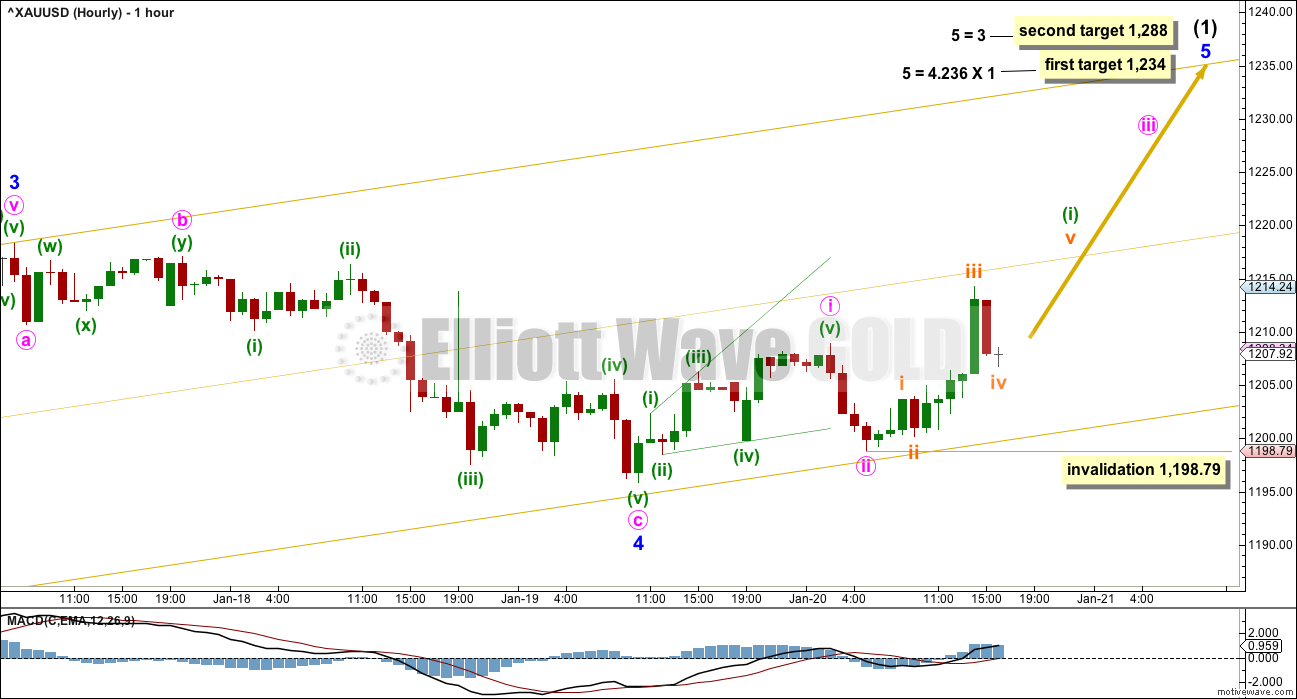
Price has come down to find support very close to the lower edge of the gold channel again during Friday’s session, and then bounced up from there. Price behaviour so far supports this main hourly wave count. Each time price comes close to the lower edge of the channel it presents another opportunity to join the trend.
If price comes back down to the lower trend line and moves quickly through it, then the probability of this main hourly wave count would substantially reduce. At that stage, consider the alternate below.
Minor wave 1 was short. Minor wave 3 was extended. It is very common for Gold to exhibit swift strong and extended fifth waves, so that is what the targets will expect.
A first wave up within minor wave 5 may be complete. At this stage, it will be labelled at minute degree but this may change because it may be needed to be moved down one degree. This movement fits as a leading expanding diagonal followed by a very deep correction.
Within minute wave iii, the upcoming correction for minuette wave (ii) may not move beyond the start of minuette wave (i) below 1,198.79.
Along the way up, corrections for this wave count should find support at the lower edge of the channel.
If minor wave 5 is a swift strong movement, then price may break above the upper edge of the channel.
ALTERNATE HOURLY CHART
Click chart to enlarge.
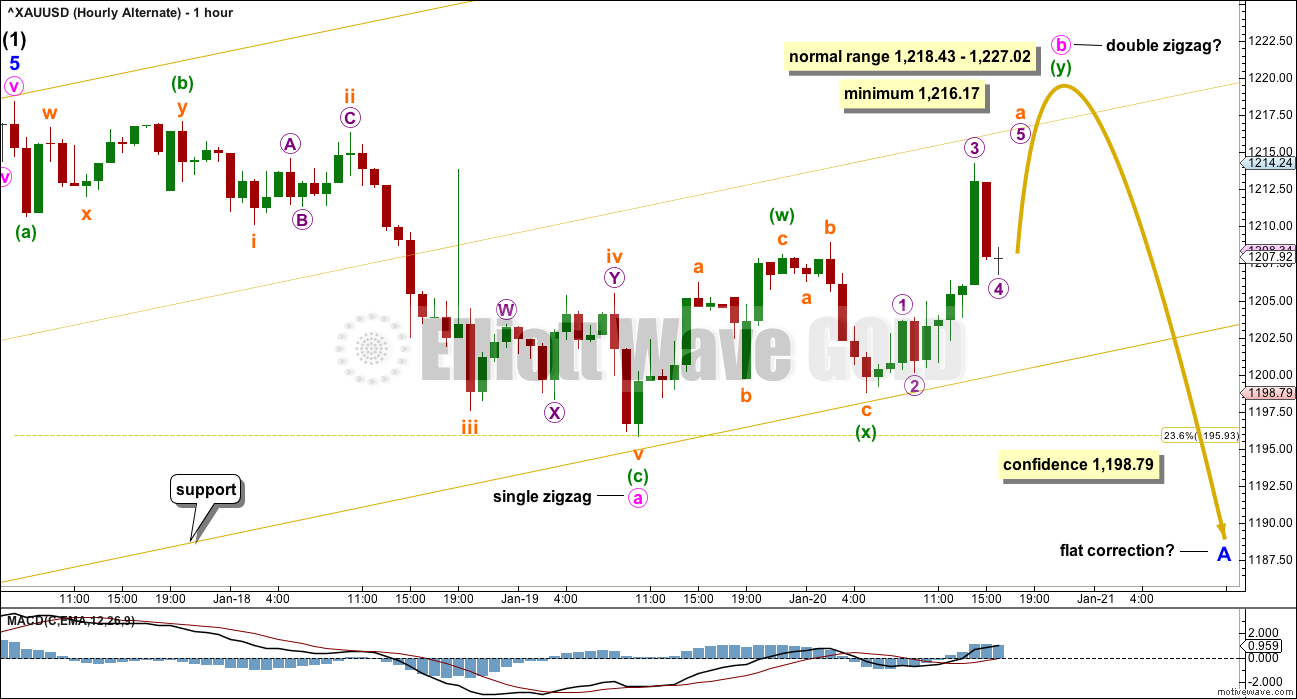
A new wave at intermediate degree should begin with a clear five down on the hourly chart. This has not happened.
At this stage, I have not been able to see a solution on the five minute chart which sees the downwards wave labelled minute wave a as a five wave structure. It will fit well as a completed zigzag.
The lack of a five down reduces the probability of this wave count. This wave count is published in the spirit of always considering possibilities, even those which are unlikely.
What if intermediate wave (1) is over? What if intermediate wave (2) has begun?
If the first small movement down is a three and not a five, then minor wave A may be unfolding as a flat correction. This would indicate intermediate wave (2) may be unfolding as a flat correction, with minor wave A within it also a flat correction.
Within the possible flat correction of minor wave A, the upwards wave of minute wave b must retrace a minimum 0.9 length of minute wave a at 1,216.17. The normal range for minute wave b within a flat correction is from 1 to 1.38 the length of minute wave a, giving a range from 1,218.43 to 1,227.02.
Minute wave b may make a new price extreme above the end of minute wave a at 1,218.43. There is no upper invalidation point for this wave count.
There is no Elliott wave rule stating a maximum length for B waves within flats (or X waves within combinations). There is a convention within Elliott wave which states when the potential B wave is longer than twice the length of the A wave the idea of a flat (and combination) should be discarded based upon a very low probability. This wave count would be discarded above 1,241.
ALTERNATE ELLIOTT WAVE COUNT
DAILY CHART
Click chart to enlarge.
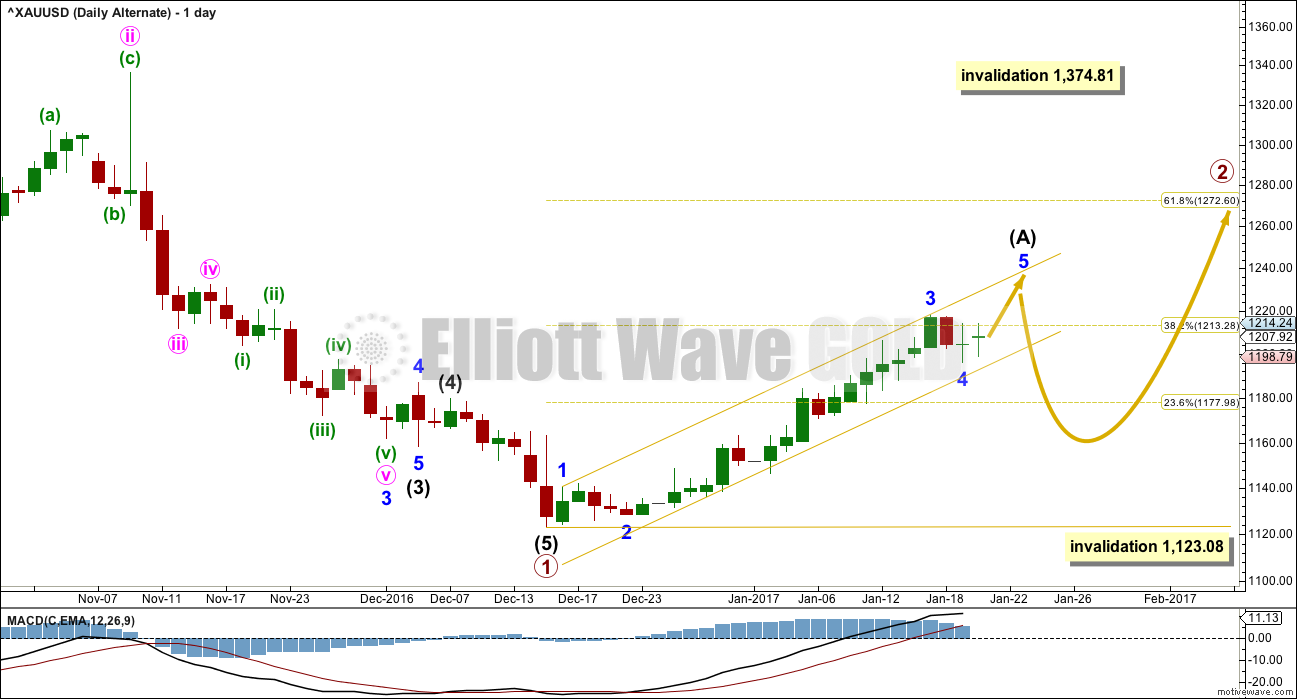
This alternate wave count expects that Gold is still within a bear market. Targets for new lows can be seen on weekly and monthly charts.
Within the bear market, a primary degree correction is underway.
Primary wave 2 is most likely to subdivide as a zigzag. So far it looks like a five up is either complete now or very close to completion. This may be intermediate wave (A).
Intermediate wave (B) may not move beyond the start of intermediate wave (A) below 1,123.08.
Primary wave 2 may not move beyond the start of primary wave 1 above 1,374.81.
TECHNICAL ANALYSIS
WEEKLY CHART
Click chart to enlarge. Chart courtesy of StockCharts.com.
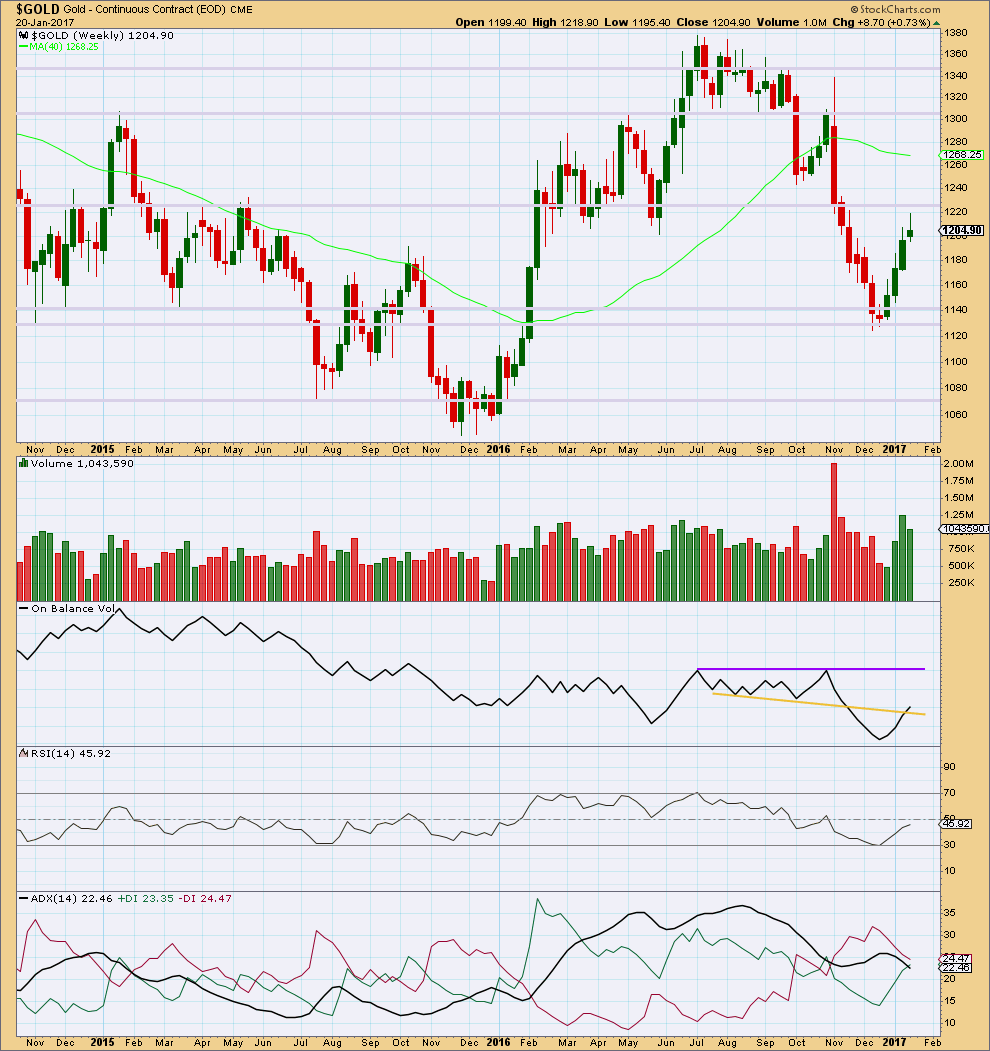
The first three weeks of upwards movement came with a steady increase in volume to support the rise in price, but this week sees a decline in volume. This indicates some weakness for this week.
The long upper wick and small real body of this weekly candlestick is slightly bearish. This is not a reversal signal at all but only a warning of internal weakness. This upwards trend will either end or see a correction at the weekly chart level; trend changes are often preceded by signs of weakness.
Price may find some resistance about 1,225.
On Balance Volume gives a weak bullish signal this week. The signal is weak because this line has been broken before. The purple resistance line offers stronger technical significance.
At the weekly chart level, RSI is increasing along with price.
ADX is still declining, indicating the market is not yet trending (but this is a lagging indicator). ADX has not yet indicated a trend change from down to up; the -DX line remains above the +DX line.
DAILY CHART
Click chart to enlarge. Chart courtesy of StockCharts.com.
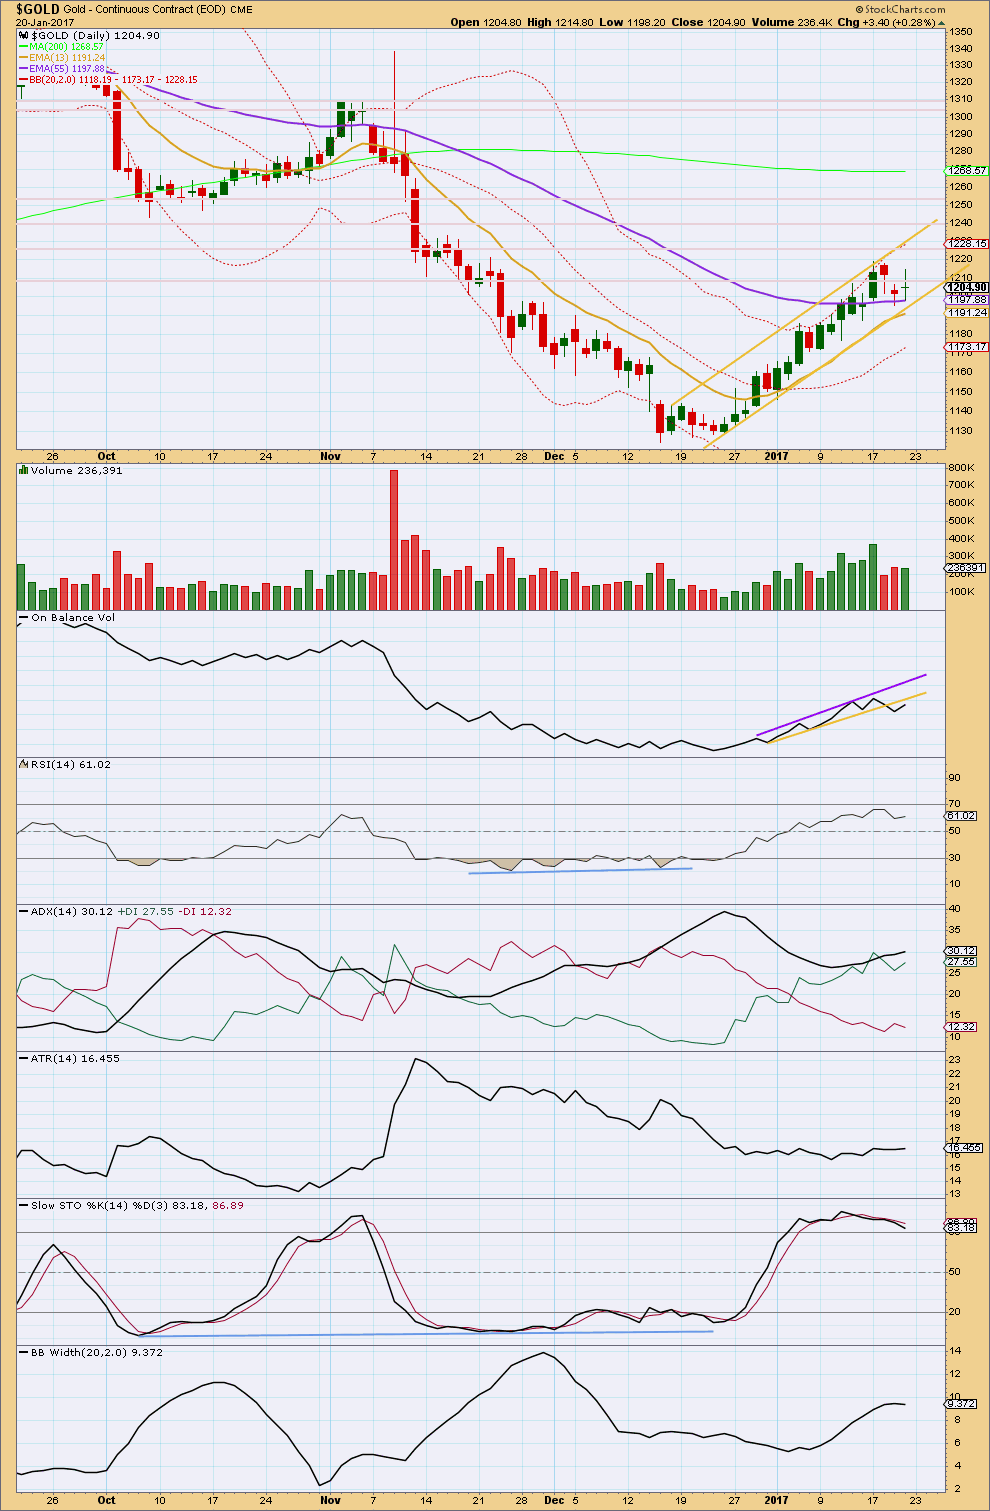
Price continues to move higher finding resistance at the upper gold trend line. Next resistance may be about 1,225, then 1,240, then 1,250. Thereafter, there is very strong resistance about 1,305 to 1,310.
The bearish indication from the hanging man candlestick pattern and a following red daily candlestick has now been followed by a green long legged doji that has lighter volume. Overall, this looks like a small consolidation that may be within the continuing upwards trend, or it may be the start of a deeper consolidation. Assume the trend remains up while price remains above the lower gold trend line.
Price is finding some support now about the Fibonacci 55 day moving average.
All three moving averages have a positive slope indicating Gold is likely in an upwards trend at this time.
On Balance Volume may now find resistance at the lower yellow line. The line does not have good technical significance though.
ADX is above both directional indicators. An upwards trend is indicated, but this is now entering extreme territory. If ADX rises to above 35, then the trend would be very extreme.
ATR is still flat at the end of this week. This is normal for either a larger consolidation within a trend or the start of a new trend for Gold.
Bollinger Bands have not reached extreme. There is room for volatility to increase as this trend continues.
GDX DAILY CHART
Click chart to enlarge. Chart courtesy of StockCharts.com.
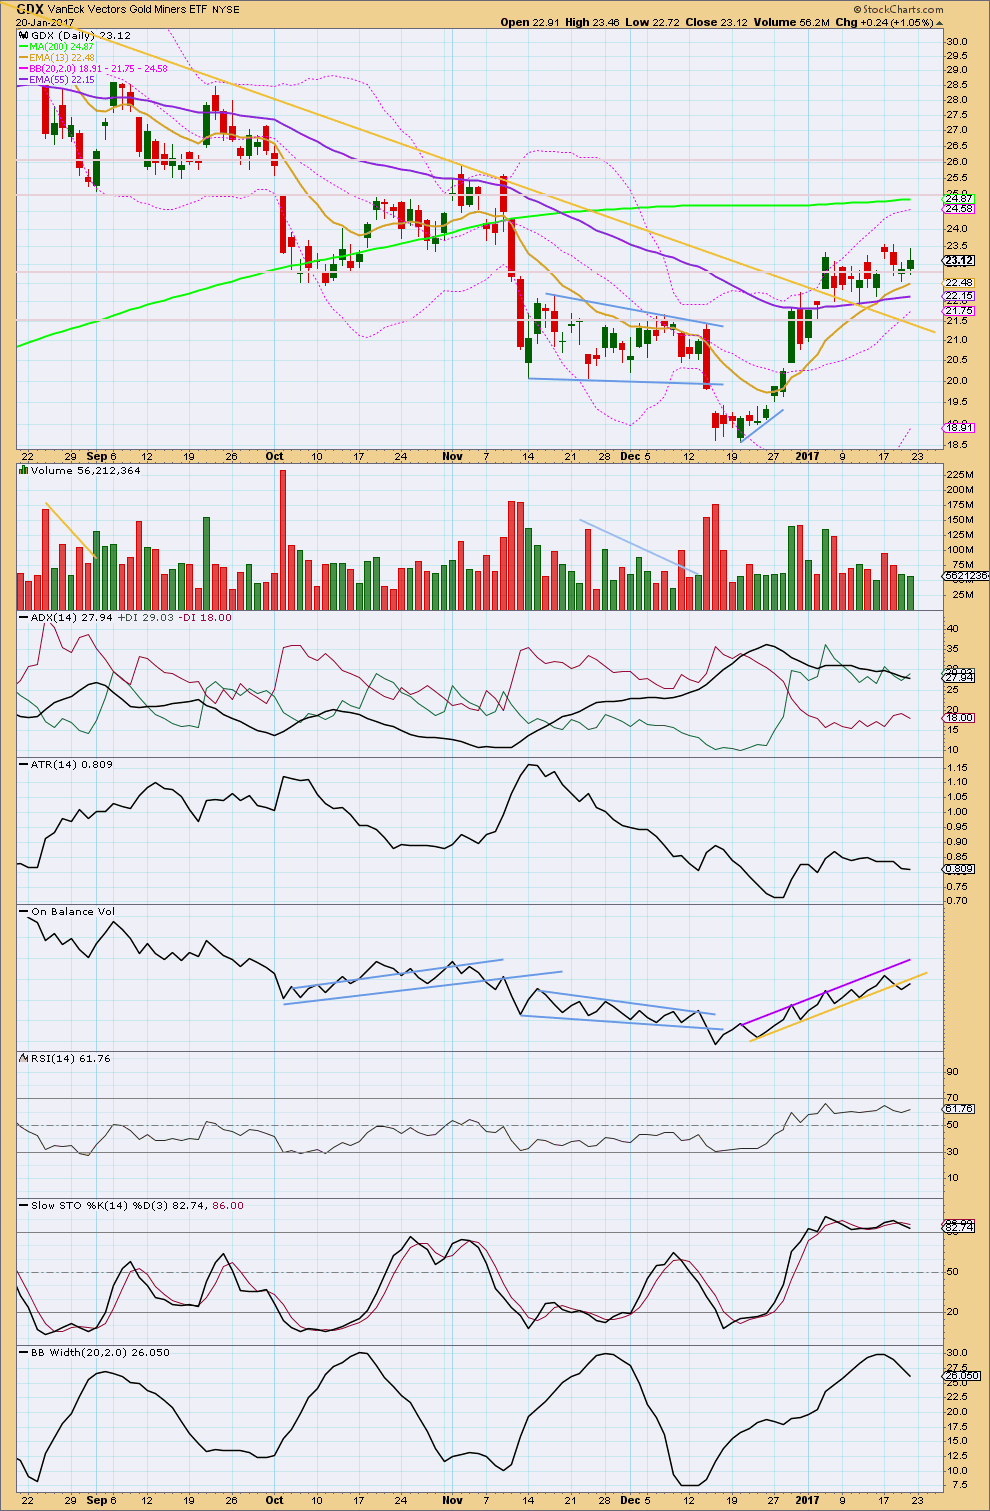
GDX moved higher on Friday with another small range day on lighter volume. The lack of volume is slightly concerning for bulls.
GDX has been essentially moving sideways for the last ten sessions, with a slight upwards bias. It is two downwards days during this period that have strongest volume suggesting a downwards breakout may be more likely than an upwards breakout. This technique does not always work for GDX; it is only one piece of information to weigh up in conjunction with others.
ADX is declining, indicating that GDX is not currently trending. ATR agrees as it is flat to declining.
On Balance Volume today offers a reasonable bearish signal with a breach of the yellow support line. This line is reasonably steep, somewhat long held, and tested four times, so it offers reasonable technical significance, But this signal is neither strong nor weak, just reasonable.
RSI did not reach overbought, so there is room for upwards movement to continue.
Stochastics did reach overbought and there exhibited divergence with price. This could continue to develop into multiple divergence before price turns, or price may have already turned.
Bollinger Bands are extreme and now beginning to contract. This supports the idea that GDX may have a high in place at this time.
On balance, this analysis for GDX is more bearish than bullish. My bottom line for GDX at this time would be to allow for the possibility that the upwards trend is intact while price remains above the last swing low at 21.90. If GDX makes a new low below 21.90, then look out for a deep correction for GDX.
This analysis is published @ 12:42 a.m. EST on 21st January, 2017.
Alternate hourly chart updated:
The minimum for a flat at 1,216.17 has been met. The structure of minuette wave (y) looks incomplete, it should make at least one new high.
The lower edge of the channel is still providing support. It needs to give way for any confidence whatsoever in this wave count.
So far, it looks to me like momentum and volume favoring the alternate.
In addition, the SLV chart is starting to point downwards and showing little interest in moving past 16.32 which I would have expected at the onset of a third wave to the upside. Let’s see how it closes…
Main hourly wave count updated. As Alan says below, minuette (i) and now likely (ii) look to be over.
The mid line of the channel is providing resistance. I’d expect that to give way, then provide support.
Looks like the metals are going to play it close to the vest until after the close of regular trading. Whatever it plans on doing, looks like we will have to wait overnight to find out. Oh well…anticipation….it’s keeping us waiting…… 🙂
Price is progressing as planned. Just completed minuette 1 of Minute 5 at 1218.33. Now in minuette 2 down. Target at 1230+ is still holding up well.
If you are right, we should see SLV take out 16.32 today on its way toward 16.50 to complete a third wave up.
Silver futures pointing higher but price action looks very much like a rising wedge. This is is to be expected of a terminal wave to the upside, in our case a minor five. The corrective waves have been taking their time so even if Alan is right we may not get that momentum increase for a third up before the close today, although it sure would be nice to help us plan for tomorrow.
SLV has moved up to 16.31 and has paused. Let’s see if we can take it out on increased volume or we decline back below 15.87 prior to the close. Dragonfly dojis are not reliable reversal signals for Silver, nor are spinning tops and long upper wicks. Price can and frequently do continue higher after printing them on a daily chart. I do not think price will meander around this level for long – we either move smartly higher or reverse.
Silver is sitting right at resistance. If it can break above this trend line then I’d expect a fair bit more upwards movement. But if it cannot then it may be beginning a deeper correction.
How this plays out today will be indicative.
Yep! I totally agree and I am watching it like a hawk. I think what it does here is going to be a huge tell.
Another useful proxy for Gold’s direction is the Euro as they have been moving in tandem recently. Several EW counts see the Euro completing a second wave correction ahead of a third wave decline expected to take the Euro to at least parity with the dollar. If the correlation continues a sharp turn in the Euro could signal the end of Gold’s current impulse up. Buying half position of the Feb 3 SLV 16.5 strike puts for 0.39 per contract. I have a hard mental stop with an SLV close above 16.32. If price moves above 16.32 intra-day will open STC at stop of 0.25
Selling SLV puts for 0.50 per contract. I don’t see the kind of conviction reversal that argues for letting any gains sit in the market. I am taking the money and run. If we move back up close to 16.32 and again find resistance will re-load.
Looks like USD/Yen is rolling over…Positive for gold.
The dollar index probably completing a fourth wave with a final fifth up to go. It should be close to done with the fourth today.
spoke too soon. I think the flat is playing out
i think the main count is being played out.
I will again be looking at SLV as a proxy to get some idea of where PMs are headed. I think a close above 16.32 bolsters the case for higher targets, while a fall below 15.87 would strongly suggest a completed impulse up.
Thanks Lara.
Gold is forming another HnS in 1 hour period.
NL: 1218-1219
Head at 1198 with positive divergence unbalance double bottom
LS:1211
RS : 1212. Current trading level.
Once gold price clears NL it will target 1235.
A good sign of a sector’s trend confirmation is when chart formations and TA gets confirmed by price action.
SInce Dec 21 small HNS and EW counts have been proving the point.
Gold’s trend is up!
Papudi. Thanks for the information.
Just some thoughts to kickstart this week.
Although price in the Alternate Hourly can move higher than last week’s high of 1218.43, I do feel that its case will be weakened if it does so (and so far it has forayed as far as 1218.86).
From a fundamental standpoint, Trump’s inauguration had instigated the current rise in the gold price. His campaign promises of a conducive business environment was considered inflationary, and inflation means high interest rates and a stronger dollar. That his speech was absent these, investors began to become unnerved, entertaining second thoughts about his ability to run the country. In the fundamental case, the thinking is that the direction of gold prices over the near-term will be determined by which way Trump decides to present himself. If he decides to get things done that will improve the country then gold will be pressured. If he decides that it’s his way or the highway then gold will continue to be underpinned because investors will seek protection as they sense his failure as a leader.
In the near-term, I am watching 1218.43 and the low of 1198.79 closely.
Should price strongly push above 1218.43, then the 1220-1225 region (which was strong support in the past) would become strong resistance. A move through this region will signal a resumption of the uptrend. This would set up the market for a possible rally into the 1235 area (possibly even 1261), as the Main Count purports.
If 1198.79 fails as support then the trend will change to down and the market will start an eventual correction back to 1173 followed by 1160, as indicated by the Alternate Hourly Count.
Let’s see how traders are going to feel after digesting the news over the weekend.
Lara:”The first in a series of second wave corrections for Gold’s new impulses is usually very deep. Intermediate wave (2) is expected to be at least 0.618 the depth of intermediate wave (1), and very likely may be deeper.”
It is so true.
At the beginning of gold trend change in 1999 the wave II correction was deep almost 95 % (-21.5% from top) from 326 to 256 and lasted one year or longer.
The current trend change from Dec 2016 primary wave 2 has lasted close to 6 month and corrected 18%+ ending at 1123.
Lara: is it possible for you to include additional longer period daily (from beginning of the trend change) and one hour count (last one month) charts atleast once a week?
That give me a bigger picture of wave structure.
Thanks.
Okay, I’ll keep this in mind this week.
Hopefully we get some clarity on the GDX count early next week.
My main count calls for 3-4 more down days toward a target of 21.40
An upward breakout above 23.56 would likely mean that Intermediate wave 3 up is already in progress.