
A lower high and a lower low moved price lower for Monday’s session, which is overall what the main Elliott wave count expected. A public holiday in the USA for Presidents Day saw markets very quiet.
Summary: The target for a deep pullback is at 1,148. Corrections along the way down present opportunities to join the trend. A very deep second wave correction may have ended. This is more likely than the alternate scenario, which today sees Gold in a third wave up at three degrees. Classic technical analysis is more bearish than bullish.
One approach to managing the main and alternate wave counts may be to assume the main wave count is correct, so to assume a short position with a stop just above the invalidation point at 1,244.89. If this price point is breached, assume the alternate is correct and be prepared to quickly switch from bear to bull.
Follow my two Golden Rules of risk management:
1. Always use a stop.
2. Invest no more than 1-5% of equity on any one trade.
New updates to this analysis are in bold.
Last monthly and weekly charts are here. Last historic analysis video is here.
Grand SuperCycle analysis is here.
MAIN ELLIOTT WAVE COUNT
DAILY CHART
Click chart to enlarge.
There is an alternate wave count that differs at the weekly and monthly chart level. At the daily chart level, the alternate also expects overall more upwards movement, but it will not be published daily while it does not diverge from this main wave count. See historic analysis linked to above.
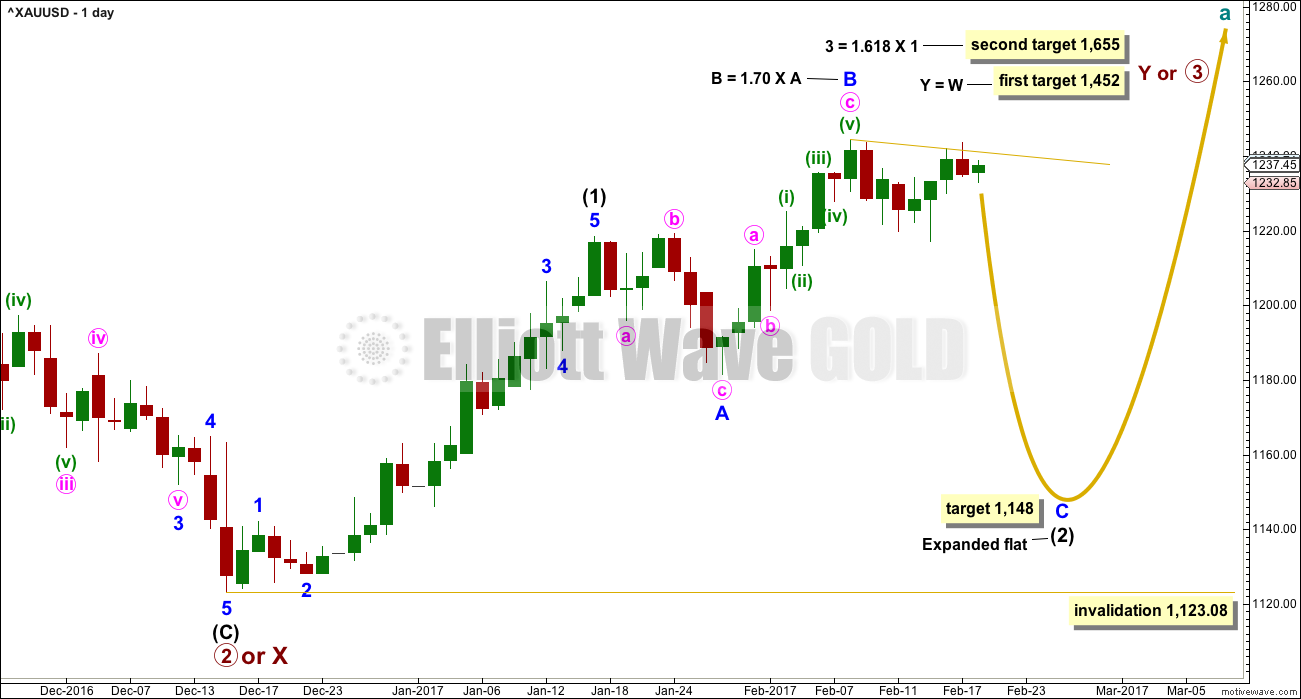
This main wave count expects Gold has had a primary degree trend change in December 2016. The new upwards wave is either a primary degree third wave, or a primary degree zigzag to complete a double zigzag.
Intermediate wave (1) is an impulse that lasted 23 days, two longer than a Fibonacci 21. Intermediate wave (2) may be unfolding as a very common expanded flat correction.
Within intermediate wave (2), minor wave A fits best as a regular flat and minor wave B is a zigzag. Minor wave B is longer than the common length of 1 to 1.38 times A, but within the allowable convention of up to two times the length of A.
The appropriate target for minor wave C is 2.618 the length of minor wave A.
So far intermediate wave (2) has lasted 24 sessions. Minor waves A and B have lasted a Fibonacci eight sessions each. If intermediate wave (2) exhibits a Fibonacci duration, it may be a total 34 sessions.
Alternatively, intermediate wave (2) may not exhibit a Fibonacci duration.
The alternate daily and hourly charts below will look at the possibility that intermediate wave (2) is not continuing, that it may have been over already.
The longer term targets for primary waves 3 or Y may be met in a total Fibonacci 34 weeks from their start. So far this upwards trend has lasted nine weeks.
It is my judgement today that this main wave count is about 75% likely.
HOURLY CHART
Click chart to enlarge.
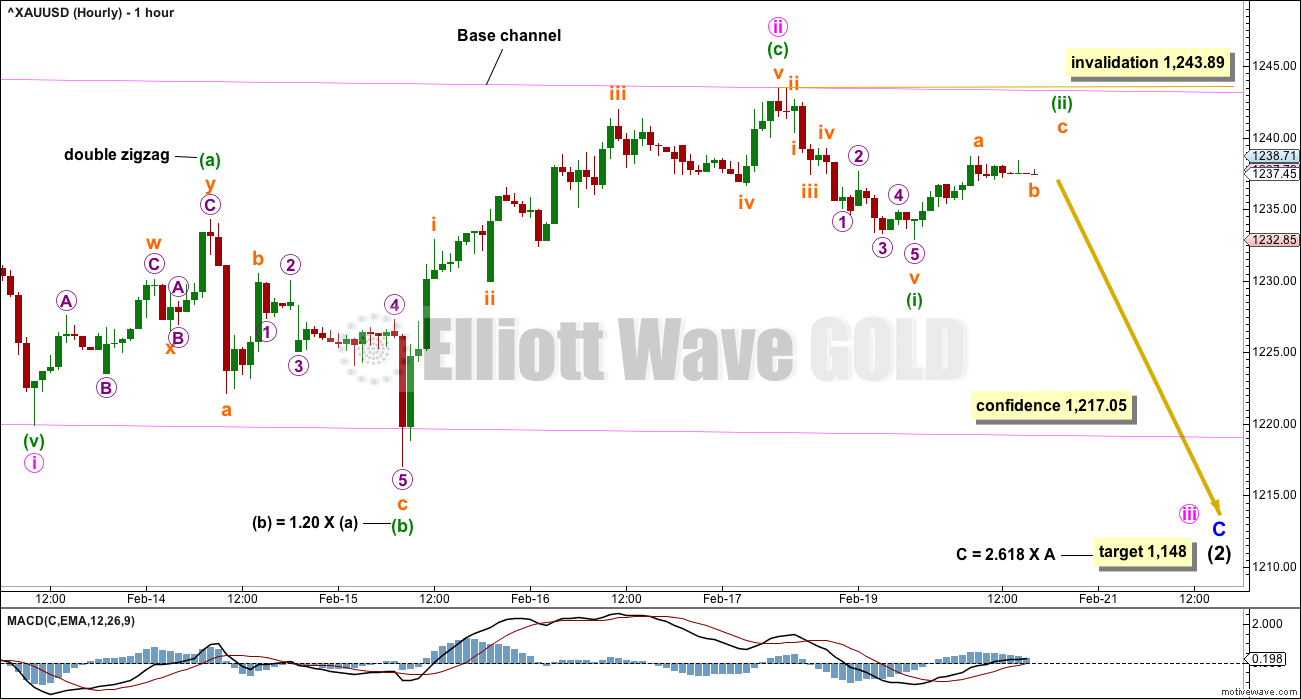
Minute wave ii should now be a complete expanded flat correction. There is almost no room left for it to move into. At this stage. it is a very deep 0.96 correction of minute wave i.
In a new wave, Gold often exhibits a very deep second wave correction for the very first in a series.
At its end, minuette wave (c) no longer exhibits a Fibonacci ratio to minuette wave (a). Expanded flats and deep second waves are common scenarios.
A base channel is drawn about minute waves i and ii in pink. Along the way down, upward corrections should now find resistance at the upper edge of the channel. A breach of the lower edge would provide confidence that a third wave down is underway.
Downwards movement for Monday’s session, labelled minuette wave (i), fits best as a five wave impulse with an extended first wave. Minuette wave (ii) looks to be incomplete, and it may not move beyond the start of minuette wave (i) at 1,243.89.
If this wave count is invalidated now with a new high above 1,243.89, then members would be advised to be flexible and switch over immediately to using the alternate. The alternate would be considered confirmed.
A new low below 1,217.05 would add confidence to this main wave count. At that stage, the alternate would be discarded.
The prior upwards wave labelled minor wave B can be seen as a zigzag for this main wave count. The subdivision has a much better fit for this idea increasing the probability of this main wave count over the alternate below. To see the subdivision within minor wave B see analysis from the 9th of February.
ALTERNATE ELLIOTT WAVE COUNT
DAILY CHART
Click chart to enlarge.
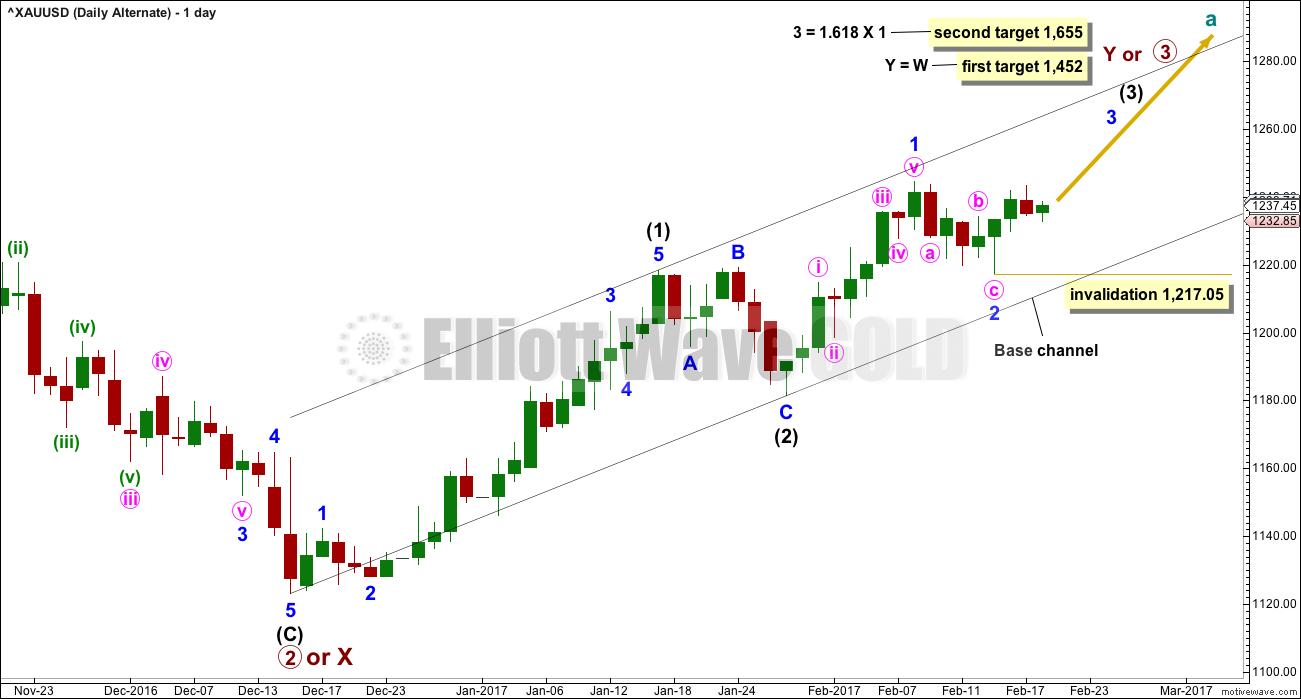
This alternate wave count is an alternate idea to the main wave count. What if intermediate wave (2) was over as a brief shallow regular flat correction? It would have lasted just 8 days compared to intermediate wave (1) at 23 days. It would have been only 0.388 the depth of intermediate wave (1) and this is more shallow than normal for an intermediate degree second wave.
The black channel is a base channel about intermediate waves (1) and (2). Along the way up, lower degree second wave corrections should find support at the lower edge of the base channel. For this reason minor wave 2 looks most likely to be over now.
Within minor wave 3, no second wave correction may move beyond the start of its first wave below 1,217.05.
Minor wave 2 would have lasted a Fibonacci five sessions compared to minor wave 1 at a Fibonacci eight sessions. This proportion looks right.
This alternate wave count expects that the last four days has been the first four days of minor wave 3 within intermediate wave (3). However, a third wave up at two degrees should begin with clear and strong upwards movement. The small range and red candlestick for Friday does not look convincing for this wave count. Now a small range day with overall downwards movement for Monday looks even less convincing. This problem could be overcome if Tuesday sees a very strong upwards day, but at this stage the probability of this wave count is reduced with the behaviour of price.
It is my judgement today that this wave count has about a 25% probability.
HOURLY CHART
Click chart to enlarge.
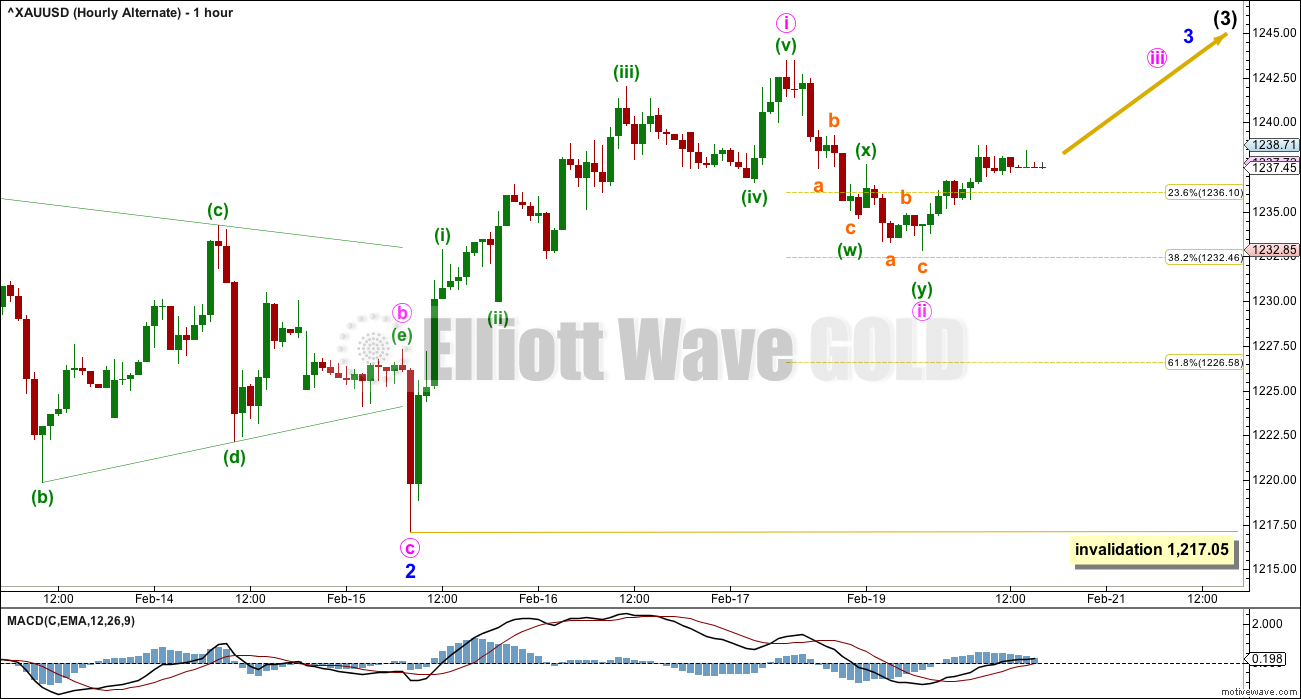
Minor wave 2 will subdivide as a three wave zigzag with a running contracting triangle for minute wave b.
Within the triangle, the final wave of minuette wave (e) falls well short of the (a)-(c) trend line and this does not look right. However, all Elliott wave rules are met.
Minute wave ii should now be a more shallow correction as the power of a big third wave winds up. For this reason the 0.382 Fibonacci ratio would be favoured, but the 0.618 Fibonacci ratio is still possible as a target.
If minute wave ii is over here, then it may fit reasonably well as a double zigzag. However, within the first zigzag labelled minuette wave (w), the first wave down of subminuette wave a looks like a three and not a five. This piece of movement for minute wave ii fits better as an impulse than it does as a correction, so this favours the main Elliott wave count over this alternate.
Minute wave ii may not move beyond the start of minute wave i below 1,217.05.
Within minor wave 1 upwards (now seen only on the daily chart), the structure must be seen as as five wave impulse. This can fit but requires a very rare running flat with a substantially truncated C wave. To see the subdivisions as an impulse for minor wave 1 see hourly charts in analysis for the 9th of February.
TECHNICAL ANALYSIS
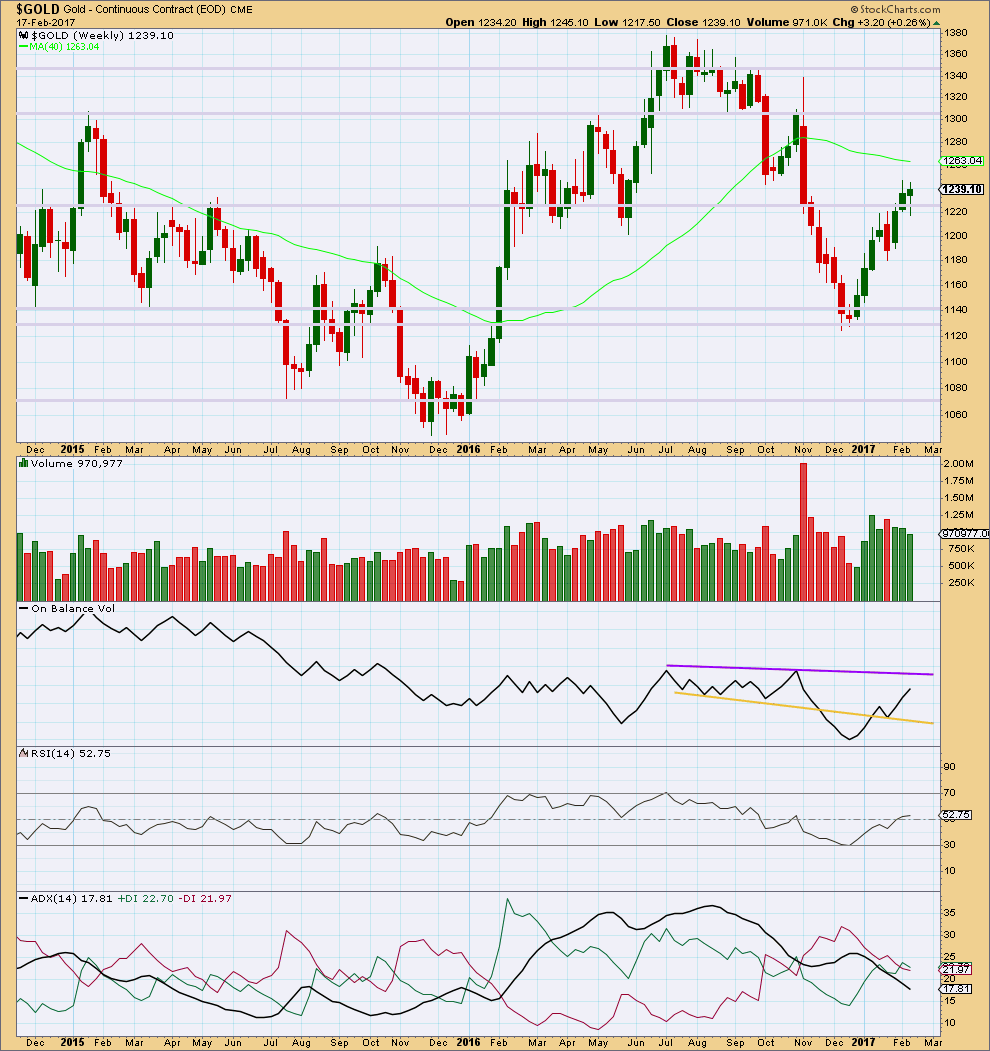
WEEKLY CHART
Click chart to enlarge. Chart courtesy of StockCharts.com.
Price for last week made a lower high and lower low, the definition of downwards movement. However, the candlestick closed green and the balance of volume during the week was upwards. A decline in volume for upwards movement during the week is bearish. The long lower wick and green colour of the candlestick is bullish.
Resistance for On Balance Volume is some distance away as is support. The last break above resistance at the yellow line and backtest of support is bullish.
RSI is close to neutral. There is plenty of room for price to rise or fall here.
ADX is still declining after reaching extreme during the last upwards trend. The +DX and -DX lines have now crossed. If ADX turns up here, then an upwards trend would be indicated.
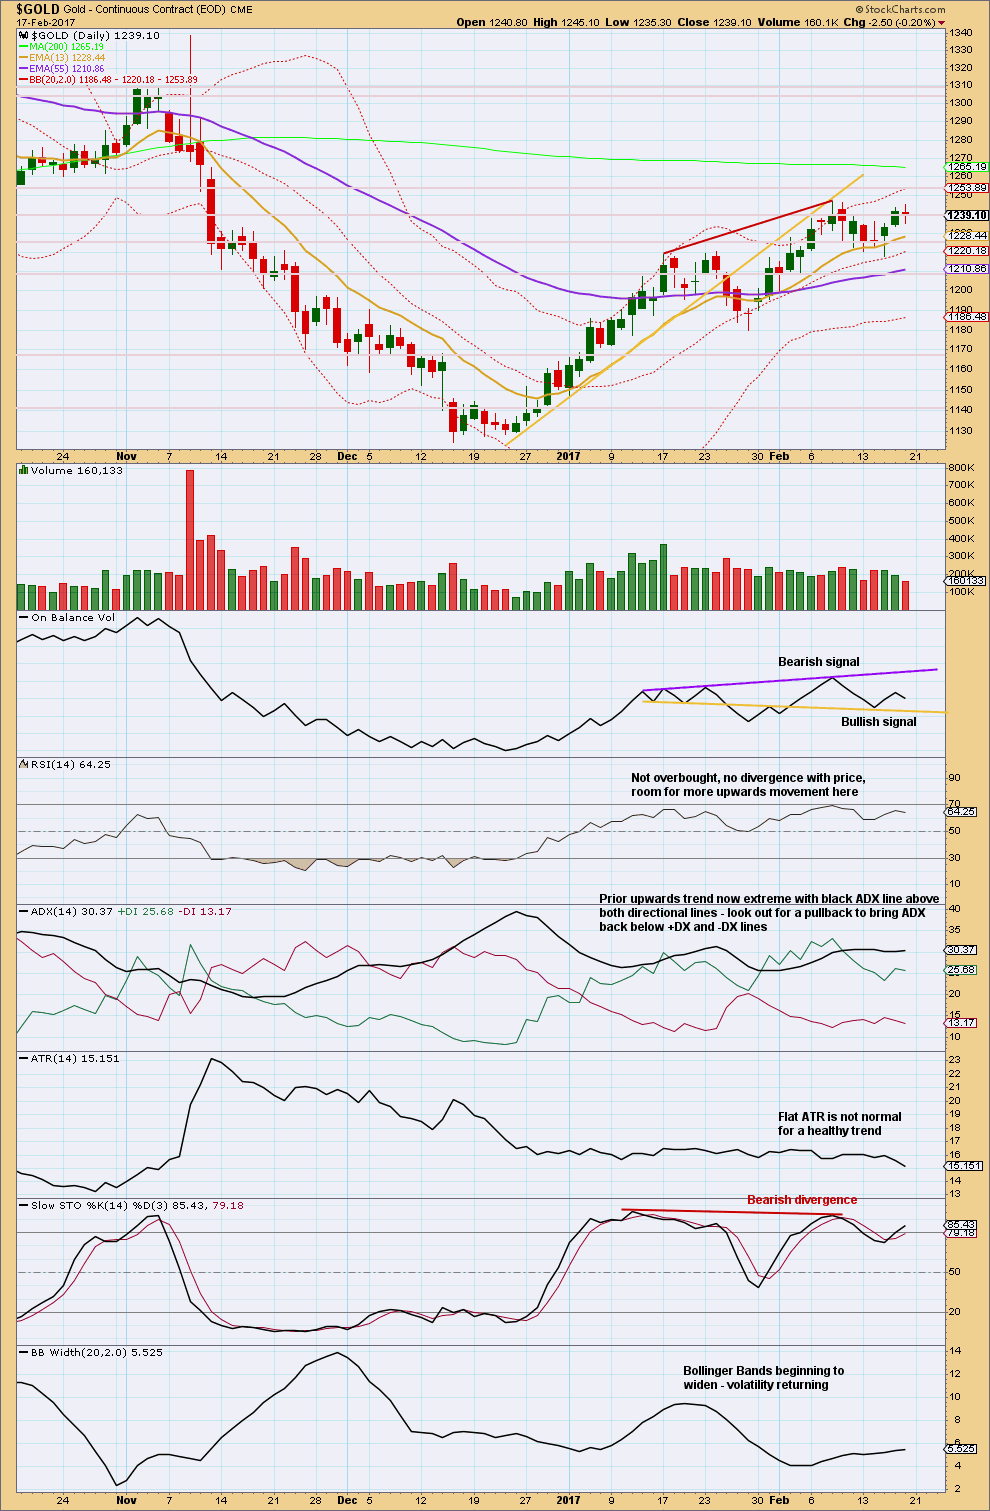
DAILY CHART
Click chart to enlarge. Chart courtesy of StockCharts.com.
StockCharts data is New York session only and the NYSE closed for Monday. There is no new data to analyse today and this analysis is unchanged from Friday.
Friday saw a higher high and higher low, the definition of upwards movement. But the candlestick closed as a red doji, and the balance of volume was downwards. During the session a decline in volume did not support downwards movement.
Price has moved higher for the last three sessions on now declining volume. Overall, this supports the main wave count and not the alternate. Stronger green candlesticks for the alternate should be seen with increasing volume, but this is not happening.
Declining ATR for the last three days also supports the main wave count over the alternate. The start of a big third wave should see decisive upwards movement with increasing range. This is not happening.
On Balance Volume is still bearish.
ADX is still extreme.
Price is now range bound with resistance about 1,245 and support about 1,215 to 1,210. During this period, it is the downwards day of the 9th of February that has strongest volume suggesting a downwards breakout may be more likely than upwards.
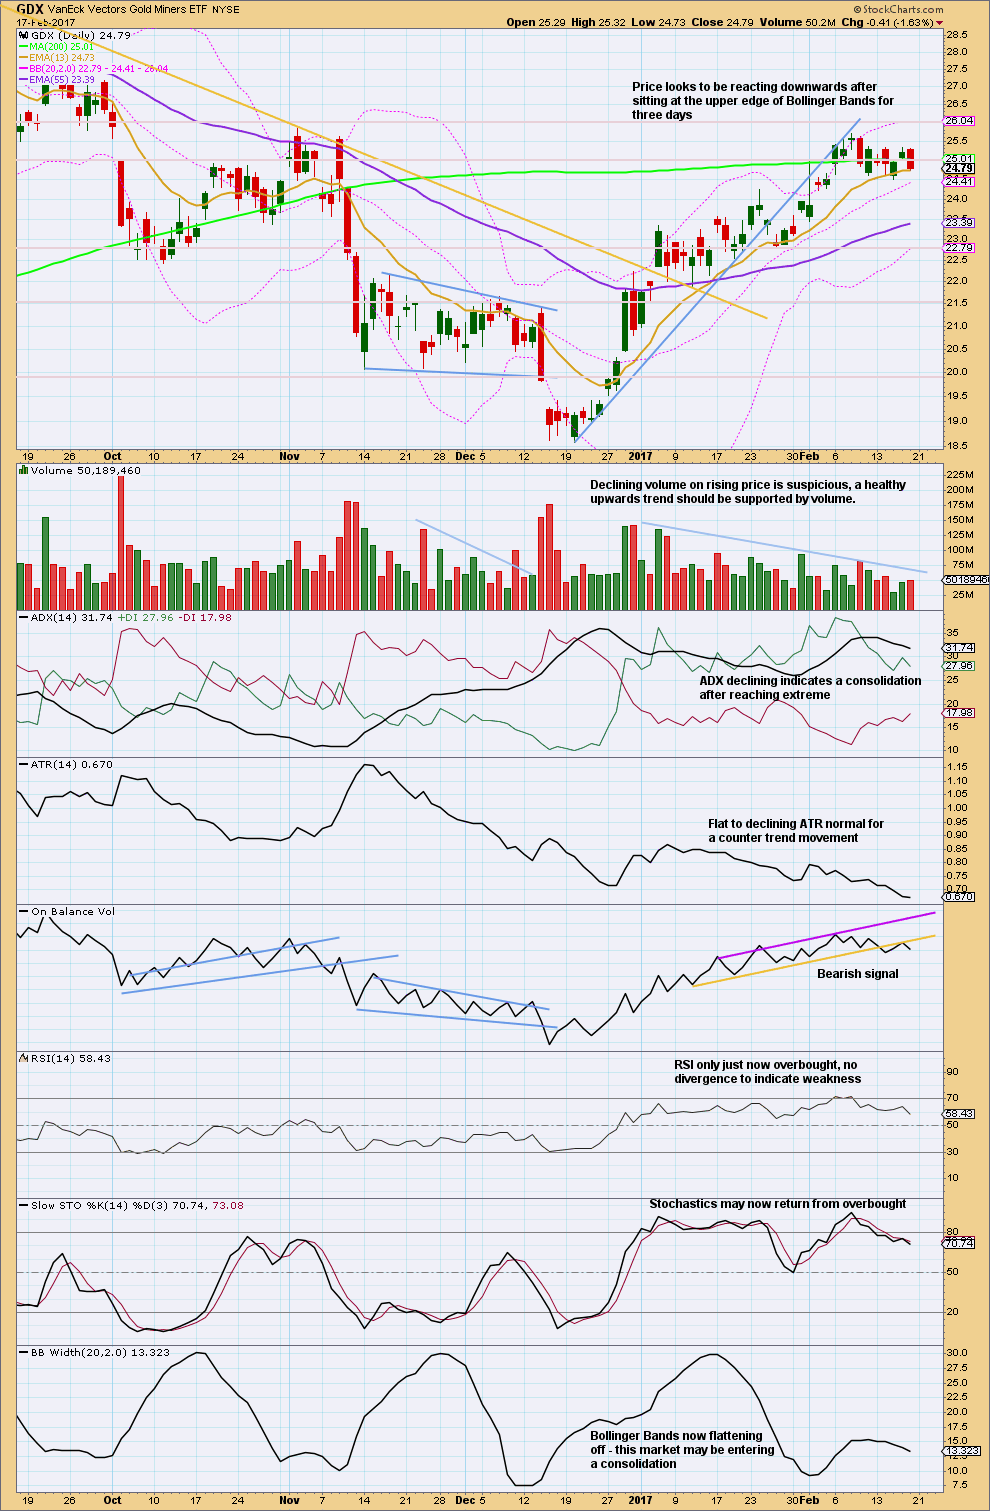
GDX
DAILY CHART
Click chart to enlarge. Chart courtesy of StockCharts.com.
StockCharts data is New York session only and the NYSE closed for Monday. There is no new data to analyse today and this analysis is unchanged from Friday.
It looks increasingly like GDX has entered a consolidation. Resistance is about 25.70 and support is about 24.50. During the consolidation, so far it is the downwards day of the 9th of February that has strongest volume suggesting a downwards breakout may be more likely than upwards.
Some increase in volume for Friday’s downwards day offers a little further support for this view.
On Balance Volume offers another bearish signal for Friday. This supports a downwards breakout. Give this signal reasonable weight; it is often (not always) reliable.
This analysis is published @ 05:11 p.m. EST.
Hi Lara,
Is there any chance you can add the EUR/GBP to your Trading Room please?
Sure, I’ll have to do an EW count on it first. And I’ve never done one for that market, so that takes time. Will do later today.
I’m doing next Trading Room post later today.
So far I’ll be covering EURUSD because it’s trending, USDJPY again because it’s trending and in the early stages, offering good entry opportunities, NGas because a member requested it and it’s in a clear trend, EURGBP because Nick requested it….
Any other requests? I think I can fit in maybe one more today. I’ll see how EURGBP goes.
I’m concerned that the prior wave down is now a zigzag and not an impulse.
Essentially Gold is range bound, with resistance about 1,245 and support about 1,220. And it’s been range bound since the 8th of February.
The main wave count still has a better fit, but I’m going to look at how the alternate may see minor 2 continuing. Because this candlestick absolutely doesn’t look like a third wave of a third wave up.
Updated hourly chart for the main wave count:
As David notes below if another expanded flat is unfolding then the B wave would be well more than 2X the A wave, so I’ve discarded that idea. Which reverts to seeing minute ii continuing.
A combination is a common structure, this fits recent subdivisions. The purpose of combinations is to take up time and move price sideways. The first structure is a flat, so now a zigzag may complete. The invalidation point must move slightly higher, back up to the start of minute ii.
Subminuette C according to main wave count – looks to be another expanded flat completing. Maybe finish around 1242? Then hopefully third wave down will begin in ernest…
Of concern is the B wave of your questionable flat is just over 2x A wave, therefore making it less likely. We may have recently finished a A/B/C correction for minute 2 of alternate hourly chart and starting at hird of a third of a third up. Low of day was at 61% retracement as well from move from 1216 to 1243. So that was reasonable place for minute ii of alternate to stop.
Exactly. The B wave would be remarkably long.
There’s no rule stating a limit for B waves within flats, but when they get longer than 2X wave A the probability it’s a flat is so low the idea should be discarded.
I’ve discarded it.
Thanks Daniel and Lara – noted.
There is a powerful bid under the miners as evidenced by yet another very sharp rebound off this morning’s lows. Of late this kind of move has been very bullish, at least near term…
Lara’s main count is still valid.
Today’s climb was based upon nothing.
I’m expecting a rug pull very soon.
Gann Global agrees. Both their bullish and bearish scenarios envision an imminent pullback.
So far RS of 2 hour period HnS pattern is holding at 1226. If gold moves higher above 1240 than it may attack 1245.
Dreamer may post a better chart than my crude chart of gold in 2 hour period.
It has wolfwaves also 1,2,3,4,and 5 waves
Post from yesterday:
February 19, 2017 at 7:56 pm
Alan:”It does look like another double top formed at 1244.49 / 1243.49, with the low point of 1217.05.”
Yes it is double top and it is a neckline also. The right shoulder of this another inverse HnS is at 1232 like Lara’s alt hour wave count suggests.
Correctly with Lara’s wave count if gold falls below 1217 currently the head of this HnS gold’s main wave count may get validated and this inverse HnS will be negated.
That’s what I see.
I guess if the currencies bounce back from today´s lows, especially everything in €, it is possible to see 1245$. I am very excited about…
I just love that chart Papudi 🙂
Epic.
Can you do me a favour and send alternate hourly update with Fibo´s for an move up.
Looks good with 1226 holding basing off 1232 for a take out of 1235-1237….?
Is it also not possible for the alt count that the point labelled minor 2 may be “a” of a flat correction for 2. This would expect a 5 down to below 1217.05 to avoid a truncation.
Yeah, that’s possible. But with today’s movement it doesn’t look so good.
I’ll chart it and see how it fits.
Interesting juncture – are we continuing down in main count or is this a wave 2 of the alternate?