
Gold is still range bound.
On Balance Volume today is giving a signal for the next direction for Gold.
Summary: Gold has now been range bound for ten sessions. Resistance is at 1,245 and support is at 1,220. A downwards breakout still looks more likely than upwards and with a bearish signal from On Balance Volume today a little more confidence is had in this view.
If price breaks below 1,217.05, the target is at 1,148. If price breaks above 1,244.49, the target is at 1,452.
New updates to this analysis are in bold.
Last monthly and weekly charts are here. Last historic analysis video is here.
Grand SuperCycle analysis is here.
MAIN ELLIOTT WAVE COUNT
DAILY CHART
Click chart to enlarge.
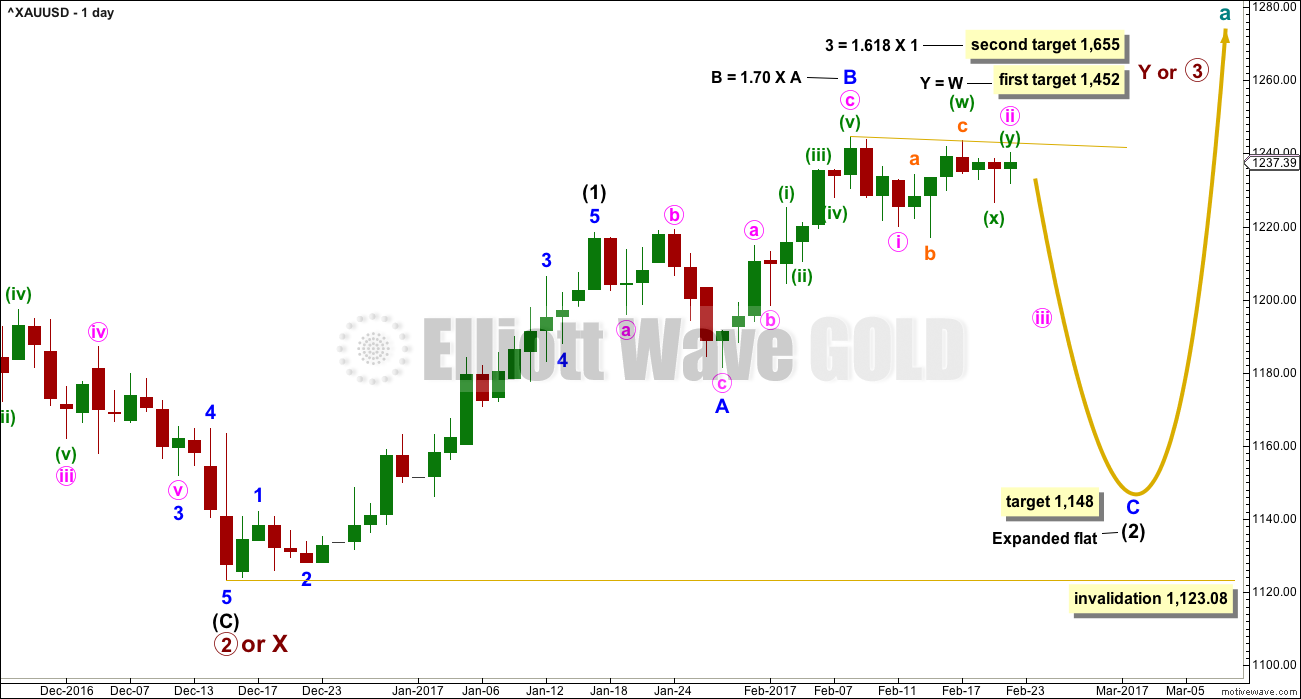
This main wave count expects Gold has had a primary degree trend change in December 2016. The new upwards wave is either a primary degree third wave, or a primary degree zigzag to complete a double zigzag.
Intermediate wave (1) is an impulse that lasted 23 days, two longer than a Fibonacci 21. Intermediate wave (2) may be unfolding as a very common expanded flat correction.
Within intermediate wave (2), minor wave A fits best as a regular flat and minor wave B is a zigzag. Minor wave B is longer than the common length of 1 to 1.38 times A, but within the allowable convention of up to two times the length of A.
The appropriate target for minor wave C is 2.618 the length of minor wave A.
So far intermediate wave (2) has lasted 26 sessions. Minor waves A and B have lasted a Fibonacci eight sessions each. If intermediate wave (2) exhibits a Fibonacci duration, it may be a total 34 sessions. At this stage, it looks like a Fibonacci 34 may now be too brief. The next Fibonacci number in the sequence is 55. Corrections are often more time consuming than the impulses they correct, so this is entirely possible and would still have the right look.
Alternatively, intermediate wave (2) may not exhibit a Fibonacci duration.
The alternate daily and hourly charts below will look at the possibility that intermediate wave (2) is not continuing, that it may have been over already.
The longer term targets for primary waves 3 or Y may be met in a total Fibonacci 34 weeks from their start. So far this upwards trend has lasted nine weeks.
It is my judgement today that this main wave count is about 70% likely, a slight increase from yesterday due to volume analysis.
HOURLY CHART
Click chart to enlarge.
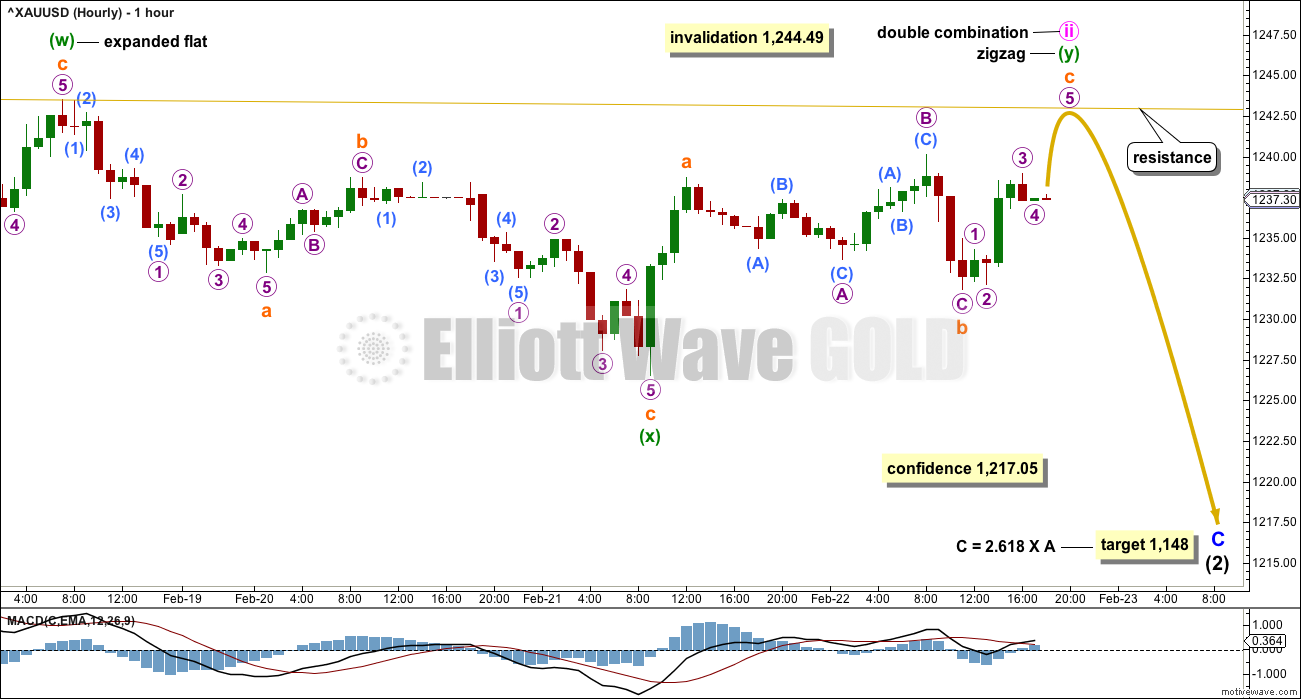
Minute wave ii may be a close to completion double combination. These are very common structures, and it is common for second waves to be very deep. Particularly the first in a series of second waves within an impulse.
The purpose of double combinations is to take up time and move price sideways. To achieve this purpose the second structure in the double normally ends close to the same level as the first.
The structure within minuette wave (y) is changed from the hourly chart that was posted in last comments. It will fit better if it is not quite complete. Within this zigzag, the wave of subminuette wave b fits neatly as an expanded flat. Subminuette wave c may be an incomplete five wave impulse with the final fifth wave up to find resistance at the yellow trend line, which is copied over from the daily chart.
Within subminuette wave c, the small correction of micro wave 4 may not move into micro wave 1 price territory below 1,234.31. A new low below this point (before a new high) would indicate the structure of subminuette wave c is complete, which would also indicate the entire correction of minute wave ii would be more likely complete.
So far subminuette wave c has moved a little above the end of subminuette wave a at 1,238.74, so it has avoided a truncation. It is possible that it could be over already.
A new low below 1,217.05 would add substantial confidence in this wave count. Prior to that a new low now below 1,231.82 would add some reasonable confidence at this stage.
The prior upwards wave labelled minor wave B can be seen as a zigzag for this main wave count. The subdivision has a much better fit for this idea increasing the probability of this main wave count over the alternate below. To see the subdivision within minor wave B see analysis from the 9th of February.
ALTERNATE ELLIOTT WAVE COUNT
DAILY CHART
Click chart to enlarge.
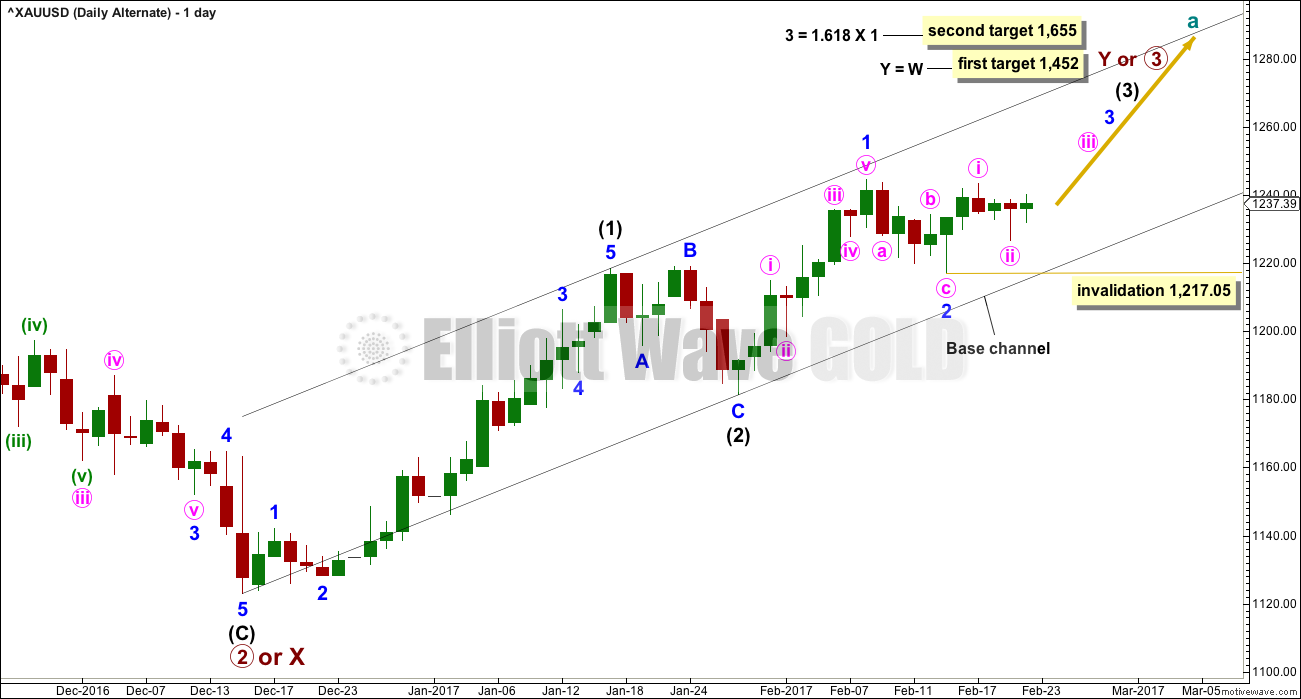
This alternate wave count is an alternate idea to the main wave count. What if intermediate wave (2) was over as a brief shallow regular flat correction? It would have lasted just 8 days compared to intermediate wave (1) at 23 days. It would have been only 0.388 the depth of intermediate wave (1) and this is more shallow than normal for an intermediate degree second wave.
The black channel is a base channel about intermediate waves (1) and (2). Along the way up, lower degree second wave corrections should find support at the lower edge of the base channel. For this reason minor wave 2 looks most likely to be over now.
Within minor wave 3, no second wave correction may move beyond the start of its first wave below 1,217.05.
Minor wave 2 would have lasted a Fibonacci five sessions compared to minor wave 1 at a Fibonacci eight sessions. This proportion looks right.
This alternate wave count now expects that the last five sessions have been the start of a third wave up at two degrees. Now a third wave up should begin here at three degrees. Price behaviour at this stage does not support this wave count. It could be redeemed if a classic upwards breakout occurs such as a strong upwards day to close above resistance at 1,245 on high volume.
The long lower wicks on four of the recent sessions does look bullish. There is some support for this wave count.
It is my judgement today that this wave count has about a 30% probability.
HOURLY CHART
Click chart to enlarge.
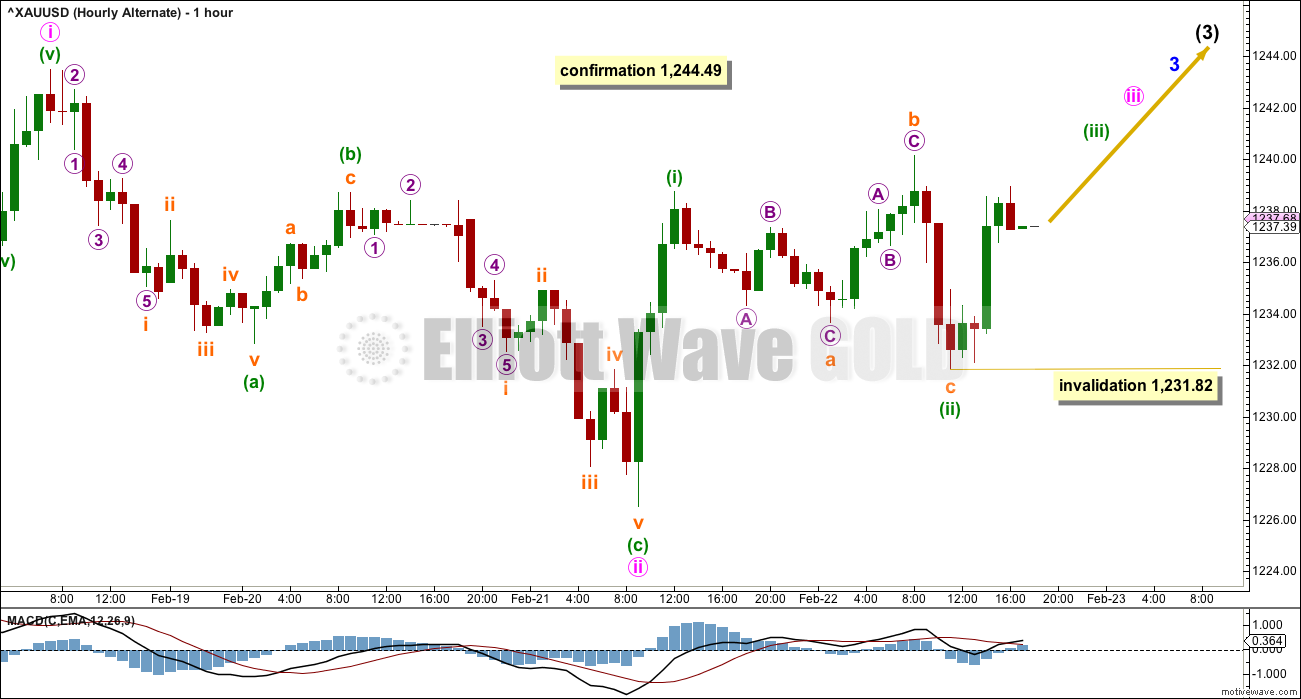
Minute wave ii now fits perfectly as a zigzag, ending almost right on the 0.618 Fibonacci ratio of minute wave i.
Now minuette wave (ii) also fits neatly as an expanded flat, which are very common structures. It is a 0.567 depth of minuette wave (i), so it is relatively deep.
A third wave up now at four degrees should begin. If this wave count is correct, then the next session should see a strong upwards breakout. The fact that this expected strong movement continues to be delayed is concerning for this wave count.
If this wave count is confirmed with a new high above 1,244.89, then it would be the only wave count. At that stage, expect price to keep rising and corrections to become more brief and shallow, and Gold to trend strongly.
If this wave count is confirmed, then members would be advised to be flexible, to switch quickly from bear to bull and trade accordingly.
Please always remember my two Golden Rules for traders:
1. Always use a stop.
2. Never invest more than 1-5% of equity on any one trade.
Within minor wave 1 upwards (now seen only on the daily chart), the structure must be seen as as five wave impulse. This can fit but requires a very rare running flat with a substantially truncated C wave. To see the subdivisions as an impulse for minor wave 1 see hourly charts in analysis for the 9th of February.
TECHNICAL ANALYSIS
WEEKLY CHART
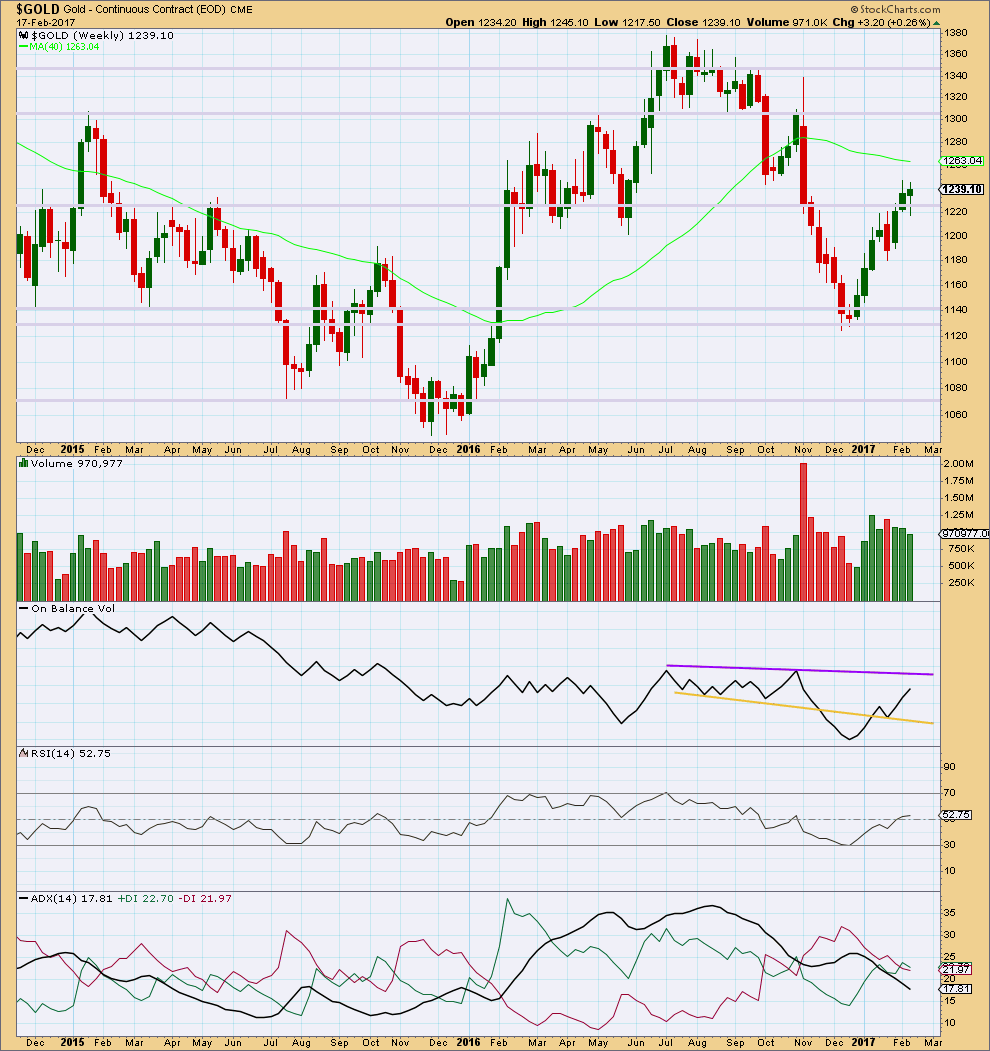
Click chart to enlarge. Chart courtesy of StockCharts.com.
Price for last week made a lower high and lower low, the definition of downwards movement. However, the candlestick closed green and the balance of volume during the week was upwards. A decline in volume for upwards movement during the week is bearish. The long lower wick and green colour of the candlestick is bullish.
Resistance for On Balance Volume is some distance away as is support. The last break above resistance at the yellow line and backtest of support is bullish.
RSI is close to neutral. There is plenty of room for price to rise or fall here.
ADX is still declining after reaching extreme during the last upwards trend. The +DX and -DX lines have now crossed. If ADX turns up here, then an upwards trend would be indicated.
DAILY CHART
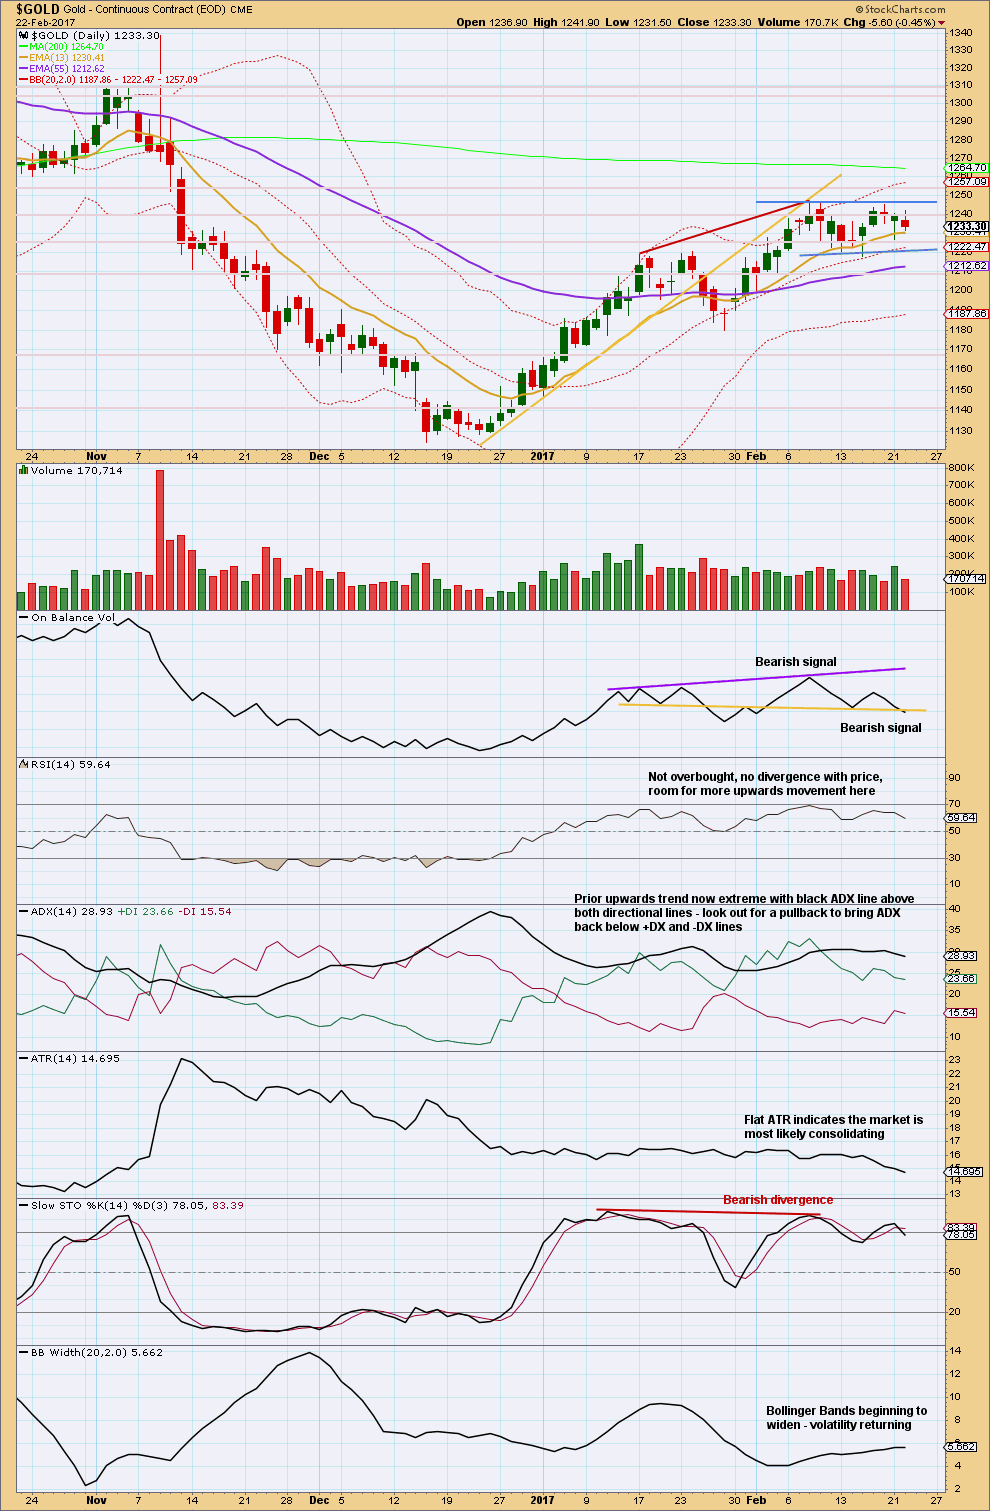
Click chart to enlarge. Chart courtesy of StockCharts.com.
Gold is range bound now with resistance about 1,245 and support about 1,220, delineated now by blue trend lines. The bottom line is we should now wait for a breakout and then join the next trend.
This session moved price lower with a lower high and a lower low, and the balance of volume was downwards, so it is read as a downwards session although it closed green.
During this range bound period, it is the day of the 21st of February that has strongest volume suggesting a downwards breakout is more likely than upwards. This technique does not always work, but for Gold it does work more often than it does not. It points to probability, not certainty.
On Balance Volume may be breaking below support. When OBV breaks trend lines while price is range bound, it may indicate the next direction for price. On Balance Volume usually works well with trend lines; again, this points to a balance of probability, not certainty, but this technique works more often than it fails.
GDX
DAILY CHART
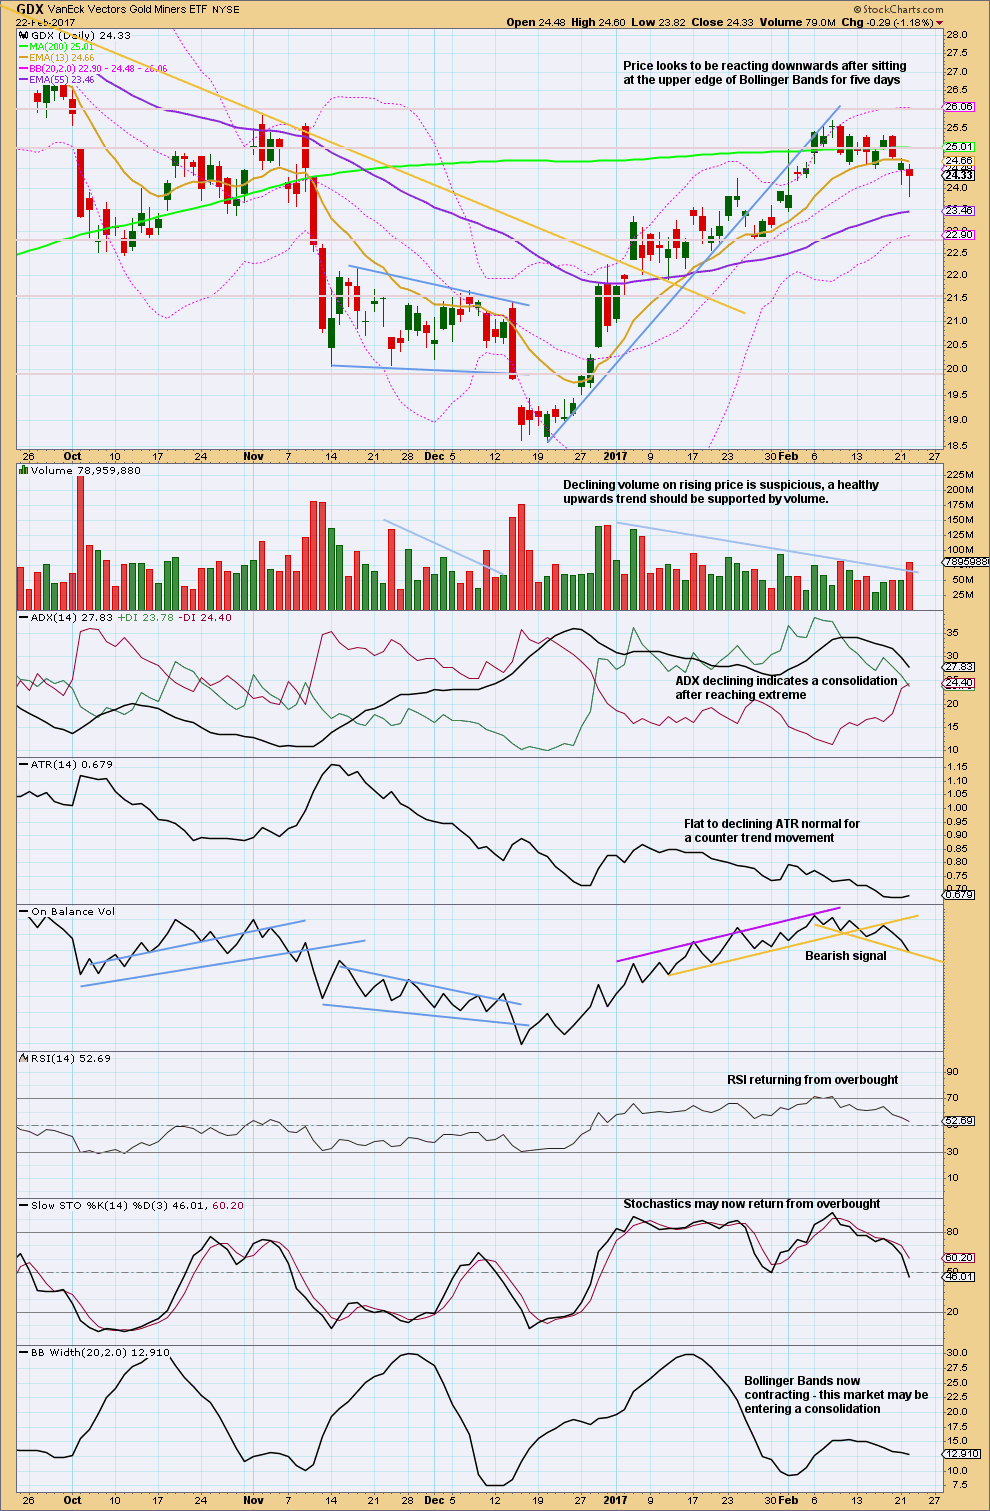
Click chart to enlarge. Chart courtesy of StockCharts.com.
It looks like GDX is breaking out of a small consolidation downwards on a day with high volume. The long lower wicks on the last two daily candlesticks does give some cause for concern here though.
On Balance Volume for GDX gave a strong bearish signal with a break below the upwards sloping yellow line.
This analysis is published @ 07:06 p.m. EST.
Lara’s MAIN count:
Likely meant to express Minuette (iii) = Minuette (i) X 2.618 @ 1269.
No, I just rechecked my calculation
I mean minute iii (pink circle) to reach 2.618 the length of minute i at 1,296.
I’m not providing a target for minuette (iii) (green) because minuette (iv) for that wave count should be very brief and shallow.
Thanks…Lara
Barrick Gold has gone red. Lost all its gains for the day. ..
Good point, with gold breaking out we should be getting new highs, we aren’t. This could be a false breakout or we could possibly get some backing and filling first.
Main wave count (in analysis was alternate, now is the main wave count with confirmation above 1,244)
Hourly chart updated.
An impulse currently looks incomplete upwards. Micro 4 may not move into micro 1 price territory below 1,238.96.
Minute ii is very deep, so the appropriate Fibonacci ratio for minute iii is 2.618 to minute i.
Thanks, for the frequency of your updates recently, Lara.
One suggestion going forward though, to avoid confusion. Instead of switching back and forth between “Main Wave Count” & “Alternate Wave Count”, why not just call them Bullish Wave Count & Bearish Wave Count, from now on?
As before, just feature the one you have greatest confidence in, as the primary (bullish or bearish).
As a student of EW I would find that quite confusing. I’d have no problem with Main Bullish Count and Alternate Bullish Count though if you are just wanting immediate clarification of the direction of trend at a given timeframe.
The switching back an forth is actually a sign of an excellent elliotician imho, albeit I can see how it is confusing (and just as frustrating for Lara as the rest of us.).
Great idea, Olga!
Yes, I too think that Lara is excellent.
Absolutely. I remember how delighted I was the first time I came onto Lara’s site and saw how she always had an alternate. It was the thing that frustrated me to no end with the work of the “other guys”. Some people mistakenly attribute that to vacillation and in my view demonstrate their ignorance of the fact that what we are engaging in is an exercise in probabilities….it is also possible for a main and an alternate to be both either bullish or bearish…. 🙂
The correct way to do it is have a “main” and “alternate” or more than one alternate.
As classic analysis and EW structure change then they can switch in probability.
I know that a great many members don’t like it when I switch, but that is the nature of markets. They change, and probability changes.
I agree with Olga. It would be confusing to just label the counts bull and bear. I need to rank them in order of probability, and that is what the labels of main and alternate does.
My 2 cents… Just call the charts Rock, Paper Scissors. ha ha.
As long as Laura doesn’t change the individual overall direction of her Rock chart or Scissors chart, for example, and merely switches the way they are presented for probability, no one should get confused. What’s confusing to me is an “alternate” one day is r e n a m e d to a “main” a different day, and then a week later it could be the “alternate” again. So unless you reference the date she published how do you know what chart someone is talking about? If she just keeps the same name to the particular presentation she is making — we should be alright. It will also be easier to go back through time and follow the development of the elliott wave counts… how they evolved…. which one(s) are actually tracking. The same chart name no matter what date it is.
Personally it doesn’t matter what they are called, and as long as any “new” count is given a new name. So rock drops out and now we have boulder or pebble. And then for Monthly and super cycle counts, well its obvious isn’t it– we have the Forrest and the Urban Area and the Ocean, and my my the scissors in the ocean?? I digress. Good traders will be interested in being organized. Please don’t put my paper chart under the scissors name holder. No one likes to open their chocolate covered cherries and find sweater buttons inside. (I think wrong labeling is a pet peeve of mine, kinda like false advertising) Besides, don’t you like rock, paper scissors?? lol
Todays move sure was a pleasant surprise. No matter what horse is in the lead I’m glad Laura evaluates them diligently for us. Looking forward to seeing if the EW charting changes Laura makes today with a new alternate are “the one”.
I wonder if being called Laura is one of Lara’s pet peeves 🙂
An alternate idea. An expanded flat for intermediate (2), minor B either over now or soon. If it continues higher the target for minor C moves correspondingly higher.
Intermediate (1) over at the last swing high actually doesn’t look too bad. Doesn’t look quite as good as the main wave count though.
Volume for todays session when its over will be important. If today has strong volume it will be a classic upwards breakout and we should read it as such.
I like the idea of a more shallow correction. This could work good with my GDX count
I’m going to let volume today lead. If it’s strong then we should be bullish, that would be a classic upwards breakout.
If volume isn’t strong then the breakout may be false and the new alternate may be correct.
I’m not going to let GDX or Silver lead my Gold analysis.
IMO the gold equities are indicating, nay SHOUTING, that this, or something similar, is the correct count.
Did anyone here follow my trading advice to close shorts and open a long if 1,244.49 was breached?
I wanted to open a limit order to do that, but annoyingly my platform wouldn’t let me. And I don’t currently have second account for hedging 🙁
Did you try a “buy stop limit”?
No, I was just trying a regular limit order. OMG what a doofus. Yeah, that works. Thank you so much Dreamer!
🙂 was long 1228 on Tuesday, shorted at 1237 for 1232 and went long on Wednesday for a short at 1238 today, got bumped off with a stop at 1242; was expecting a pullback today, gold price has gone the other way lol…. oh well…. short again now at 1249 lets see what happens … Thanks Lara for all your comments and fabulous analysis. GL all!
Still figuring out this new broker platform…. maybe I should use their help function 🙂 🙂
I am long, but did Not get the benefit of 3/4 of this morns move (I have been trading in/out rather than holding). Watching carefully now.
Lara…your thoughts on Dreamers and others poss. interpretation of a Minor B, not yer complete; as compared to your ALT count?
Have a good day…
It would be too long now. But I do have a new alternate idea.
No I open a short position. Plus minus seven dollar is in my scope!
I did, short closed via sl and break even. Long triggered at 1246. sl now moved to BE. So, even if it’s a false BO I’ll be okay.
Perfect. Nicely done.
Yes Ma’am; the picosecond it did!! Or was it a femtosecond…? Anyway it was fast!! 🙂
I agree with Dreamer. This could be the end of intermediate 1 or the end of B in a flat for intermediate 2 as per Dreamer’s chart below.
This may be a legitimate breakout on gold and we may be on our way up with the alternate count.
That said, I have some concerns:
1) Silver is weaker than gold today. It should lead.
2) Miners, so far, are not showing the strength that you would expect with a big move up in gold.
3) GDX is still below the lower channel that I show in my chart
4) This could be a “fear” move for gold based on the US Treasury Secretary’s comments. If it is a “fear move”, these are often quickly reversed.
5) The move up could be a sharp / fast /short move up out of a triangle for gold. These are often quickly reversed
The BEAR may or may not be dead
Let’s see what Lara thinks….
https://www.tradingview.com/x/SY4SoeRz/
Gold new highs, but miners lagging. This is generally a negative sign for the metals. Miners have been leading this new bull market since the Dec. lows. Anyone have any thoughts on this?
Meanwhile, Gold ($1233/oz) has held up better than the miners and that is usually a short-term bearish signal. If it loses $1220/oz then it figures to test $1200/oz and perhaps $1180/oz. On the other hand, if Gold is able to close above $1245/oz it could test $1250/oz and $1265/oz (200-dma) and pull the miners higher temporarily. Sentiment in Gold did not change that much with the recent rally and that tells us there shouldn’t be too much selling pressure if this fledgling correction continues.
Above quote is a short paragraph from The Daily Gold update yesterday.
Copper got smashed and plenty of majors have had that as a tailwind of late as many have significant production. Also 1250 important support/ resistance. Some may think this move will break lower
Copper just broke an important trend line. Now I’ll watch it to see if it comes up to test resistance. If it does that it may offer a good short entry point.
One of Trumps most difficult lessons will be the realization that the stock market does not always go up. The Trump bump will turn into the Trump dump. This will cause a major blow to his ego. Who will he blame? how will he handle it? It will be a revelation imho.
Trumpty Dumpty sat on a wall …
Trump is very thin skinned. Nevertheless, he is truly my hero. Love him more every day.
Agree. Moving the US back to what the Founding Fathers intended: Less government – not looking to government to solve their problems – and greater individual freedom to the citizens. Europe also seems to be moving in this direction with Brexit and France and Netherlands polling for their upcoming elections.
Long run should lead to higher GDP growth in US but US has a Massive entitlement problem (debt) to deal with with the Baby Boom generation just starting to receive Social Security and Medicare benefits which are 75% of government spending today and will move to 90% of all government spending…unsustainable. i.e. Greece. Could be devastating drag on GDP growth in long-term.
Next few years, it should help growth.
Yes..and I’ve heard him say a few times that though the market is stellar right now, he realizes it will eventually and probably soon, see a correction… so it may not be so much of a surprise. But it does appear that much of the financial media is doing everything they can to sabotage his agenda.
I am not so sure about that. President Trump is a lot smarter than most folk think, and than he merely appears to be. He is fully aware that he has inherited a bubble and has in fact stated as much on more than one occasion. His expectation of an economic collapse is the exact reason he has been advocating for massive infra-structure spending….
well said Verne
This is amazing! Every competent analyst I know has been expecting the Gold correction to continue lower and look at that chart! Glad I kept those calls…the last few days have been a true test of patience…are we all agreed that we have confirmation of the alternate with this move? Stranger things have happened and we could still some kind of move lower after this strong move to the upside. Any thoughts?
Could be getting the jump on a stock market correction. Commercials have not been going short on this move up because they see more upside.
Main hourly wave count invalidated at 1242.78.
Gold has formed a larger inv HnS where NL is at 1244.
Right below this resistance line another small HnS is formed with NL at 1239. When ever such bullish pattern is formed expect break out above the larger NL at 1244.
Target from this break out is expected to be the Nov high with highest volume. From volume analysis the top of highest volume days always gets tested.
Papudi. Lara’s invalidation point is 1244.49.
I suspect, like I did yesterday, that the Alternate Count is correct. The count for the Alternate looks better. Let’s see if price takes out 1244.49.
My wish is granted.
If you look at the alt hourly wave count wave ii was at RS shoulder of small HnS. Once that is completes next is wave 3rd of 3rd of 3rd of 3rd wave. An explosive impulse waves.
Thats what I see.
Thanks to Lara for providing alt wave counts.
I see a third wave up at 6 degrees, ranging form the current minuette 3 to Cycle A. If correct, it will be a rocket blast off for the foreseeable future.
WOW! I am sure Lara saw it also but did not publish. Hopefully now the main count will be the bullish count and bear will get to hibernation.
That makes perfect sense to me Alan. Stocks should be on the cusp of a fairly substantial downside move….
My guess is this is a time for short squeeze. One test after another to wash out the shorties.
I am pending buy a short if the mentioned invalidation/confirmation point is reached at 1244.49$
Logical place for this pullback to occur
GDX, GDXJ, & SIL all got “sell” signals on American Bulls today. GLD & SLV still on “stay long”. Looks like miners may be leading the correction down. We should see gold and silver follow miners down.
Let’s see, expecting gold price to get dumped today from under 1240 for a break below 1231 with 1229/1226 holding……
GDX hourly over past month. No wave labels, but you can see where GDX is in relation to moving averages and as I read my chart, it appears GDX has developed upward momentum at least for the short term, perhaps only for the open tomorrow as it seems the metals do at every open lately.
We will see, for what it’s worth.
Nice chart. 200 MA seems to be providing support. Widening Bollinger Bands means more volatility. A little more up tomorrow before turning back down would match my EW count.
Again, BarChart has notoriously exhibited a freak spike, this time down below 1234.31 around 7 pm ET, indicating that Minute 2 of the Main Count is already completed. However, this is not shown on other data feeds.
It’s annoying isn’t it.
I do wish they’d get it right. It’s the only data feed I’m actually paying for, and it’s the only one with that problem 🙁
Since we’ve based our analysis on it, it is prudent to continue assuming it is correct until proven wrong. Most of the time, short-term movements can be chaotic but the bigger picture remains clear.
My advice to fellow members who are concerned about erratic short-term movements due to the frenzy / gloom following news releases such as Fed/Yellen/rate hike is to treat this as ants moving towards a target. If someone happens to put an obstacle in its way, such as a stick, then there will be some chaos in the beginning but the uncertainty will die down quickly and the ants will continue on their way. In engineering, we call this a perturbation before a steady state becomes re-established. In layman terms, this distills to “trust your gut feelings”.
Alan,
You DO have a Wonderful way with words!
Seconded. Most perfect illustration Alan, thank you very much.
Hmmm! The collective intelligence of ants. Yes, very much like markets.
Barrick Gold (ABX) is the largest miner in GDX. It has shown a lot of strength, but the move up is looking tired with negative divergence. I’d like to see the lower channel trend line breached.
https://www.tradingview.com/x/YhDjpnj3/
GDX hourly
https://www.tradingview.com/x/F4KL7fQE/
That has a pretty good fit Dreamer 🙂
GDXJ
https://www.tradingview.com/x/ClbC7rm4/
Gold resistance to watch. Decision coming soon.
https://www.tradingview.com/x/MMQoYtQD/
Yep. That’s some pretty strong resistance which has so far held…. if it gives way then we’re in for a big move up I would think.
We have to be nimble here.
The breakout will come soon now. My analysis still points to the balance of probability being down, but probability isn’t certainty.