
Today’s Trading Room looks at Copper, US Oil and FTSE.
To learn what the Trading Room is about see first Trading Room analysis here.
Trading Room will focus on classic technical analysis. Elliott wave analysis will be for support and for targets / invalidation points.
Copper (Spot)
TECHNICAL ANALYSIS
Click chart to enlarge. Chart courtesy of StockCharts.com.
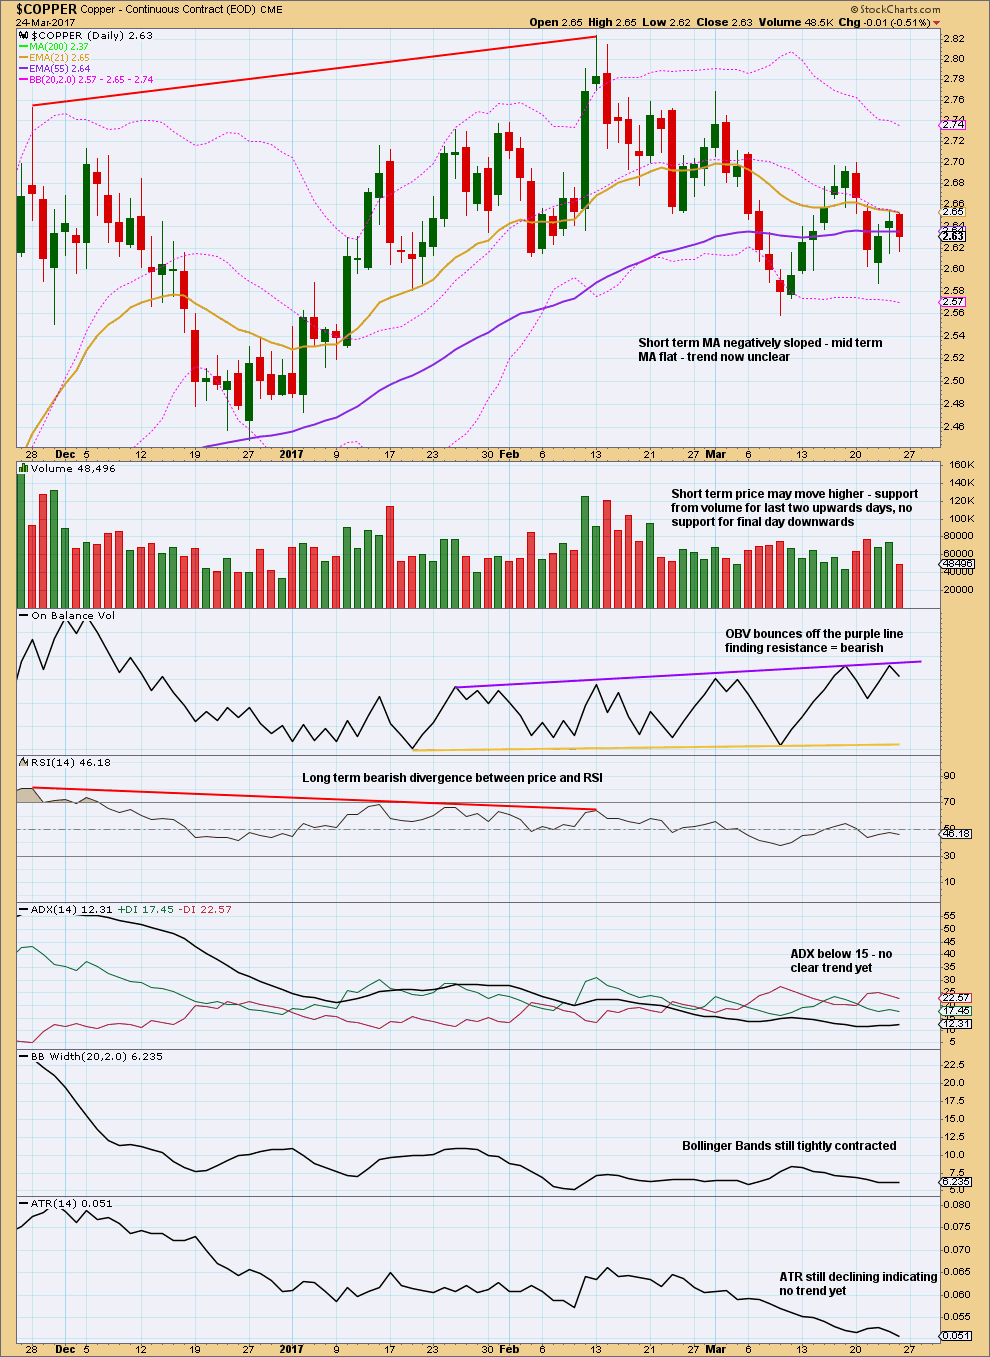
Copper has made a series of lower lows and lower highs (the definition of downwards movement) since the 13th of February. This downwards movement is choppy and overlapping though.
The very short term suggests volume may provide support for a little more upwards movement. If the trend is down, then price should not make a new high above 2.700.
Long lower wicks on the last three daily candlesticks also looks bullish for the short term.
On Balance Volume gives a bearish signal on the 23rd of March, which should be given reasonable weight.
With low ADX and ATR, there is plenty of room for a new trend to develop.
ELLIOTT WAVE ANALYSIS
Click chart to enlarge.
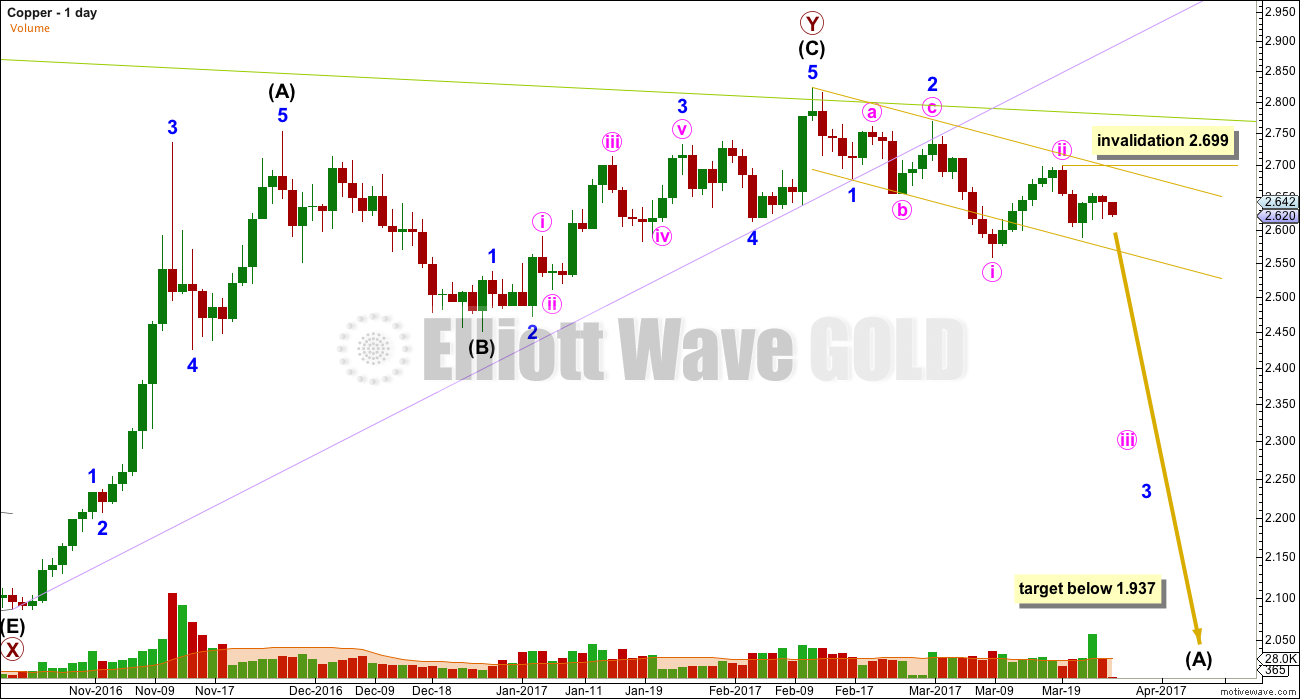
The lower edge of the gold channel did provide support; price bounced up from there. The upper edge should provide resistance.
Trading advice for members only: [wlm_private “GOLD Daily YT|GOLD Daily NT|GOLD Daily NTGR|GOLD DAILY 6M NT|GOLD DAILY 6M YT|GOLD DAILY 6M NT GFR|GOLD Plus Daily YT|GOLD Plus Daily NT|OIL SILVER Weekly YT|OIL SILVER Weekly NT|GOLD Plus Daily 6M NT|GOLDPLUSDAY6M|OIL SILVER Weekly 6M NT|GOLDPLUSDAY1M|GOLDPLUSDAY1MYT|GOLDDAY6M|GOLDDAY1M|GOLDDAY1MYT|OILSILVERWEEK6M|OILSILVERWEEK1M|OILSILVERWEEK1MYT”]Give the bearish signal from On Balance Volume some reasonable weight. Stops may not yet be moved down. But if price breaks below the lower edge of the gold channel, then move stops to breakeven to eliminate risk.[/wlm_private]
US Oil (WTI Crude – Spot)
TECHNICAL ANALYSIS
Click chart to enlarge. Chart courtesy of StockCharts.com.
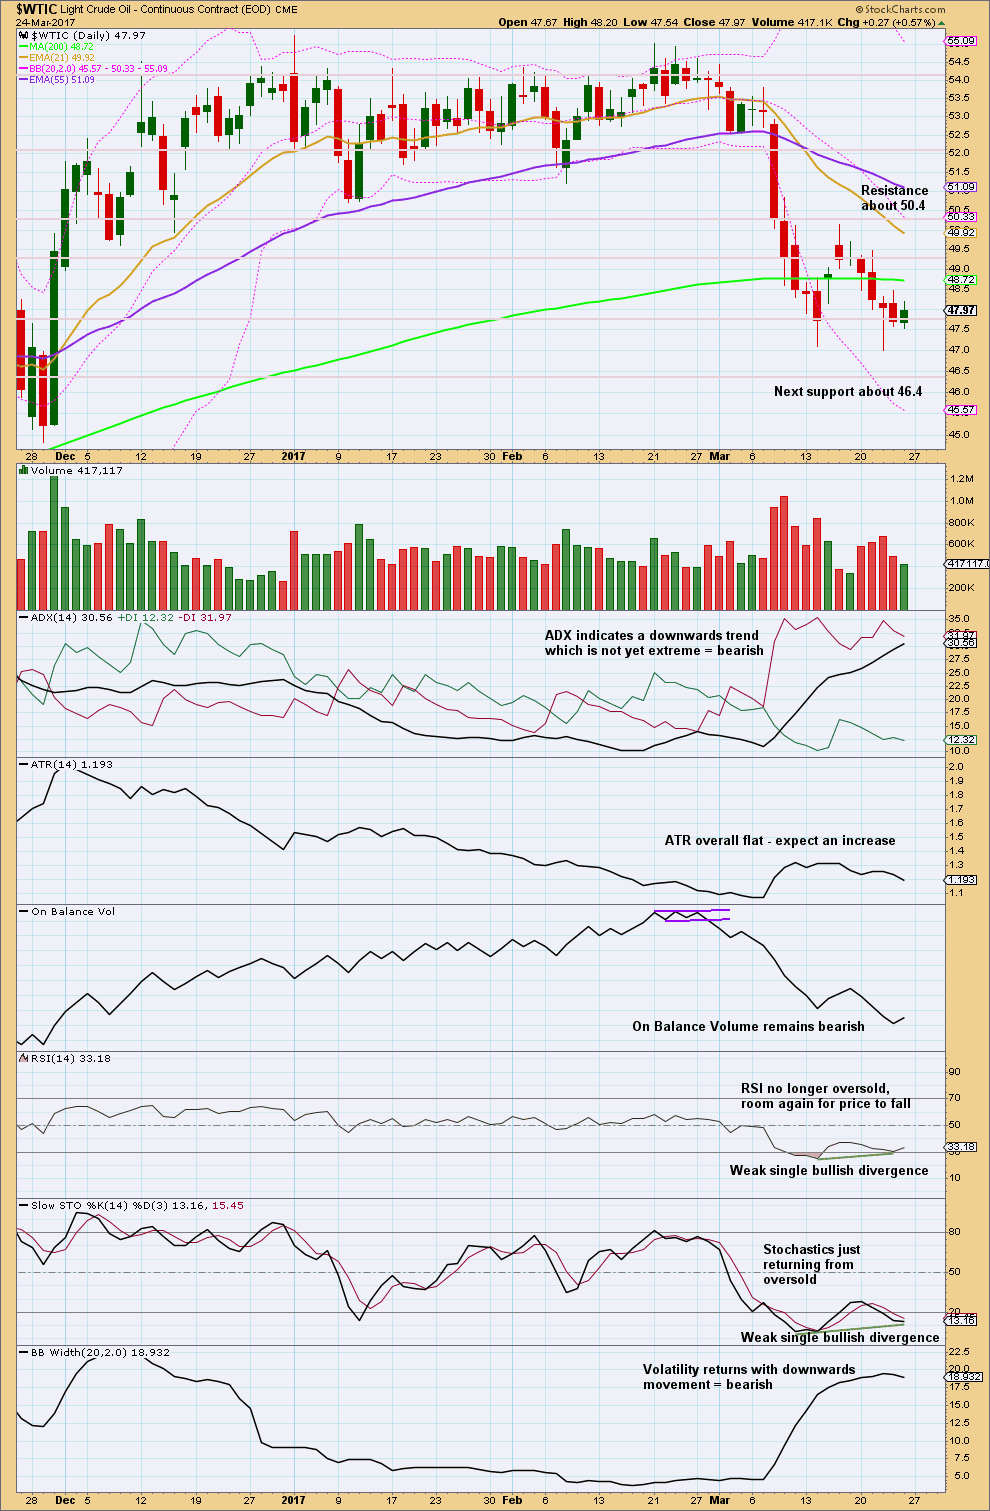
The trend is not yet extreme. There is room still for it to continue. When Oil trends strongly, ADX can remain above 35 and above both directional lines for several days before the trend ends.
There is some concern today that the next movement down is not yet underway. The correction which price moved into on the 15th of March may still be underway. Slight divergence at the last low between Stochastics and price, and RSI and price, looks slightly bullish. The long lower wick on the candlestick for the 22nd of March looks bullish.
ELLIOTT WAVE ANALYSIS
Click chart to enlarge.
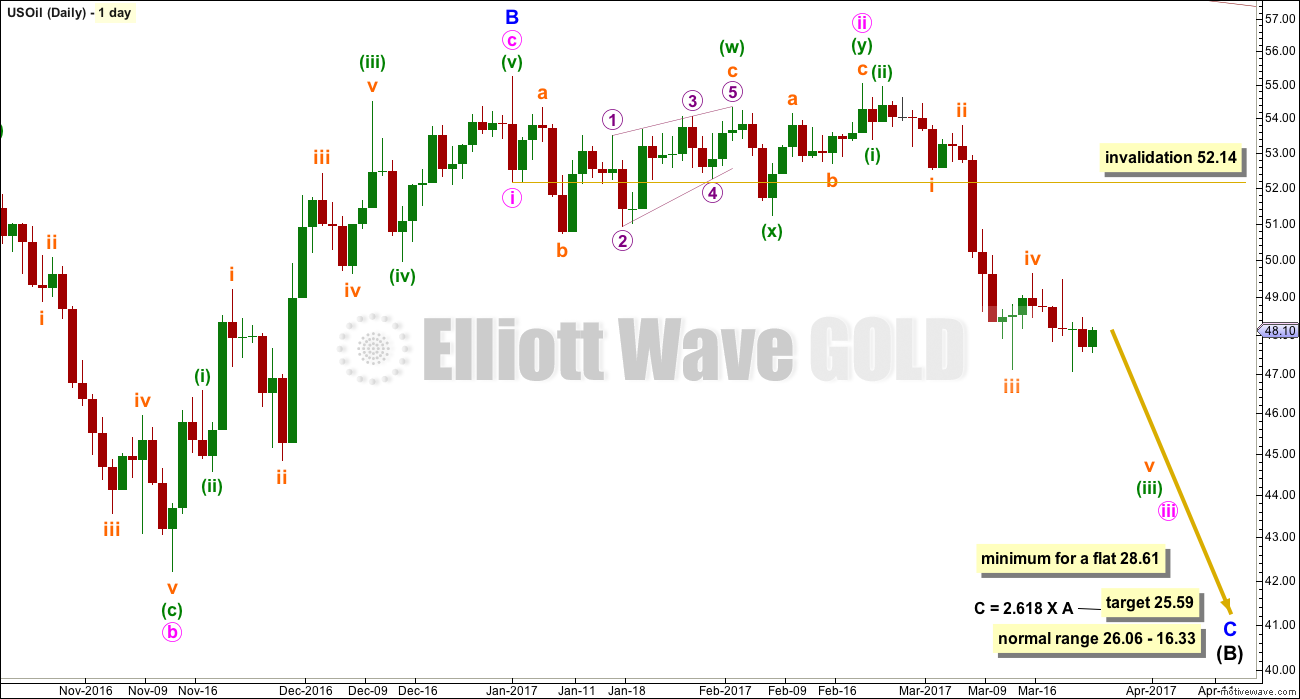
If the Elliott wave count is correct, then the correction should be over. If it were to continue, then it would be grossly disproportionate to subminuette wave ii.
Trading advice for members only: [wlm_private “GOLD Daily YT|GOLD Daily NT|GOLD Daily NTGR|GOLD DAILY 6M NT|GOLD DAILY 6M YT|GOLD DAILY 6M NT GFR|GOLD Plus Daily YT|GOLD Plus Daily NT|OIL SILVER Weekly YT|OIL SILVER Weekly NT|GOLD Plus Daily 6M NT|GOLDPLUSDAY6M|OIL SILVER Weekly 6M NT|GOLDPLUSDAY1M|GOLDPLUSDAY1MYT|GOLDDAY6M|GOLDDAY1M|GOLDDAY1MYT|OILSILVERWEEK6M|OILSILVERWEEK1M|OILSILVERWEEK1MYT”]Positions should now be profitable. Consider moving stops to breakeven to eliminate risk.[/wlm_private]
FTSE
TECHNICAL ANALYSIS
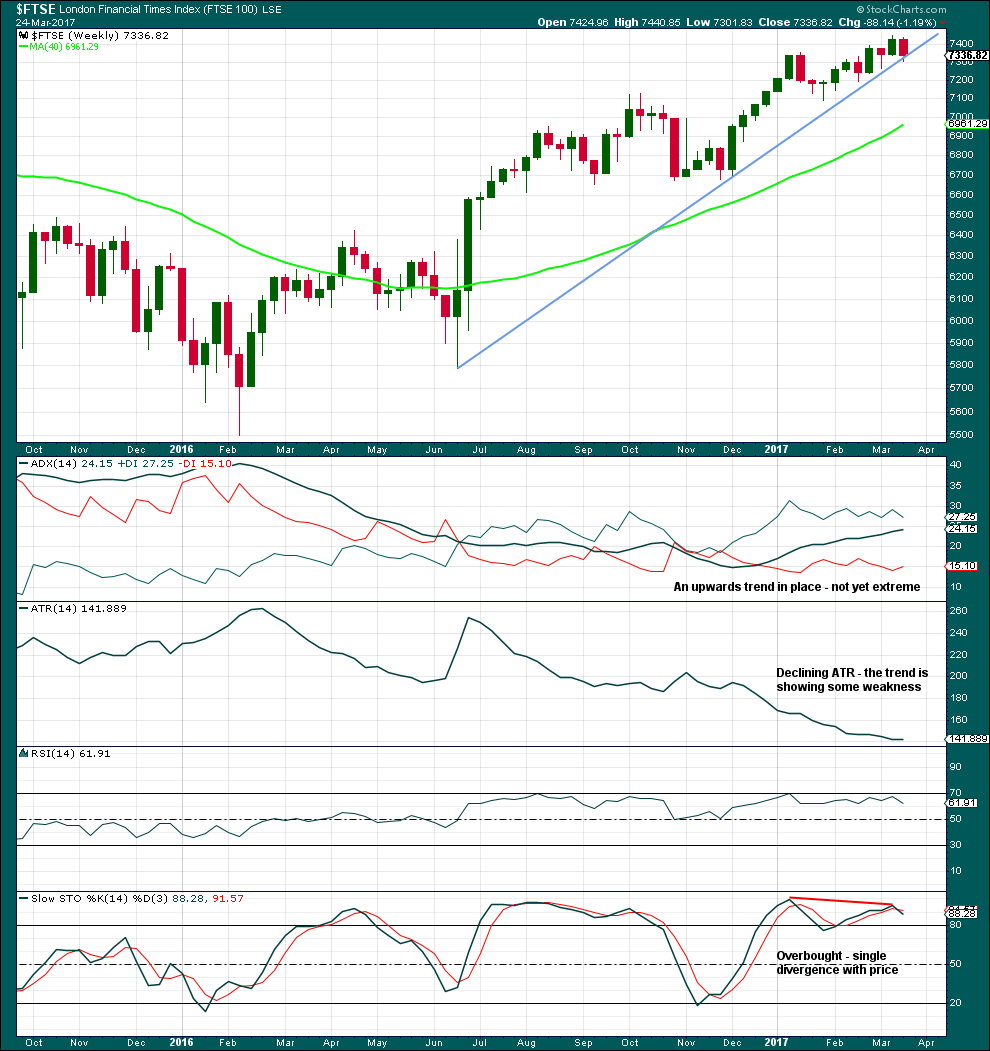
Click chart to enlarge. Chart courtesy of StockCharts.com.
Assume the trend remains the same until proven otherwise. The trend is up at this stage, so corrections present an opportunity to join the trend.
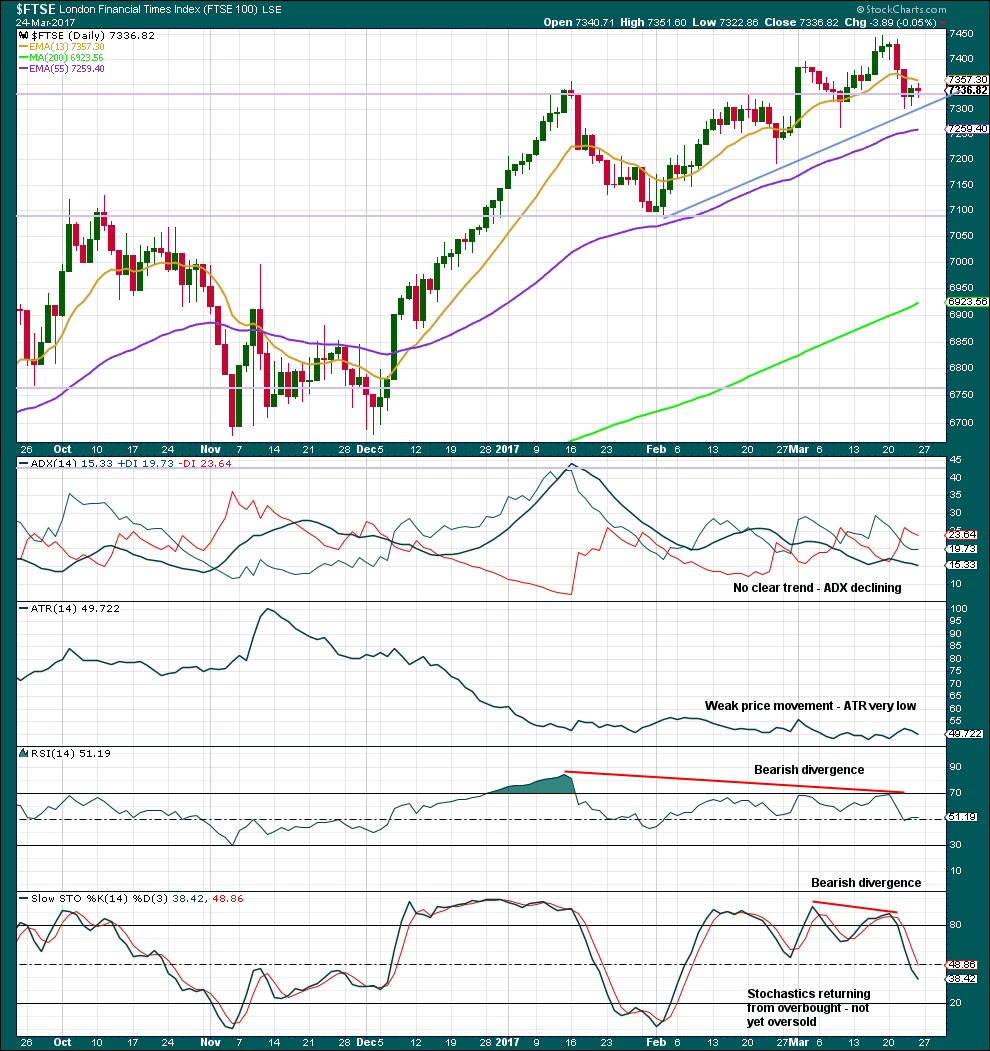
Click chart to enlarge. Chart courtesy of StockCharts.com.
While the longer term trend looks clear, the shorter term trend is not so clear. This can often be the case at the end of corrections within a larger trend.
Divergence with price and RSI, and Stochastics, indicates weakness at highs. This indicates caution for long positions. There is a level of risk here that is not small.
ELLIOTT WAVE ANALYSIS
Click chart to enlarge.
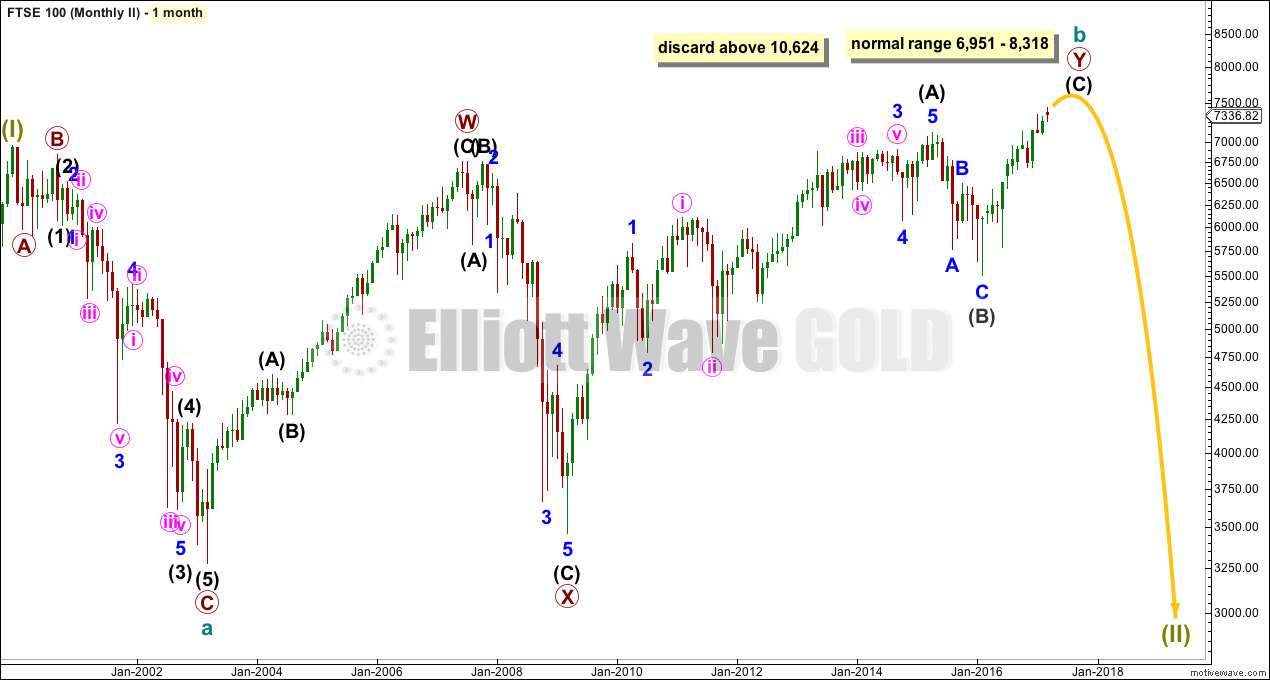
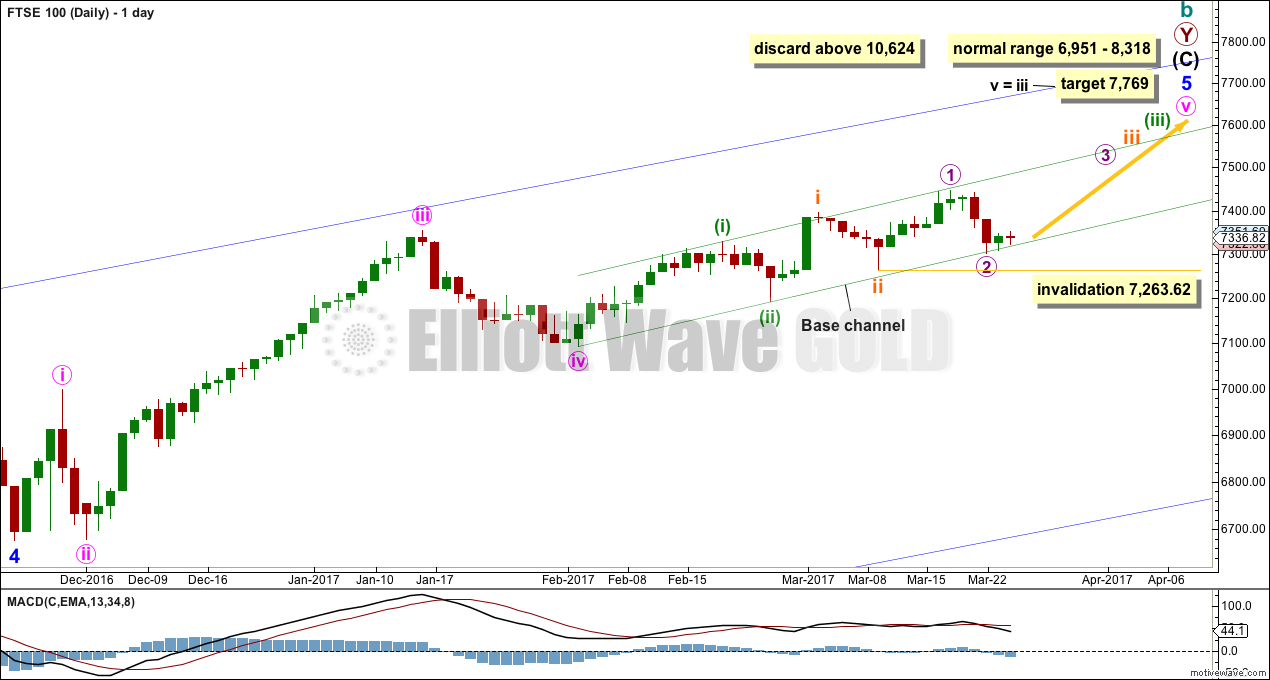
The normal range for cycle wave b is from 1 to 1.38 the length of cycle wave a. The structure of cycle wave b is close to completion. If cycle wave b reaches twice the length of cycle wave a, the wave count should be discarded based upon an extremely low probability. That point is above 10,624.
Click chart to enlarge.
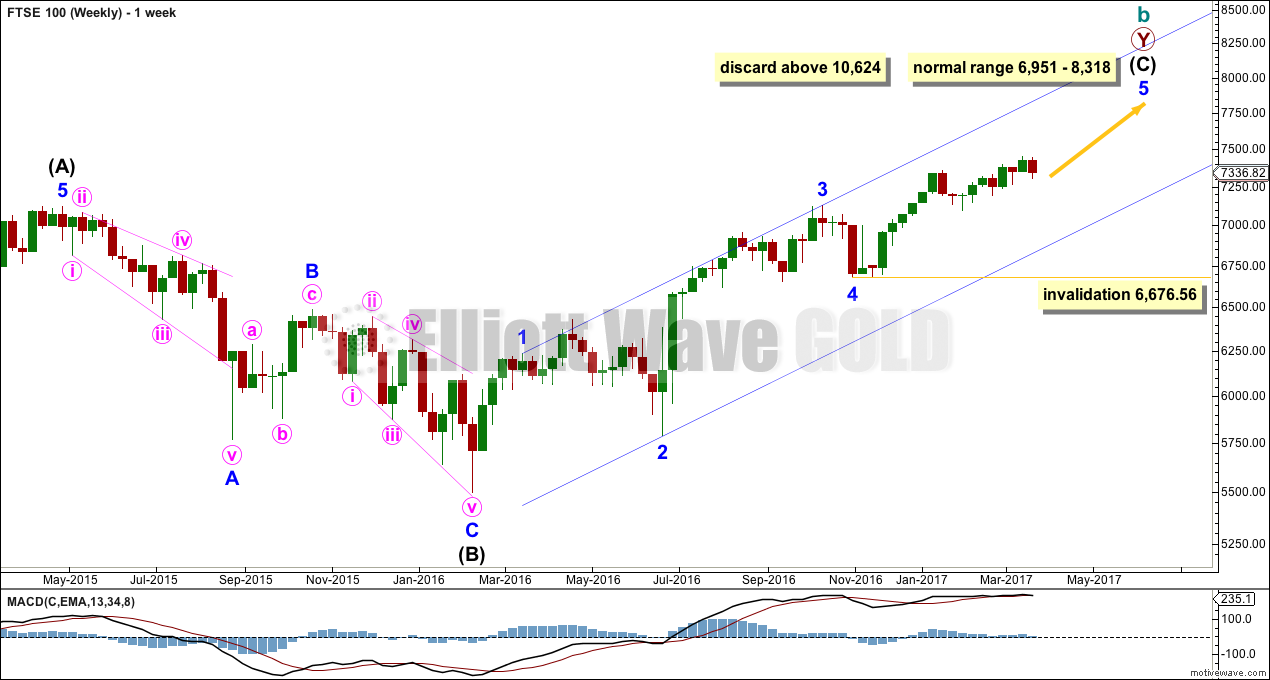
The weekly chart shows all of intermediate waves (A)-(B)-(C). The structure is an incomplete zigzag. The daily chart below shows all of minor wave 5 within intermediate wave (C).
Click chart to enlarge.
Minor wave 5 is unfolding as an impulse and its structure is incomplete. Within minor wave 5, minute wave v may be extending. There is no Fibonacci ratio between minute waves i and iii, so it is more likely that minute wave v will exhibit a Fibonacci ratio to either of minute waves i or iii.
Within the middle of the third wave, micro wave 2 may not move beyond the start of micro wave 1 below 7,263.62. However, the probability of this wave count would substantially reduce if the green channel is breached before this price point is passed.
Trading advice for members only: [wlm_private “GOLD Daily YT|GOLD Daily NT|GOLD Daily NTGR|GOLD DAILY 6M NT|GOLD DAILY 6M YT|GOLD DAILY 6M NT GFR|GOLD Plus Daily YT|GOLD Plus Daily NT|OIL SILVER Weekly YT|OIL SILVER Weekly NT|GOLD Plus Daily 6M NT|GOLDPLUSDAY6M|OIL SILVER Weekly 6M NT|GOLDPLUSDAY1M|GOLDPLUSDAY1MYT|GOLDDAY6M|GOLDDAY1M|GOLDDAY1MYT|OILSILVERWEEK6M|OILSILVERWEEK1M|OILSILVERWEEK1MYT”]There is a reasonable risk to this recommendation, so members would be advised to risk only 1-2% of equity here. Stops may be set just below 7,263.62. If the green channel is breached, long positions may be closed before stops are hit (but allow for some small overshoot). The profit target is at 7,769.[/wlm_private]
TRADING ROOM SUMMARY TABLES
OPEN POSITIONS
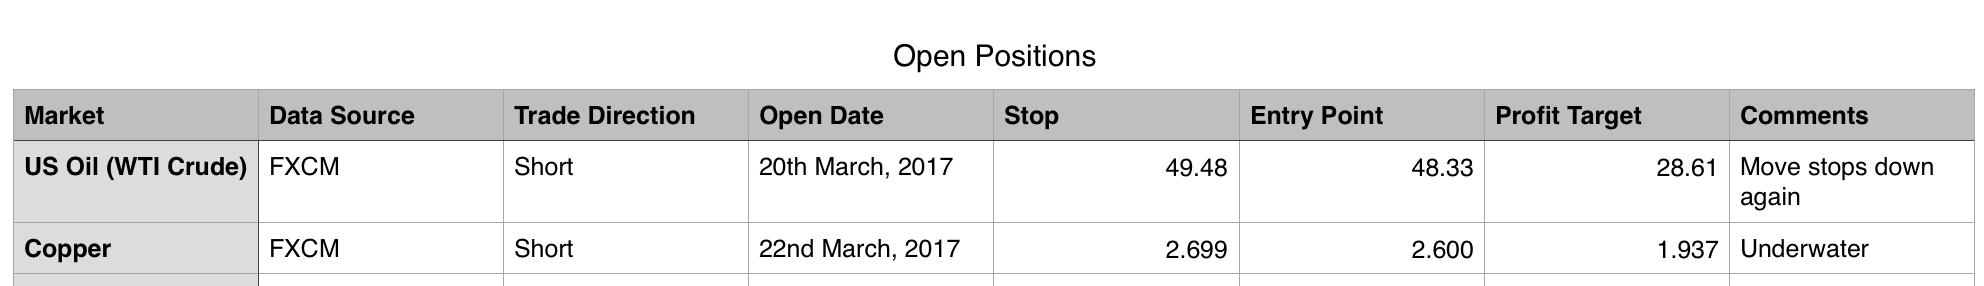
Click table to enlarge.
CLOSED POSITIONS
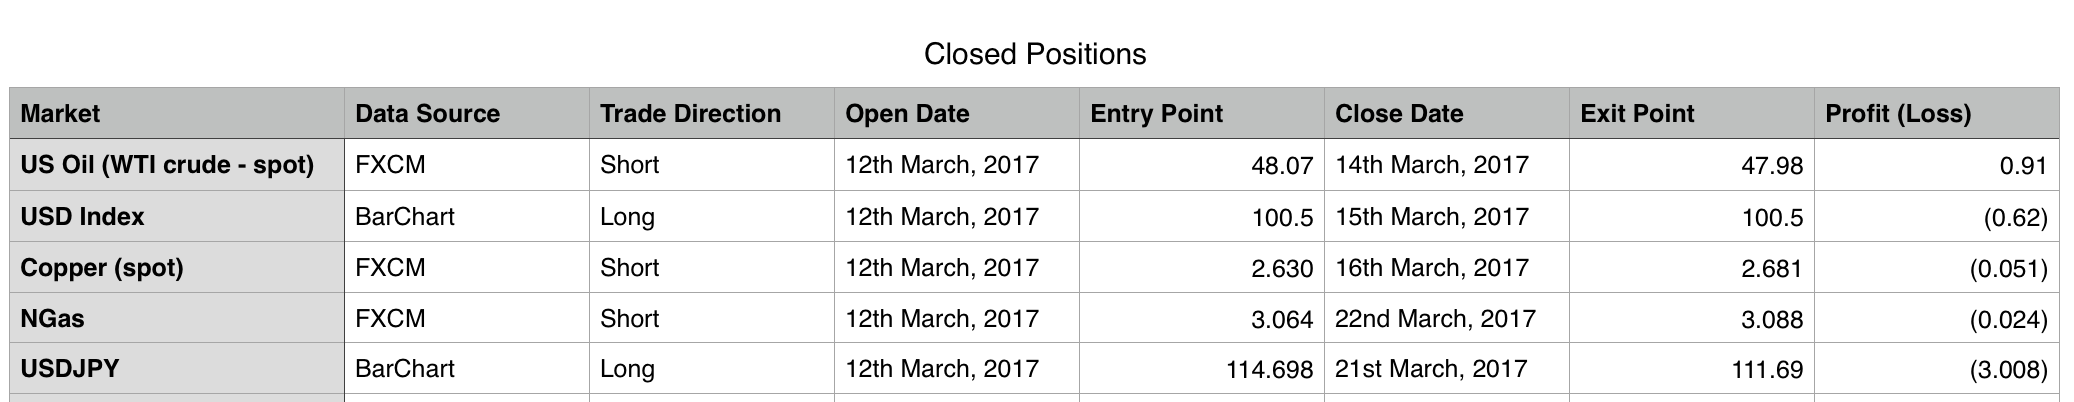
Click table to enlarge.
RECOMMENDATIONS
[wlm_private “GOLD Daily YT|GOLD Daily NT|GOLD Daily NTGR|GOLD DAILY 6M NT|GOLD DAILY 6M YT|GOLD DAILY 6M NT GFR|GOLD Plus Daily YT|GOLD Plus Daily NT|OIL SILVER Weekly YT|OIL SILVER Weekly NT|GOLD Plus Daily 6M NT|GOLDPLUSDAY6M|OIL SILVER Weekly 6M NT|GOLDPLUSDAY1M|GOLDPLUSDAY1MYT|GOLDDAY6M|GOLDDAY1M|GOLDDAY1MYT|OILSILVERWEEK6M|OILSILVERWEEK1M|OILSILVERWEEK1MYT”]
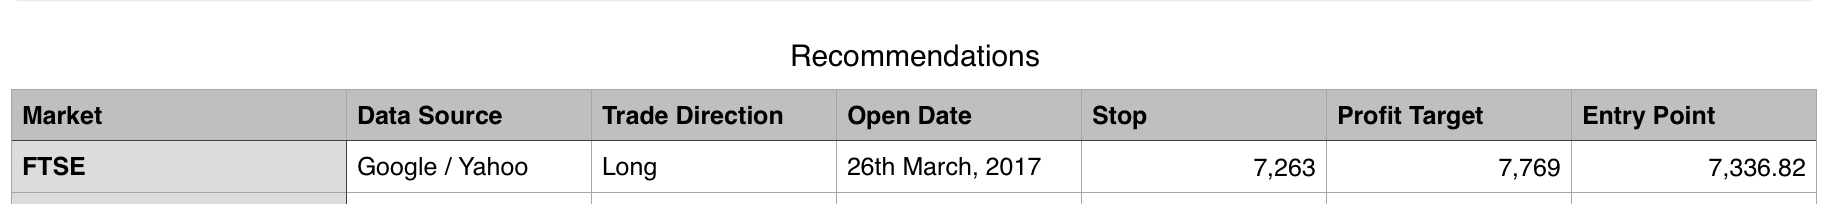
Click table to enlarge.[/wlm_private]
DISCLAIMER
As always, it is essential that anyone using this analysis for trading advice manages risk carefully. Follow my two Golden Rules:
1. Always use a stop.
2. Never invest more than 1-5% of equity on any one trade.
Trading is about probabilities, not certainties. Failure to follow my two Golden Rules of trading indicates failure to manage risk.
Accept that this analysis may be wrong. It is impossible for any analyst to predict with certainty what a market will do next.
This analysis is published @ 01:25 a.m. EST.
Here is what I believe to be a valid alternate count for USOIL. It removes what might be the developing disproportionate lengths between waves subminuette ii and iv.
I use a 4 hour time frame, so candles will not be the same as presented by Lara. The count is assumed to be the same as Lara’s up to Subminutte ii. In the proposed count the low of March 14th is end of Minute iii, not Subminuette iii, and since that date Oil has been in a Flat correction for Minute iv. The low on March 27th could signal the beginning of movement upward (Minuette c) to complete the flat.
Comments are welcome.
thanks Lara,
Would love your insights into USD. I bought it today. My stop is 98.25. Tgt is 101.5.
With the long lower wick on today’s Copper candlestick I’m recommending a close on that trade early, to take a very small loss.
I’m also recommending closing Oil for a small profit, it’s not behaving as it should if it’s in the next wave down.