
Price remained within channels and continued higher.
Today’s strong upwards session with heavy volume looks like a blowoff top.
Summary: It looks like a blow off top may have ended upwards movement today. However, price remains within the best fit channels. While price remains within the steeper channel particularly, expect it to keep going up. When the channel is breached, it would be likely price has changed trend.
New updates to this analysis are in bold.
Last historic analysis with monthly charts is here, video is here.
Grand SuperCycle analysis is here.
MAIN ELLIOTT WAVE COUNT
For clarity I have decided at this time it may be best to publish on a daily basis weekly charts I and II. Both charts expect a zigzag down to complete and the difference is in the expected depth.
WEEKLY CHART I
Click chart to enlarge.
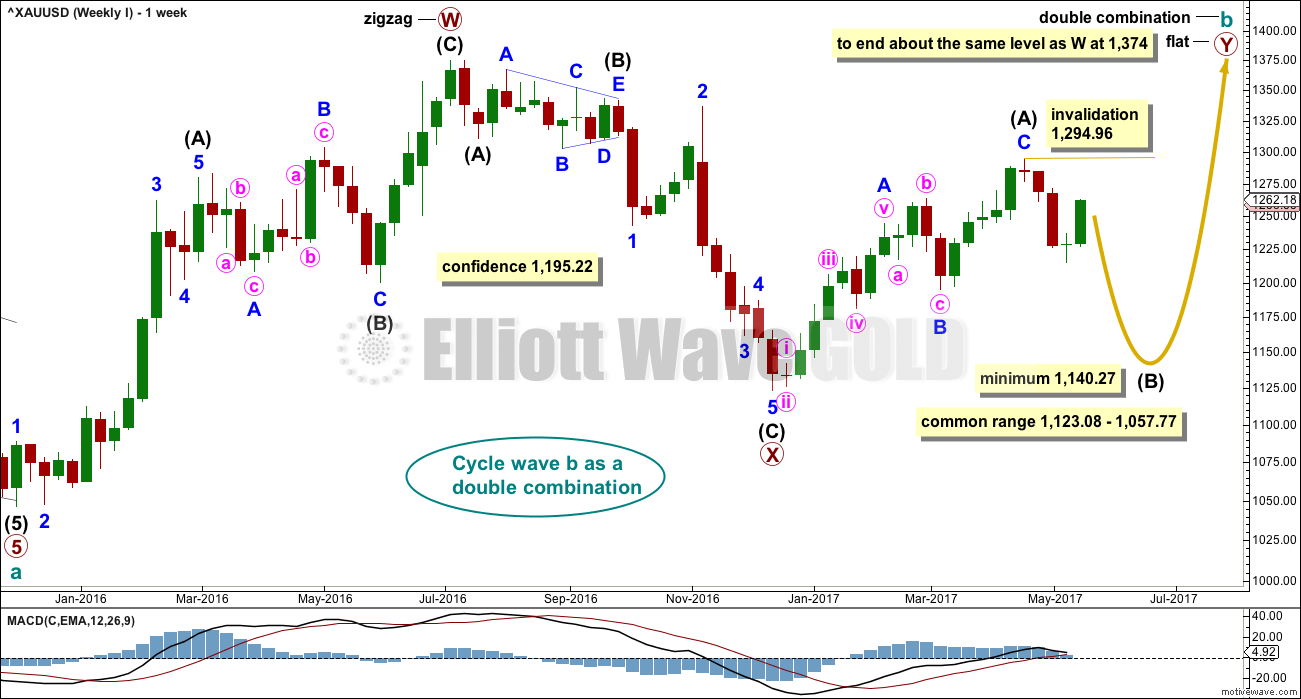
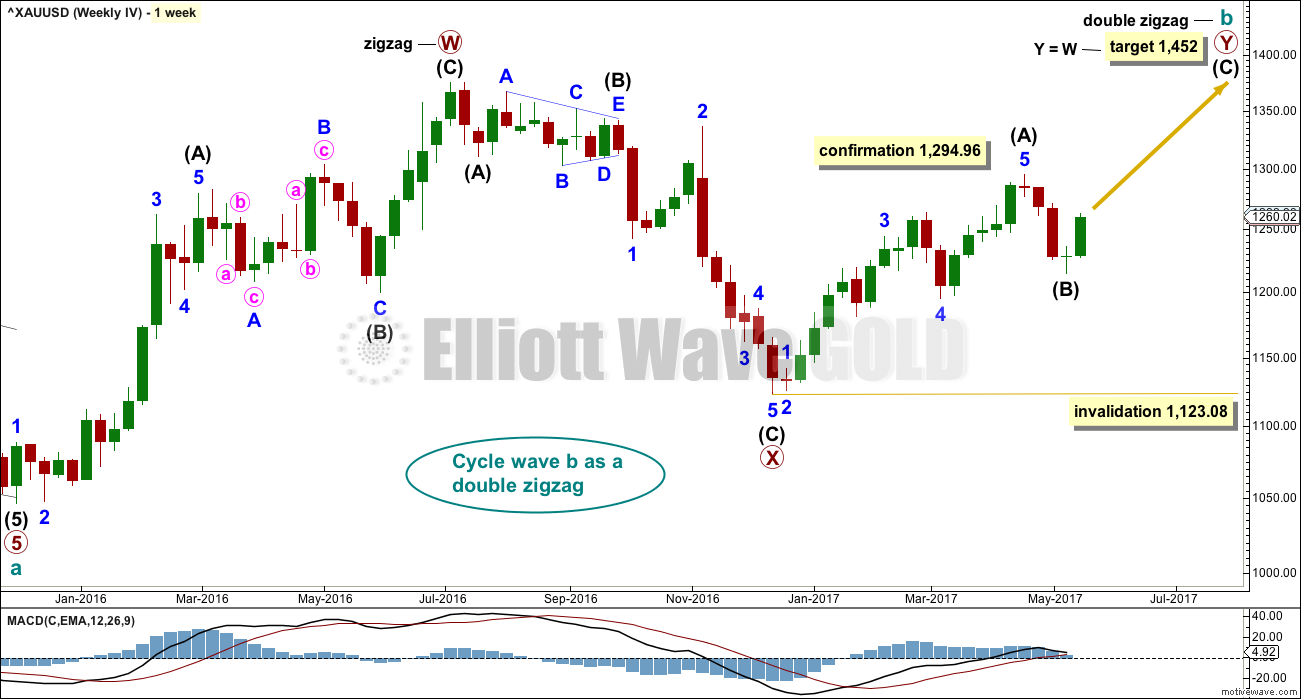
Combinations are very common structures. Cycle degree waves normally last one to several years, and B waves do tend to be more time consuming waves than all other waves. Given these tendencies the most likely scenario at this point may be that cycle wave b is an incomplete double combination.
The first structure in the double labelled primary wave W fits as a zigzag. This upwards movement will subdivide as either a three (zigzag) or a five (impulse). It does have a three wave look to it.
The double is joined by a deep three in the opposite direction labelled primary wave X, which is a 0.77 depth of primary wave W. X waves within double combinations are normally very deep; this one looks right.
The second structure in the combination may be either a triangle or a flat correction. Both of these structures have A waves which subdivide as threes.
At this stage, the upwards wave from the low in December 2016 does now look best and subdivide best as a completed zigzag. This may be intermediate wave (A) of a flat correction or a triangle. Because a triangle for primary wave Y would look essentially the same as the second weekly chart below, only a flat correction is considered here. The most common two structures in a double combination are a zigzag and a flat.
This wave count follows the most common scenario and has the best fit.
Within the flat correction of primary wave Y, intermediate wave (B) must retrace a minimum 0.9 length of intermediate wave (A) at 1,140.27. The most common length for intermediate wave (B) is from 1 to 1.38 times the length of intermediate wave (A), giving a common range from 1,123.08 to 1,057.77.
Intermediate wave (B) may subdivide as any corrective structure, but the most common structure for B waves within flats is a zigzag. At this stage, on the hourly chart it looks like a five down is now complete, which would indicate intermediate wave (B) is a zigzag subdividing 5-3-5.
The daily and hourly charts will follow this weekly chart. That does not mean the other two weekly charts aren’t possible, they are, but the number of charts must be kept reasonable on a daily basis.
WEEKLY CHART II
Click chart to enlarge.
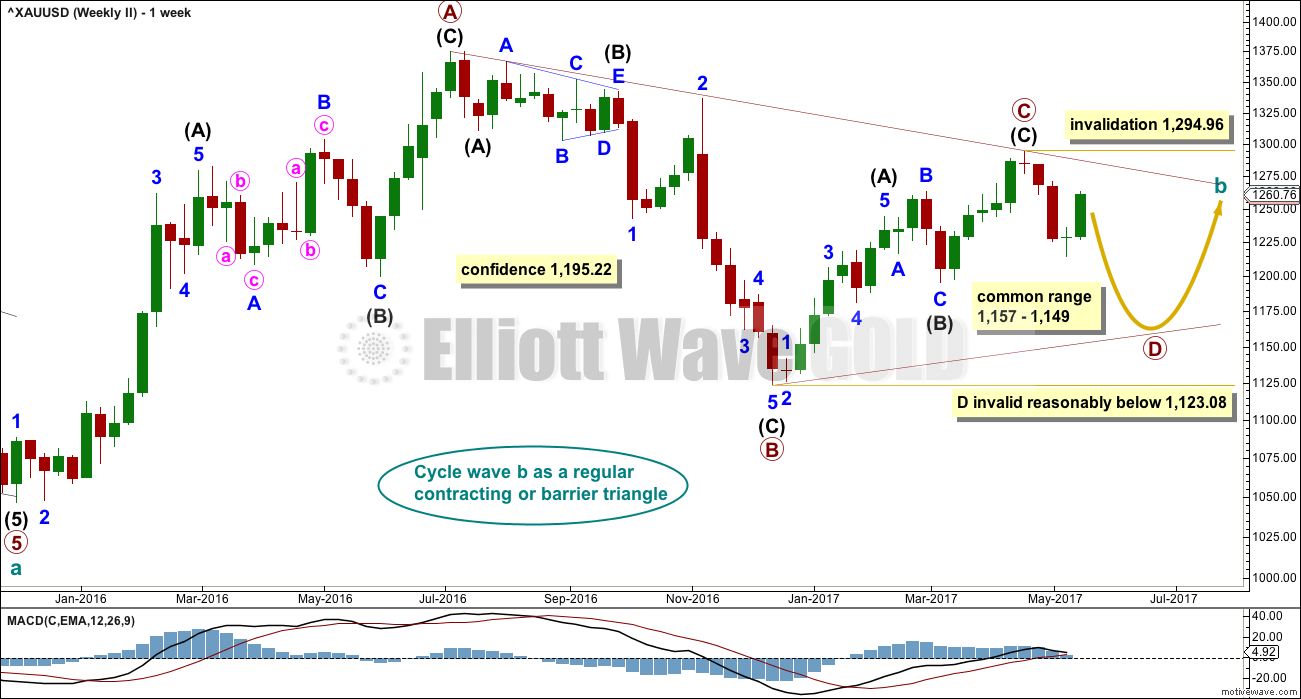
What if cycle wave b is a triangle? This is also entirely possible. Triangles are not as common as double combinations, but they are not uncommon.
Within the triangle, primary waves A, B and C are all single zigzags. One of the five subwaves of a triangle normally subdivides as a more complicated multiple, usually a double zigzag. This may be what is unfolding for primary wave D.
Primary wave D of a regular contracting triangle may not move beyond the end of primary wave B below 1,123.08.
Primary wave D of a regular barrier triangle should end about the same level as primary wave B at 1,123.08, so that the B-D trend line is essentially flat. What this means in practice is that primary wave D may end slightly below 1,123.08 and the triangle would remain valid. This is the only Elliott wave rule which is not black and white.
Thereafter, primary wave E should unfold upwards and would most likely fall a little short of the A-C trend line. If not ending there, it may overshoot the A-C trend line.
At this stage, the structure on the hourly chart is still the same for both this weekly wave count and the first weekly wave count: a zigzag downwards is unfolding. However, they now diverge in how far down the next wave is expected to go. This second weekly wave count expects a more shallow movement to not end reasonably below 1,123.08.
DAILY CHART
Click chart to enlarge.
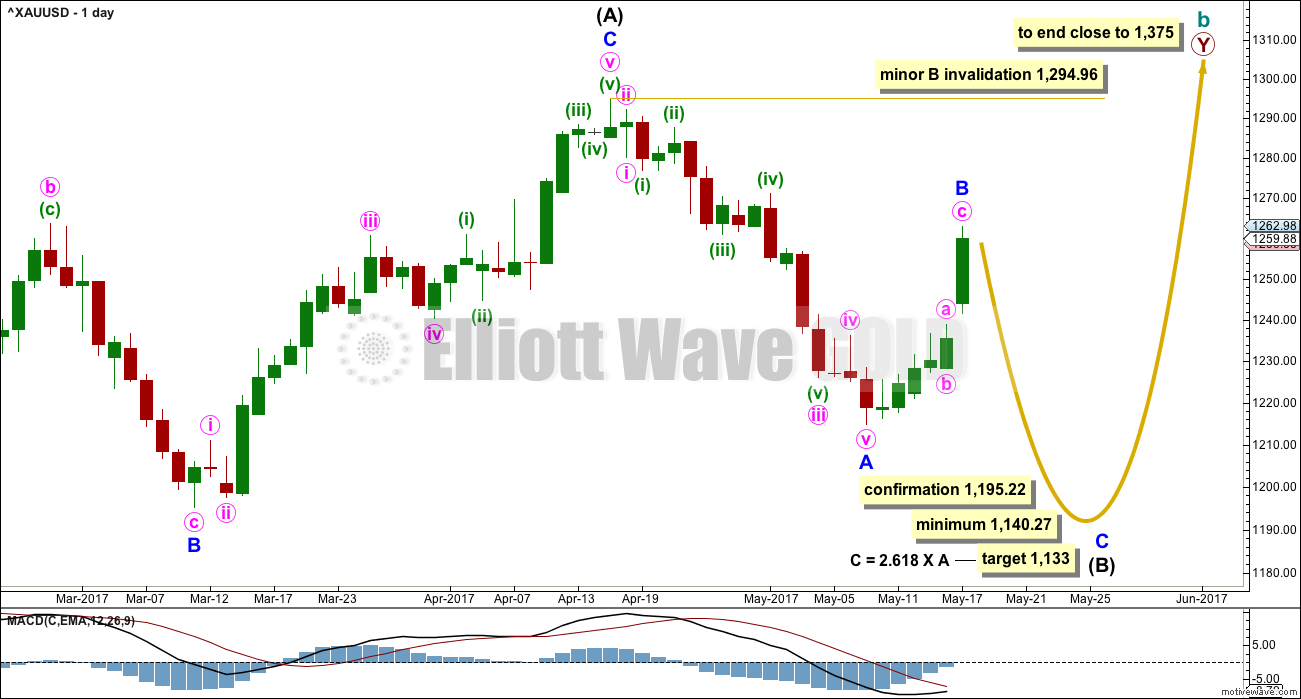
This daily chart will suffice for both weekly charts above, although the labelling follows weekly chart I.
Both weekly charts expect a zigzag downwards. Weekly chart I expects a deep zigzag for intermediate wave (B) to a minimum at 1,140.27. Weekly chart II expects a zigzag down for primary wave D to not move below 1,123.08 and most likely fall well short of that point.
The daily chart follows the expectations for weekly chart I, but the structure for weekly chart II would be exactly the same.
Within the flat correction of primary wave Y, intermediate wave (B) must retrace a minimum 0.9 length of intermediate wave (A) at 1,140.27. The most likely corrective structures to achieve the deep correction required for B waves within flats are single or multiple zigzags. These begin with a five, then a three in the opposite direction.
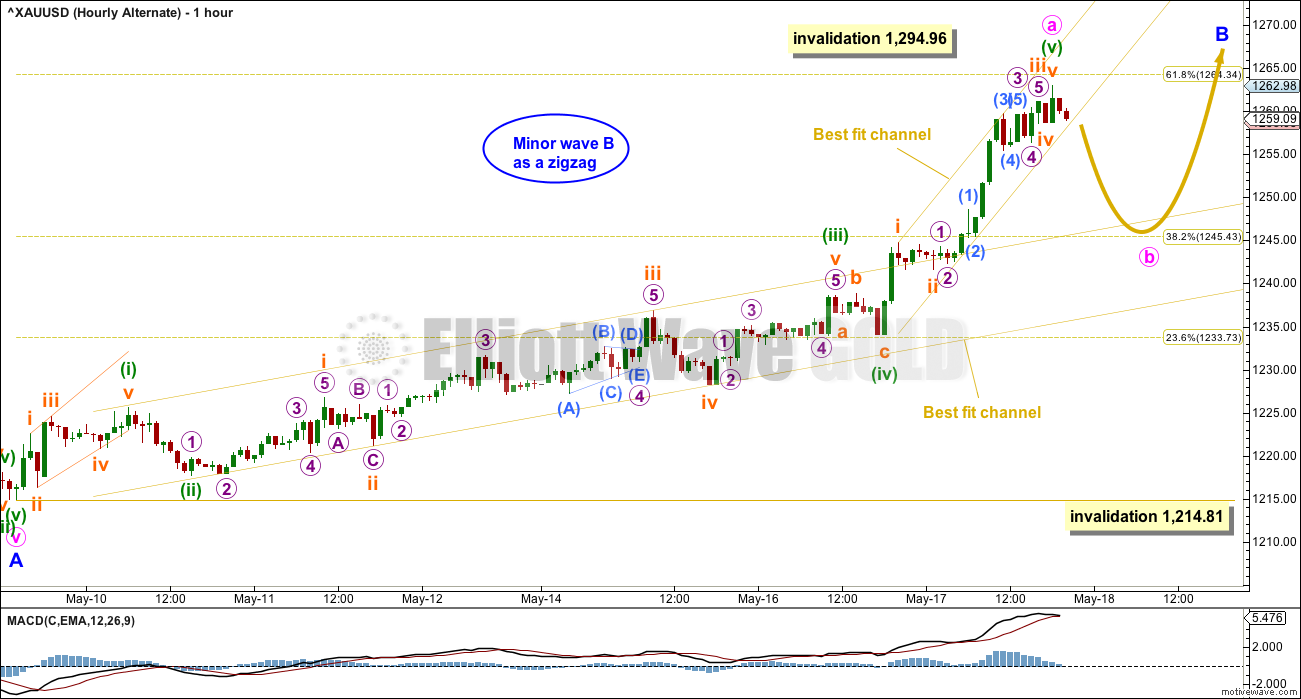
Minor wave A is complete today and now minor wave B may also be complete as a quick sharp zigzag. Because of the blowoff top today that looks to be most likely.
However, there can be no confidence yet that minor wave B is over while price remains within both small channels on the hourly chart. Accept that it may continue higher.
Original targets for minor wave B were the 0.382 and 0.618 Fibonacci ratios. Minor wave B today has almost touched the 0.618 Fibonacci ratio, which is at 1,264.34.
If minor wave B continues higher, it may not move beyond the start of minor wave A above 1,294.96.
HOURLY CHART
Click chart to enlarge.
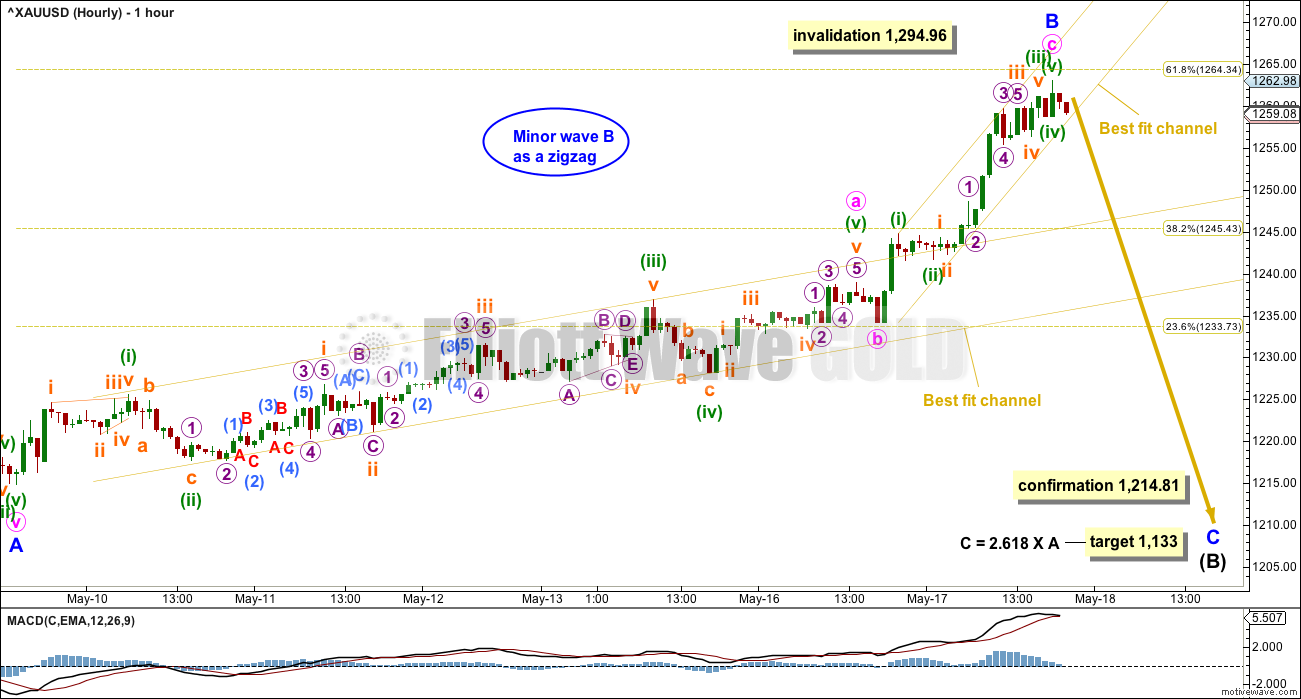
Two narrow best fit channels are drawn about this upwards movement. It is very important that members do not have confidence yet that minor wave B is over while price remains within the channels. Only when the first channel is clearly breached may any confidence be had. Reasonable confidence in a trend change may be had if the second channel is breached.
The blow off top seen today may have been minute wave c. C waves can behave like third waves, and third waves often end in blow off tops.
If minor wave B moves higher, then the target calculated for minor wave C must also move correspondingly higher.
If minor wave C lasts a total of 12 sessions, then intermediate wave (B) may last a total Fibonacci 34 sessions.
It is my judgement that this first hourly chart has a higher probability for the following reasons:
– Today’s session completes a blow off top, and this may be followed by a reversal.
– The 0.618 Fibonacci ratio is almost met.
– Price found resistance about 1,260.
ALTERNATE HOURLY CHART
Click chart to enlarge.
It is also possible that upwards movement for the last six sessions is a complete five wave impulse.
The blow off top may be followed by a consolidation for a B wave within a B wave. This may take a few days.
Thereafter, another upwards wave may make minor wave B very deep indeed, deeper than the 0.618 Fibonacci ratio.
This is possible, but it has a lower probability than the main hourly wave count.
WEEKLY CHART IV
Click chart to enlarge.
This weekly chart is published today in response to a member’s query.
What if the bull market beginning in December 2015 remains intact? Price has essentially been moving sideways since that date, so all possibilities should be considered.
A possible Morning Doji Star reversal pattern at the low labelled intermediate wave (B) would support this wave count.
This wave count requires confirmation above 1,294.96. That would invalidate the first three weekly charts (the third is seen in historic analysis only).
It is possible that cycle wave b is continuing higher as a double zigzag. However, double zigzags normally have brief and shallow X waves. The purpose of the second zigzag in a double (and the third when there is one) is to deepen the correction when price does not move deep enough in the first (or second) zigzag. Thus double (and triple) zigzags normally have a strong and clear slope against the prior trend. To achieve this look their X waves normally are brief and shallow.
In this case, primary wave X is neither brief nor shallow. It is a 0.77 depth of primary wave W and lasted 0.74 the duration of primary wave W. Overall, this does not have a typical look of a double zigzag so far.
This wave count should only be used if confirmed with a new high above 1,294.96. Low probability does not mean no probability, but should always be given less weight until proven.
TECHNICAL ANALYSIS
WEEKLY CHART
Click chart to enlarge. Chart courtesy of StockCharts.com.
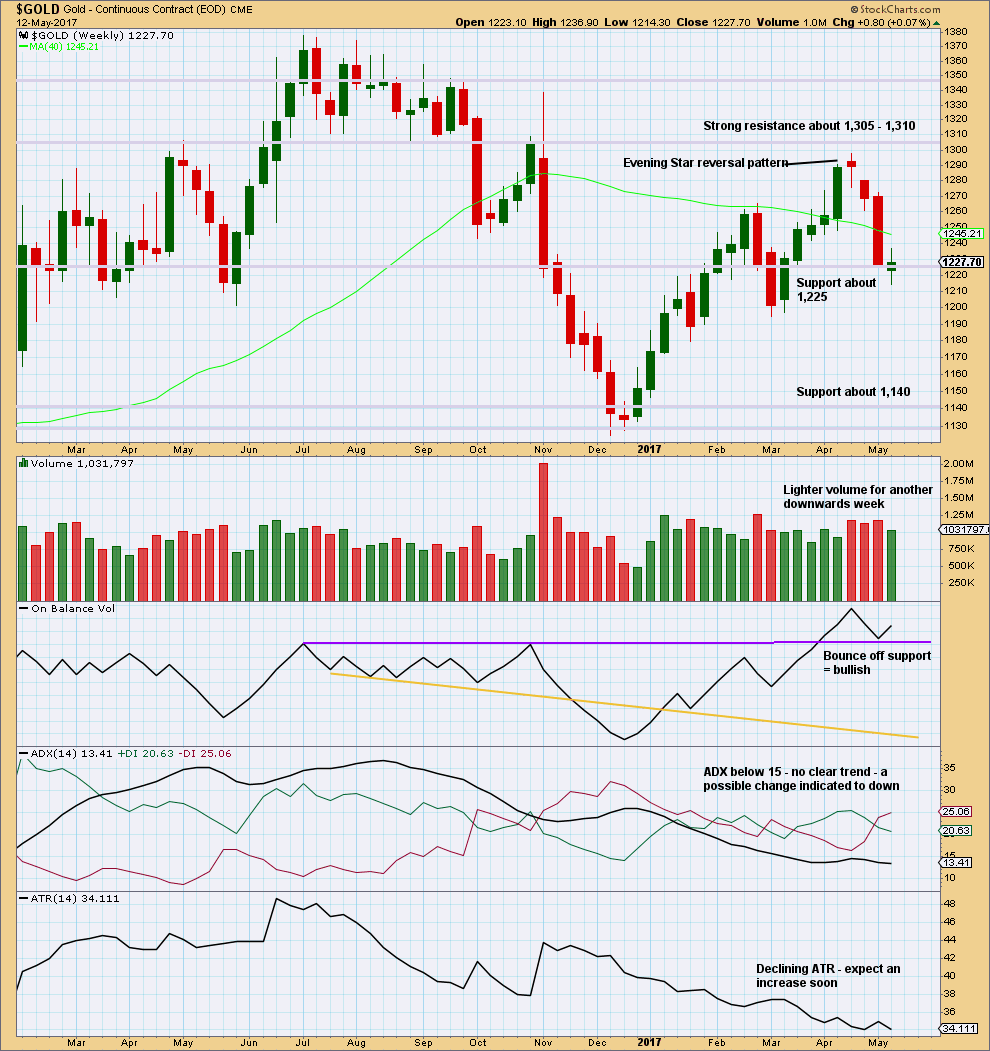
Another downwards week closes green with a small real body. This is a spinning top candlestick that shifts the trend from down to neutral.
The balance of volume is upwards and shows a decline. Upwards movement may be a counter trend movement if it does not have support from volume.
The bullish signal from On Balance Volume suggests this week may see upwards movement.
DAILY CHART
Click chart to enlarge. Chart courtesy of StockCharts.com.
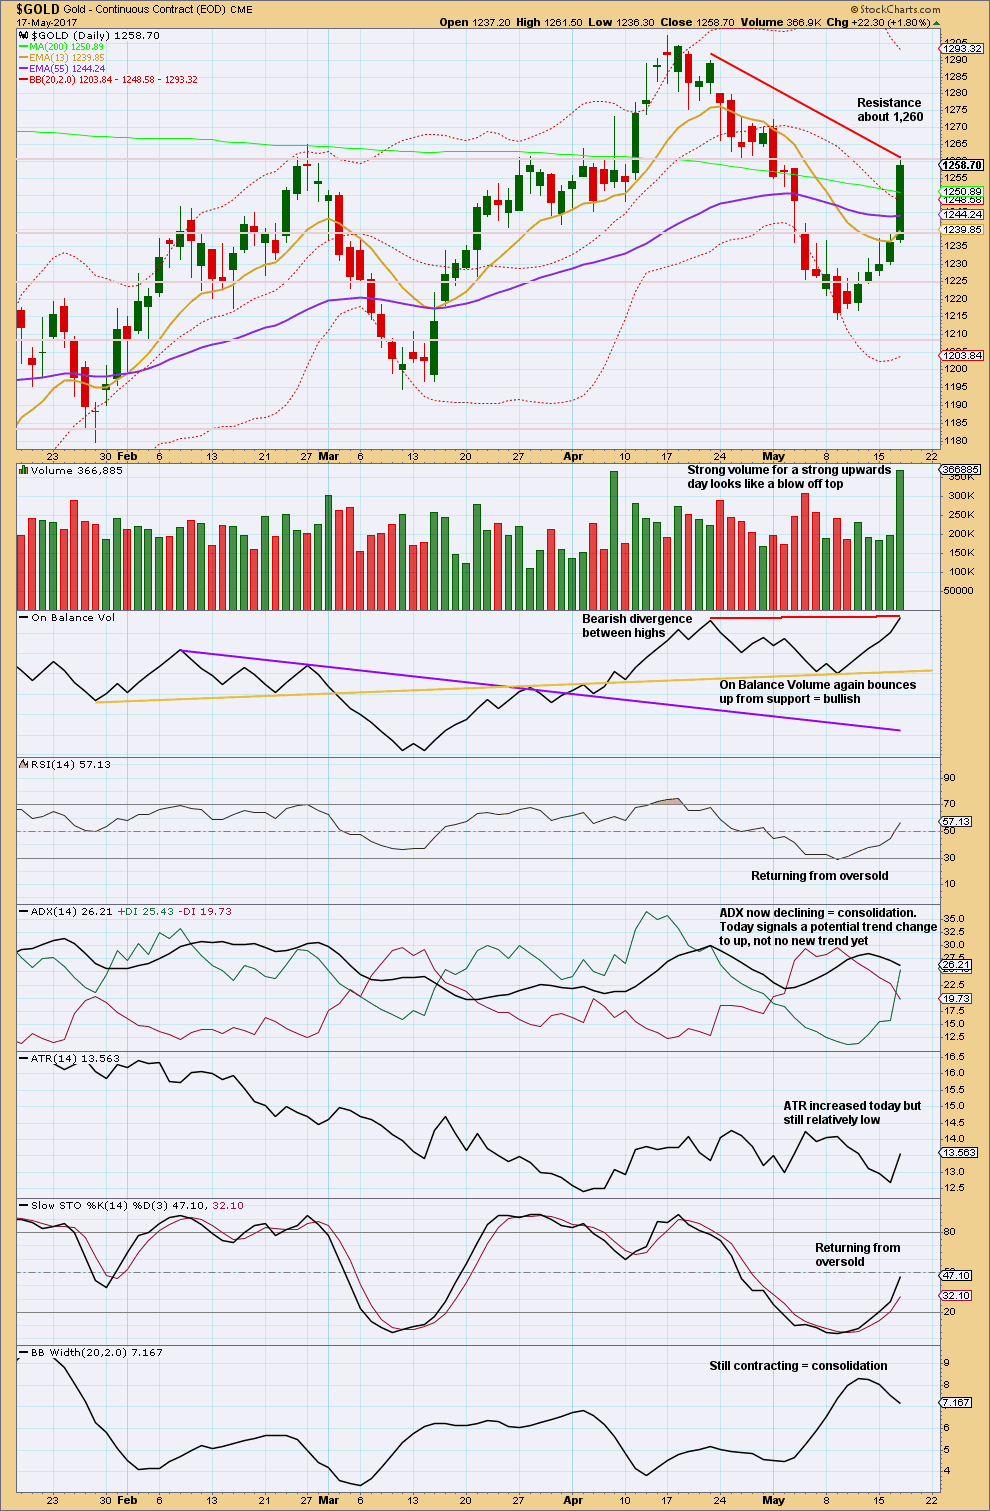
Today’s session looks very much like a strong blow off top, typical of commodities. Expect either a sideways consolidation for a few days, or a reversal, after a blow off top.
There is slight bearish divergence between price and On Balance Volume to support the view of a reversal here.
There is room for price to rise further; neither RSI nor Stochastics are yet overbought.
If this is a new trend, then it is concerning that Bollinger Bands continue to contract. This trend still lacks expanding volatility.
GDX
DAILY CHART
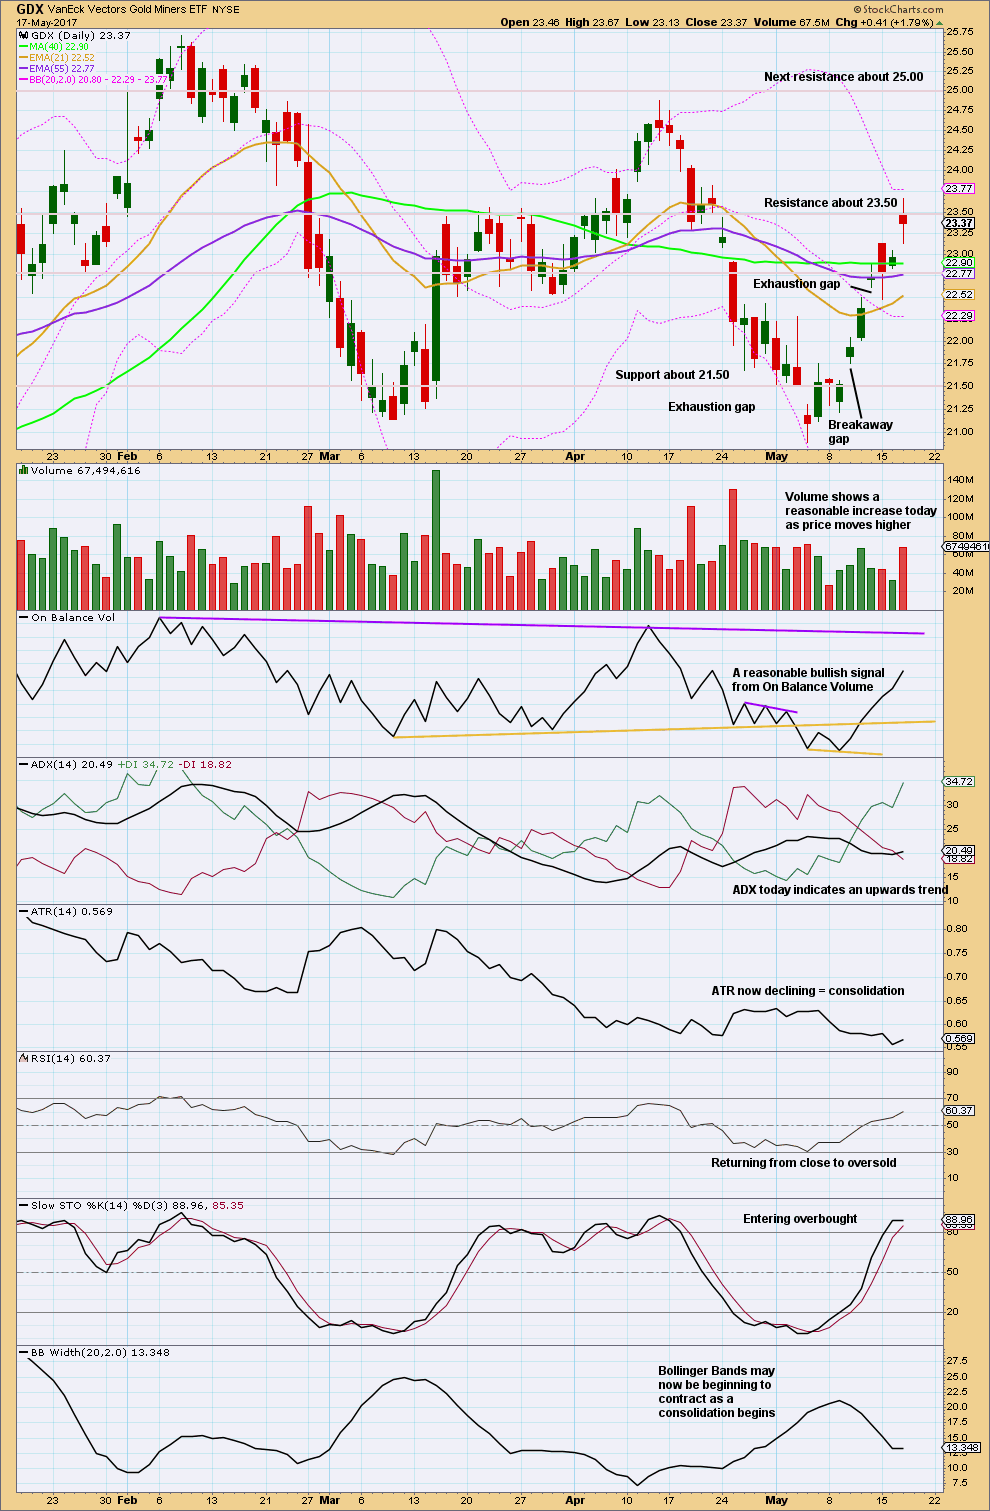
Click chart to enlarge. Chart courtesy of StockCharts.com.
There is no gap between the 15th and 17th of May because the high of the 15th was 23.13 and the low for the 17th was exactly the same.
While this upwards day came with stronger volume, the last four upwards sessions have come with a steady decline in volume. This session looks like it may possibly be a smaller blow off top.
The spinning top candlestick of this session indicates indecision, a balance of bulls and bears.
This upwards movement of the last nine days still has declining ATR, contracting Bollinger Bands, and overall lighter volume than the prior downwards movement. Overall, it still looks more likely to be a counter trend bounce than a new trend for GDX.
With Stochastics now overbought and a spinning top candlestick pattern, members are advised to wait one more day to see if a reversal pattern emerges.
This analysis is published @ 09:40 p.m. EST.
[Note: Analysis is public today for promotional purposes. Member comments and discussion will remain private.]
imo Lara’s updated hourly is what I am looking out for; Gold price appears toppy under 1255, all it takes is a break below 1245 (as Alan has also mentioned) to open up 1242-1235 range; playing for it lol… early bird signs of further downside to follow was perhaps the break below 50dma which is now acting resistive….
I have to go today to track Tom the Kiwi. Gold analysis will be published as soon as I return. It may be later than usual today.
Hourly charts will change little if at all from the two posted just below though, so you all have a roadmap. Analysis will be little changed.
Here is my classic TA before I go:
The upwards day today closes red = bearish. Balance of volume is down = bearish. Long lower wick = bullish.
It is most concerning that Bollinger Bands continue to contract with this strong movement and increasing ATR. This still looks like something is wrong.
When a movement has something that looks like it is wrong with it, it’s usually a B wave. They’re suckers. They don’t look quite right.
But B waves usually have lighter volume. This one today and yesterday has heavy volume.
Overall I cannot determine which hourly wave count this best supports at this stage. Both hourly wave counts are still valid.
Price could certainly meander sideways in an annoying range for a few days, or it could turn and continue down for a couple of weeks from here.
Alternate hourly updated:
Minor B could still be an incomplete zigzag. Target calculated for one more high.
Updated hourly chart, main count:
Minor B could be over. I’ve redrawn the channel to contain all movement, it’s now providing support.
The Hourly Ichimoku Chart shows gold still hovering above the cloud. Price has dropped below the tenkan-sen and kijun-sen which indicates a downward bias, at least in the short-term.
There is not enough structure to gain a firm grasp of what is happening today. Maybe my skills are not sufficient to interpret the data accurately. My best guess is that 1264.72 marked the top.
(1) The subsequent drop to 1250.78 seems to be followed up with a 3-wave structure (still in the early stages) targeting 1260, a prior resistance now turned support.
(2) This could be followed with a drop to test 1245.95, the bottom of the cloud boundary discussed in the Daily Chart. That’s when it gets interesting.
(3) If price breaks down below 1245.95, we will be in bear territory, and the Main Count holds.
(4) If price rebounds, then that could be the low for a long long time. The Weekly IV is probably in play. The only other possibility I see is that the Alternate Hourly is in play, rising to test the high at 1294.96 for the end of Minor B.
We’ll just have to wait this one out.
I don’t have a clue!!!
Any thoughts recent low could have been an expanded flat 4th wave and now we are starting Fifth?
It doesn’t fit well into a channel at this time, so I wouldn’t go with that idea.
But this certainly could be minute b, and it could take days of sideways movement.
Then we could have minute c up. As per the alternate hourly chart.
Watching action in USD.
Is this chart bearish? Targeting 90’s.
If gold is inversely lined up with USD It is safe to assume gold is going higher.
It’s not safe at all to assume they have a negative correlation. Currently the correlation coefficient between $GOLD and $USD is 0.08. They do not have a correlation.
But FWIW I do see the USD as now bearish, it’s broken some very important trend lines.
I should update my USD analysis for you all.
Futures put in a high at 1264.75 and reversed. Move down does not yet look impulsive, but close on the 5 minute chart.
New high suggests wave 4 was expanded flat correction of wave 3 and now should be in final wave 5 up.
Or triangle
Ichimoku Half-hourly Analysis
Data as at 6:25 am ET today
====================
On the intraday basis, the movement so far appears mainly sideways. Perhaps some Europeans felt left out of the action during their overnight time, and wanted in on a piece of the pie. Or perhaps there are still some who swear by the gravity of the Trump situation and continued to bet on a nasty outcome. Or perhaps those who have gained during the strong rally yesterday are still greedy for more. Who knows?
Yet some things are certain. The daily candle is not completely outside the cloud, indicating that the trend is not strongly bullish. Also the tenkan-sen is still below the kijun-sen, signifying that there is no bullish trend established yet. Prices yesterday had risen mainly out of fear, and there was not much from a technical standpoint to justify this. Well, what goes up must come down, and the faster the rise, the quicker the drop. The trend can easily turn bearish at the drop of the hat. All it takes is a huge round of profit-taking. But then again, what if there are still people who decide to pile into the bandwagon and 1262.98 gets taken out? Interesting.
Those fast sharp moves in price (price shocks) are almost always (but not always!) mostly or fully retraced.
Gravity will get it.
Ichimoku Daily Analysis
Data as at the close of May 17
=========================
Gold markets exploded to the upside during the session on Wednesday, slicing through 1256.87, the 61.8% retracement of the range from 1195.22 (the last low of March 10) to 1294.96 (the last high of April 17). This is possibly a blow off top, an over-reaction to the political turmoil in the US. While very little will likely surface from the investigation, investors somehow got nervous, probably on hearsay of impeachment, such was the kind of hatred a significant proportion of the population had for Trump. That meant gold got lots and lots of the buying pressure during the day. The market could have over-stretched itself in reaching as far as 1262.98, and logically it is time for a pullback. The only question remains: what is likely to be the nature of this pullback? A shallow retracement is a bullish sign; a sharp decline would be the start of the final drop toward the 1180 level or perhaps even as low as 1133 as Lara had suggested. It is still too early to tell.
But of possible price movement, the Ichimoku chart could provide some clues. Cloud support is at 1245.95 (the bottom cloud boundary). I expect this level to be tested. If gold breaks below the cloud, bears will once again regain control of the trend. The key support is seen at 1214.81 where Minor B began (this is the same as the point 1214.30 shown on the chart). But, what if price bounces off the bottom of the cloud boundary? That’s where it gets interesting …
Lara. I’m glad that you are considering an idea I was toying with two days ago (posted in May 15 report, date stamped May 16, 9:03 am). Weekly Chart IV is similar to that except that I thought Primary Y could be an impulsive 5 waves whereas Weekly IV looks at it as an ABC.
Although this concept has rather low probability at the moment, I think that it might happen on the off-chance because it has happened before. When price reached the low at 1123.08, almost all the analysts were declaring that one more low has to be in place. Instead, gold refuses to listen to all that talk, and went up in a defying $170+. Perchance history may repeat itself, much to the chagrin of mere mortals like us.
Alan, it seems the bansters also hired top EW technicians to read EW investors minds lol
Alan, I like the new weekly chart IV also. I think the leg up in gold and GDX that just finished look like good 5 wave impulses. I would also like to see the gold bear market trendline breached to the upside before Cycle wave b is over. If this wave down fails to make a new low, then up we go…
Chart IV appears to have a wave 3 shorter than wave one for an impulsive count so that would imply a pretty short wave for the fifth wave. For the metals the fifth wave tends to be extended with a blow-off type cap. Just thinking out loud…
? I’m not seeing what you’re seeing Verne… Within intermediate wave (A) minor 3 is much much longer than minor 1.
This is for the new weekly IV chart
Yeah, I’ll consider it. And as you guys like it I’ll keep publishing it.
But the probability is really quite low, so it requires price to tell us the more likely counts are wrong before we should have confidence in this idea.
A simple process of deduction. Go with the most likely scenario, then if that’s invalidated the next most likely… only go with the least likely when all other options have been invalidated.
There is another problem with it: it has to see the rise I have labelled intermediate (A) within primary Y as a five wave impulse. That move really looks better as a three I think you’ll all agree.