
An upwards swing was expected to continue. Price has made a new high and downwards movement within the session remains above the invalidation point.
Summary: Expect more upwards movement to a minimum at 1,359.42. The target is now at 1,367 to 1,369. When this upwards swing is complete, then a new downwards swing is expected to make a new low below 1,303.08.
New updates to this analysis are in bold.
Grand SuperCycle analysis is here.
Last in-depth historic analysis with monthly and several weekly charts is here, video is here.
There are multiple wave counts at this time at the weekly and monthly chart levels. In order to make this analysis manageable and accessible only two will be published on a daily basis, one bullish and one bearish. This does not mean the other possibilities may not be correct, only that publication of them all each day is too much to digest. At this stage, they do not diverge from the two possibilities below.
BULLISH ELLIOTT WAVE COUNT
FIRST WEEKLY CHART
Click chart to enlarge.
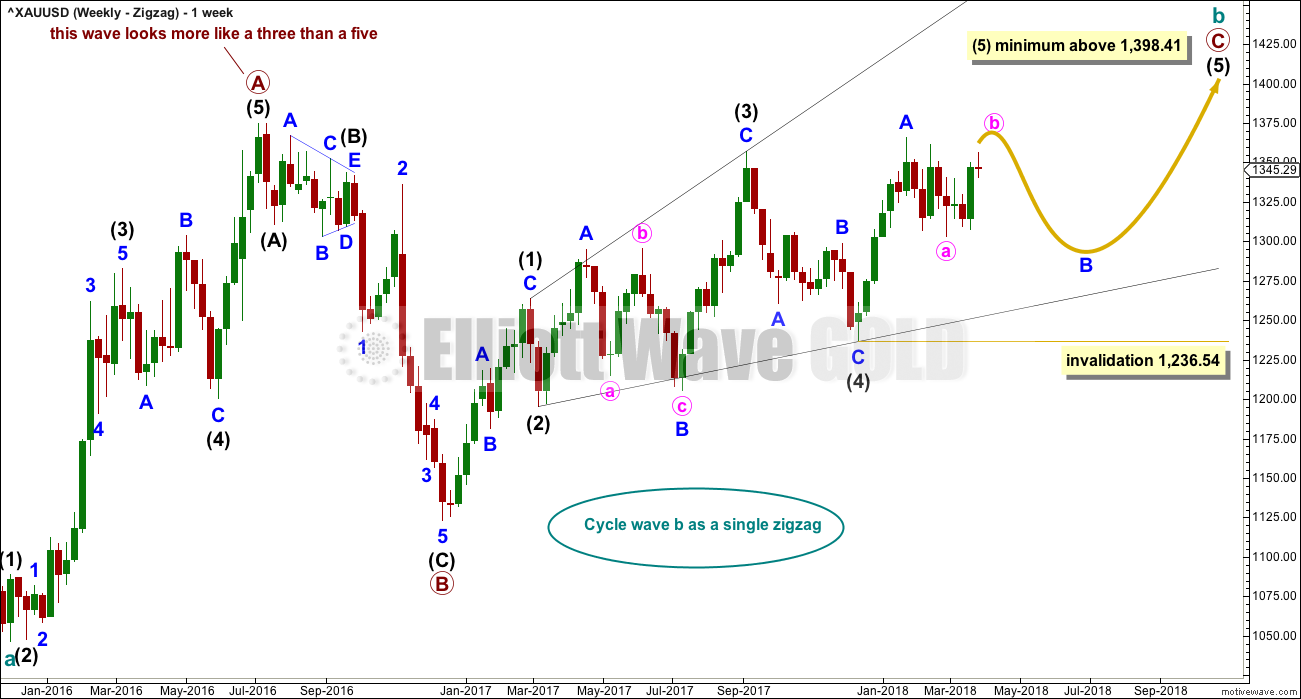
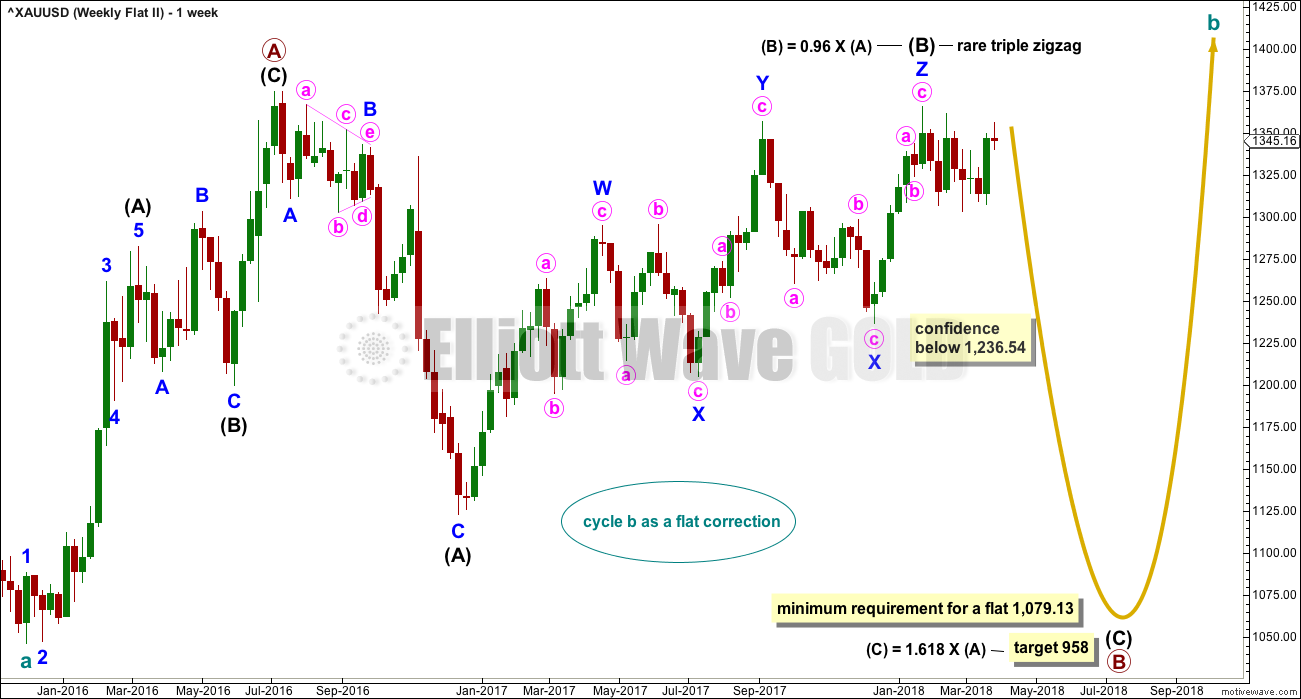
Cycle wave b may be a single zigzag. Zigzags subdivide 5-3-5. Primary wave C must subdivide as a five wave structure and may be either an impulse or an ending diagonal. Overlapping at this stage indicates an ending diagonal.
Within an ending diagonal, all sub-waves must subdivide as zigzags. Intermediate wave (4) must overlap into intermediate wave (1) price territory. This diagonal is expanding: intermediate wave (3) is longer than intermediate wave (1) and intermediate wave (4) is longer than intermediate wave (2). Intermediate wave (5) must be longer than intermediate wave (3), so it must end above 1,398.41 where it would reach equality in length with intermediate wave (3).
Within the final zigzag of intermediate wave (5), minor wave B may not move beyond the start of minor wave A below 1,236.54.
Within the diagonal of primary wave C, each sub-wave is extending in price and so may also do so in time. Within each zigzag, minor wave B may exhibit alternation in structure and may show an increased duration.
Within intermediate wave (1), minor wave B was a triangle lasting 11 days. Within intermediate wave (2), minor wave B was a zigzag lasting 2 days. Within intermediate wave (3), minor wave B was a regular flat lasting 60 days. Within intermediate wave (4), minor wave B was a regular contracting triangle lasting 40 days. Within intermediate wave (5), minor wave B may be expected to be an expanded flat, combination or running triangle to exhibit some alternation in structure. It may last as long as 40 to 60 days. So far it has lasted 43 days (refer to daily chart) and the structure is incomplete.
At this stage, it looks like minor wave B may most likely be a flat correction, or it may also still be a triangle. Both ideas are presented below.
This first weekly chart sees the upwards wave labelled primary wave A as a five wave structure. It must be acknowledged that this upwards wave looks better as a three than it does as a five. The fifth weekly chart below will consider the possibility that it was a three.
FIRST DAILY CHART – FLAT
Click chart to enlarge.
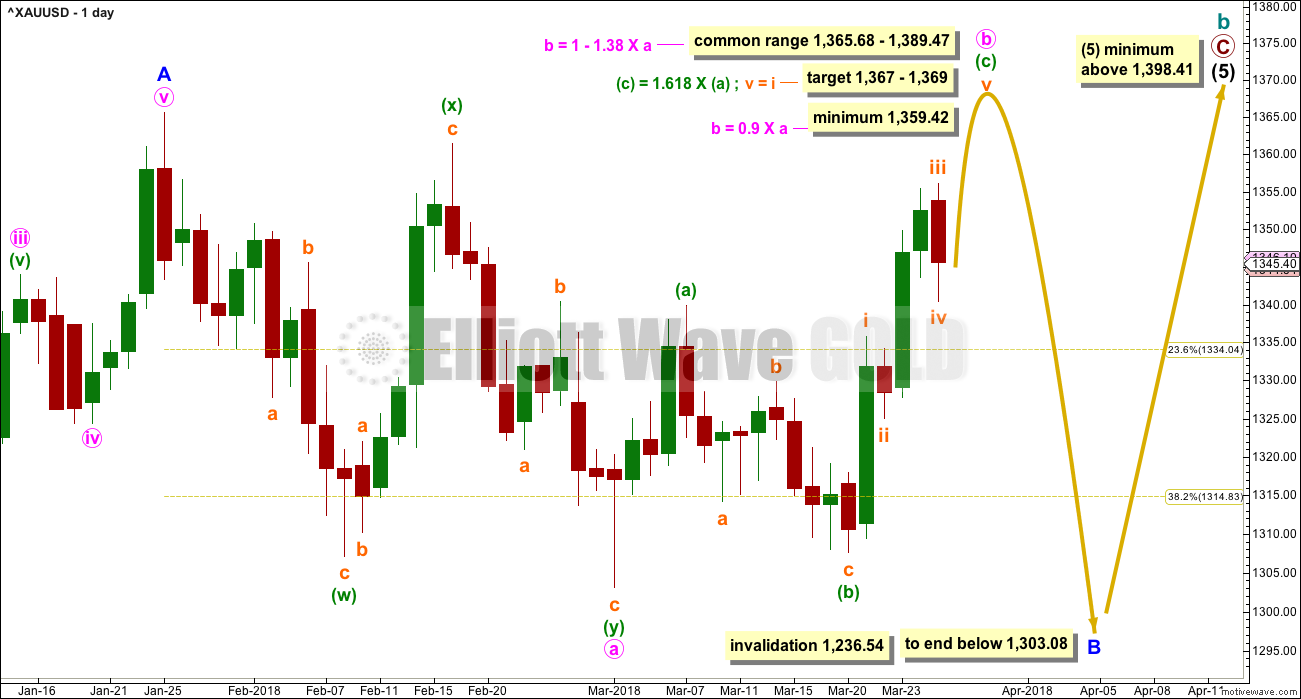
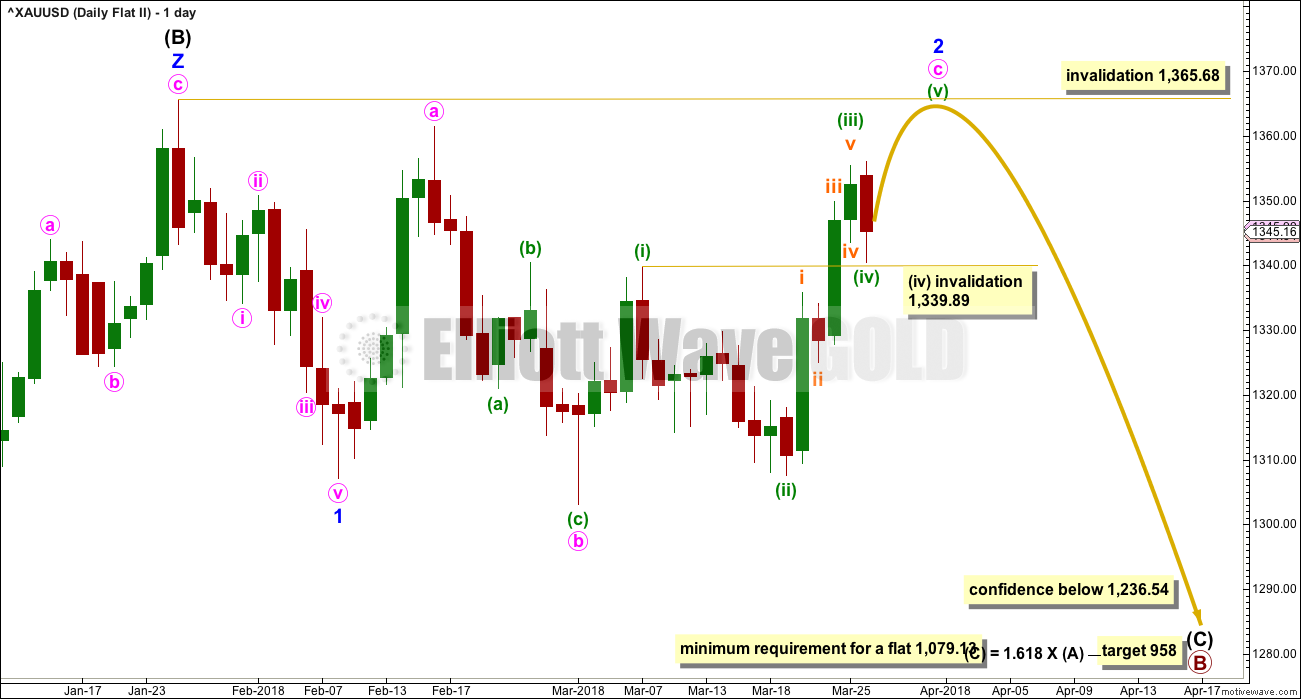
Minor wave B may be an incomplete flat correction, and within the flat minute wave a must subdivide as a three, which may have been a double zigzag.
Minute wave b must also subdivide as a three and must retrace a minimum 0.9 length of minute wave a. The target would see minute wave b end within the most common range for B waves within flats, and at an area of strong resistance.
Minuette wave (c) must subdivide as a five wave structure. It may only be either an impulse or an ending diagonal. An impulse is much more likely.
Although it is typical for commodities to exhibit brief fourth waves and strong fifth waves, this tendency does not always occur. Now that there is another red daily candlestick above subminuette wave i price territory, this looks like subminuette wave iv.
The minimum requirement for minute wave b to reach 0.9 the length of minute wave a has not yet been met. Minuette wave (c) is now looking like a clear five wave impulse at the daily chart level and may need now only a final fifth wave up to complete it.
HOURLY CHART
Click chart to enlarge.
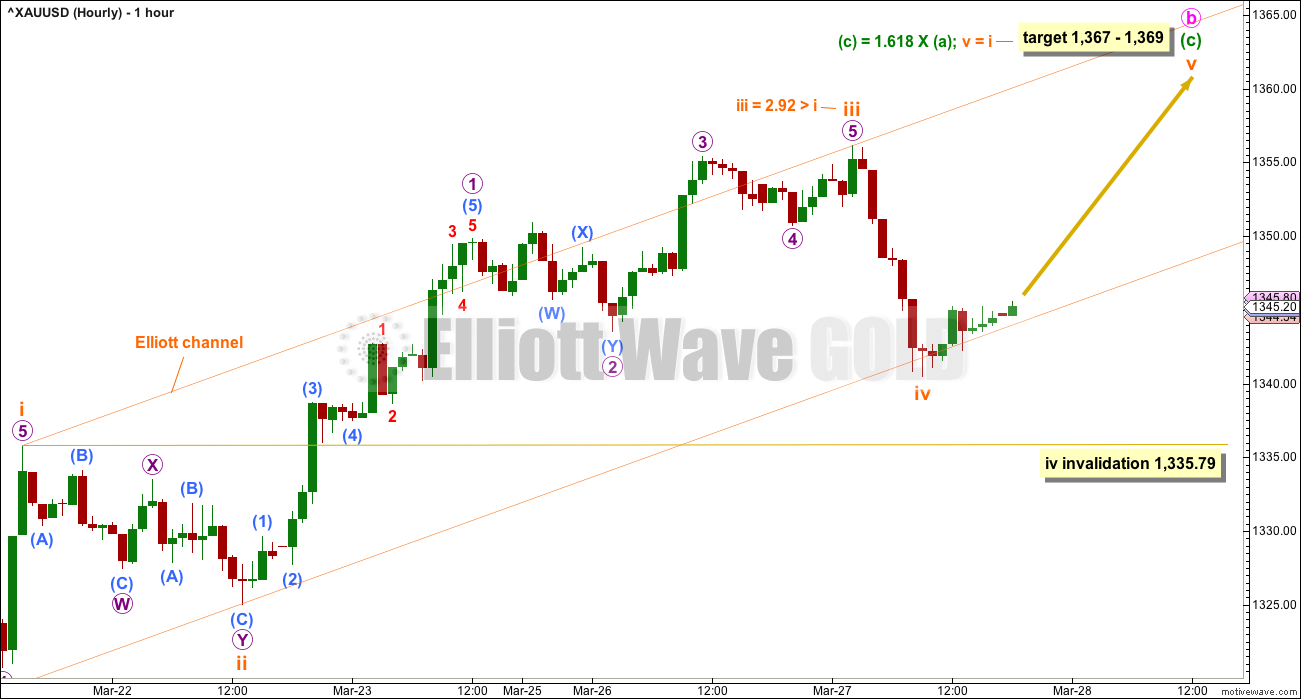
Subminuette wave iii may have ended at the last high. If it is complete, then now it is slightly longer than subminuette wave i; the difference is small enough to say they exhibit a Fibonacci ratio of equality. With subminuette wave iii now slightly longer than subminuette wave i, there is no longer a limit to subminuette wave v.
The channel is drawn using Elliott’s first technique. Subminuette wave iv may be complete here, finding support close to the lower edge. If it moves lower, then it may not move into subminuette wave i price territory below 1,335.79.
The target is now calculated at two degrees.
SECOND DAILY CHART – TRIANGLE
Click chart to enlarge.
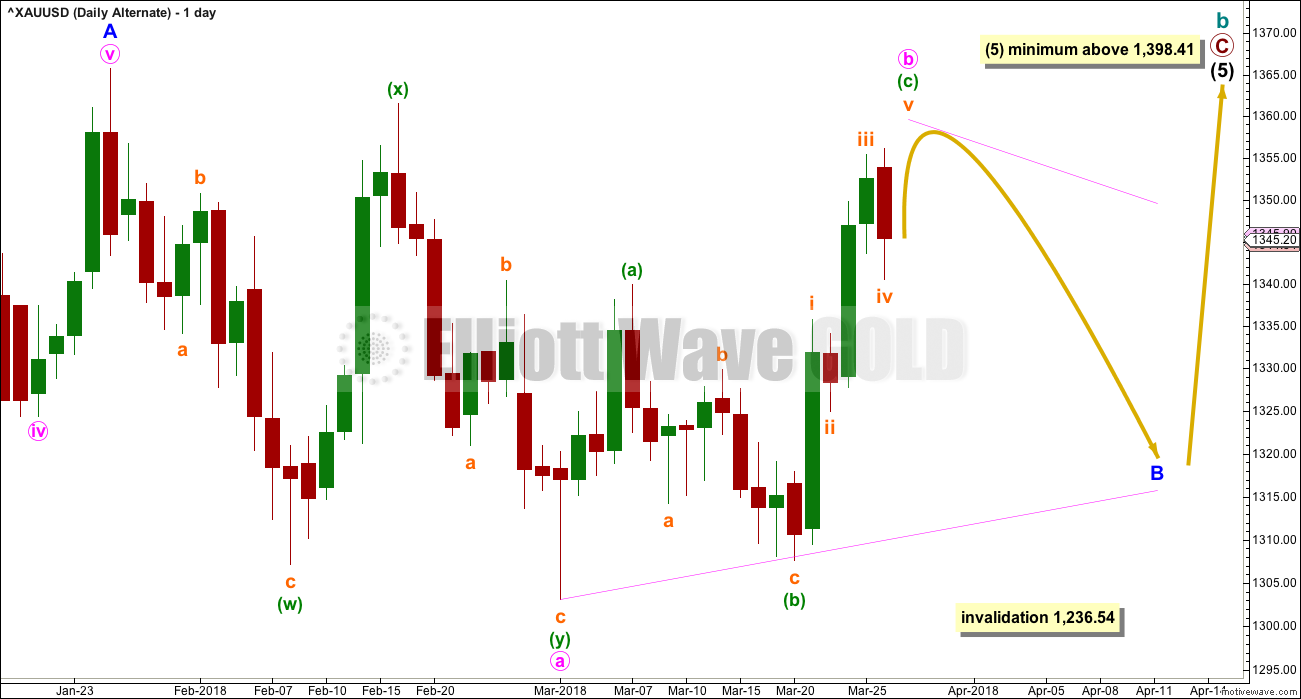
This alternate daily chart is identical to the first daily chart up to the high labelled minor wave A. Thereafter, it looks at a different structure for minor wave B.
Minor wave B may be an incomplete triangle, and within it minute wave a may have been a double zigzag. All remaining triangle sub-waves must be simple A-B-C structures, and three of the four remaining sub-waves must be simple zigzags. One remaining sub-wave may be a flat correction.
Minute wave b may be unfolding upwards as a single zigzag, and within it minuette wave (b) may not move beyond the start of minuette wave (a) below 1,303.08.
This alternate wave count expects weeks of choppy overlapping movement in an ever decreasing range.
These first two daily charts expect an impulse is unfolding higher for the short term. The subdivisions and labelling at the hourly chart level would be the same.
BEARISH ELLIOTT WAVE COUNT
FIFTH WEEKLY CHART
Click chart to enlarge.
There were five weekly charts published in the last historic analysis. This fifth weekly chart is the most immediately bearish wave count, so this is published as a bearish possibility.
This fifth weekly chart sees cycle wave b as a flat correction, and within it intermediate wave (B) may be a complete triple zigzag. This would indicate a regular flat as intermediate wave (B) is less than 1.05 the length of intermediate wave (A).
If cycle wave b is a flat correction, then within it primary wave B must retrace a minimum 0.9 length of primary wave A at 1,079.13 or below. The most common length of B waves within flats is from 1 to 1.38 times the length of the A wave. The target calculated would see primary wave B end within this range.
I have only seen two triple zigzags before during my 10 years of daily Elliott wave analysis. If this wave count turns out to be correct, this would be the third. The rarity of this structure is identified on the chart.
FIFTH DAILY CHART
Click chart to enlarge.
If a new wave down at intermediate degree is beginning, then the first wave of minor wave 1 must subdivide as a five, which may only be an impulse or a leading diagonal.
Minor wave 1 may have been a complete impulse over on the 8th of February. But this downwards wave does not look very good as a five. It can be made to fit at lower time frames, but this movement fits better as a zigzag. The probability of this wave count is reduced.
Minor wave 2 may be an incomplete expanded flat. Minute wave c would be likely to end at least slightly above the end of minute wave a at 1,361.46 to avoid a truncation and a very rare running flat. Minor wave 2 may not move beyond the start of minor wave 1 above 1,365.68.
Minute wave c must subdivide as a five wave structure, and within it minuette wave (iii) may have been over at the last high. Today’s downwards movement may have been minuette wave (iv), which has remained just above minuette wave (i) price territory.
Only one final fifth wave up may now be required to complete the structure for minor wave 2.
TECHNICAL ANALYSIS
WEEKLY CHART
Click chart to enlarge. Chart courtesy of StockCharts.com.
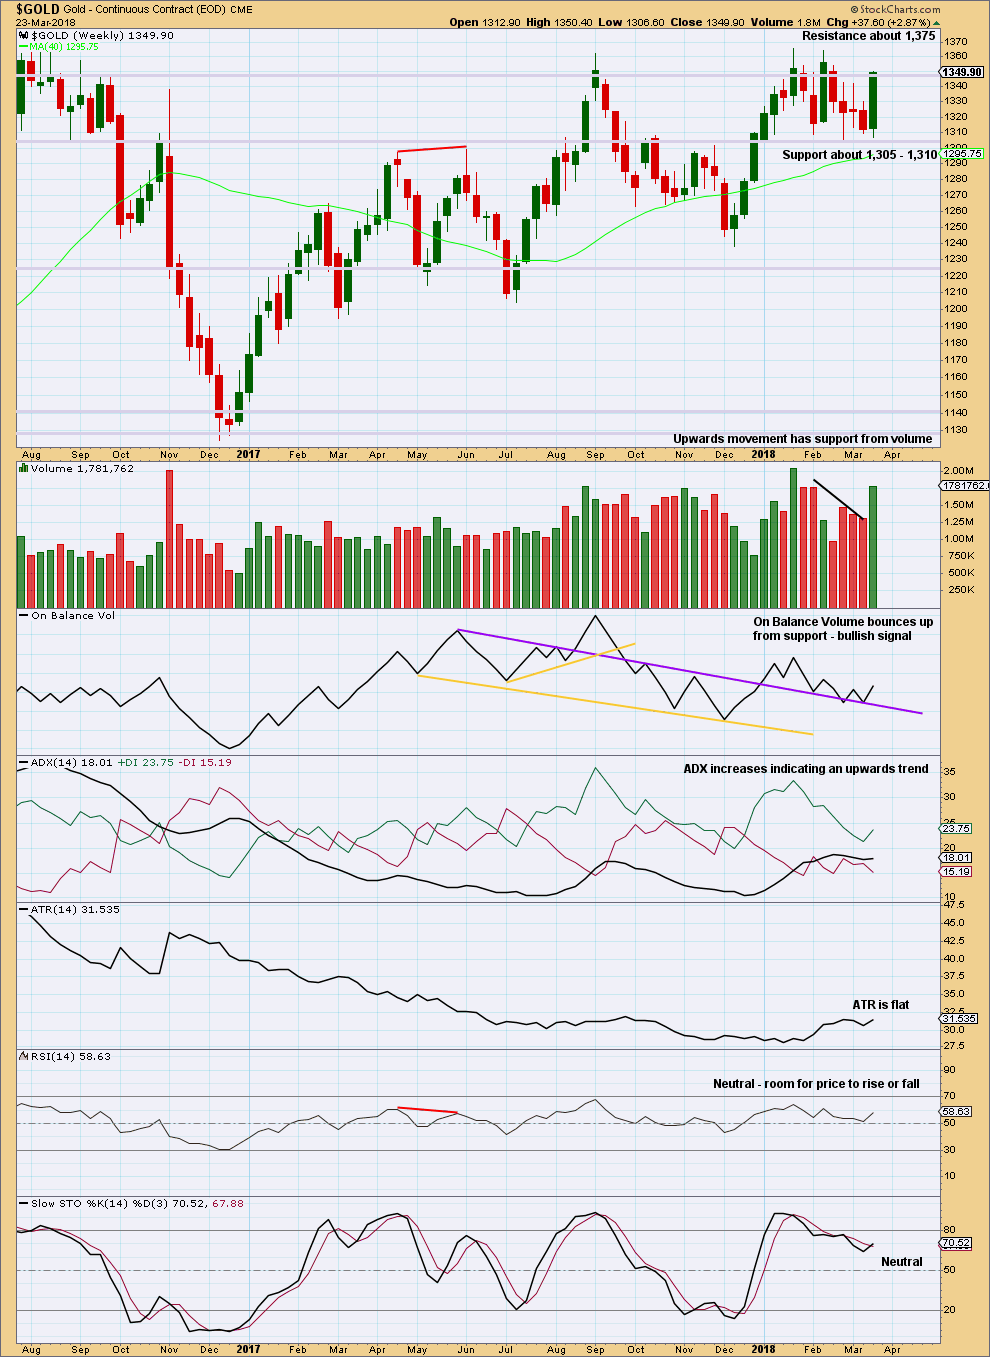
Again, price bounces up off support. Last week’s strong weekly candlestick with an almost shaven head is very bullish. Support from volume and a bullish signal from On Balance Volume all support the Elliott wave analysis which expects upwards movement is incomplete.
Look for final resistance about 1,375.
DAILY CHART
Click chart to enlarge. Chart courtesy of StockCharts.com.
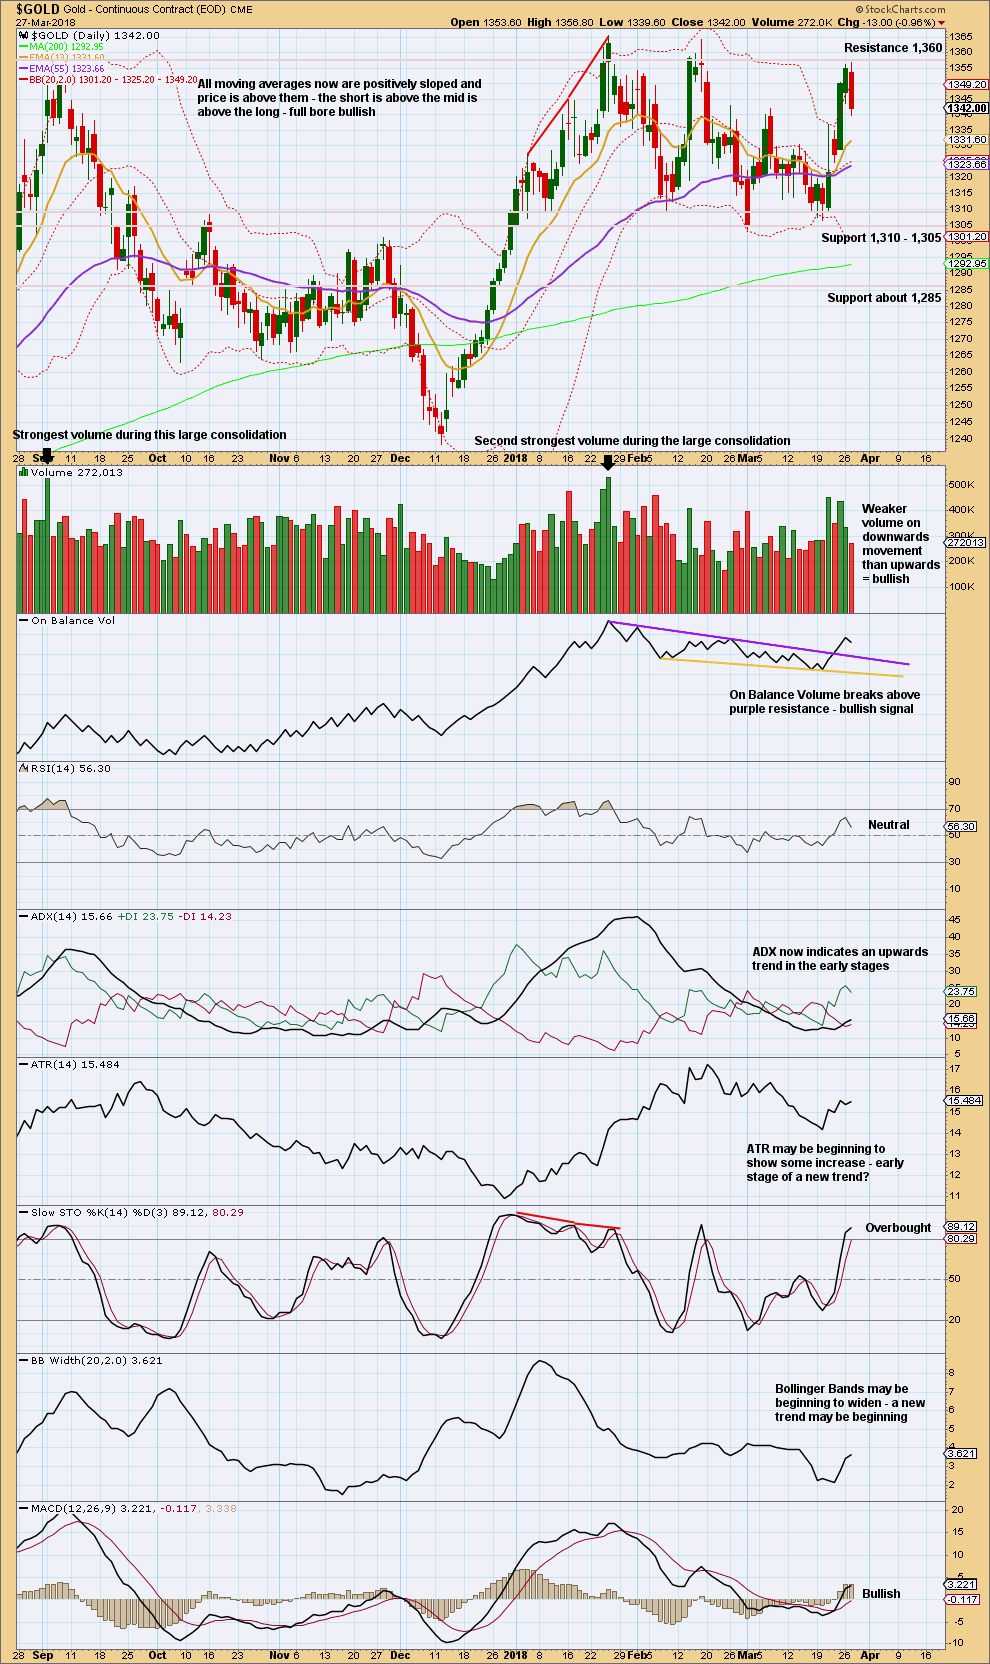
Looking at the bigger picture, Gold has been within a large consolidation since about January 2017 (this chart does not show all of this large consolidation), and during this consolidation it is two upwards days that have strongest volume and an upwards week that has strongest volume. Volume suggests an upwards breakout may be more likely than downwards.
Currently, Gold is within a smaller consolidation that began in early January 2018. This consolidation is delineated by support about 1,310 to 1,305 and resistance (final) about 1,375. It is an upwards day during this smaller consolidation that has strongest volume, suggesting an upwards breakout may be more likely here than downwards.
Today’s strong red candlestick does not have support from volume. This looks like a pullback within the upwards swing. But with Stochastics overbought and price at resistance, look out for a possibly quicker turn here than the Elliott wave count expects. The upwards swing may be done here, or with one more thrust higher, then a new downwards swing may develop.
Resistance is next at 1,360. Thereafter, further resistance is at 1,365 and then 1,375.
GDX WEEKLY CHART
Click chart to enlarge. Chart courtesy of StockCharts.com.
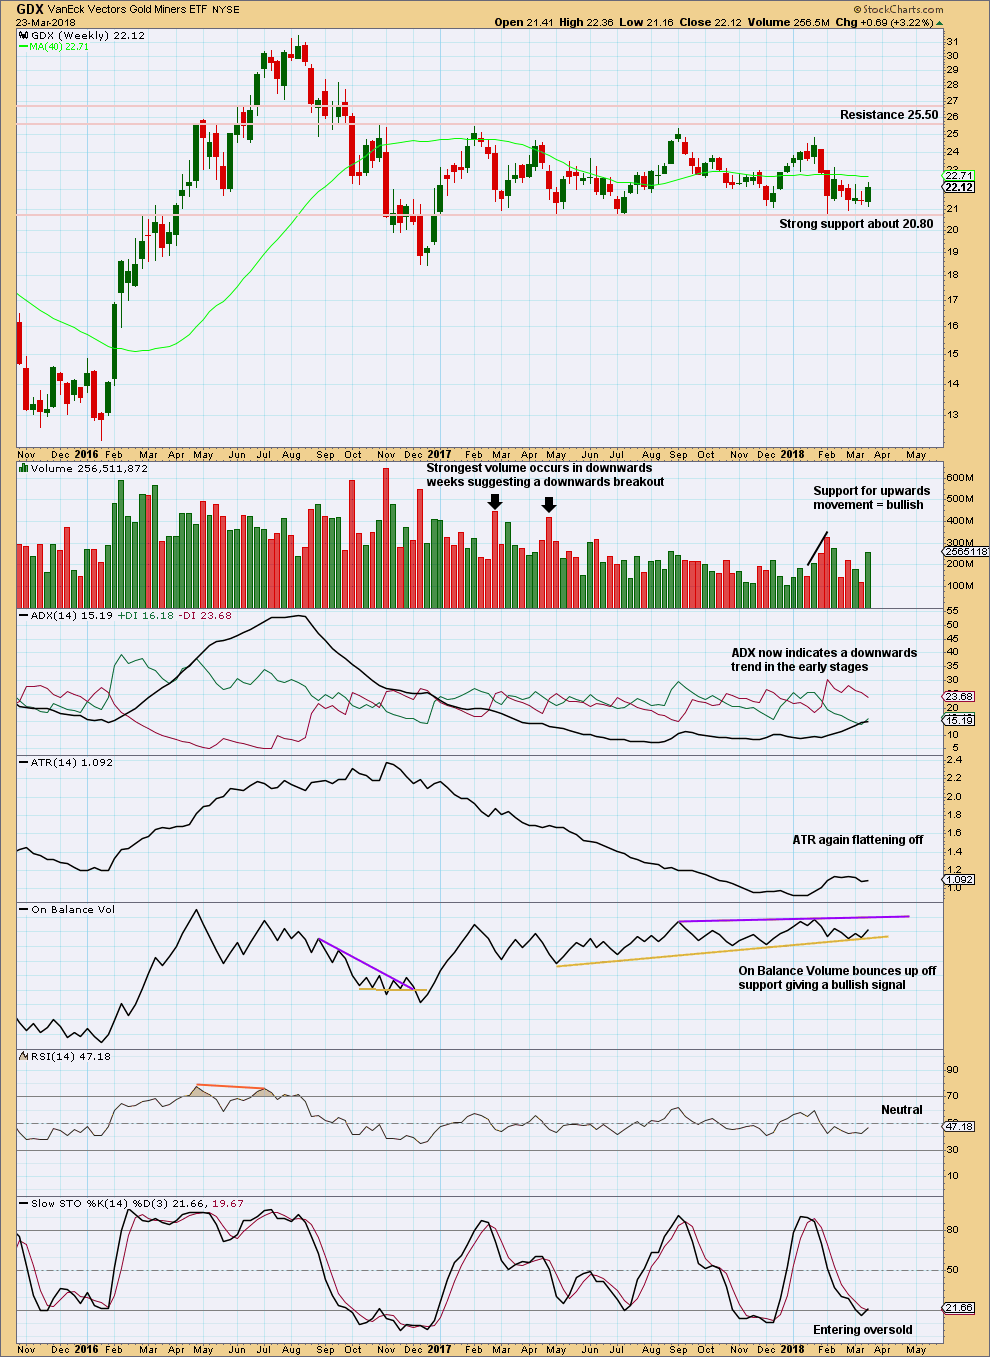
Support about 20.80 has been tested about eight times and so far has held. The more often a support area is tested and holds, the more technical significance it has.
In the first instance, expect this area to continue to provide support. Only a strong downwards day, closing below support and preferably with some increase in volume, would constitute a downwards breakout from the consolidation that GDX has been in for a year now.
Resistance is about 25.50. Only a strong upwards day, closing above resistance and with support from volume, would constitute an upwards breakout.
Bullish volume last week and a bullish signal from On Balance Volume offer support to the view that an upwards swing should continue here to resistance.
GDX DAILY CHART
Click chart to enlarge. Chart courtesy of StockCharts.com.
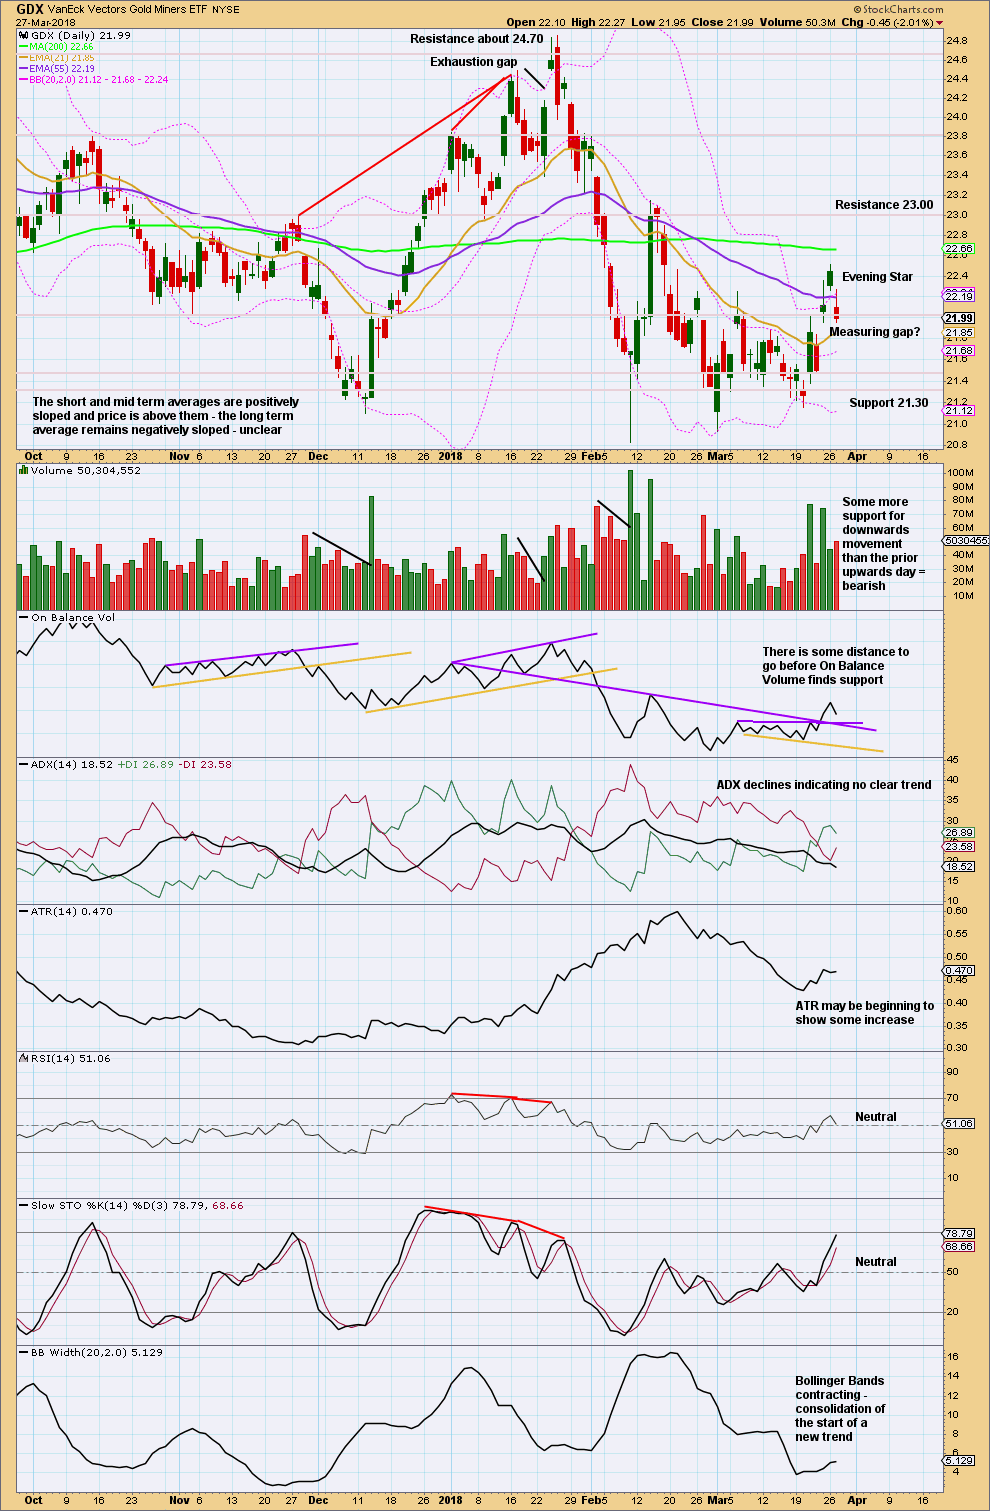
A bullish signal from On Balance Volume at the daily chart level and a bullish volume profile suggest more upwards movement this week for GDX.
Assume the opening gap for Friday is a measuring gap until proven otherwise. Measuring gaps may be used in trading to place stops. They are not usually closed for some time, so in an upwards trend should provide support. Stops may be placed just below the gap. This measuring gap gives a target at 22.63. Price may have fallen a little short of this target at yesterday’s high of 22.51.
GDX is not as clearly bullish as Gold today. Looks like GDX may have turned because of support from volume for some downwards movement and a candlestick reversal pattern after four days of upwards movement.
Published @ 07:43 p.m. EST.
Lara, these 3 links “work”, but they land on the “Members Only” page. Cache is not the issue:
Last historic analysis with monthly charts is here. Video is here.
An alternate idea at the monthly chart level is given here at the end of this analysis.
An historic example of a cycle degree fifth wave is given at the end of the analysis here.
Thanks
Did it do that when you were logged in?
If you’re logged in then it should take you to the page. If you’re not then it shouldn’t.
It’s still members only content.
Dammit. This is why I really hate B waves. I thought it was becoming clear, but nope.
It could still be a triangle. Or it could be a double combination; flat – X – zigzag.
Now, minute y could also be a flat for a double flat, or a triangle for a double combination. But those are way less common than one flat and one zigzag in a double. I think I’ve only ever seen one double flat before? And if it’s a triangle then the pathway would be essentially the same here on for a triangle for the whole of minor B.
Goodness. I hope that makes sense!
Anyway. Another swing down to support has started sooner than expected. Still strong support in the 1,310 – 1,305 area.
Minute y would be expected to end about the same level as minute w so the whole thing moves sideways and achieves the purpose and look of a combination.
I’ll be working on alternates also today. Will publish what I can find.
I like this chart a lot better. We had 2 days this week top out (stretching) the top Bollinger Bands. If it drops below 1309.4 (June Contracts Price (don’t ask)) it will bottom out the lower Bollinger Bands allowing for your theoretically move up and out of the current range we are stuck in. Unfortunately for me, I have not matched this to any of the week charts.
I am out. Confirmation of bearish island reversal and strong attack of 50 day SMA by GLD bearish IMHO…switching to bearish call spreads.
Burnt through another stop man this is being difficult to trade
Does anyone know if these dates/hours are in NZ time or NY time? I apologize if I missed that info.
To Dreamer and Melanie, I’m sure Cesar will fix the links when he has an opportunity. Until then, go back a bit in the updates and those links work. Although the cycles etc aren’t quite matching up for me and comments are closed on past updates. I wonder if we’ll get an updated longer term cycle anytime in the near future? Maybe I’m just reading them wrong. I’ve started going back to the basics/ learner videos to see why I appear to be incorrect reading these charts. I also scrolled waaaay back on the oil time machine and found no charts with longer cycles for reference. At least the layout isn’t nice to me finding information without hours of searching. I like these charts and analysis, in theory.
Lara bases the analysis and dates on New York time. Comments get closed after 7 days, but you can read them indefinitely. By the way, “welcome” to the group here. Good to see new members posting. Keep asking questions. You will learn a lot here from Lara and others. Read through the posts categorized as “historical “ for the signicant prior updates. Link for gold historical is below 😀
http://elliottwavegold.com/category/commodities/gold-historical/
THANK YOU DREAMER!!!
All the charts and all comments on the website are always in New York time.
Looks like gold has started the next leg down. As Lara states, B waves are very challenging to analyze and trade. Patience is key. Wait for a bottom to go long . We may get an excellent opportunity to go long in 2-3 weeks. 😄
Consolidations are difficult to trade. Only the most experienced traders should attempt them. Swings from resistance to support, and back again. And not in a straight line.
Trading systems to trade in consolidations typically experience a few large losses and many small profits.
If you’re not a very experienced trader this is the time to wait patiently and prepare for the breakout. Or hedge.
Thank you for the reply. I do appreciate the interaction. I’m with Brandon, I exited everything at 0 for the week. I originally had the idea of a Tuesday Reversal which is exactly what it was. I knew better, but it is what it is. I’m not even going to try to catch this next move down (if that’s how it’s setting up). I’ll try to cherry pick as close to the bottom and go long from there I guess.
Lara,
Like Dreamer, I am also trying to figure out if the links on Lara’s Wkly are active or not? So far not working…
As per my comment to Dreamer below. I’ve checked them again just now, all works for me.
After clearing your cache and trying again, please let me know if it’s still not working. And if it isn’t then Cesar will invariably want to know what system and browser you’re using.
Thank you.
Lara, still having issues with 3 of the links on Lara’s Weekly. See my post over there. Thanks,
Dreamer, I just checked them and they’re all working for me.
Try clearing your cache? Maybe that’s the problem?
The chart of Gold futures is starting to worry me a bit. Moves down look impulsive and upward corrective of late. I am holding bull put spreads that are just about break-even and GLD 128 strike calls slightly underwater. Tomorrow will be decision day on those trades. 😎