
Lara’s Weekly is an end of week Elliott Wave and Technical Analysis of the S&P 500, GOLD, and USOIL that focuses on the mid-to-long-term picture. This analysis service is designed for investors and swing traders.
Lara’s Weekly is at this time available to the general public, but in the near future it will be available by subscription only. I will be offering a once only awesome Grandfather rate to the earliest subscribers when Lara’s Weekly is launched as a paid subscription service. To make sure you don’t miss out and not get the Grandfather rate, be notified: click on the Notify Me button below:

S&P 500
The first target for downwards movement was 2,612, and thereafter the 200 day moving average at 2,584. Price ended very close to the 200 day moving average for the session at 2,588.
Summary: The target for downwards movement to end Monday or Tuesday is 2,565 – 2,566. Thereafter an upwards swing may develop.
Always practice good risk management. Always trade with stops and invest only 1-5% of equity on any one trade.
The biggest picture, Grand Super Cycle analysis, is here.
Last historic analysis with monthly charts is here. Video is here.
An alternate idea at the monthly chart level is given here at the end of this analysis.
An historic example of a cycle degree fifth wave is given at the end of the analysis here.
MAIN ELLIOTT WAVE COUNT
WEEKLY CHART
Click chart to enlarge.
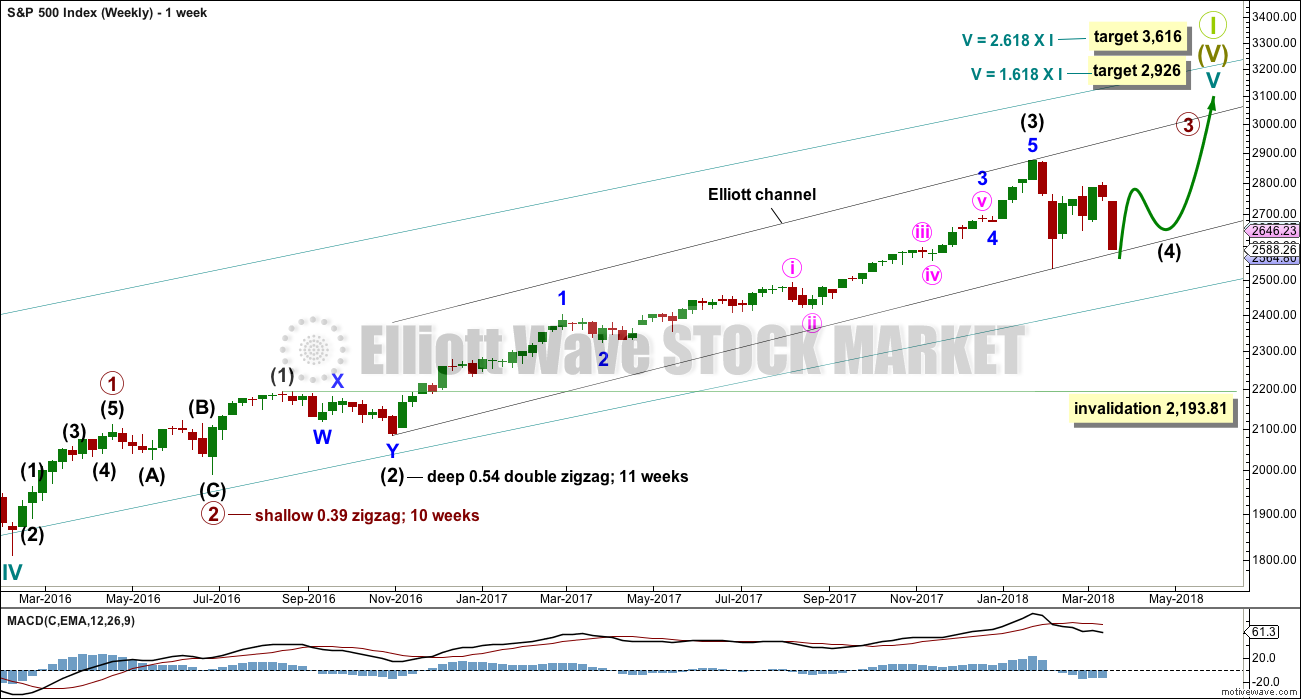
Cycle wave V must complete as a five structure, which should look clear at the weekly chart level. It may only be an impulse or ending diagonal. At this stage, it is clear it is an impulse.
Within cycle wave V, the third waves at all degrees may only subdivide as impulses.
Intermediate wave (4) has breached an Elliott channel drawn using Elliott’s first technique. The channel is redrawn using Elliott’s second technique as if intermediate wave (4) was over at the last low. If intermediate wave (4) continues sideways, then the channel may be redrawn when it is over. The upper edge may provide resistance for intermediate wave (5).
Intermediate wave (4) may not move into intermediate wave (1) price territory below 2,193.81. At this stage, it now looks like intermediate wave (4) may be continuing further sideways as a combination, triangle or flat. These three ideas are separated into separate daily charts. All three ideas would see intermediate wave (4) exhibit alternation in structure with the double zigzag of intermediate wave (2).
A double zigzag would also be possible for intermediate wave (4), but because intermediate wave (2) was a double zigzag this is the least likely structure for intermediate wave (4) to be. Alternation should be expected until price proves otherwise.
DAILY CHART – TRIANGLE
Click chart to enlarge.
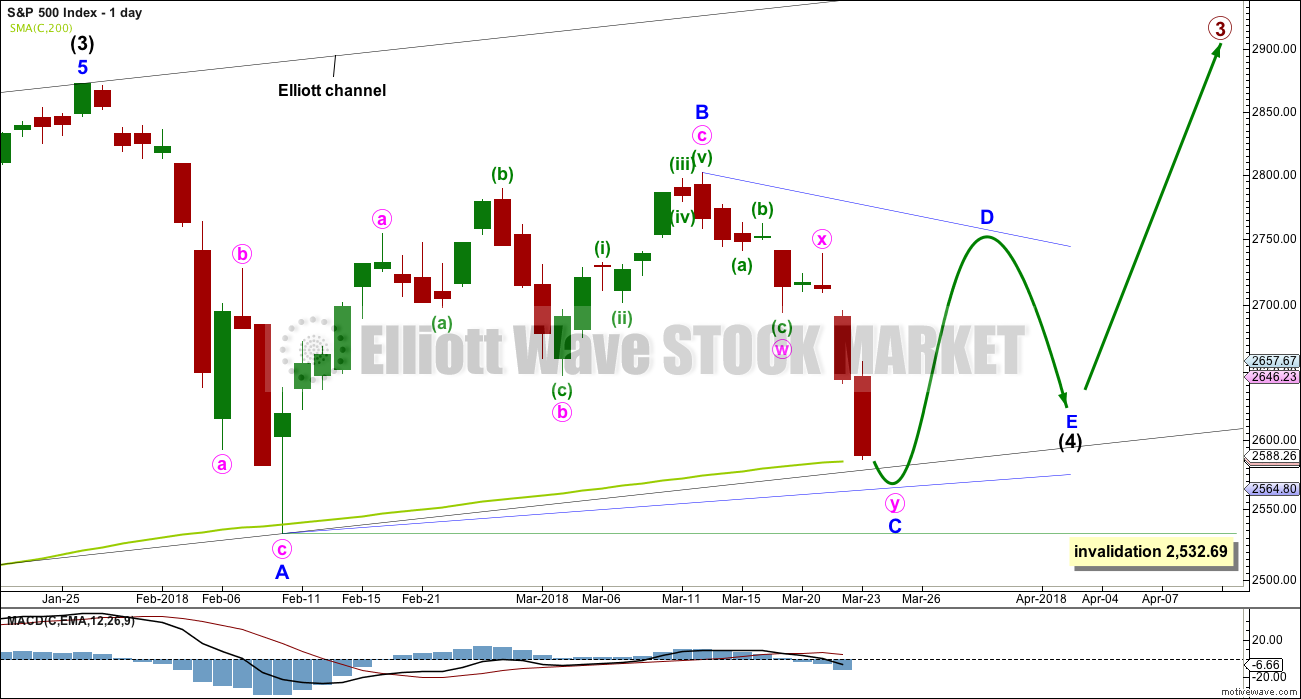
This first daily chart outlines how intermediate wave (4) may now continue further sideways as a contracting or barrier triangle. It is possible that minor wave B within the triangle was over at the last high, which would mean the triangle would be a regular triangle. Minor wave C downwards may now be underway and may be a single or double zigzag. One of the five sub-waves of a triangle is usually a more complicated multiple, and the most common sub-wave to do this is wave C. It looks like minor wave C may be unfolding as a double zigzag, at this stage, and this is how it will be labelled. Within the double zigzag, minute wave x should not make a new high above the start of minute wave w at 2,801.90.
Minor wave C may not make a new low below the end of minor wave A at 2,532.69.
The new target calculated today at the hourly chart level would see both the 200 day moving average and the lower black trend line overshot. This would be acceptable.
Intermediate wave 2 lasted 11 weeks. If intermediate wave (4) is incomplete, then it would have so far lasted only eight weeks. Triangles tend to be very time consuming structures, so intermediate wave (4) may total a Fibonacci 13 or even 21 weeks at its conclusion.
Because this is the only daily chart which expects price to continue to find support about the 200 day moving average, it is presented first; it may have a slightly higher probability than the next two daily charts.
HOURLY CHART
Click chart to enlarge.
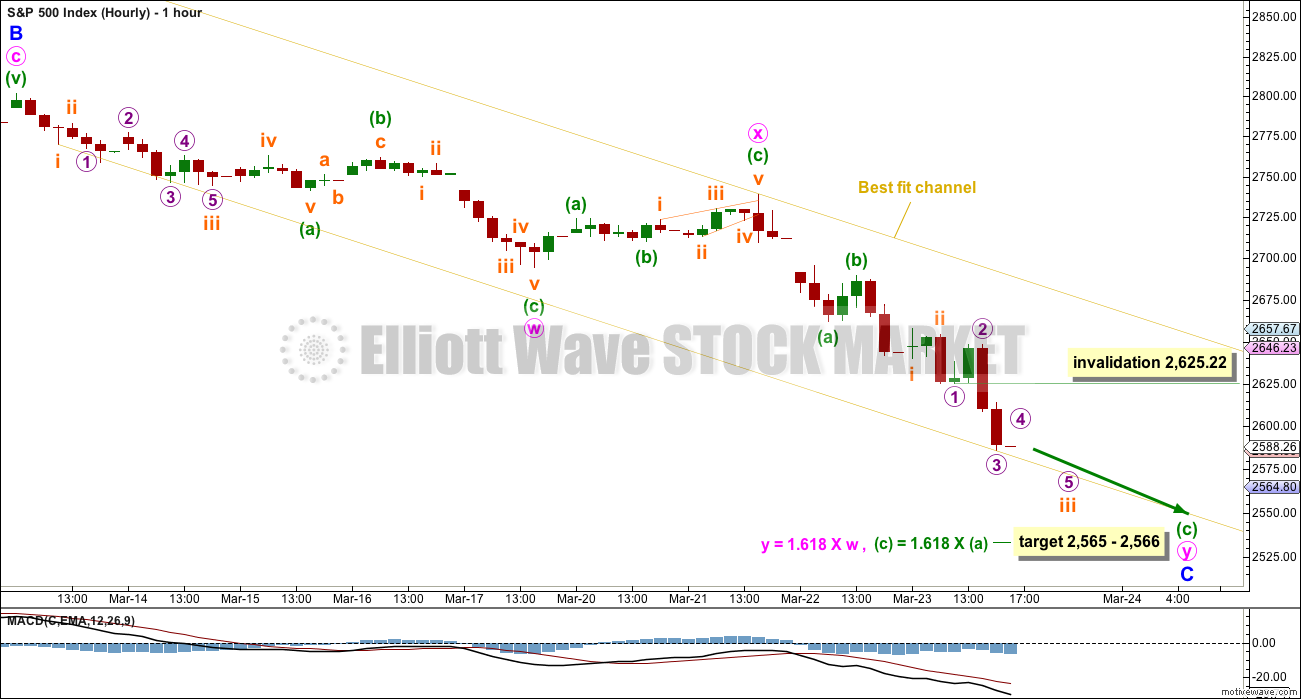
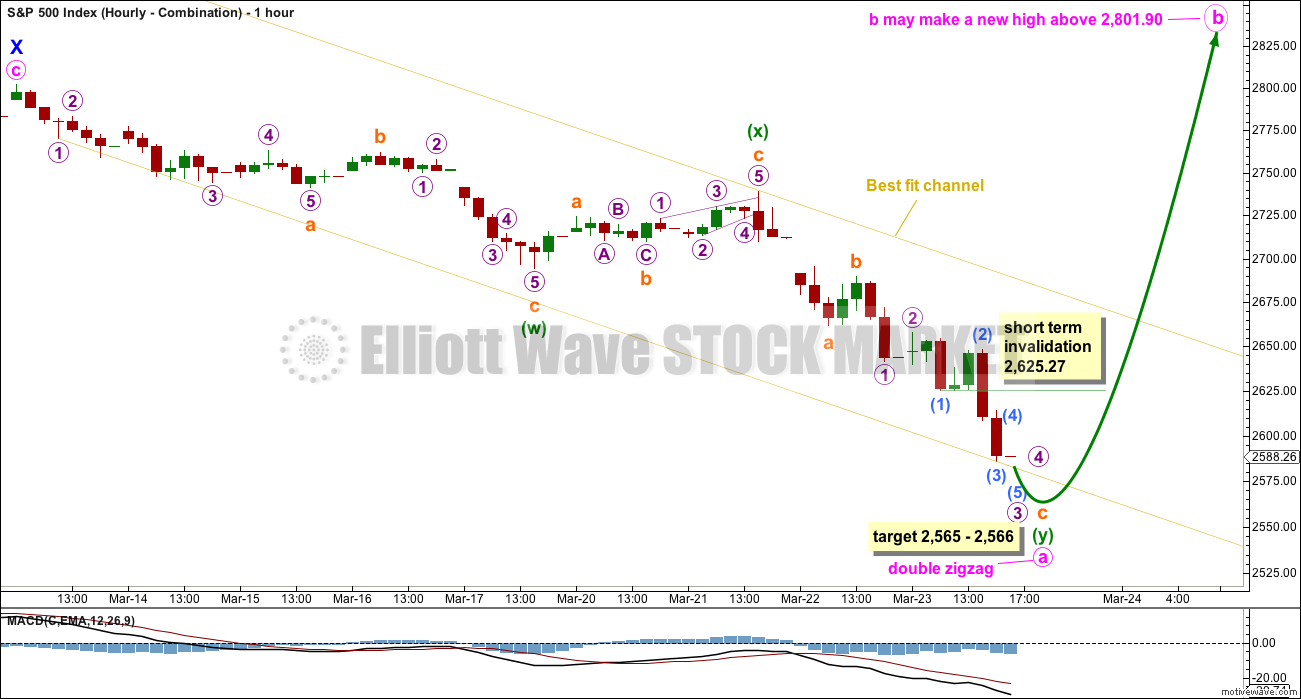
A double zigzag may be close to completion.
Within the second zigzag, minuette wave (c) has passed equality in length with minuette wave (a). The next Fibonacci ratio in the sequence is used to calculate a new target. This is just one point off a target calculated at minute degree.
Minuette wave (c) must subdivide as a five wave structure. So far the middle portion may be complete at Friday’s low, or very close to completion. There should be too more small intraday corrections along the way down to the target: the first for micro wave 4 and the next for subminuette wave iv.
Micro wave 4 may not move into micro wave 1 price territory above 2,625.22.
When subminuette wave iii is complete, then subminuette wave iv may not move into subminuette wave i price territory above 2,639.97.
The best fit channel is drawn with the first trend line from the low of subminuette wave i within minute wave w, then to the last low. A parallel copy is placed upon the high of minute wave x. Keep redrawing the channel as price moves lower (it is essentially an adjusted acceleration channel). When minor wave C is complete, a breach of the channel by upwards movement would indicate confidence in a low in place and a trend change.
For the very short term, a new high above 2,625.22 without any downwards movement first would indicate a low may be in place, and my analysis of this downwards wave would then be wrong.
DAILY CHART – COMBINATION
Click chart to enlarge.
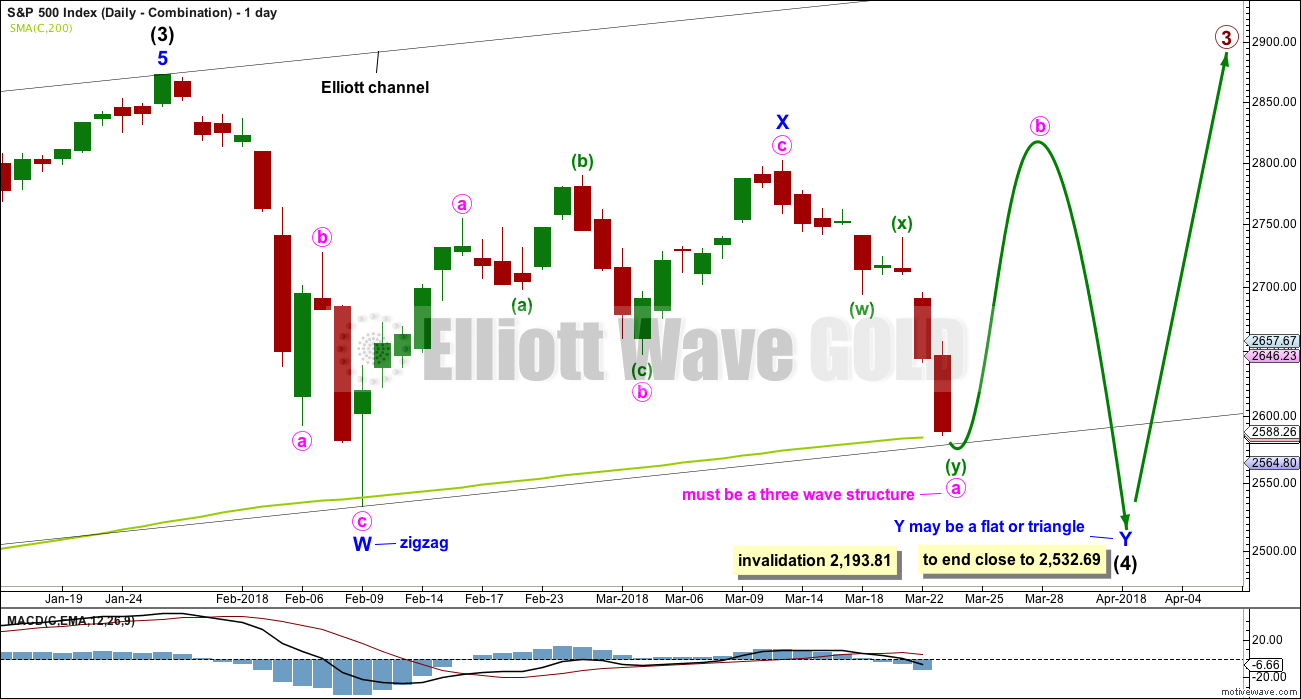
Double combinations are very common structures. The first structure in a possible double combination for intermediate wave (4) would be a complete zigzag labelled minor wave W. The double should be joined by a three in the opposite direction labelled minor wave X, which may be a complete zigzag. X waves within combinations are typically very deep; if minor wave X is over at the last high, then it would be a 0.79 length of minor wave W, which is fairly deep giving it a normal look. There is no minimum nor maximum requirement for X waves within combinations.
The second structure in the double would most likely be a flat correction labelled minor wave Y. It may also be a triangle, but in my experience this is very rare.
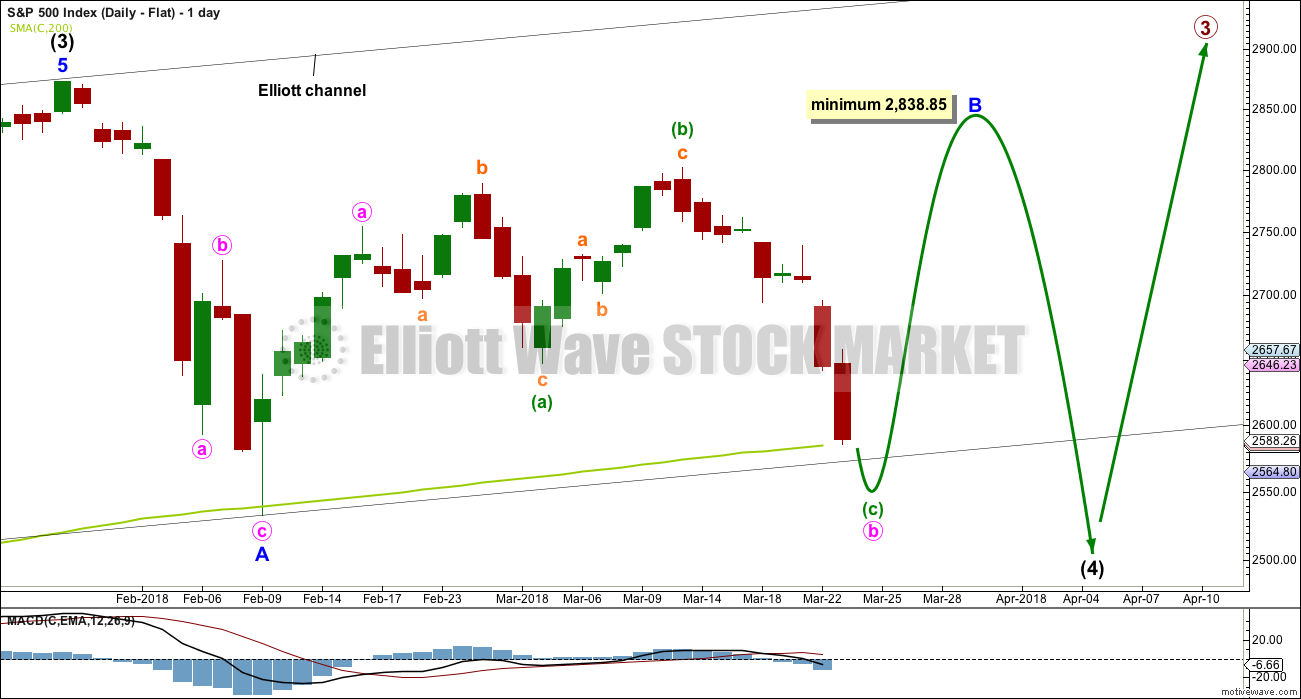
A flat correction would subdivide 3-3-5. Minute wave a must be a three wave structure, most likely a zigzag. It may also be a double zigzag. On the hourly chart, this is now how this downwards movement fits best, and this will now be how it is labelled.
The purpose of combinations is to take up time and move price sideways. To achieve this purpose the second structure in the double usually ends close to the same level as the first. Minor wave Y would be expected to end about the same level as minor wave W at 2,532.69. This would require a strong overshoot or breach of the 200 day moving average, which looks unlikely.
HOURLY CHART – COMBINATION
Click chart to enlarge.
The target, channel and subdivisions for this idea are exactly the same as the first hourly chart. Both daily charts expect a double zigzag is unfolding lower.
DAILY CHART – FLAT
Click chart to enlarge.
Flat corrections are very common. The most common type of flat is an expanded flat. This would see minor wave B move above the start of minor wave A at 2,872.87.
Within a flat correction, minor wave B must retrace a minimum 0.9 length of minor wave A at 2,838.85. The most common length for minor wave B within a flat correction would be 1 to 1.38 times the length of minor wave A at 2,872.87 to 3,002.15. An expanded flat would see minor wave B 1.05 times the length of minor wave A or longer, at 2,889.89 or above.
When minor wave B is a complete corrective structure ending at or above the minimum requirement, then minor wave C downwards would be expected to make a new low below the end of minor wave A at 2,532.69 to avoid a truncation.
Minor wave B may be continuing higher as a double zigzag. At this stage, this would be the most likely structure to achieve the height required for minor wave B.
This wave count remains valid. Minor wave B is again relabelled; it may be a time consuming sideways structure that at this time would be incomplete. If minor wave B is itself unfolding as an expanded flat, then within it minute wave b may make a new low below the start of minute wave a at 2,532.69.
This wave count would require a very substantial breach of the 200 day moving average for the end of intermediate wave (4). This looks unlikely.
DAILY CHART – ALTERNATE
Click chart to enlarge.
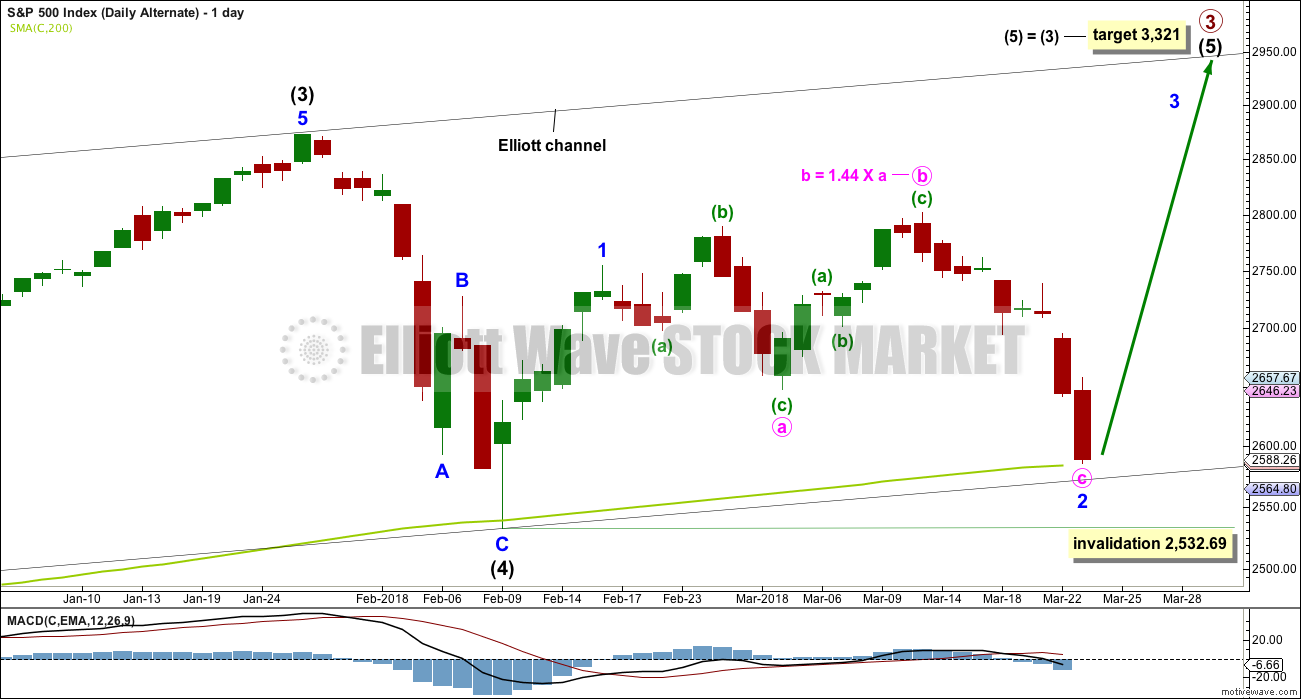
It is possible still that intermediate wave (4) was complete as a relatively brief and shallow single zigzag.
A new all time high with support from volume and any one of a bullish signal from On Balance Volume or the AD line would see this alternate wave count become the main wave count.
Minor wave 2 may be over at Friday’s low, or it may be over early next week with a little more downwards movement. Minor wave 3 may begin upwards shortly.
Minor wave 2 may not move beyond the start of minor wave 1 below 2,532.69.
TECHNICAL ANALYSIS
WEEKLY CHART
Click chart to enlarge. Chart courtesy of StockCharts.com.
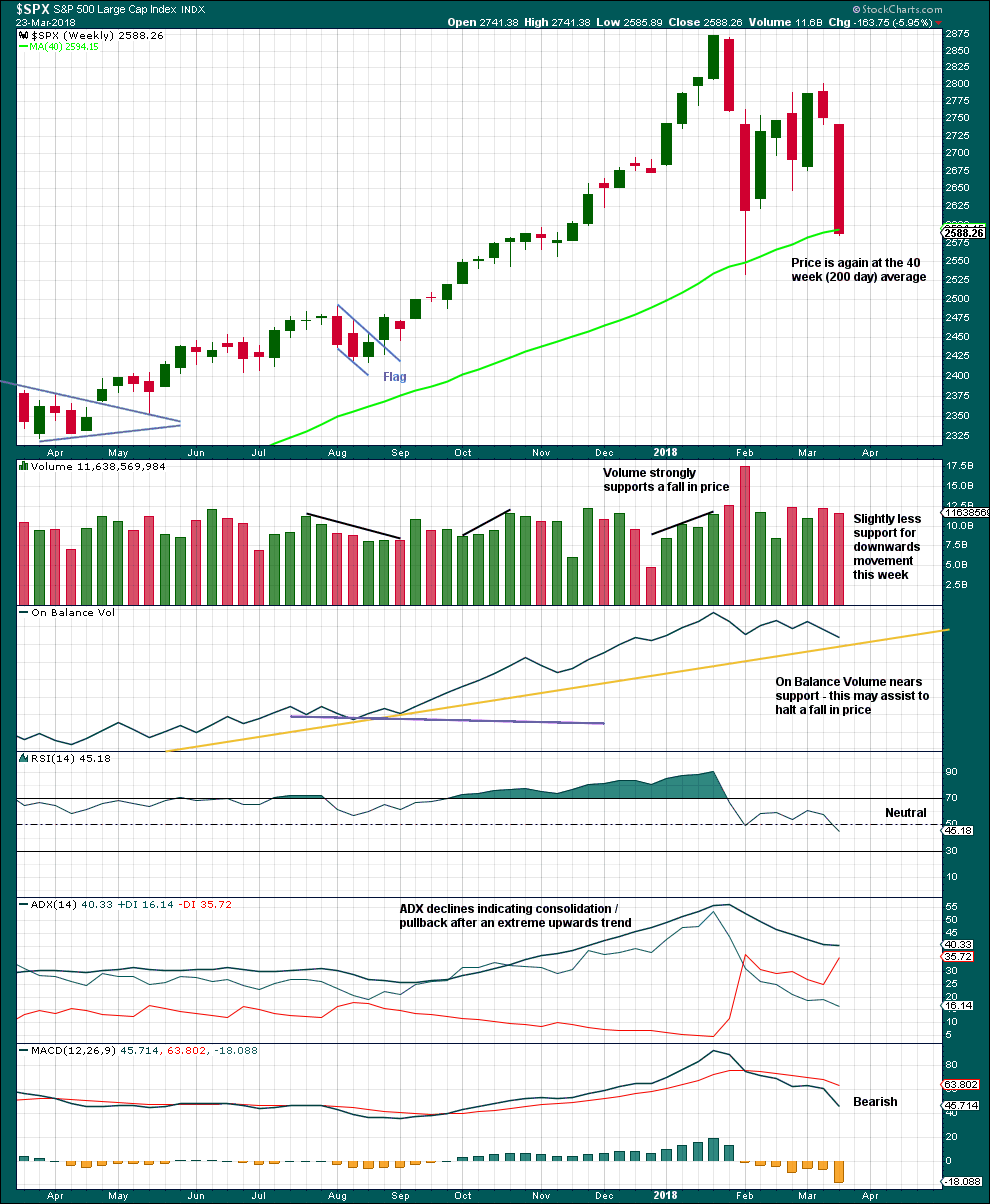
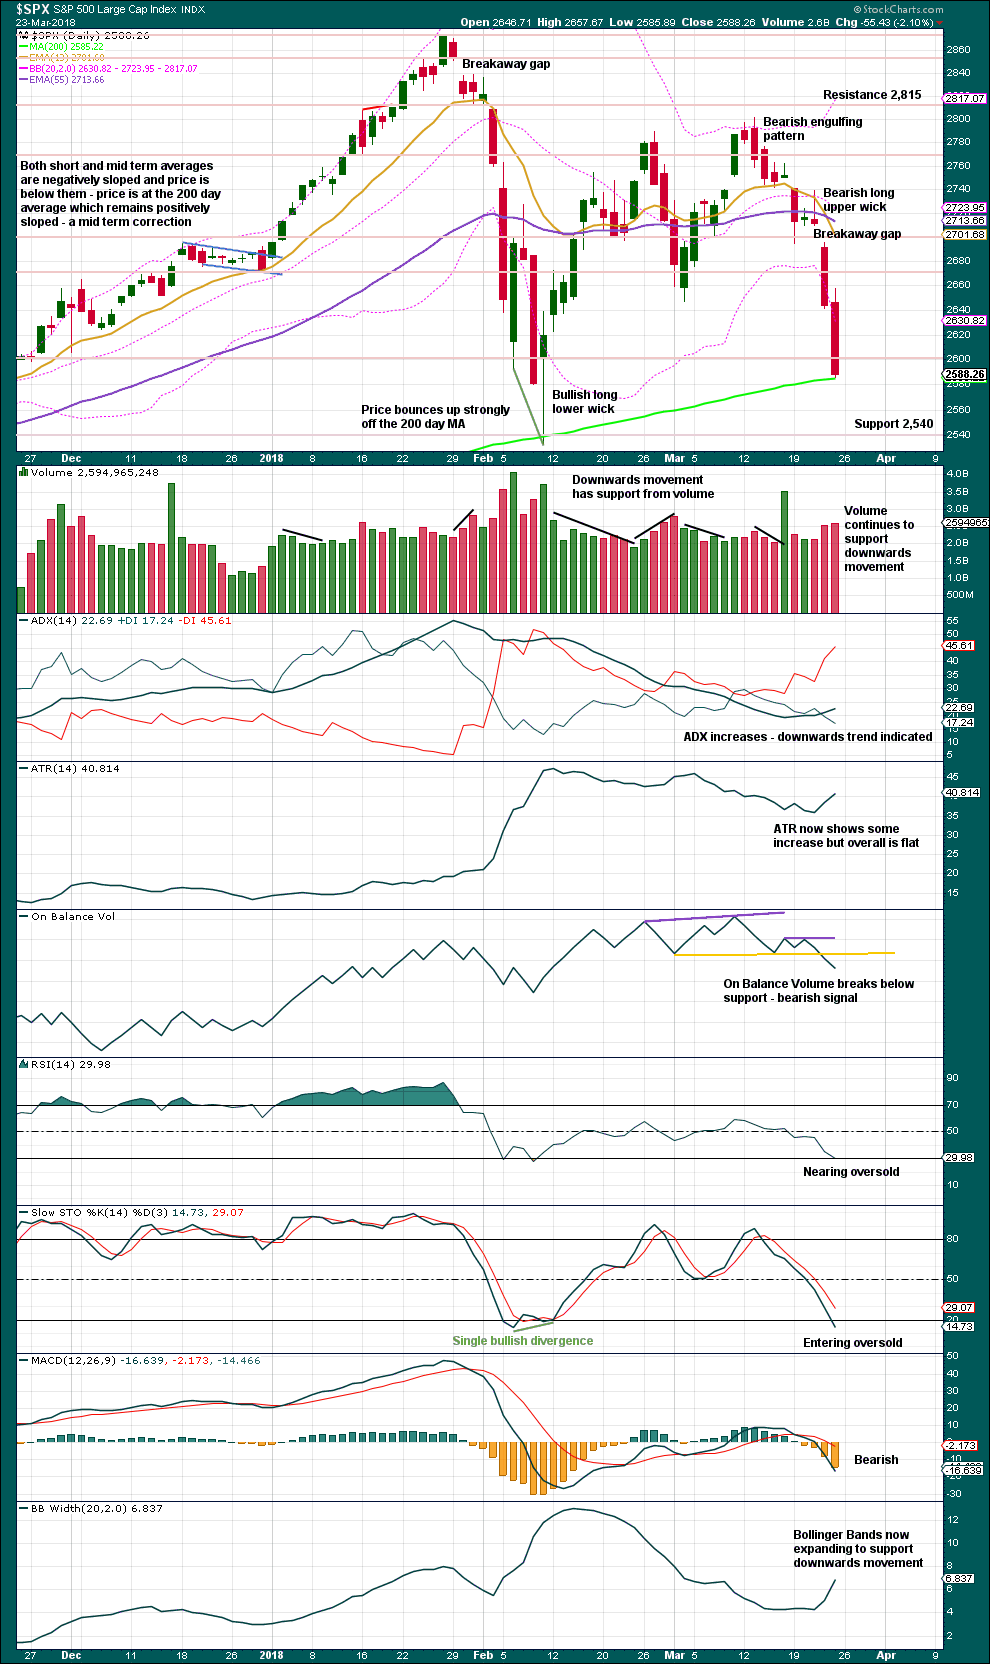
Although a slight decline in volume this week and On Balance Volume nearing support indicate downwards movement may end soon, the close very near to the low and the lack of a long lower wick indicate downwards movement is probably not yet done.
DAILY CHART
Click chart to enlarge. Chart courtesy of StockCharts.com.
Assume until proven otherwise that the gap at the open of Thurdsay’s session is a breakaway gap from a small consolidation, which may provide resistance while it remains open.
There is no long lower wick nor decline in volume to suggest downwards movement may end here. Expect it to continue lower. It looks like the 200 day moving average may again be overshot.
If a day with a long lower wick develops, or Stochastics or RSI is oversold and then exhibits divergence, a low may then be in place.
VOLATILITY – INVERTED VIX CHART
Click chart to enlarge. Chart courtesy of StockCharts.com.
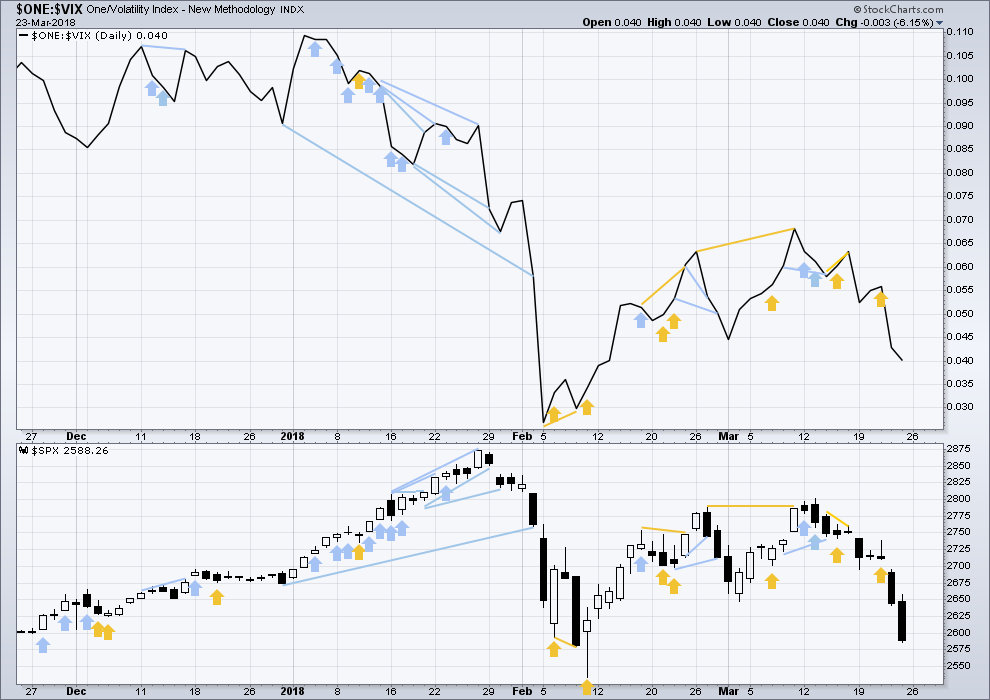
So that colour blind members are included, bearish signals will be noted with blue and bullish signals with yellow.
Normally, volatility should decline as price moves higher and increase as price moves lower. This means that normally inverted VIX should move in the same direction as price.
Downwards movement for Thursday and Friday has support from a normal increase in volatility. This is bearish.
BREADTH – AD LINE
Click chart to enlarge. Chart courtesy of StockCharts.com.
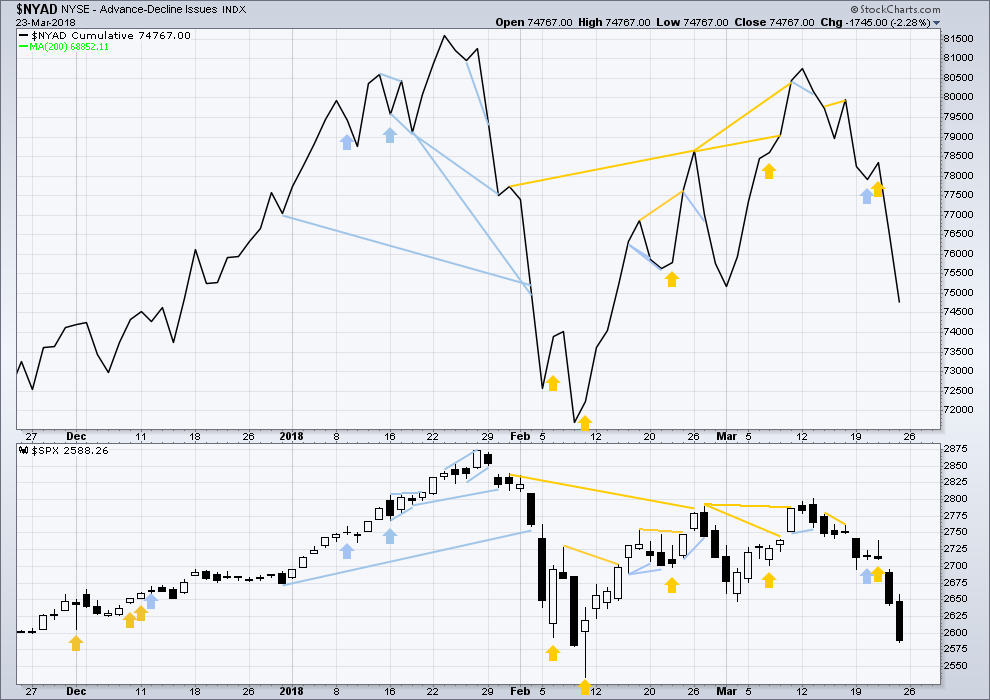
There is normally 4-6 months divergence between price and market breadth prior to a full fledged bear market. This has been so for all major bear markets within the last 90 odd years. With no longer term divergence yet at this point, any decline in price should be expected to be a pullback within an ongoing bull market and not necessarily the start of a bear market.
All of small, mid and large caps this week fell strongly. The fall in price has broad support from market breadth. It was small caps though that had the least decline. This slight divergence indicates some weakness and may be interpreted as slightly bullish.
Breadth should be read as a leading indicator.
Downwards movement for Thursday and Friday has support from strongly declining market breadth. This is bearish. There is no divergence.
DOW THEORY
All indices have made new all time highs as recently as nine weeks ago, confirming the ongoing bull market.
The following lows need to be exceeded for Dow Theory to confirm the end of the bull market and a change to a bear market:
DJIA: 17,883.56.
DJT: 7,039.41.
S&P500: 2,083.79.
Nasdaq: 5,034.41.
Charts showing each prior major swing low used for Dow Theory are here.
GOLD
A pullback was expected to end about 1,318 and an upwards swing to resume there, but the pullback was already over and upwards movement continued.
Summary: Look for a little sideways or lower movement to begin the new week, which may end about 1,344. Thereafter, the upwards swing should continue to the target, which remains at 1,367.
Grand SuperCycle analysis is here.
Last in-depth historic analysis with monthly and several weekly charts is here, video is here.
There are multiple wave counts at this time at the weekly and monthly chart levels. In order to make this analysis manageable and accessible only two will be published on a daily basis, one bullish and one bearish. This does not mean the other possibilities may not be correct, only that publication of them all each day is too much to digest. At this stage, they do not diverge from the two possibilities below.
BULLISH ELLIOTT WAVE COUNT
FIRST WEEKLY CHART
Click chart to enlarge.
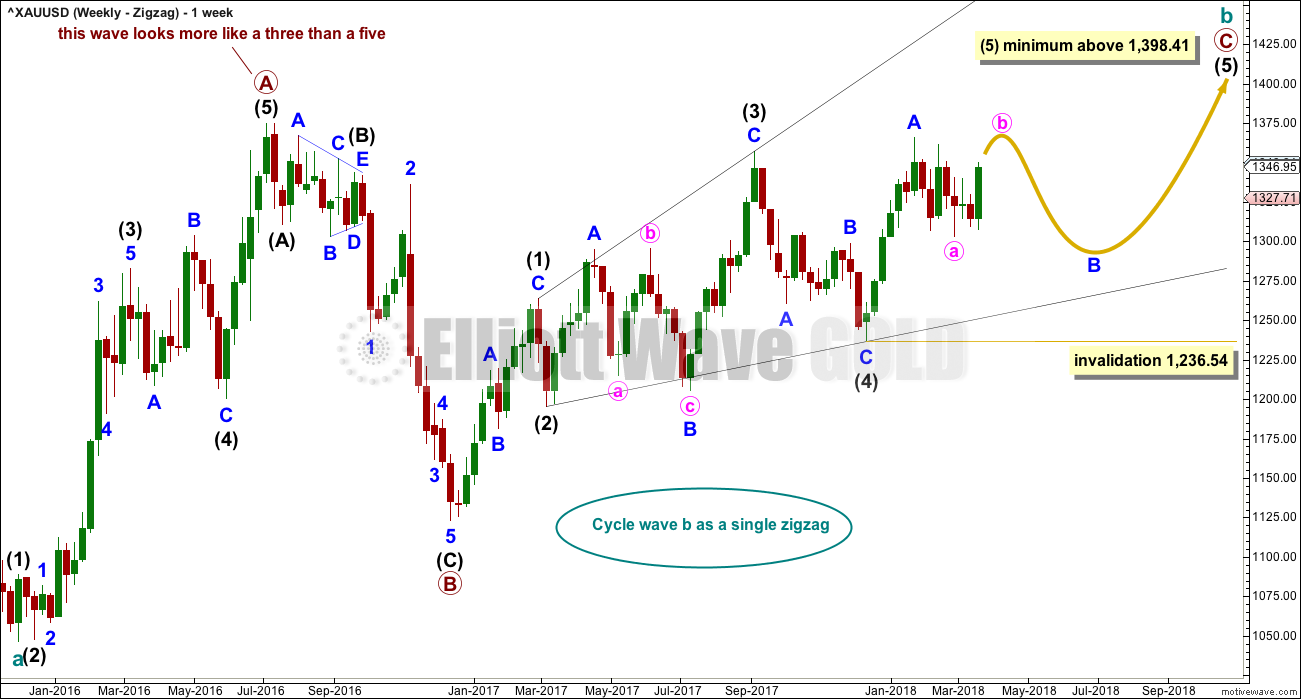
Cycle wave b may be a single zigzag. Zigzags subdivide 5-3-5. Primary wave C must subdivide as a five wave structure and may be either an impulse or an ending diagonal. Overlapping at this stage indicates an ending diagonal.
Within an ending diagonal, all sub-waves must subdivide as zigzags. Intermediate wave (4) must overlap into intermediate wave (1) price territory. This diagonal is expanding: intermediate wave (3) is longer than intermediate wave (1) and intermediate wave (4) is longer than intermediate wave (2). Intermediate wave (5) must be longer than intermediate wave (3), so it must end above 1,398.41 where it would reach equality in length with intermediate wave (3).
Within the final zigzag of intermediate wave (5), minor wave B may not move beyond the start of minor wave A below 1,236.54.
Within the diagonal of primary wave C, each sub-wave is extending in price and so may also do so in time. Within each zigzag, minor wave B may exhibit alternation in structure and may show an increased duration.
Within intermediate wave (1), minor wave B was a triangle lasting 11 days. Within intermediate wave (2), minor wave B was a zigzag lasting 2 days. Within intermediate wave (3), minor wave B was a regular flat lasting 60 days. Within intermediate wave (4), minor wave B was a regular contracting triangle lasting 40 days. Within intermediate wave (5), minor wave B may be expected to be an expanded flat, combination or running triangle to exhibit some alternation in structure. It may last as long as 40 to 60 days. So far it has lasted 41 days (refer to daily chart) and the structure is incomplete.
At this stage, it looks like minor wave B may most likely be a flat correction, or it may also still be a triangle. Both ideas are presented below.
This first weekly chart sees the upwards wave labelled primary wave A as a five wave structure. It must be acknowledged that this upwards wave looks better as a three than it does as a five. The fifth weekly chart below will consider the possibility that it was a three.
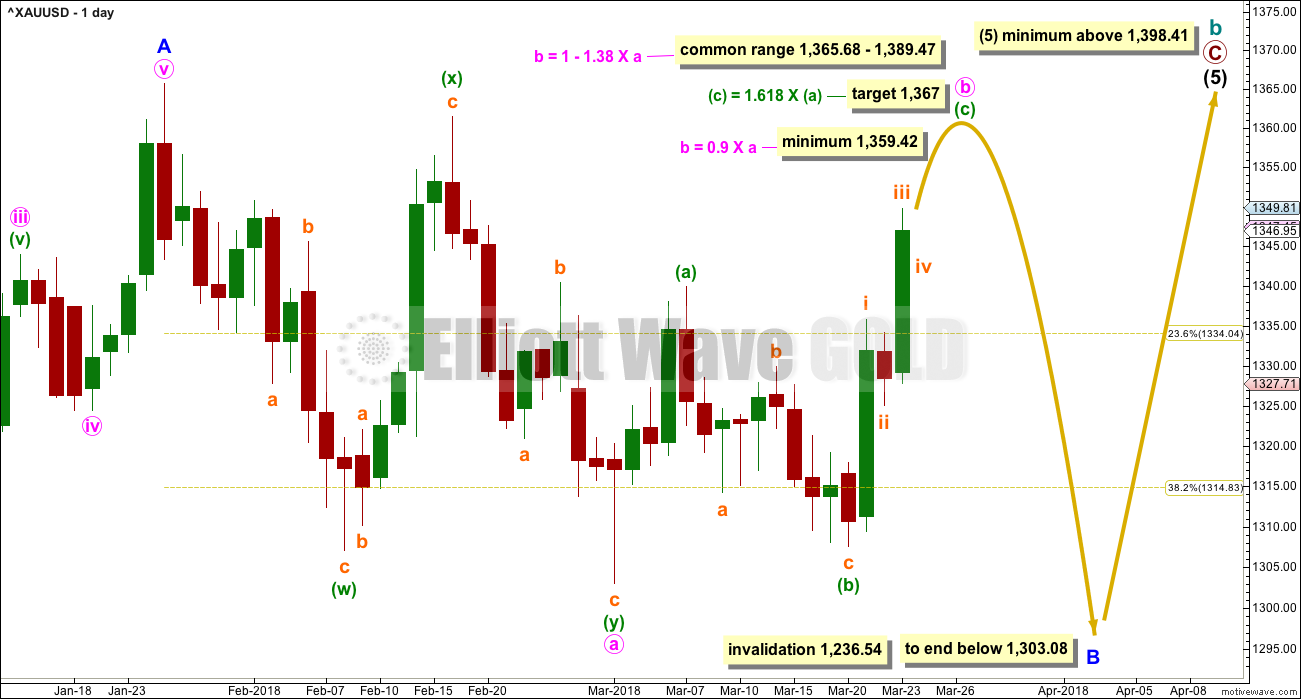
FIRST DAILY CHART – FLAT
Click chart to enlarge.
Minor wave B may be an incomplete flat correction, and within the flat minute wave a must subdivide as a three, which may have been a double zigzag.
Minute wave b must also subdivide as a three and must retrace a minimum 0.9 length of minute wave a. The target would see minute wave b end within the most common range for B waves within flats, and at an area of strong resistance.
Minuette wave (c) must subdivide as a five wave structure. It may only be either an impulse or an ending diagonal. An impulse is much more likely.
Subminuette wave ii is showing up on the daily chart. When it is complete, minuette wave (c) should look like a five wave structure, and within it both of subminuette waves ii and iv should show up on the daily chart to give the wave count the right look.
Subminuette wave iv may complete another small range red daily candlestick on Monday.
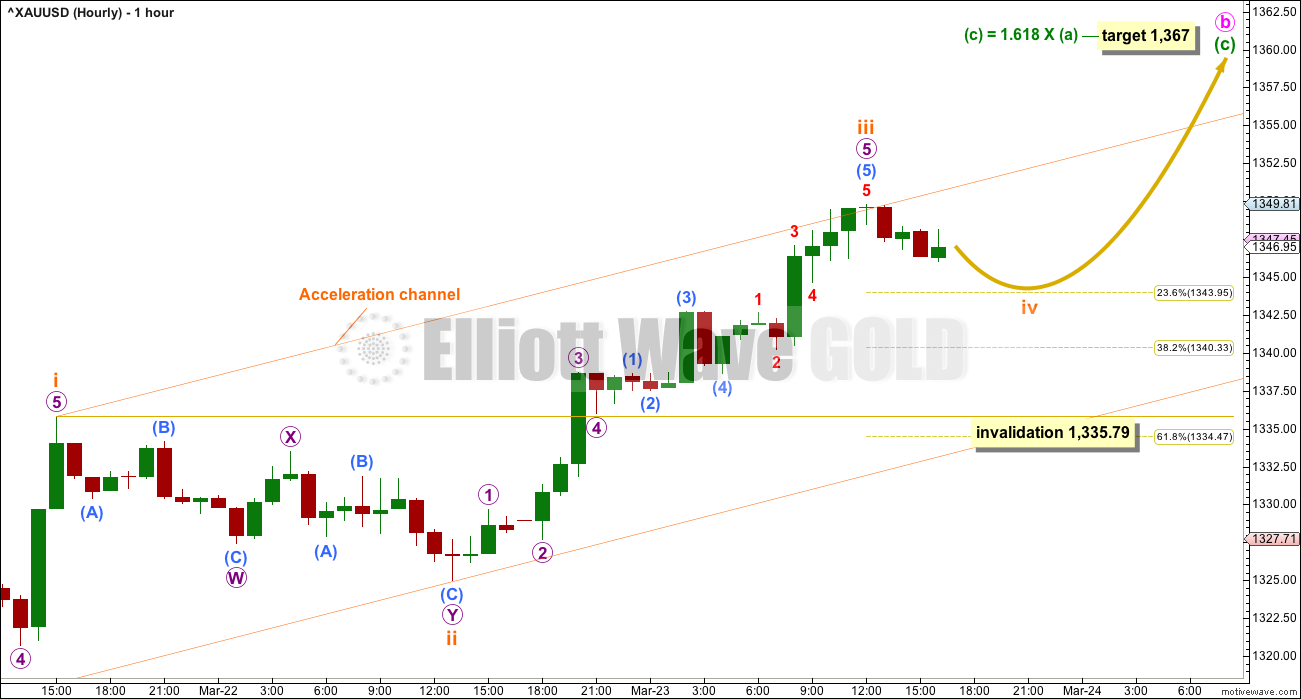
HOURLY CHART
Click chart to enlarge.
Minuette wave (c) so far looks like it is unfolding as an impulse. So far subminuette waves i, ii and now iii may be complete. If subminuette wave iii is over at Friday’s high, then it would be slightly shorter than subminuette wave i. This limits subminuette wave v to no longer than equality with subminuette wave iii, so that subminuette wave iii is not the shortest actionary wave and the core Elliott wave rule is met.
Subminuette wave ii was a shallow double zigzag. Subminuette wave iv may be a flat, combination or triangle to exhibit alternation in structure with subminuette wave ii. To exhibit alternation in depth it may be more shallow, ending about the 0.236 Fibonacci ratio. Because subminuette wave iv may not move into subminuette wave i price territory, below 1,335.79, it may not be as deep as the 0.618 Fibonacci ratio at 1,334.
Subminuette wave iv should last about a day or so for the wave count to have the right look at the daily chart level.
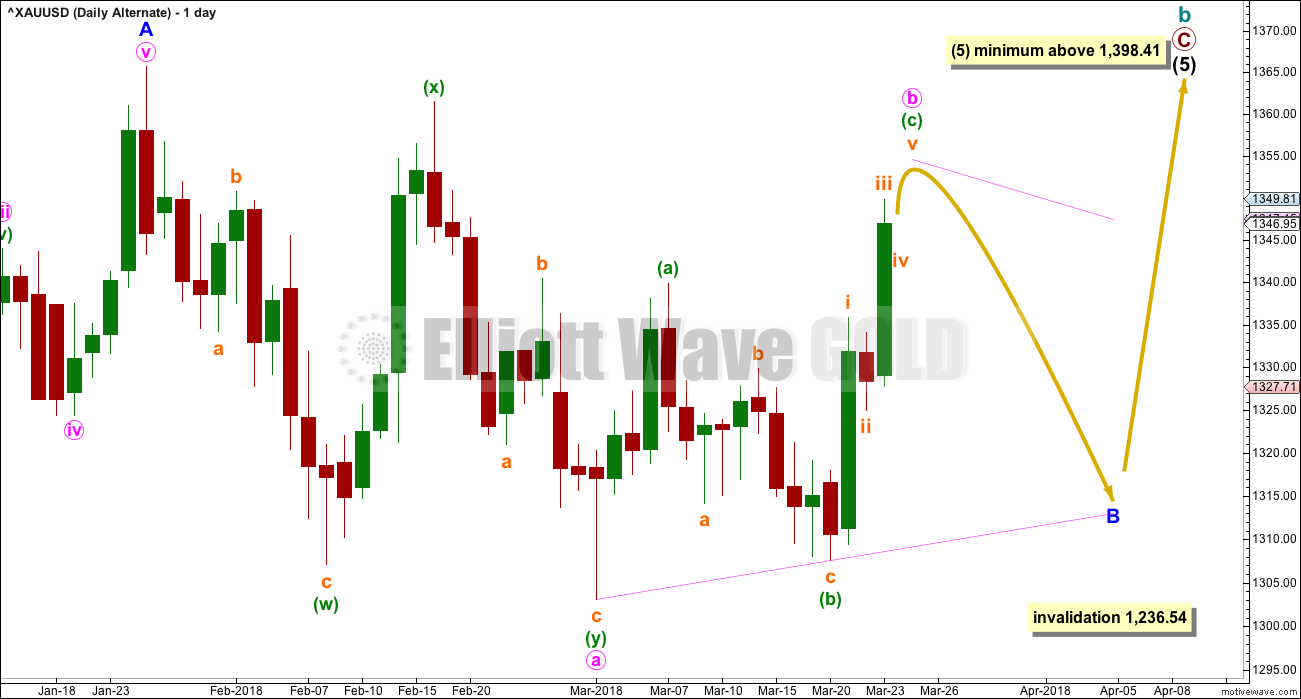
SECOND DAILY CHART – TRIANGLE
Click chart to enlarge.
This alternate daily chart is identical to the first daily chart up to the high labelled minor wave A. Thereafter, it looks at a different structure for minor wave B.
Minor wave B may be an incomplete triangle, and within it minute wave a may have been a double zigzag. All remaining triangle sub-waves must be simple A-B-C structures, and three of the four remaining sub-waves must be simple zigzags. One remaining sub-wave may be a flat correction.
Minute wave b may be unfolding upwards as a single zigzag, and within it minuette wave (b) may not move beyond the start of minuette wave (a) below 1,303.08.
This alternate wave count expects weeks of choppy overlapping movement in an ever decreasing range.
All daily charts expect an impulse is unfolding higher for the short term. The subdivisions and labelling at the hourly chart level would all be mostly the same.
BEARISH ELLIOTT WAVE COUNT
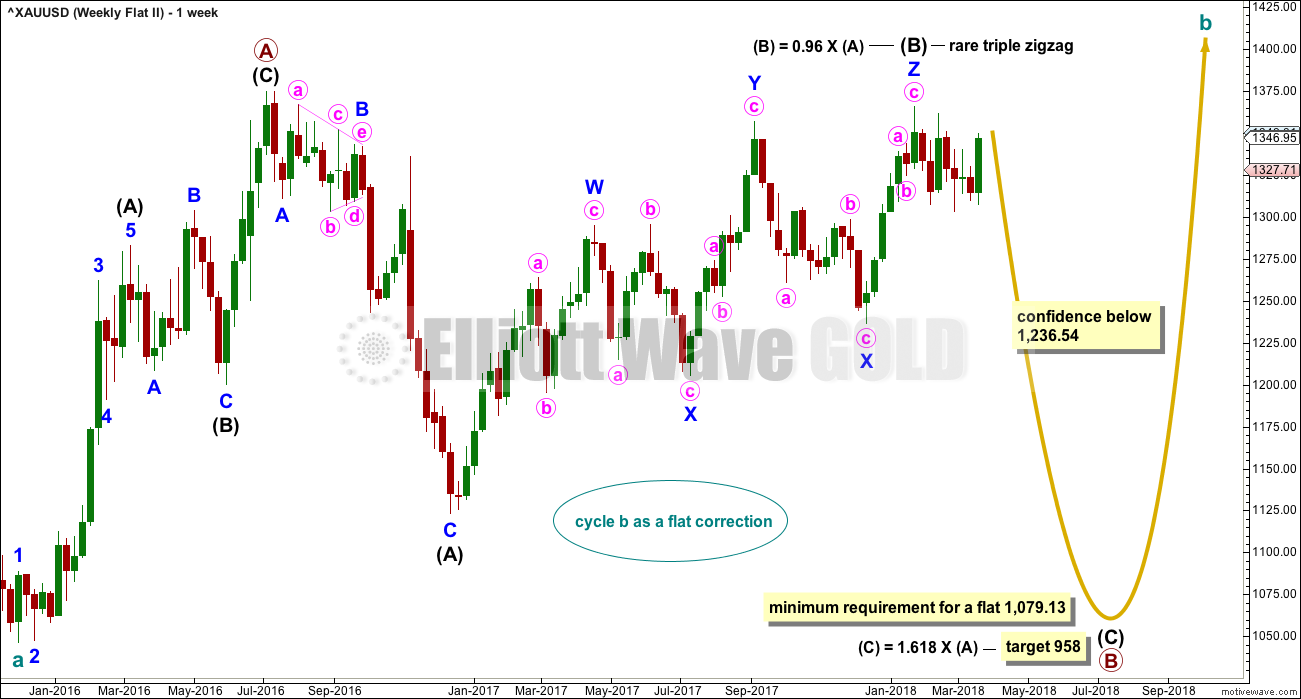
FIFTH WEEKLY CHART
Click chart to enlarge.
There were five weekly charts published in the last historic analysis. This fifth weekly chart is the most immediately bearish wave count, so this is published as a bearish possibility.
This fifth weekly chart sees cycle wave b as a flat correction, and within it intermediate wave (B) may be a complete triple zigzag. This would indicate a regular flat as intermediate wave (B) is less than 1.05 the length of intermediate wave (A).
If cycle wave b is a flat correction, then within it primary wave B must retrace a minimum 0.9 length of primary wave A at 1,079.13 or below. The most common length of B waves within flats is from 1 to 1.38 times the length of the A wave. The target calculated would see primary wave B end within this range.
I have only seen two triple zigzags before during my 10 years of daily Elliott wave analysis. If this wave count turns out to be correct, this would be the third. The rarity of this structure is identified on the chart.
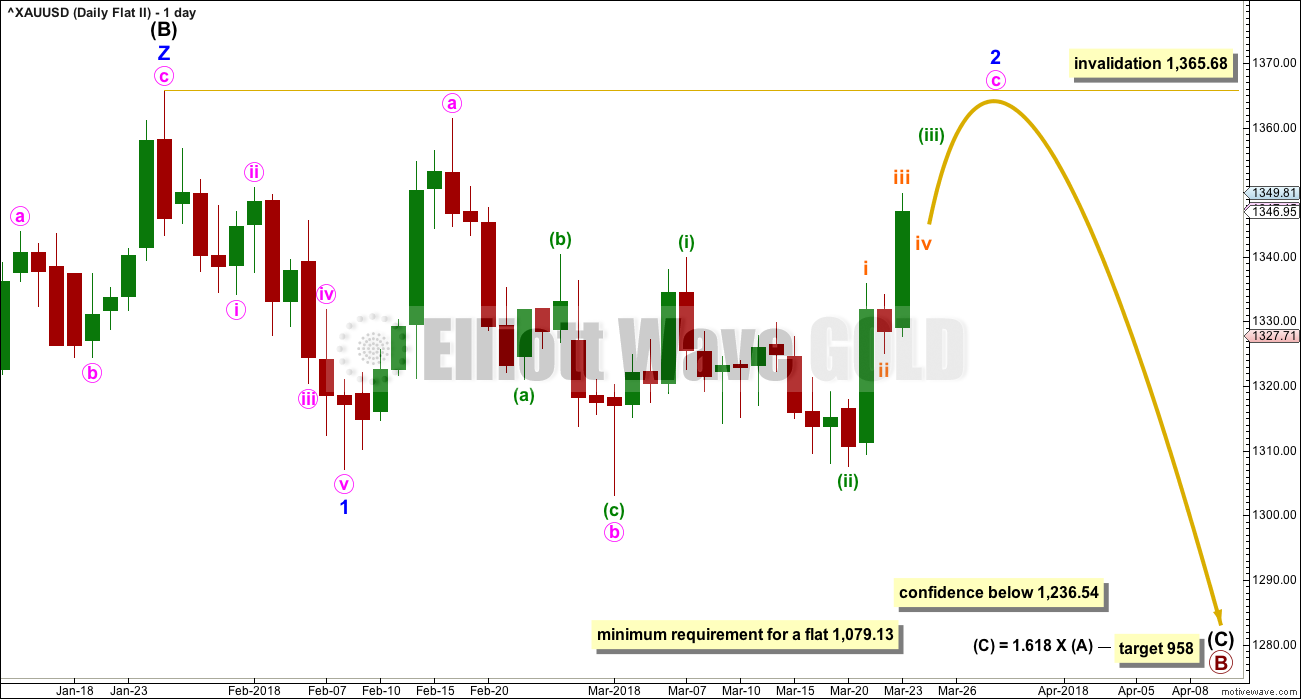
FIFTH DAILY CHART
Click chart to enlarge.
If a new wave down at intermediate degree is beginning, then the first wave of minor wave 1 must subdivide as a five, which may only be an impulse or a leading diagonal.
Minor wave 1 may have been a complete impulse over on the 8th of February. But this downwards wave does not look very good as a five. It can be made to fit at lower time frames, but this movement fits better as a zigzag. The probability of this wave count is reduced.
Minor wave 2 may be an incomplete expanded flat. Minute wave c would be likely to end at least slightly above the end of minute wave a at 1,361.46 to avoid a truncation and a very rare running flat. Minor wave 2 may not move beyond the start of minor wave 1 above 1,365.68.
TECHNICAL ANALYSIS
WEEKLY CHART
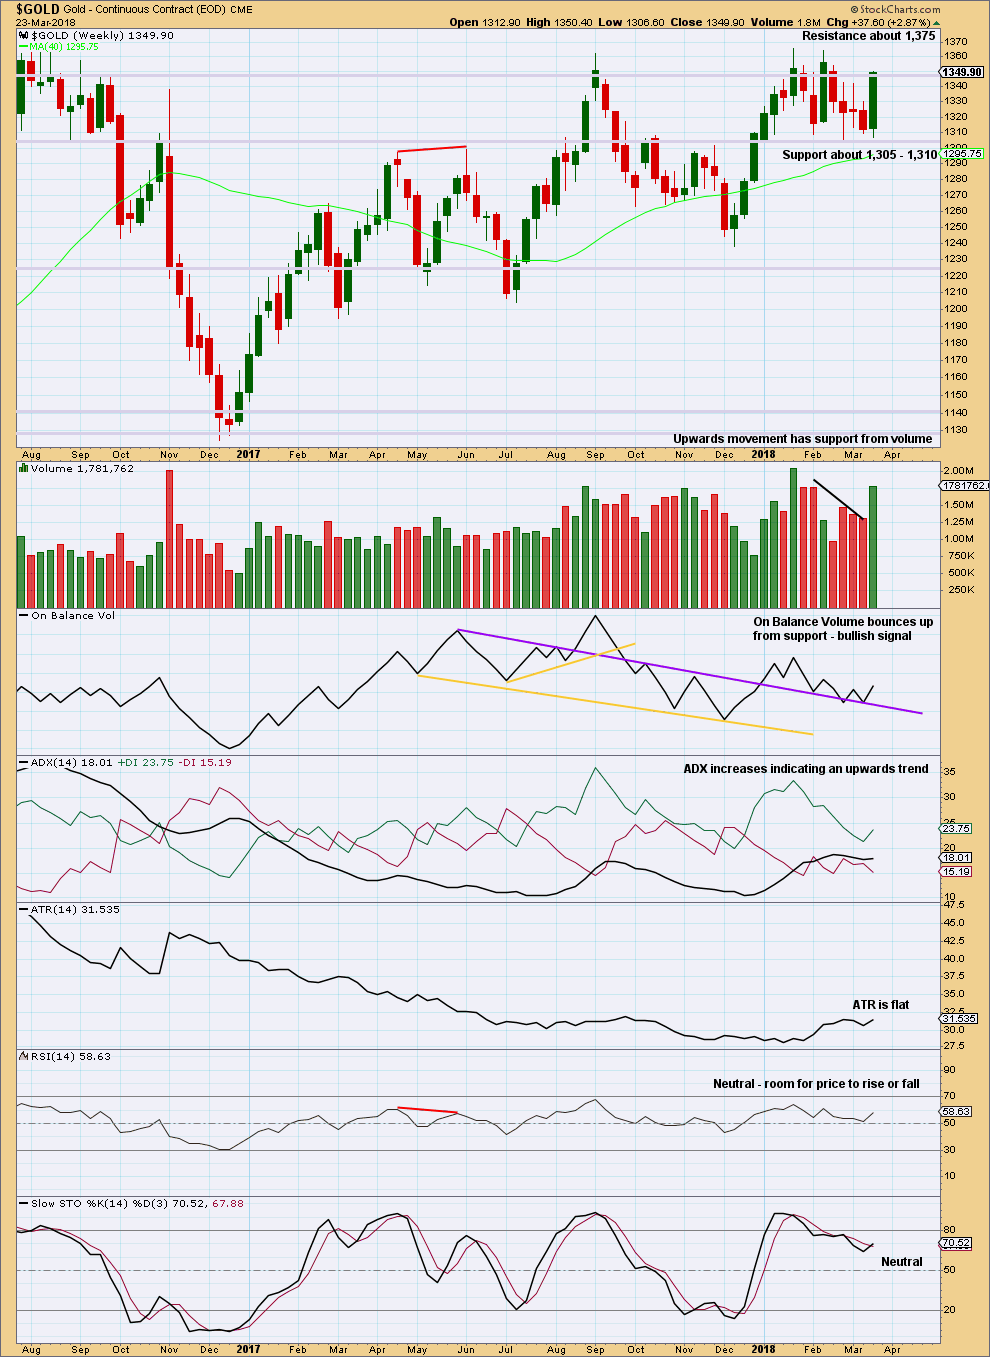
Click chart to enlarge. Chart courtesy of StockCharts.com.
Again, price bounces up off support. This week’s strong weekly candlestick with an almost shaven head is very bullish. Support from volume and a bullish signal from On Balance Volume all support the Elliott wave analysis which expects upwards movement is incomplete.
Look for final resistance about 1,375.
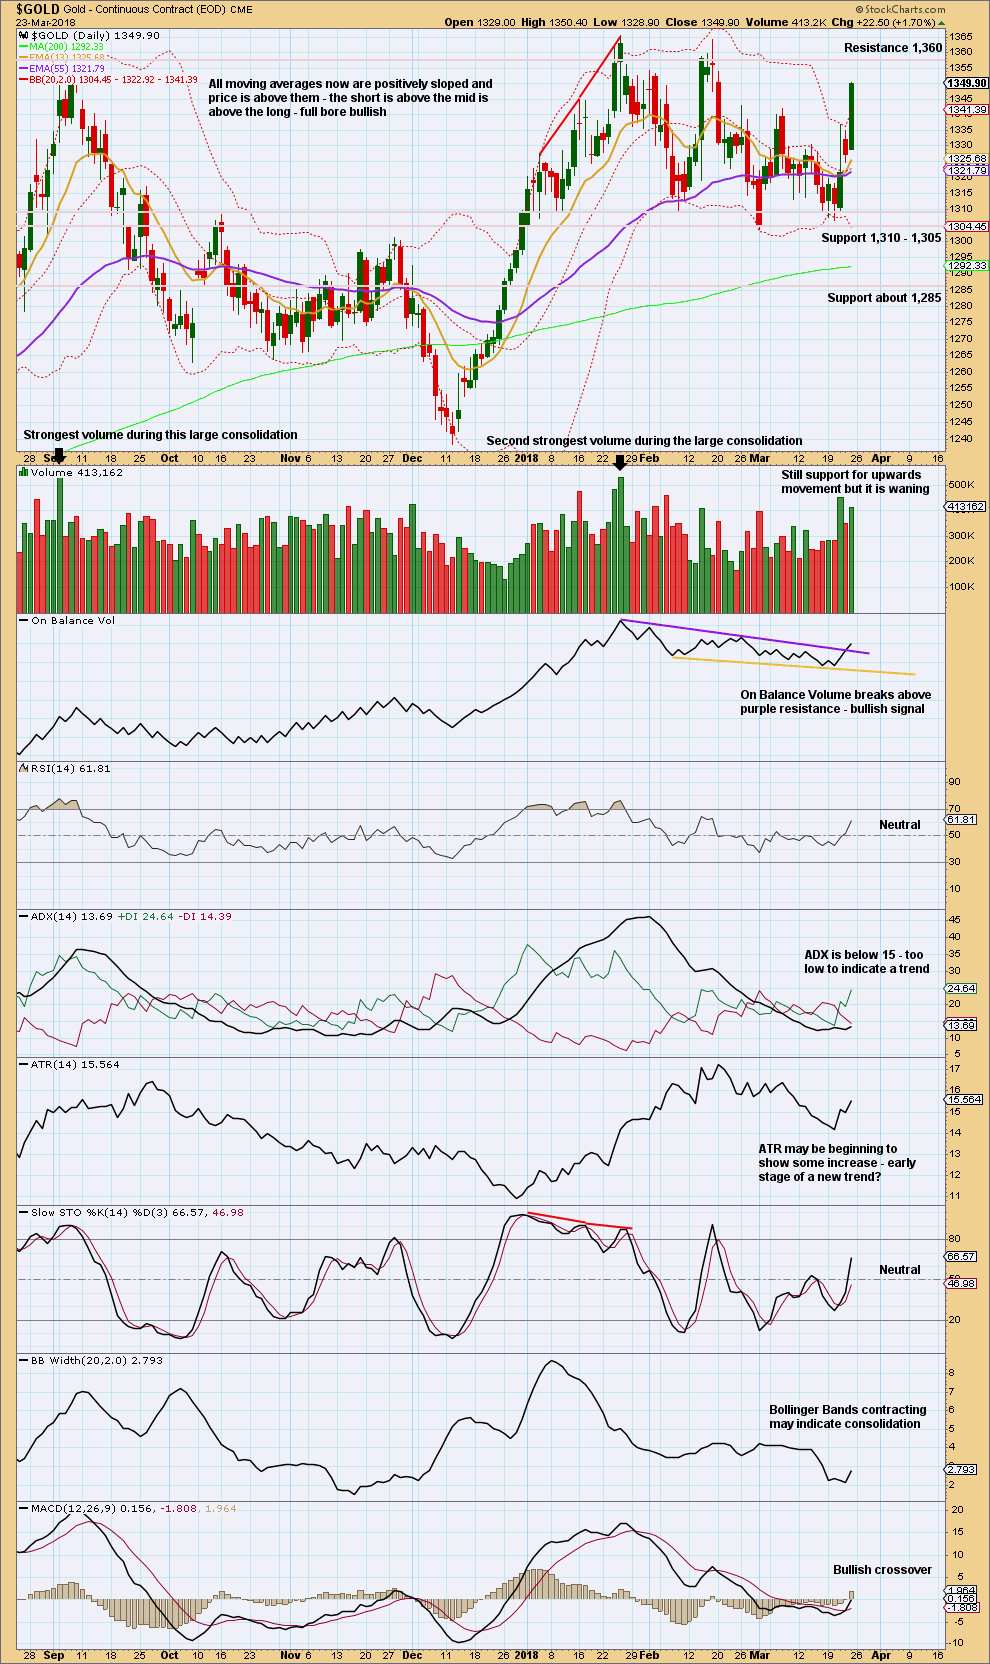
DAILY CHART
Click chart to enlarge. Chart courtesy of StockCharts.com.
Looking at the bigger picture, Gold has been within a large consolidation since about January 2017 (this chart does not show all of this large consolidation), and during this consolidation it is two upwards days that have strongest volume and an upwards week that has strongest volume. Volume suggests an upwards breakout may be more likely than downwards.
Currently, Gold is within a smaller consolidation that began in early January 2018. This consolidation is delineated by support about 1,310 to 1,305 and resistance (final) about 1,375. It is an upwards day during this smaller consolidation that has strongest volume, suggesting an upwards breakout may be more likely here than downwards.
A very strong upwards day with an almost shaven head and support from volume offer good support to the Elliott wave counts which see this as a third wave. A bullish signal from On Balance Volume also offers support to the Elliott wave counts.
Resistance is next at 1,360. Thereafter, further resistance is at 1,365 and then 1,375.
GDX WEEKLY CHART
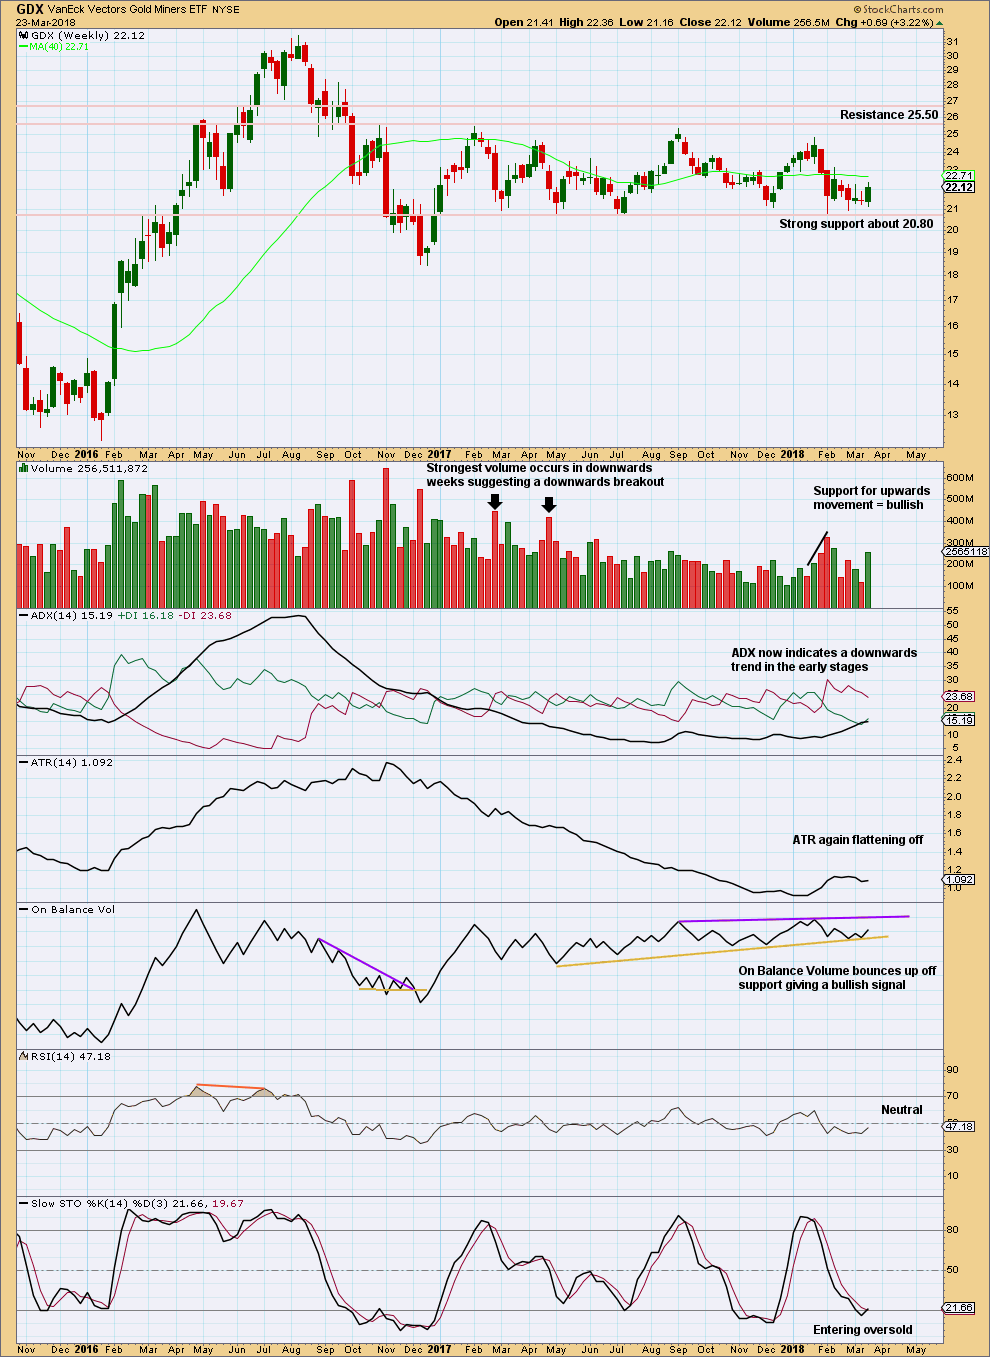
Click chart to enlarge. Chart courtesy of StockCharts.com.
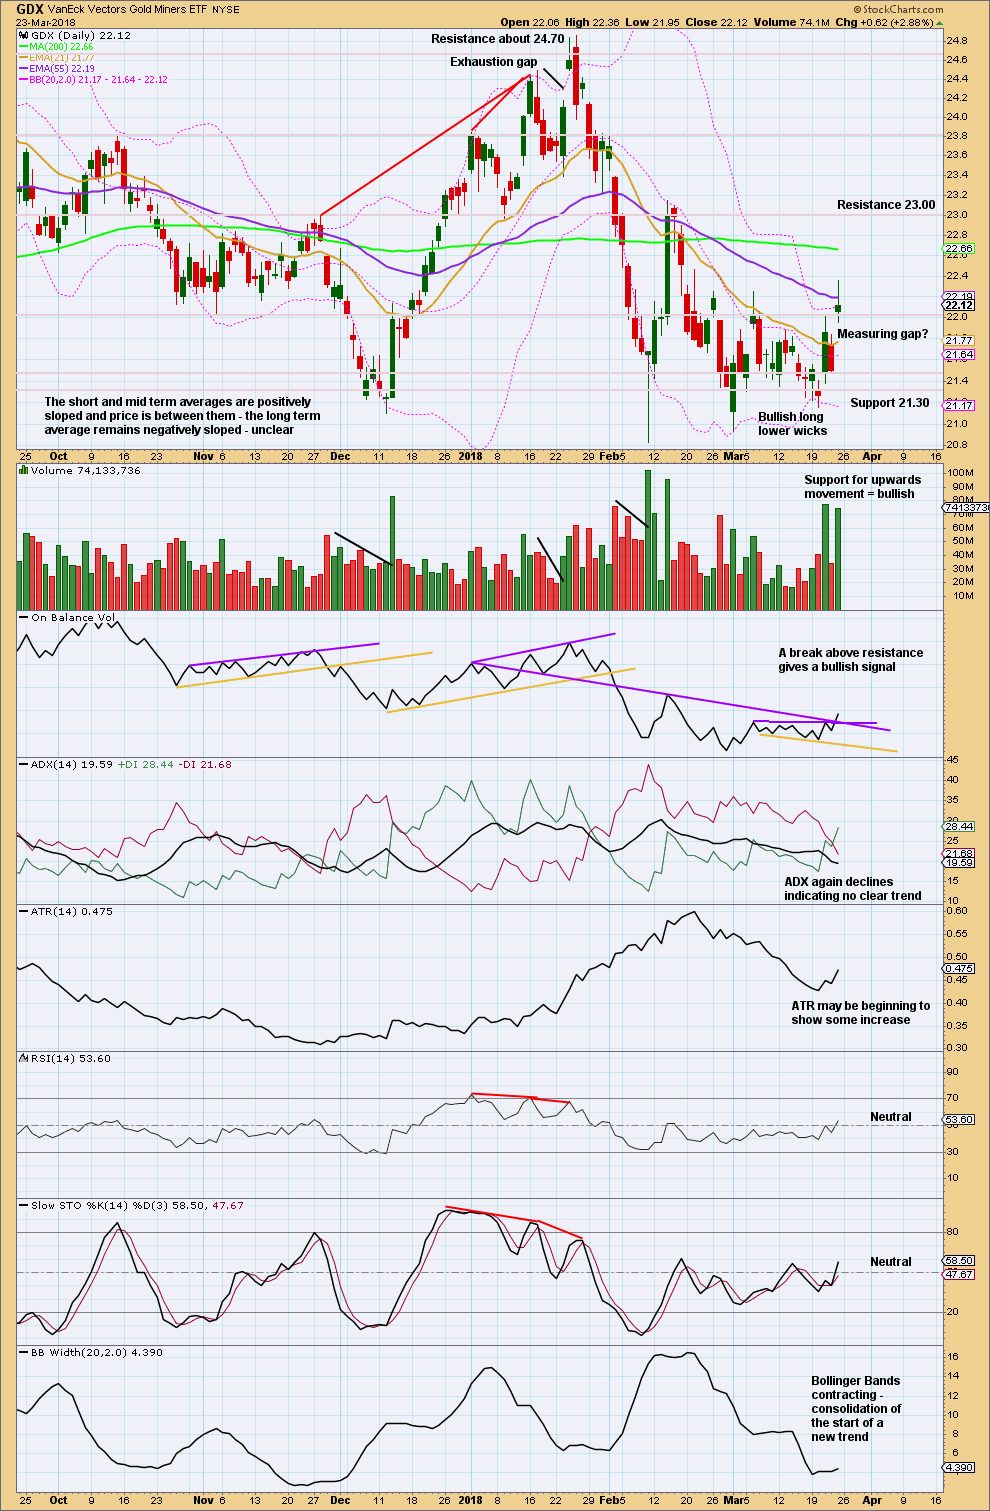
Support about 20.80 has been tested about eight times and so far has held. The more often a support area is tested and holds, the more technical significance it has.
In the first instance, expect this area to continue to provide support. Only a strong downwards day, closing below support and preferably with some increase in volume, would constitute a downwards breakout from the consolidation that GDX has been in for a year now.
Resistance is about 25.50. Only a strong upwards day, closing above resistance and with support from volume, would constitute an upwards breakout.
Bullish volume this week and a bullish signal from On Balance Volume offer support to the view that an upwards swing should continue here to resistance.
GDX DAILY CHART
Click chart to enlarge. Chart courtesy of StockCharts.com.
A bullish signal from On Balance Volume at the daily chart level and a bullish volume profile suggest more upwards movement next week for GDX.
Assume the opening gap for Friday is a measuring gap until proven otherwise. Measuring gaps may be used in trading to place stops. They are not usually closed for some time, so in an upwards trend should provide support. Stops may be placed just below the gap. This measuring gap gives a target at 22.63.
The long upper wick on Friday’s candlestick suggests a short term pullback may begin on Monday. Volume suggests any downwards movement here is a counter trend movement though.
US OIL
A bounce was expected to continue, with the target at 65.05. So far price has reached up to 65.99.
Summary: Price must turn here for the main Elliott wave count. A new high above 66.65 would substantially reduce the probability of the bearish wave count and increase the probability of a huge new bull market for Oil, which would have final confidence above 74.96.
Classic technical analysis this week strongly favours a bullish outlook. Members are advised to either hedge or be long here; shorts should be closed above 66.65.
If price turns lower here, then the target for a new low remains at 13.39. A new low on the way down, below 55.24, would add substantial confidence in a bearish outlook.
Always practice good risk management as the most important aspect of trading. Always trade with stops and invest only 1-5% of equity on any one trade. Failure to manage risk is the most common mistake new traders make.
MAIN WAVE COUNT
MONTHLY CHART
Click chart to enlarge.
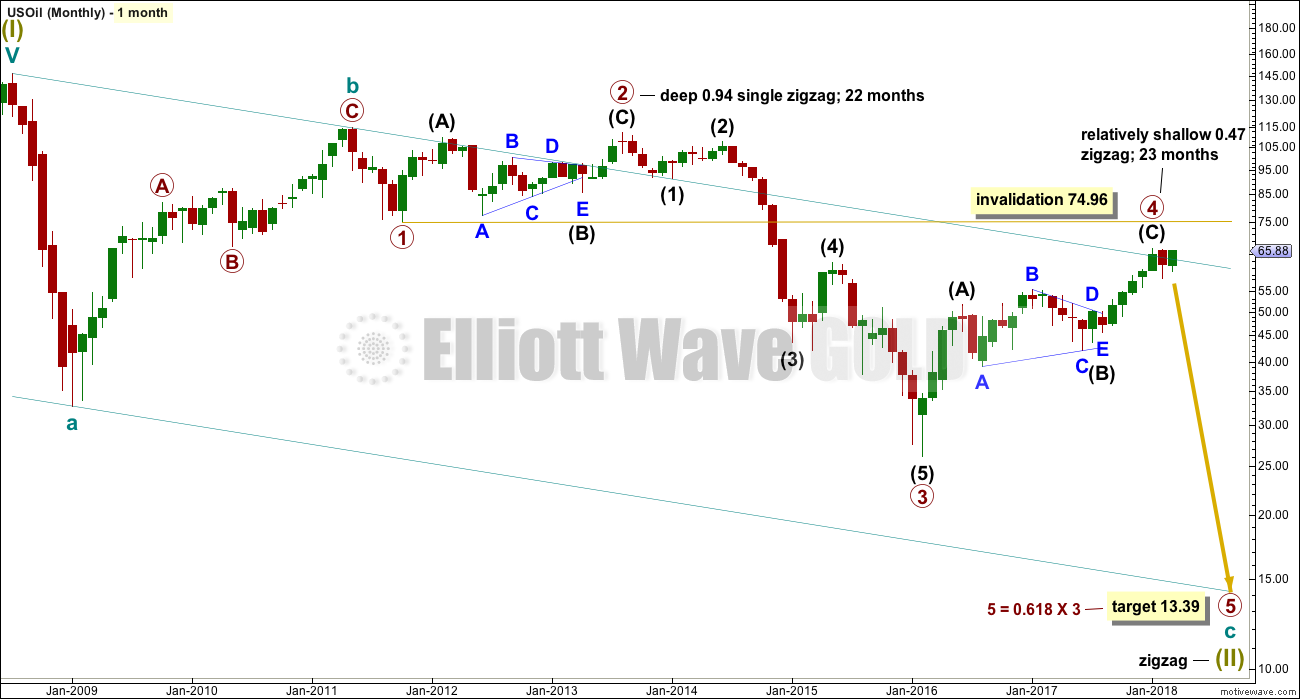
Within the bear market, cycle wave b is seen as ending in May 2011. Thereafter, a five wave structure downwards for cycle wave c begins.
Primary wave 1 is a short impulse lasting five months. Primary wave 2 is a very deep 0.94 zigzag lasting 22 months. Primary wave 3 is a complete impulse with no Fibonacci ratio to primary wave 1. It lasted 30 months.
There is alternation in depth with primary wave 2 very deep and primary wave 4 relatively shallow. There is inadequate alternation in structure, both are zigzags. So far primary wave 4 has lasted 23 months. At this stage, there is almost perfect proportion between primary waves 2 and 4.
Primary wave 4 may not move into primary wave 1 price territory above 74.96.
The wider Elliott channel (teal) about this whole movement may offer support to primary wave 5.
WEEKLY CHART
Click chart to enlarge.
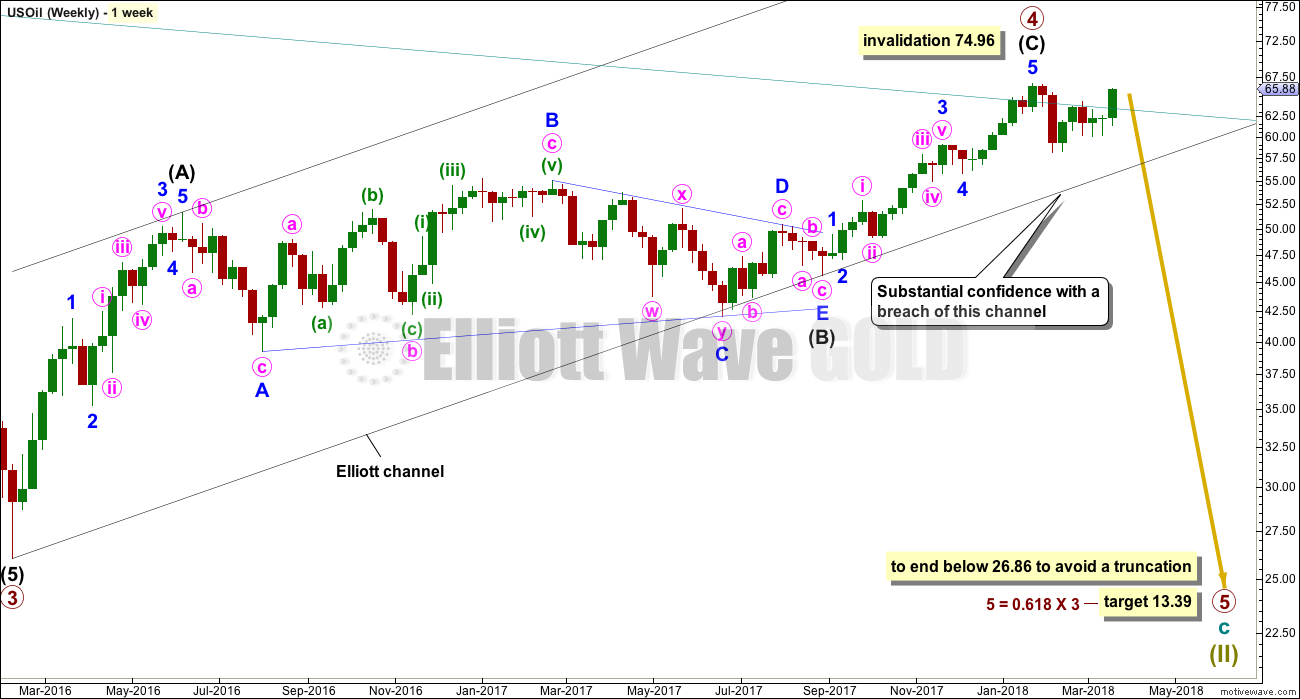
Primary wave 4 subdivides as a zigzag, and within it intermediate wave (C) may now be complete. If primary wave 5 were to only reach equality in length with primary wave 3, it would end with a small truncation. A target for primary wave 5 may best be calculated at intermediate degree. That can only be done when intermediate waves (1) through to (4) within primary wave 5 are complete.
For now a target will be calculated at primary degree using a ratio between primary waves 3 and 5. This target only has a small probability. This target will be recalculated as primary wave 5 nears its end, so it may change.
An Elliott channel is added to this possible zigzag for primary wave 4. A breach of the lower edge of this channel would provide a very strong indication that primary wave 4 should be over and primary wave 5 should be underway. Look out for some support on the way down, perhaps a short term bounce about the lower edge of the channel.
DAILY CHART
Click chart to enlarge.
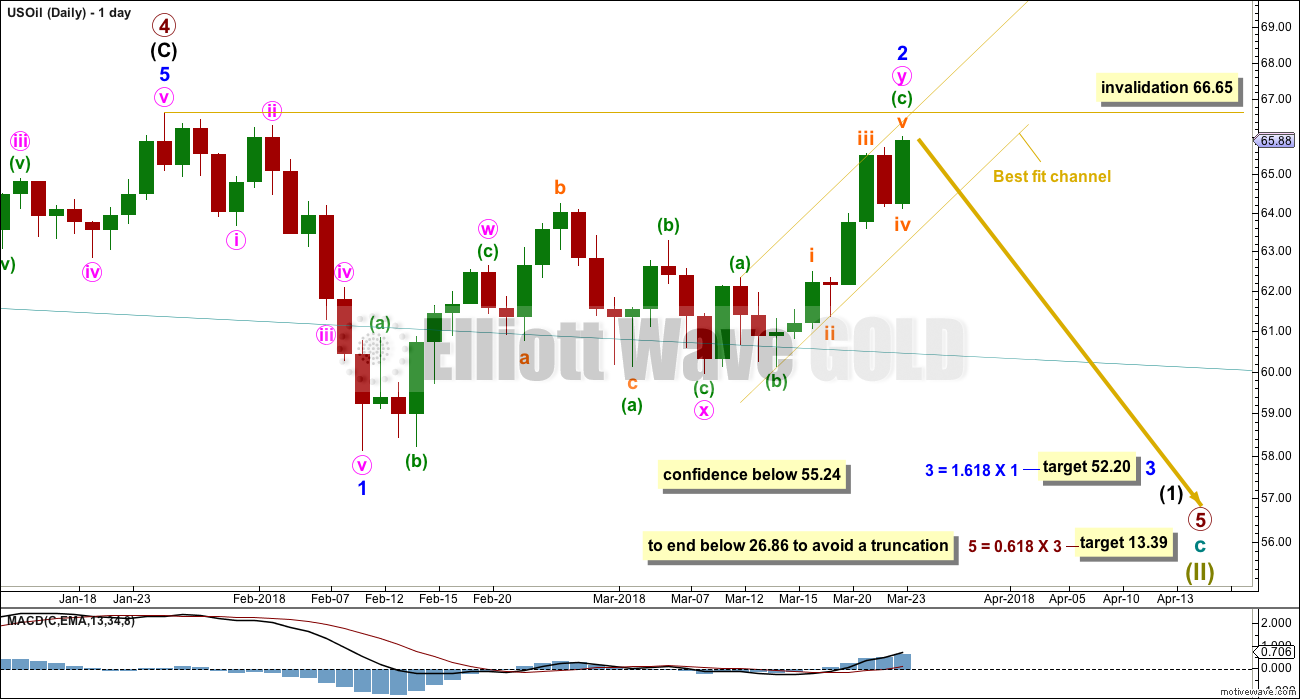
Minor wave 1 will subdivide as a complete impulse at lower time frames.
Minor wave 2 this week is slightly relabelled. It looks like a double zigzag, and this labelling has a better fit. The first structure in the double zigzag is labelled minute wave w. The double is joined by a three in the opposite direction, an expanded flat labelled minute wave x. The second zigzag in the double has deepened the correction achieving its purpose, and it is labelled a zigzag for minute wave y.
There is now almost no room left for this wave count to move into. Minor wave 2 must end here and minor wave 3 downwards must begin early next week if this wave count is correct.
A target is calculated for minor wave 3 which expects the most common Fibonacci ratio to minor wave 1. If price reaches down to this target and the structure is incomplete or price keeps falling through it, then the next Fibonacci ratio in the sequence of 2.618 would be used to calculate a new target.
Minor wave 2 may not move beyond the start of minor wave 1 above 66.65.
A new low below 55.24 would invalidate the bullish alternate below and provide reasonable confidence in this main wave count.
The bottom line for this wave count is that now we should assume an upwards trend is intact while price remains within the best fit channel, and so this wave count may be wrong. A clear breach of the lower edge of the channel by downwards movement is required for confidence in this main wave count this week.
This week’s classic analysis supports the alternate wave count and does not support this main wave count.
ALTERNATE WAVE COUNT
MONTHLY CHART
Click chart to enlarge.
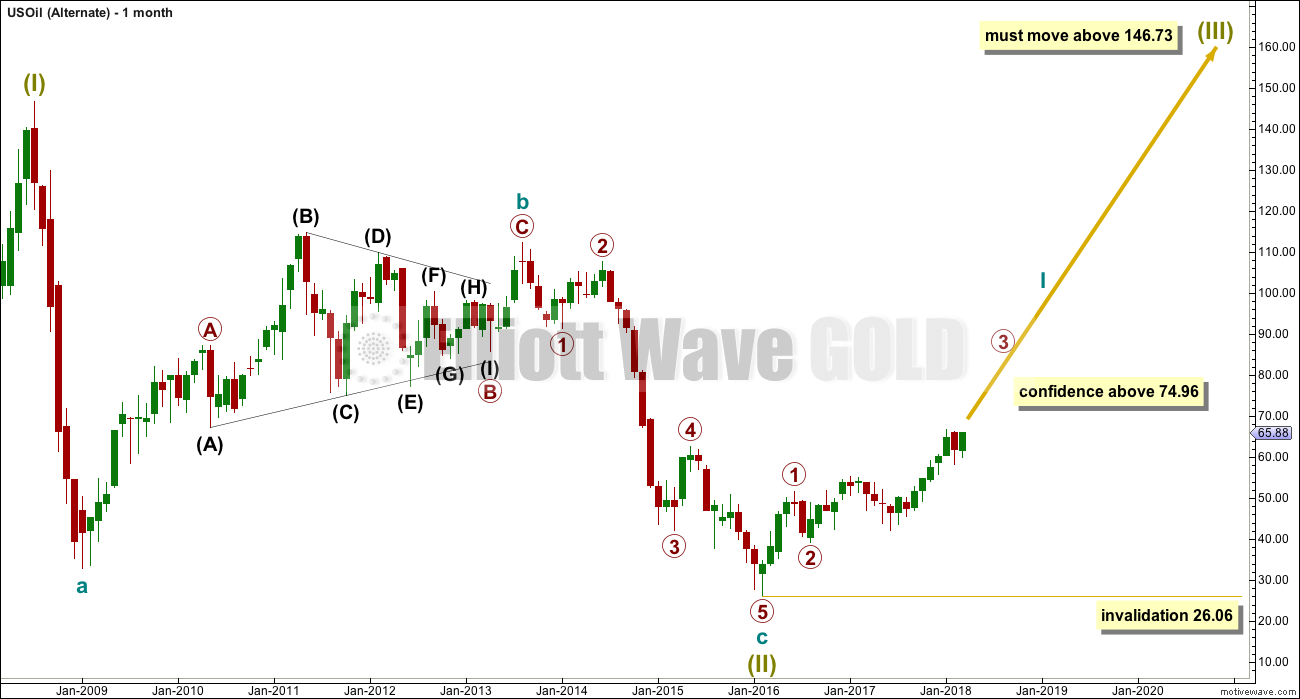
It is possible that the bear market for Oil is over and a new bull market is in the very early stages.
A huge zigzag down to the last low may be complete and is labelled here Super Cycle wave (II).
Cycle wave b must be seen as complete in August 2013 for this wave count to work. It cannot be seen as complete at the prior major swing high in May 2011.
Cycle wave b is seen as a zigzag, and within it primary wave B is seen as a running contracting triangle. These are fairly common structures, although nine wave triangles are uncommon. All subdivisions fit.
Primary wave C moves beyond the end of primary wave A, so it avoids a truncation. But it does not have to move above the price territory of primary wave B to avoid a truncation, which is an important distinction.
If cycle wave b begins there, then cycle wave c may be seen as a complete five wave impulse.
Super Cycle wave (III) must move beyond the end of Super Cycle wave (I). It must move far enough above that point to allow room for a subsequent Super Cycle wave (IV) to unfold and remain above Super Cycle wave (I) price territory.
WEEKLY CHART
Click chart to enlarge.
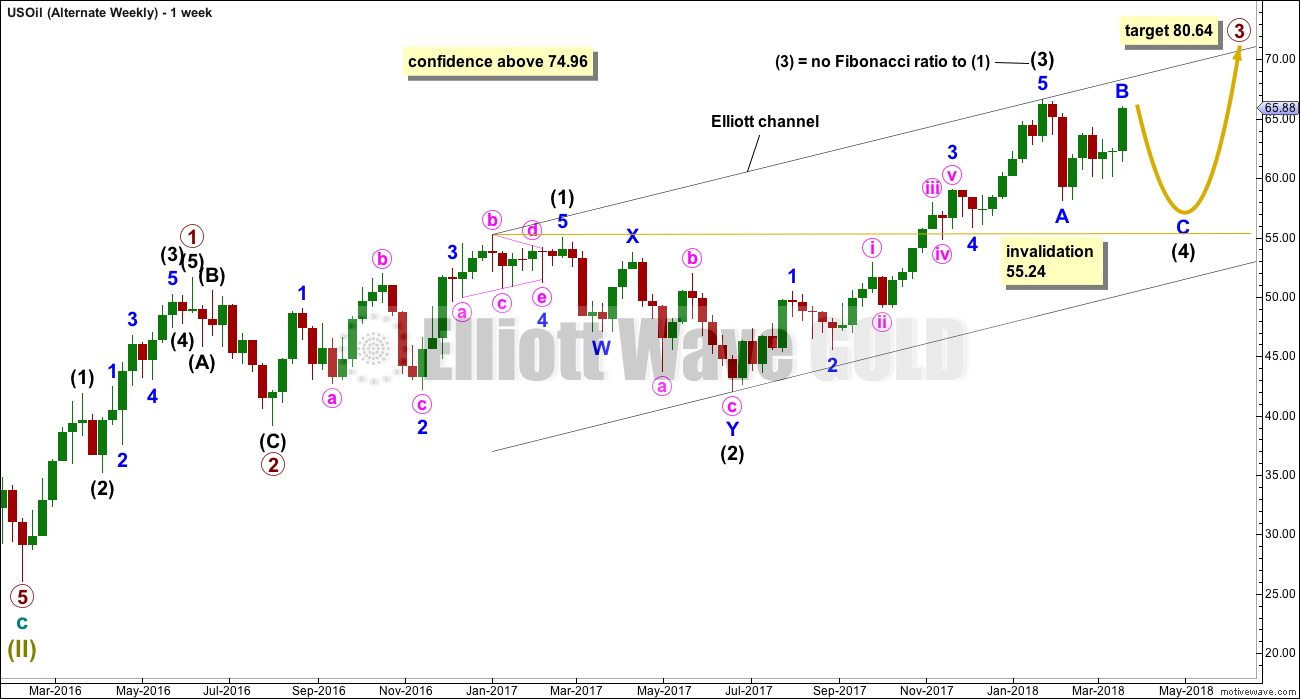
If a new bull market is in the very early stages for Oil, then it may have begun with two overlapping first and second waves at primary then at intermediate degree.
Primary wave 3 may only subdivide as an impulse, and within it intermediate wave (3) may be complete.
Intermediate wave (4) may not move into intermediate wave (1) price territory below 55.24. Intermediate wave (4) would most likely be incomplete. It may continue further sideways or lower.
Intermediate wave (2) is labelled as a double zigzag. To exhibit alternation intermediate wave (4) may most likely be a flat, combination or triangle. Intermediate wave (2) lasted 17 weeks. For good proportion and the right look, intermediate wave (4) may last a Fibonacci 13 or even 21 weeks in total. So far it has lasted only eight weeks.
DAILY CHART
Click chart to enlarge.
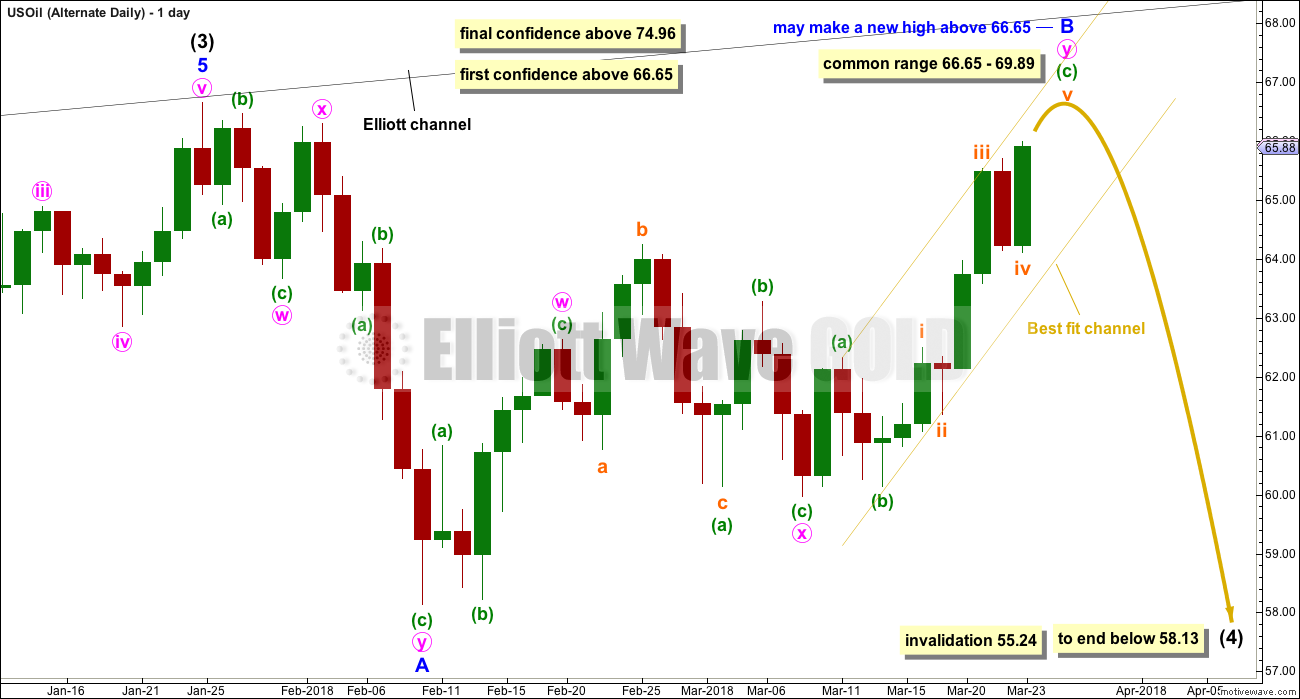
With classic technical analysis this week very bullish, it is time to publish a daily chart for this alternate idea.
It would be unlikely that intermediate wave (4) would be over a the last low labelled minor wave A. That would be too brief.
If intermediate wave (4) is continuing, then it may be as a flat correction. Minor wave B has reached the minimum requirement of 0.9 the length of minor wave A. It may continue higher and may make a new high above the start of minor wave A at 66.65 as in an expanded flat, which is the most common type.
When minor wave B is complete, then minor wave C downwards would be expected to make at least a slight new low below the end of minor wave A at 58.13 to avoid a truncation.
TECHNICAL ANALYSIS
MONTHLY CHART
Click chart to enlarge. Chart courtesy of StockCharts.com.
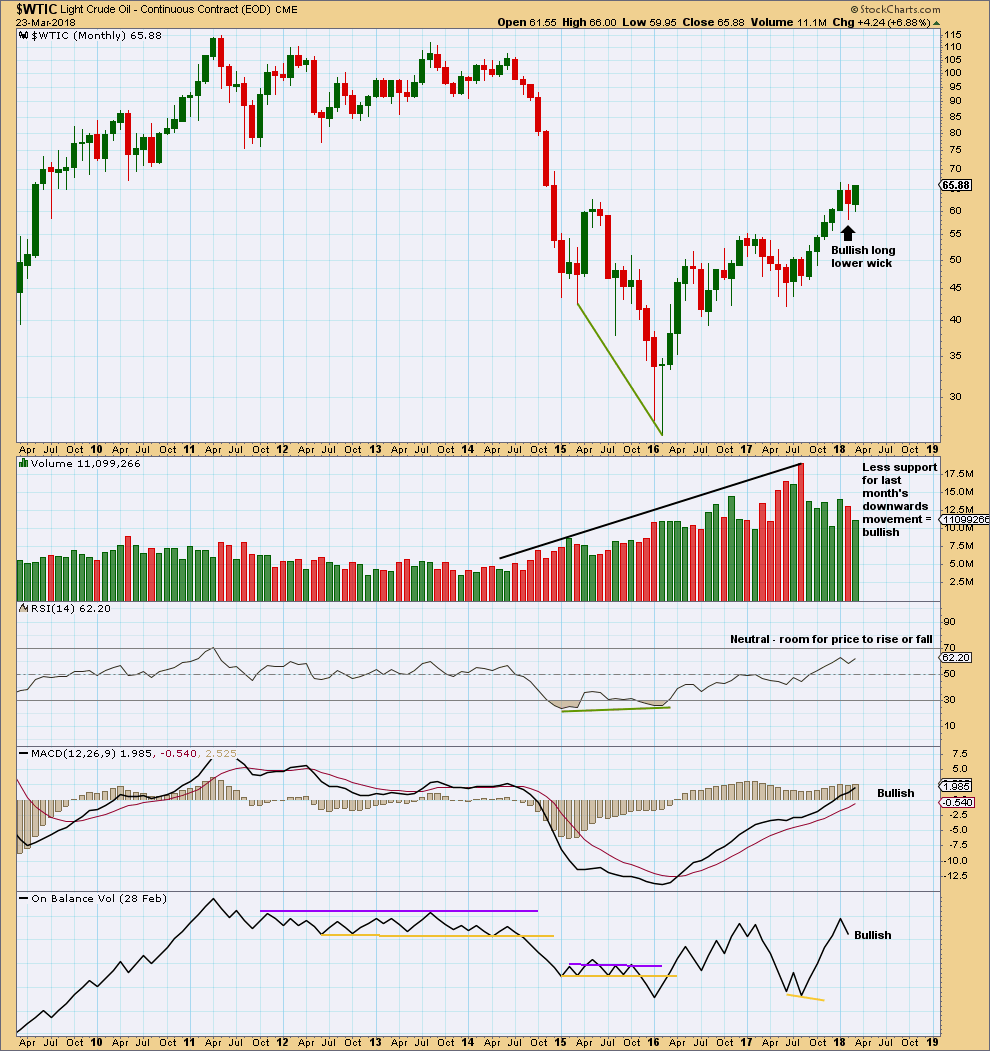
The strongest recent monthly volume is for the downwards month of August 2017. This is bearish.
The rise in price had support from volume for the month of January. Downwards movement did not have support from rising volume for the now completed month of February. This is bullish. MACD and On Balance Volume are also both bullish. Overall, this chart is more bullish than bearish.
RSI indicates there is room for upwards movement to continue.
The month of March is still incomplete, so at this time no conclusions may be drawn.
DAILY CHART
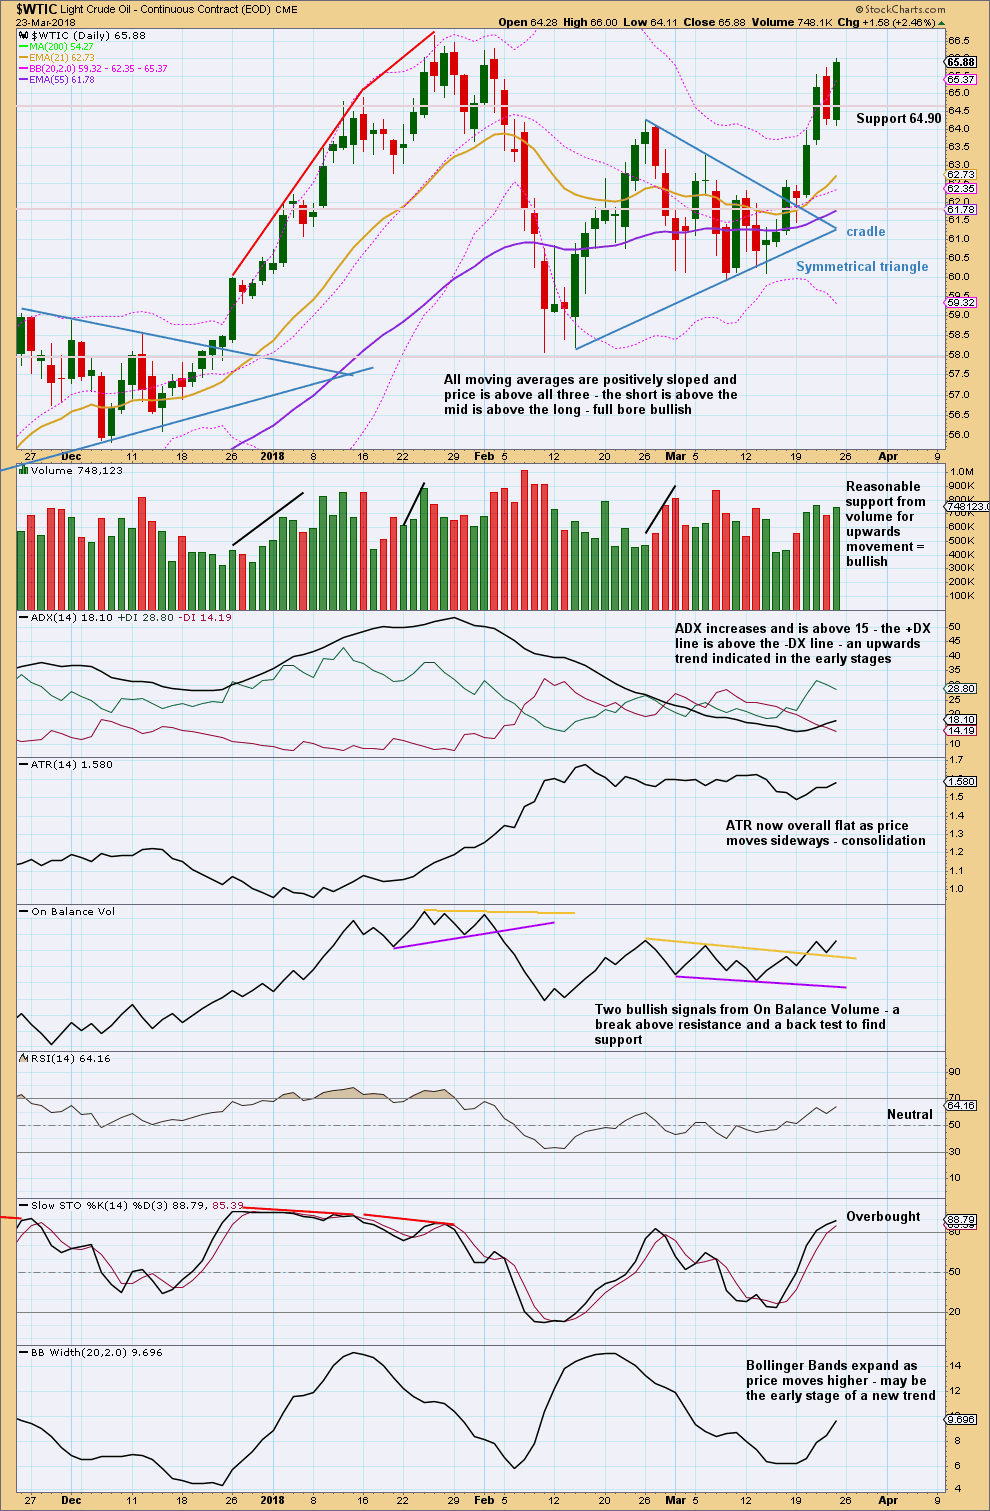
Click chart to enlarge. Chart courtesy of StockCharts.com.
The last two upwards days have reasonable support now from volume, which is bullish. Friday was slightly weaker than Wednesday though.
ADX, On Balance Volume, the short term volume profile, and Bollinger Bands are all bullish. This chart indicates an upwards trend that has a reasonable distance to run yet.
When Oil has a strong upwards trend, Stochastics may remain extremely overbought for a reasonable period of time. Only when it is overbought and then exhibits bearish divergence with price may a sizeable pullback / consolidation or end to the trend be expected. That is not the case here.
This chart strongly supports the alternate wave count.
VOLATILITY INDEX
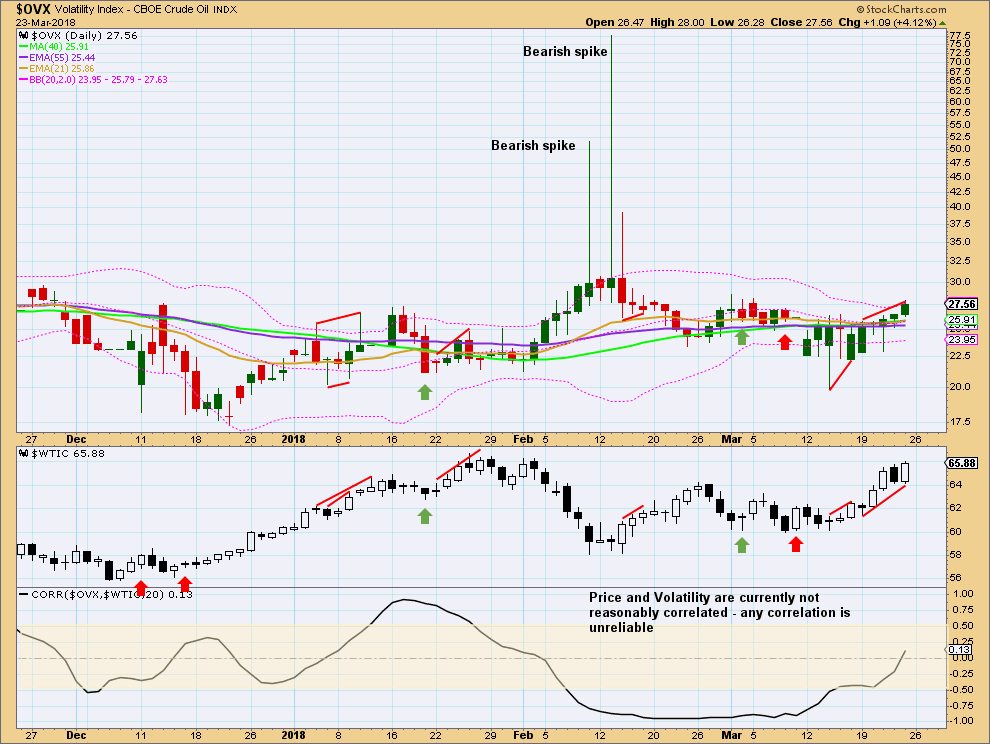
Click chart to enlarge. Chart courtesy of StockCharts.com.
It is generally expected that OVX and Oil price should have a negative correlation. However, the correlation co-efficient proves absolutely that this expectation is not supported by the math. Their correlation is mathematically unreliable. Currently, it is very weakly positive.
This may be discounted as an unreliable relationship, and the math supports this view. Normally, it would be read as bearish divergence, but that interpretation assumes a more reliable correlation than the math shows.
Any two sets of data that have a correlation co-efficient that spends time within the highlighted zone of +0.5 to -0.5 are two sets of data that do not have a reliable correlation. Any correlation that may appear from time to time may be simply due to chance and not because the two sets of data have a relationship in any way.
Why does the Oil Monthly show less than the Weekly?
It doesn’t. Look at the dates on the bottom of the charts. The Oil monthly starts in 2008. The weekly charts start in 2016.
Watch the video, when I switch from one chart to the other I show you equivalent points in an attempt to orientate viewers within the charts.
Lara, these 3 links now link to the “members only content message” for EWSM
Last historic analysis with monthly charts is here. Video is here.
An alternate idea at the monthly chart level is given here at the end of this analysis.
An historic example of a cycle degree fifth wave is given at the end of the analysis here.
Thanks,
Lara, this link now works. Thank you
The biggest picture, Grand Super Cycle analysis, is here.
Lara,
These links don’t work. Is that intentional because it’s public?
The biggest picture, Grand Super Cycle analysis, is here.
Last historic analysis with monthly charts is here. Video is here.
An alternate idea at the monthly chart level is given here at the end of this analysis.
An historic example of a cycle degree fifth wave is given at the end of the analysis here.
Thank you Dreamer for pointing that out.
No, it’s not because it’s public. They should work.
Cesar’s fixing it now.