

S&P 500
Upwards movement was expected again for Friday. The session began with a gap higher, but thereafter moved lower to close red. Price remains above the invalidation point.
Summary: A new low below 2,639.25 would indicate more downwards movement, and the target would be between 2,586.27 and 2,553.80. A bearish signal from On Balance Volume, failure for price to close above resistance, declining ATR for the last three sessions, and a lack of support from volume for rising price all support this view.
A new high above 2,680.26 would indicate more upwards movement, and the target would be at 2,705 or a range from 2,752 to 2,766. Some bullish divergence with VIX offers just a little support to this view. There are now clusters of bullish signals on VIX and the AD line.
Always practice good risk management. Always trade with stops and invest only 1-5% of equity on any one trade.
The biggest picture, Grand Super Cycle analysis, is here.
Last historic analysis with monthly charts is here. Video is here.
An alternate idea at the monthly chart level is given here.
An historic example of a cycle degree fifth wave is given at the end of the analysis here.
MAIN ELLIOTT WAVE COUNT
WEEKLY CHART
Click chart to enlarge.
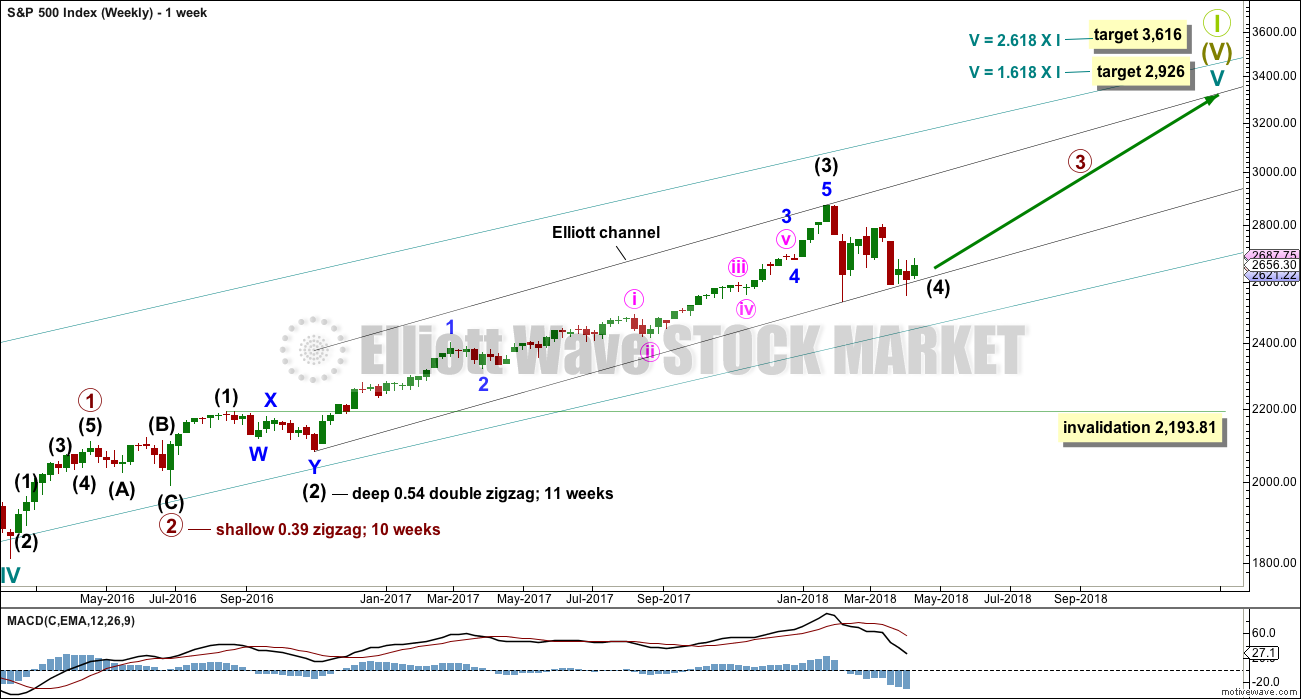
Cycle wave V must complete as a five structure, which should look clear at the weekly chart level. It may only be an impulse or ending diagonal. At this stage, it is clear it is an impulse.
Within cycle wave V, the third waves at all degrees may only subdivide as impulses.
Intermediate wave (4) has breached an Elliott channel drawn using Elliott’s first technique. The channel is redrawn using Elliott’s second technique as if intermediate wave (4) was over at the first swing low within it. If intermediate wave (4) continues sideways, then the channel may be redrawn when it is over. The upper edge may provide resistance for intermediate wave (5).
Intermediate wave (4) may not move into intermediate wave (1) price territory below 2,193.81. However, it would be extremely likely to remain within the wider teal channel (copied over from the monthly chart) if it were to be reasonably deep. This channel contains the entire bull market since the low in March 2009, with only two small overshoots at the end of cycle wave IV. If this channel is breached, then the idea of cycle wave V continuing higher would be discarded well before the invalidation point is breached.
At this stage, it now looks like intermediate wave (4) may be continuing further sideways as a combination, triangle or flat. These three ideas are separated into separate daily charts. All three ideas would see intermediate wave (4) exhibit alternation in structure with the double zigzag of intermediate wave (2).
A double zigzag would also be possible for intermediate wave (4), but because intermediate wave (2) was a double zigzag this is the least likely structure for intermediate wave (4) to be. Alternation should be expected until price proves otherwise.
DAILY CHART – TRIANGLE
Click chart to enlarge.
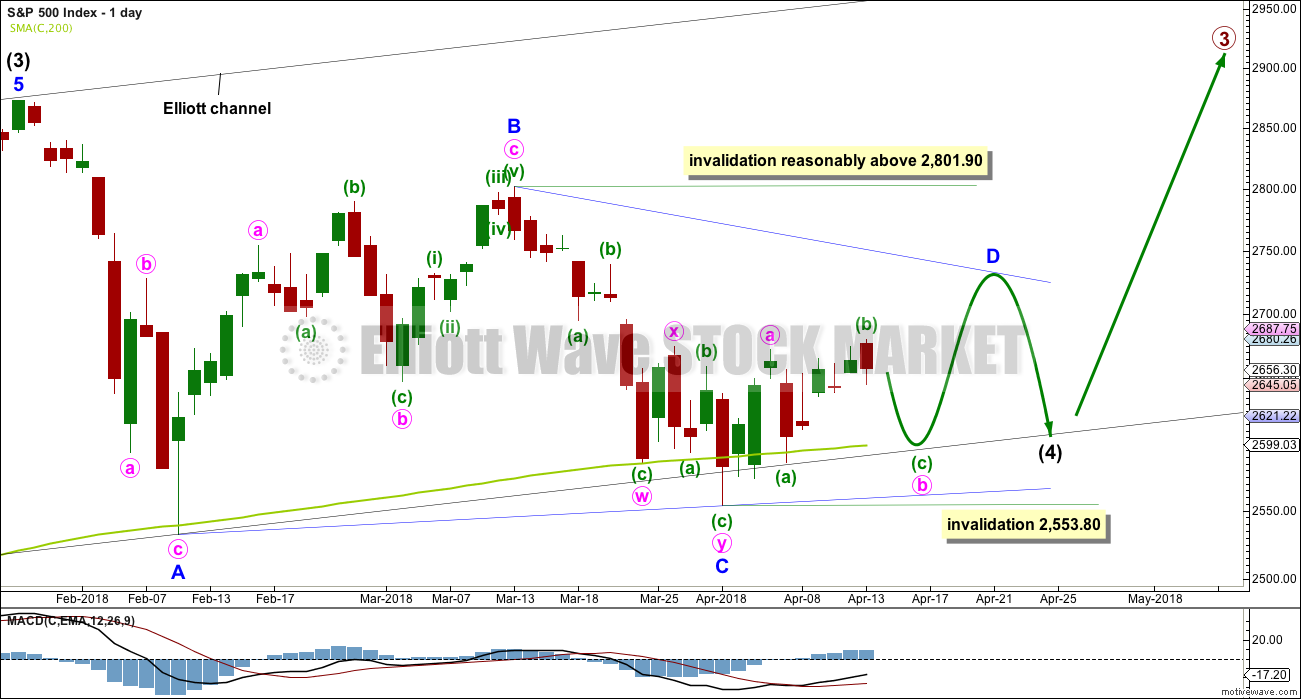
This first daily chart looks at a triangle structure for intermediate wave (4). The triangle may be either a regular contracting or regular barrier triangle. Within the triangle, minor waves A, B and C may be complete.
If intermediate wave (4) is a regular contracting triangle, the most common type, then minor wave D may not move beyond the end of minor wave B above 2,801.90.
If intermediate wave (4) is a regular barrier triangle, then minor wave D may end about the same level as minor wave B at 2,801.90. As long as the B-D trend line remains essentially flat a triangle will remain valid. In practice, this means the minor wave D can end slightly above 2,801.90 as this rule is subjective.
When a zigzag upwards for minor wave D is complete, then this wave count would expect a final smaller zigzag downwards for minor wave E, which would most likely fall reasonably short of the A-C trend line.
If this all takes a further two weeks to complete, then intermediate wave (4) may total a Fibonacci 13 weeks and would be just two weeks longer in duration than intermediate wave (2). There would be very good proportion between intermediate waves (2) and (4), which would give the wave count the right look. However, two more weeks at this time does not look like it may be long enough for a triangle to complete. It may not exhibit a Fibonacci duration.
There are now a few overshoots of the 200 day moving average. This is entirely acceptable for this wave count; the overshoots do not mean price must now continue lower. The A-C trend line for this wave count should have a slope, so minor wave C should now be over.
Within the zigzag of minor wave D, minute wave b may not move beyond the start of minute wave a below 2,553.80.
The arrow is adjusted today on this chart.
DAILY CHART – COMBINATION
Click chart to enlarge.
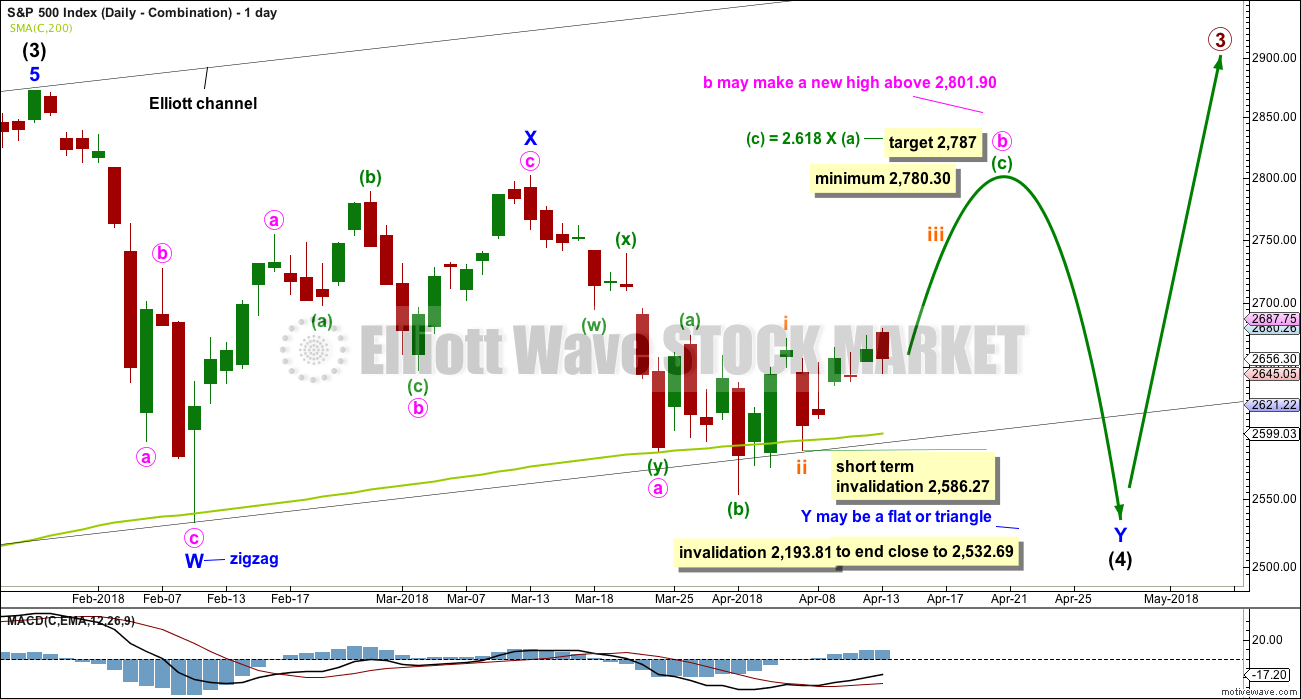
Double combinations are very common structures. The first structure in a possible double combination for intermediate wave (4) would be a complete zigzag labelled minor wave W. The double should be joined by a three in the opposite direction labelled minor wave X, which may be a complete zigzag. X waves within combinations are typically very deep; if minor wave X is over at the last high, then it would be a 0.79 length of minor wave W, which is fairly deep giving it a normal look. There is no minimum nor maximum requirement for X waves within combinations.
The second structure in the double would most likely be a flat correction labelled minor wave Y. It may also be a triangle, but in my experience this is very rare, so it will not be expected. The much more common flat for minor wave Y will be charted and expected.
A flat correction would subdivide 3-3-5. Minute wave a must be a three wave structure, most likely a zigzag. It may also be a double zigzag.
Minute wave b must now reach a minimum 0.90 length of minute wave a. Minute wave b must be a corrective structure. It may be any corrective structure. It may be unfolding as an expanded flat correction. A target is calculated for it to end. Within minuette wave (c), subminuette waves i and ii may now be complete. Within subminuette wave iii, no second wave correction may move beyond its start below 2,586.27.
The purpose of combinations is to take up time and move price sideways. To achieve this purpose the second structure in the double usually ends close to the same level as the first. Minor wave Y would be expected to end about the same level as minor wave W at 2,532.69. This would require a strong overshoot or breach of the 200 day moving average, which looks unlikely.
DAILY CHART – FLAT
Click chart to enlarge.
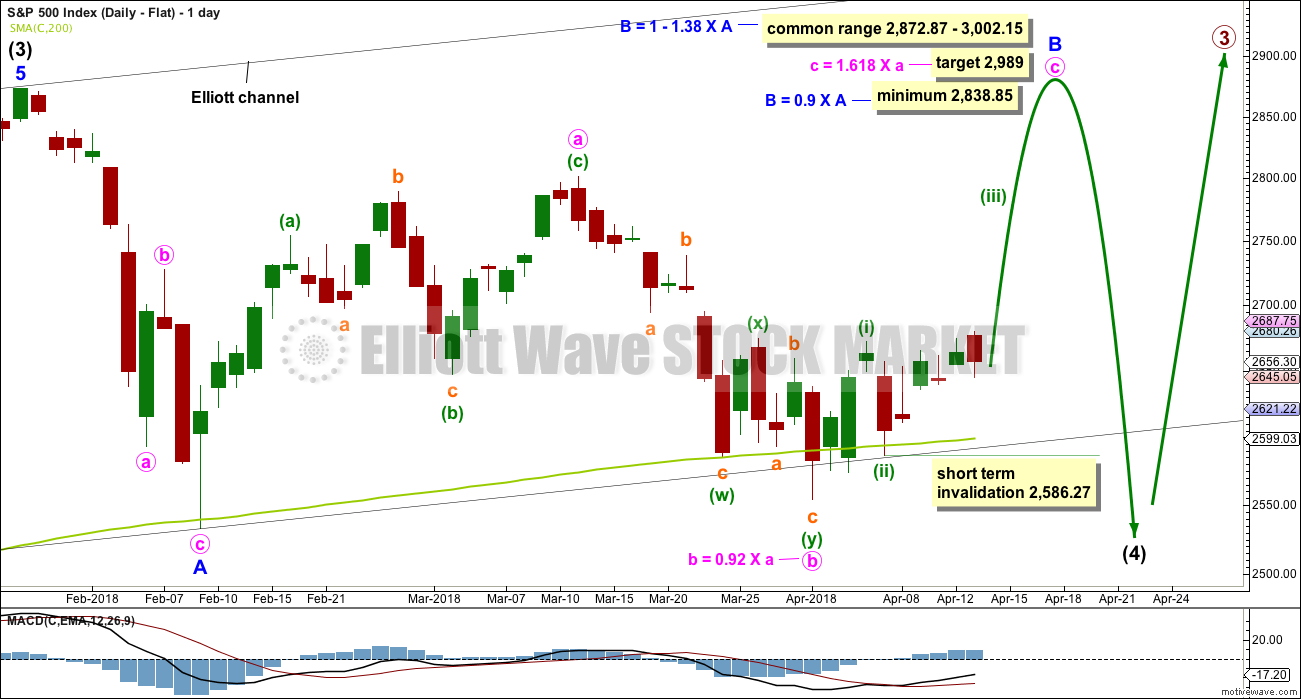
Flat corrections are very common. The most common type of flat is an expanded flat. This would see minor wave B move above the start of minor wave A at 2,872.87.
Within a flat correction, minor wave B must retrace a minimum 0.9 length of minor wave A at 2,838.85. The most common length for minor wave B within a flat correction would be 1 to 1.38 times the length of minor wave A at 2,872.87 to 3,002.15. An expanded flat would see minor wave B 1.05 times the length of minor wave A or longer, at 2,889.89 or above. A target is today calculated for minor wave B to end, which would see it end within the common range.
Minor wave B may be a regular flat correction, and within it minute wave a may have been a single zigzag and minute wave b may have been a double zigzag. This has a very good fit.
This wave count would require a very substantial breach of the 200 day moving average for the end of intermediate wave (4). This is possible but may be less likely than a smaller breach.
TECHNICAL ANALYSIS
WEEKLY CHART
Click chart to enlarge. Chart courtesy of StockCharts.com.
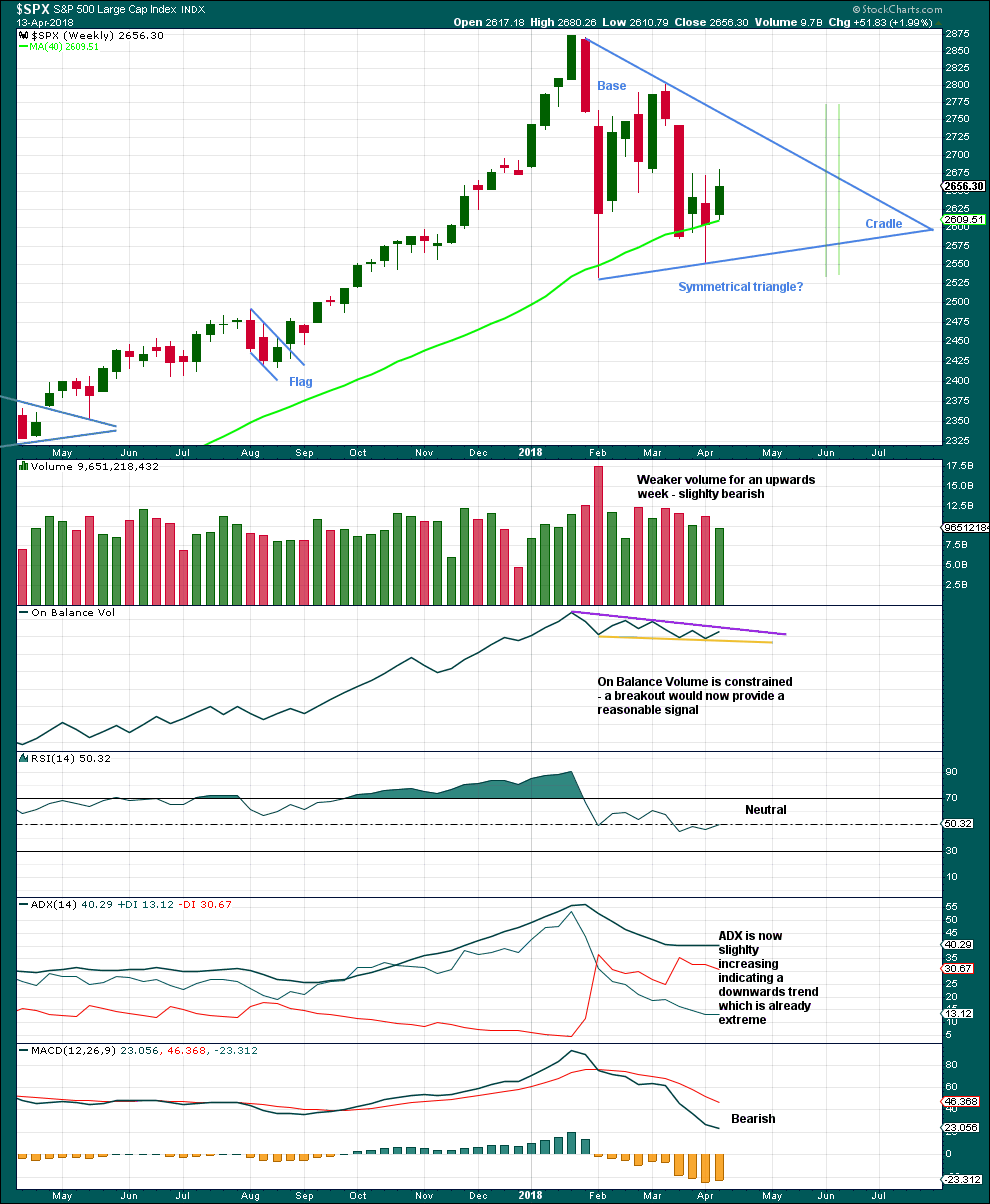
A classic symmetrical triangle pattern may be forming. These are different to Elliott wave triangles. Symmetrical triangles may be either continuation or reversal patterns, while Elliott wave triangles are always continuation patterns and have stricter rules.
The vertical green lines are 73% to 75% of the length of the triangle from cradle to base, where a breakout most commonly occurs.
From Dhalquist and Kirkpatrick on trading triangles:
“The ideal situation for trading triangles is a definite breakout, a high trading range within the triangle, an upward-sloping volume trend during the formation of the triangle, and especially a gap on the breakout.”
For this example, the breakout has not yet happened. There is a high trading range within the triangle, but volume is declining.
The triangle may yet have another 8 – 9 weeks if it breaks out at the green lines.
Before that happens though On Balance Volume may give a signal. It must give a signal in the next one to very few weeks as the trend lines are converging.
DAILY CHART
Click chart to enlarge. Chart courtesy of StockCharts.com.
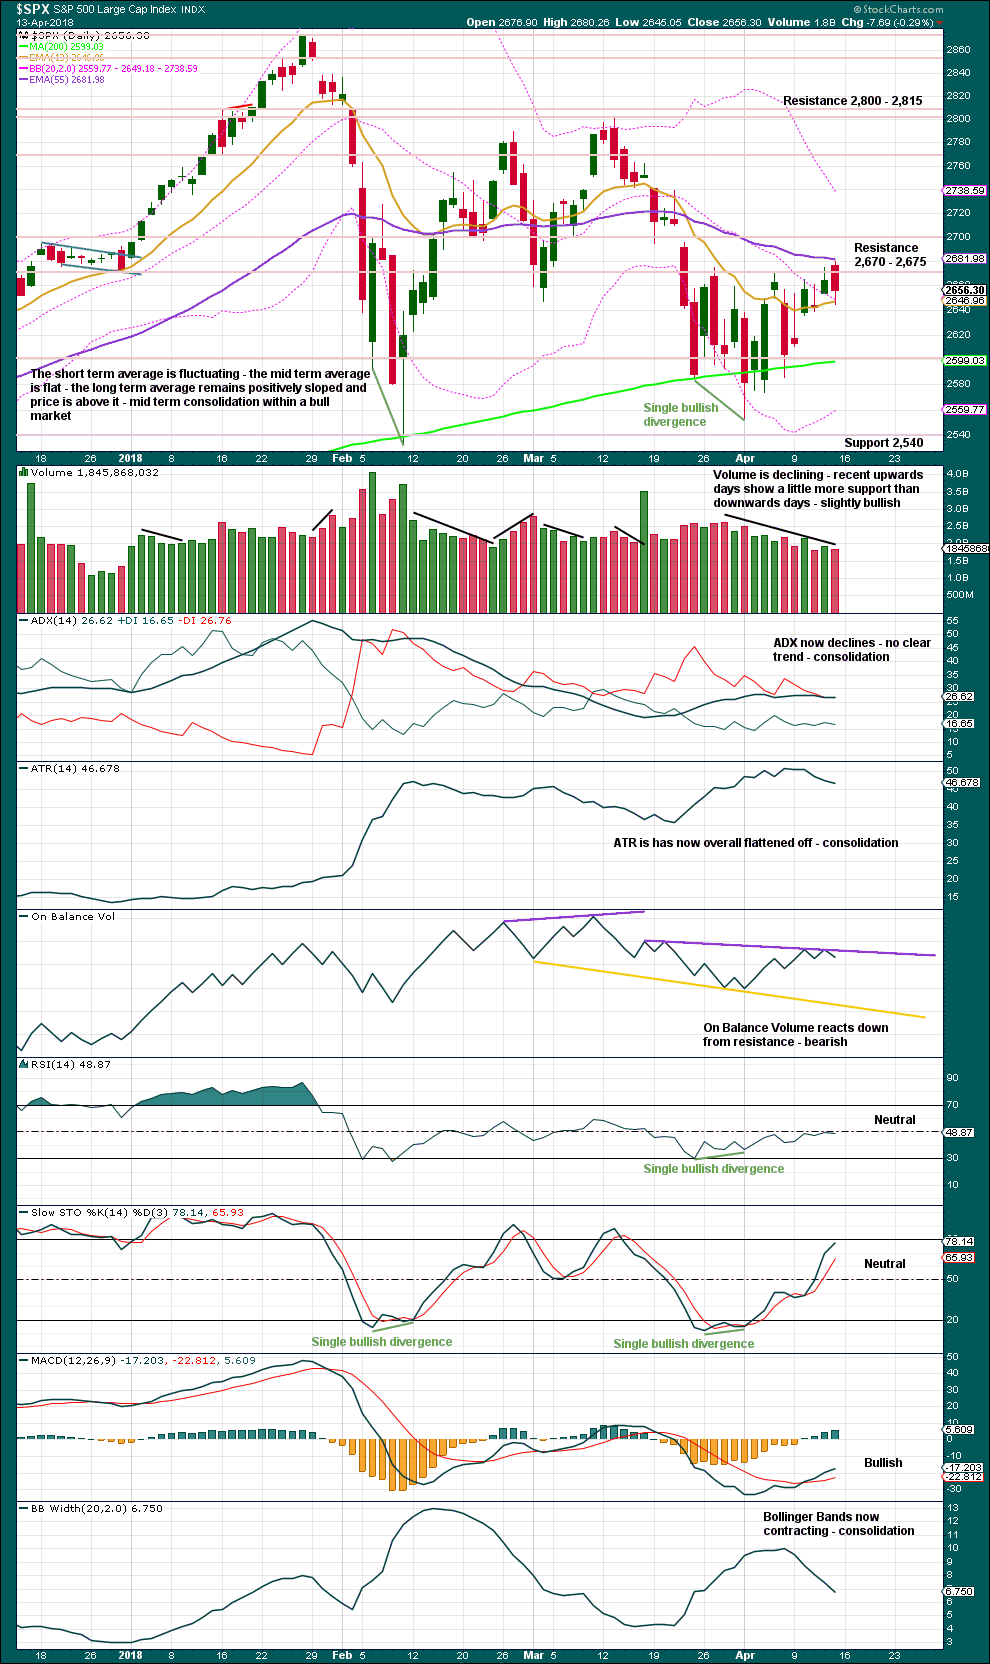
Price has not managed yet to close above resistance. Volume is declining as price rises overall. On Balance Volume gives a bearish signal.
VOLATILITY – INVERTED VIX CHART
Click chart to enlarge. Chart courtesy of StockCharts.com.
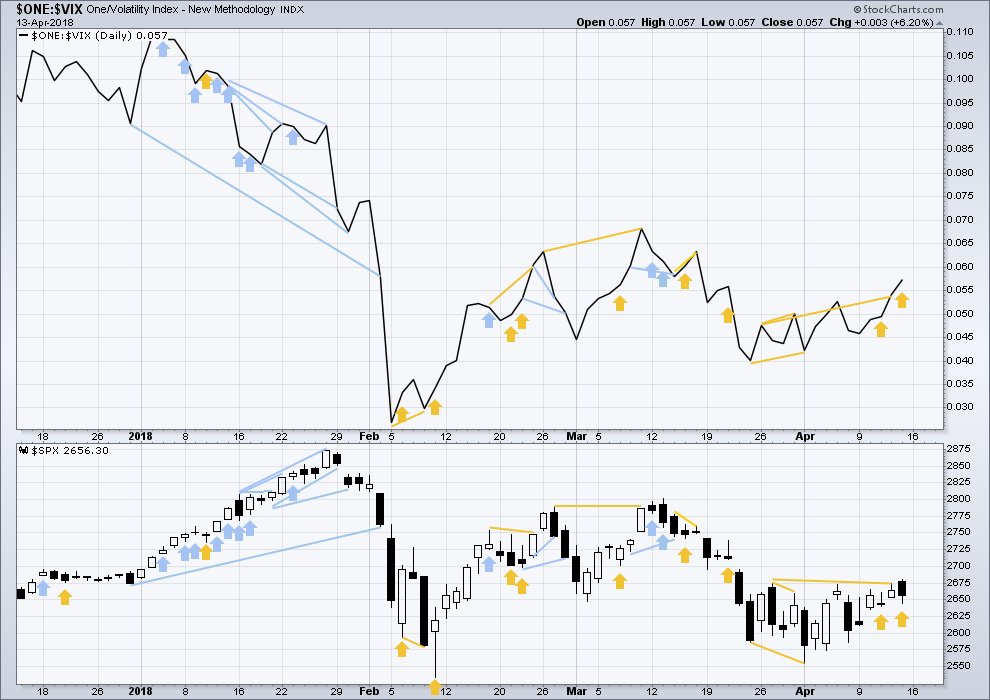
So that colour blind members are included, bearish signals will be noted with blue and bullish signals with yellow.
Normally, volatility should decline as price moves higher and increase as price moves lower. This means that normally inverted VIX should move in the same direction as price.
While price moved lower during most of Friday’s session, this has not come with a normal corresponding increase in VIX. VIX has declined. This divergence is bullish, and it is not weak.
BREADTH – AD LINE
Click chart to enlarge. Chart courtesy of StockCharts.com.
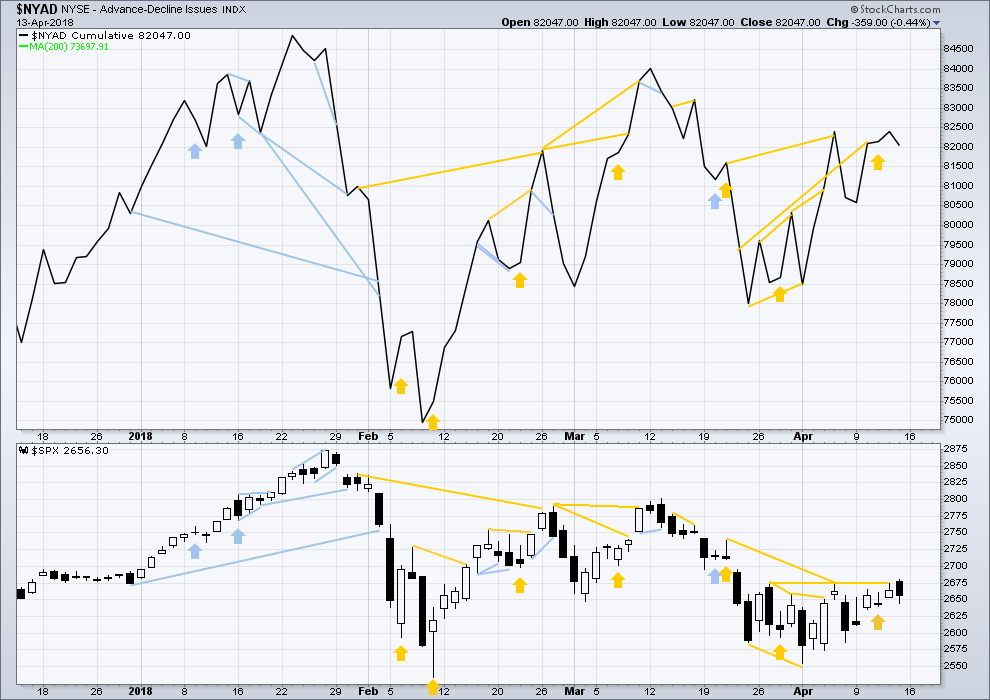
There is normally 4-6 months divergence between price and market breadth prior to a full fledged bear market. This has been so for all major bear markets within the last 90 odd years. With no longer term divergence yet at this point, any decline in price should be expected to be a pullback within an ongoing bull market and not necessarily the start of a bear market.
All of small, mid and large caps this week moved higher. There is no divergence to indicate underlying weakness.
Breadth should be read as a leading indicator.
Price moved lower for much of Friday’s session and has support from declining market breadth. This is bearish.
DOW THEORY
The following lows need to be exceeded for Dow Theory to confirm the end of the bull market and a change to a bear market:
DJIA: 23,360.29.
DJT: 9,806.79.
S&P500: 2,532.69.
Nasdaq: 6,630.67.
At this stage, only DJIA has made a new major swing low. DJT also needs to make a new major swing low for Dow Theory to indicate a switch from a bull market to a bear market. For an extended Dow Theory, which includes the S&P500 and Nasdaq, these two markets also need to make new major swing lows.
GOLD
A bounce was expected to turn up within 24 hours, which is what has happened.
Summary: Expect a downwards swing from here to support. The target is at 1,306. Do not expect this swing to move in a straight line. The first of two bounces along the way down may be over at Friday’s high. After more downwards movement, there should be one more bounce before the low.
Always responsibly manage your risk. Always trade with stops to protect your account from ruin. Invest only 1-5% of equity on any one trade.
Grand SuperCycle analysis is here.
Last in-depth historic analysis with monthly and several weekly charts is here, video is here.
There are multiple wave counts at this time at the weekly and monthly chart levels. In order to make this analysis manageable and accessible only two will be published on a daily basis, one bullish and one bearish. This does not mean the other possibilities may not be correct, only that publication of them all each day is too much to digest. At this stage, they do not diverge from the two possibilities below.
BULLISH ELLIOTT WAVE COUNT
FIRST WEEKLY CHART
Click chart to enlarge.
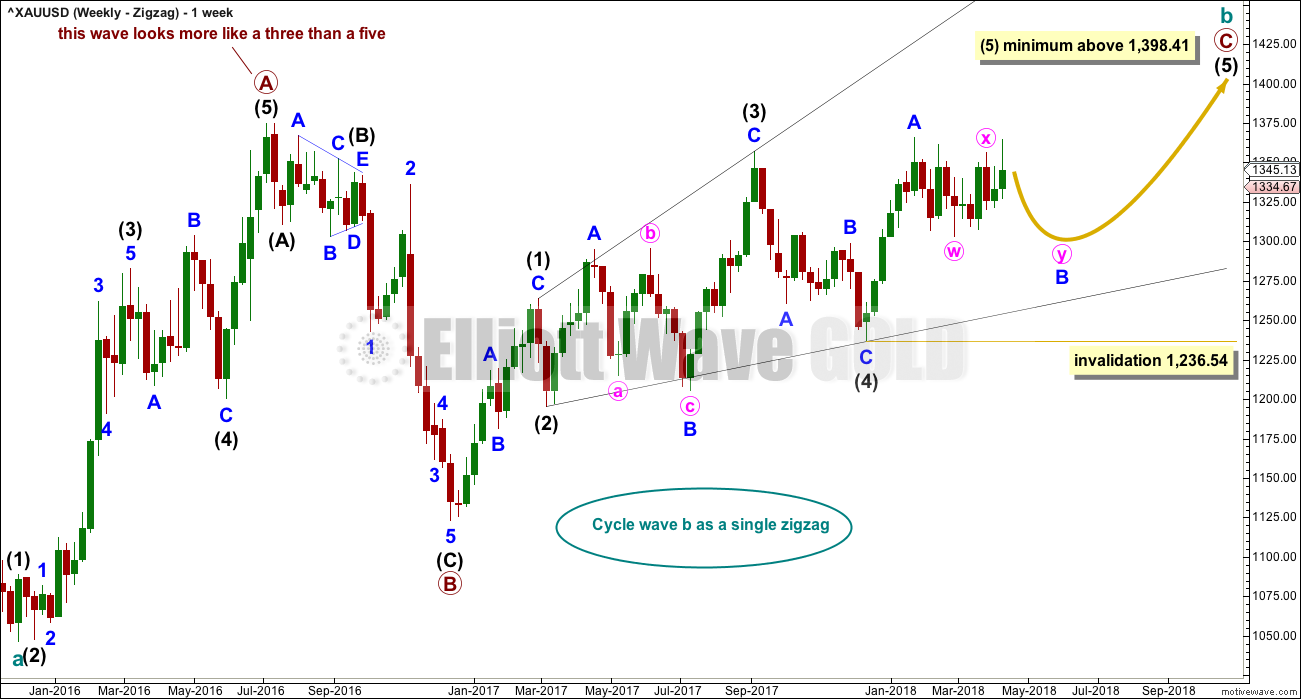
Cycle wave b may be a single zigzag. Zigzags subdivide 5-3-5. Primary wave C must subdivide as a five wave structure and may be either an impulse or an ending diagonal. Overlapping at this stage indicates an ending diagonal.
Within an ending diagonal, all sub-waves must subdivide as zigzags. Intermediate wave (4) must overlap into intermediate wave (1) price territory. This diagonal is expanding: intermediate wave (3) is longer than intermediate wave (1) and intermediate wave (4) is longer than intermediate wave (2). Intermediate wave (5) must be longer than intermediate wave (3), so it must end above 1,398.41 where it would reach equality in length with intermediate wave (3).
Within the final zigzag of intermediate wave (5), minor wave B may not move beyond the start of minor wave A below 1,236.54. However, if it were now to turn out to be relatively deep, it should not get too close to this invalidation point as the lower (2)-(4) trend line should provide strong support. Diagonals normally adhere very well to their trend lines.
Within the diagonal of primary wave C, each sub-wave is extending in price and so may also do so in time. Within each zigzag, minor wave B may exhibit alternation in structure and may show an increased duration.
Within intermediate wave (1), minor wave B was a triangle lasting 11 days. Within intermediate wave (3), minor wave B was a regular flat lasting 60 days. Within intermediate wave (5), minor wave B may last as long as 40 to 60 days. So far it has lasted 56 days (refer to daily chart) and the structure is incomplete.
At this stage, minor wave B may now be a double flat or triangle. These two ideas are separated out in daily charts below.
This first weekly chart sees the upwards wave labelled primary wave A as a five wave structure. It must be acknowledged that this upwards wave looks better as a three than it does as a five. The fifth weekly chart below will consider the possibility that it was a three.
FIRST DAILY CHART – DOUBLE FLAT
Click chart to enlarge.
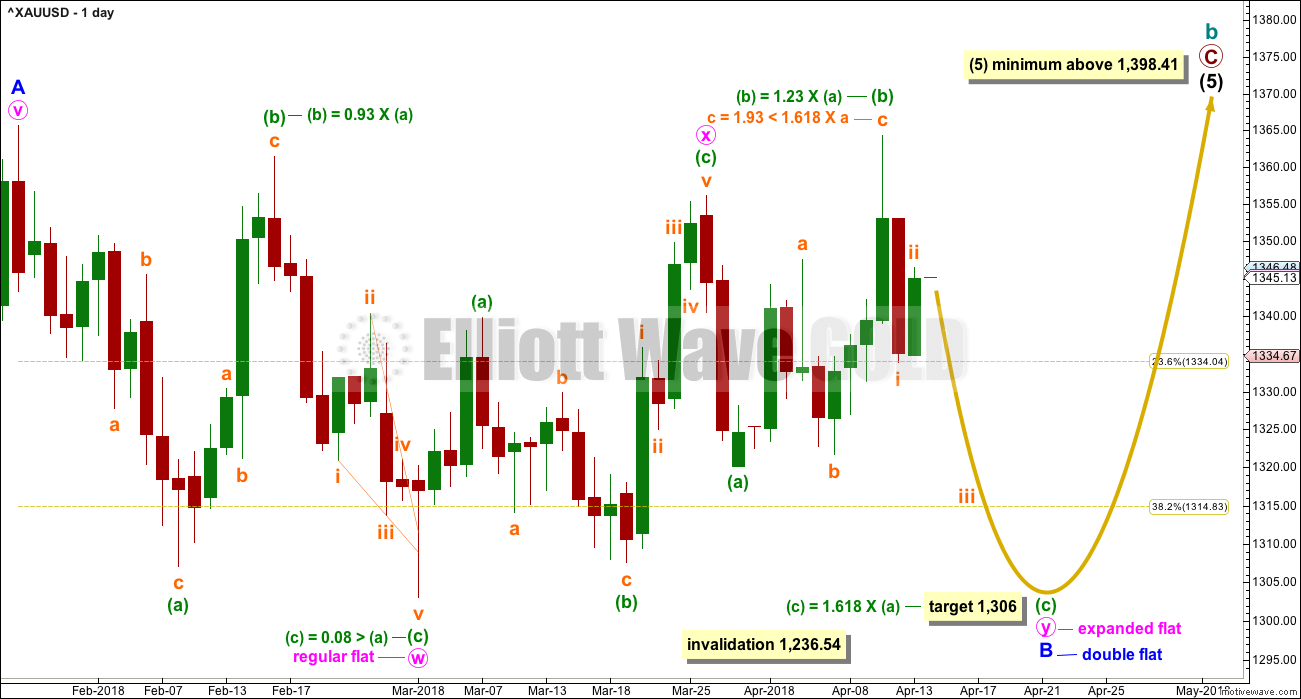
A new high above 1,356.12 indicates minute wave y be an expanded flat correction. This indicates minor wave B may be a relatively rare double flat correction.
Within this possible double flat, the first flat labelled minute wave w is a regular flat. The second flat labeled minute wave y may be an expanded flat, providing alternation with the first.
Within the expanded flat of minute wave y, minuette wave (b) is within the common range of from 1 to 1.38 times the length of minuette wave (a). The most common Fibonacci ratio for minuette wave (c) is used to calculate a target for it to end.
The target would see minute wave y end close to the same level as minute wave w; the double flat would have a sideways look and achieve its purpose of taking up time and moving sideways. This target is also within a strong area of support.
Minuette wave (c) should subdivide as a five wave structure. It may not move in a straight line, so do not expect it to. Within minuette wave (c), there may be expected to be two bounces for a second and fourth wave. The first bounce for subminuette wave ii now shows up as a green daily candlestick.
Minuette wave (c) would be extremely likely to move at least slightly below the end of minuette wave (a) at 1,320 to avoid a truncation and a very rare running flat.
SECOND DAILY CHART – TRIANGLE
Click chart to enlarge.
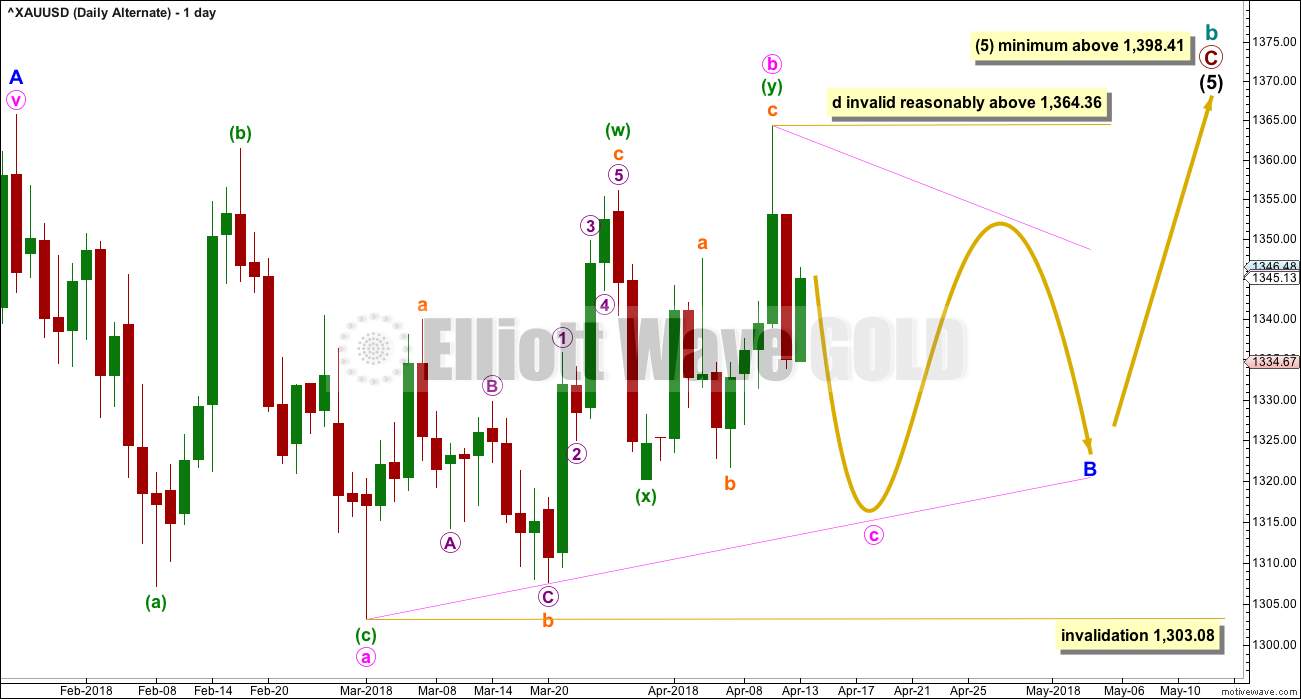
This alternate daily chart is identical to the first daily chart up to the high labelled minor wave A. Thereafter, it looks at a different structure for minor wave B.
A triangle for minor wave B may still be valid. Within a triangle, four of the five sub-waves must sub-divide as zigzags and one sub-wave usually subdivides as a double zigzag; the double zigzag is most commonly wave C of the triangle, but it may be any sub-wave. Here, it may have been minute wave b.
All remaining triangles must be simple A-B-C structures, most likely zigzags.
Minute wave c may not move beyond the end of minute wave a below 1,303.08 for both a contracting or barrier triangle. Thereafter, minute wave d may not move above the end of minute wave b at 1,364.36 for a contracting triangle. For a barrier triangle, minute wave d may end about the same level as minute wave b in order for the b-d trend line to look essentially flat.
A final small zigzag downwards for minute wave e would most likely fall short of the a-c trend line.
This wave count still allows for choppy overlapping movement in an ever decreasing range for several weeks. Minor wave B may be as long lasting as a Fibonacci 21 weeks if it is a triangle, as triangles do tend to be very long lasting structures.
This wave count now expects a zigzag may be unfolding lower for minute wave c. This count expects a zigzag and the main count expects a 1-2-3 of an impulse.
BEARISH ELLIOTT WAVE COUNT
FIFTH WEEKLY CHART
Click chart to enlarge.
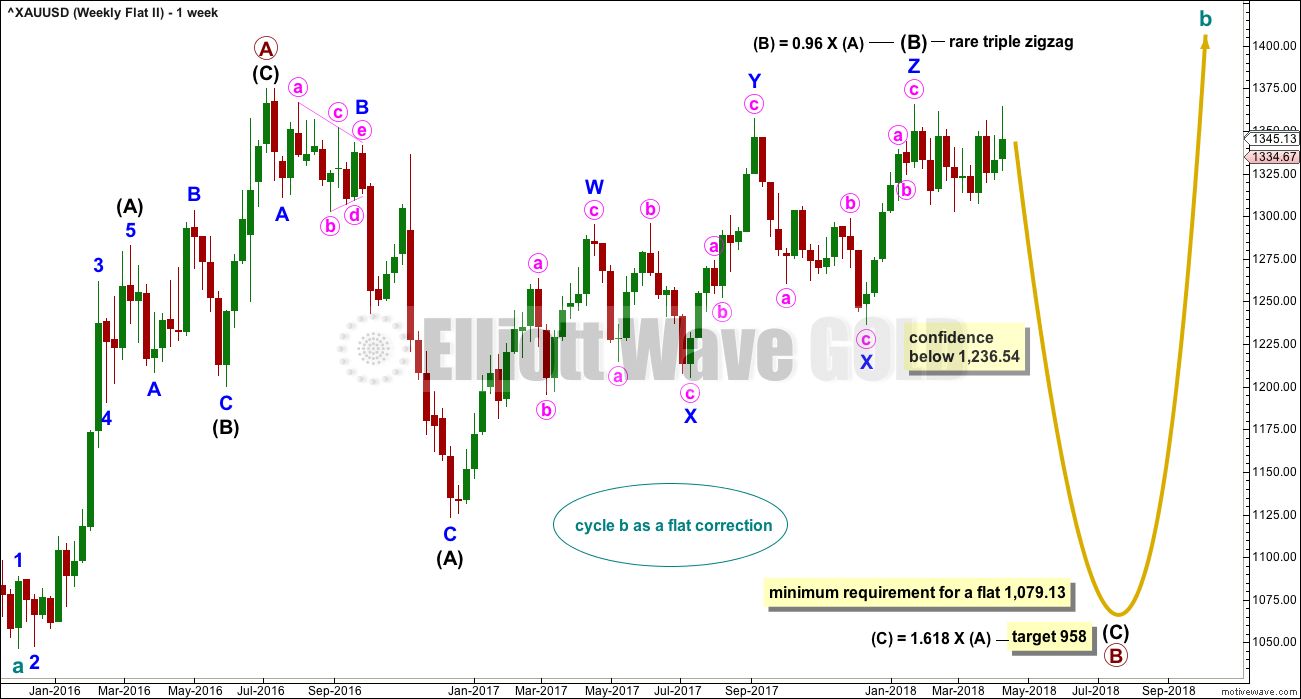
There were five weekly charts published in the last historic analysis. This fifth weekly chart is the most immediately bearish wave count, so this is published as a bearish possibility.
This fifth weekly chart sees cycle wave b as a flat correction, and within it intermediate wave (B) may be a complete triple zigzag. This would indicate a regular flat as intermediate wave (B) is less than 1.05 the length of intermediate wave (A).
If cycle wave b is a flat correction, then within it primary wave B must retrace a minimum 0.9 length of primary wave A at 1,079.13 or below. The most common length of B waves within flats is from 1 to 1.38 times the length of the A wave. The target calculated would see primary wave B end within this range.
I have only seen two triple zigzags before during my 10 years of daily Elliott wave analysis. If this wave count turns out to be correct, this would be the third. The rarity of this structure is identified on the chart.
FIFTH DAILY CHART
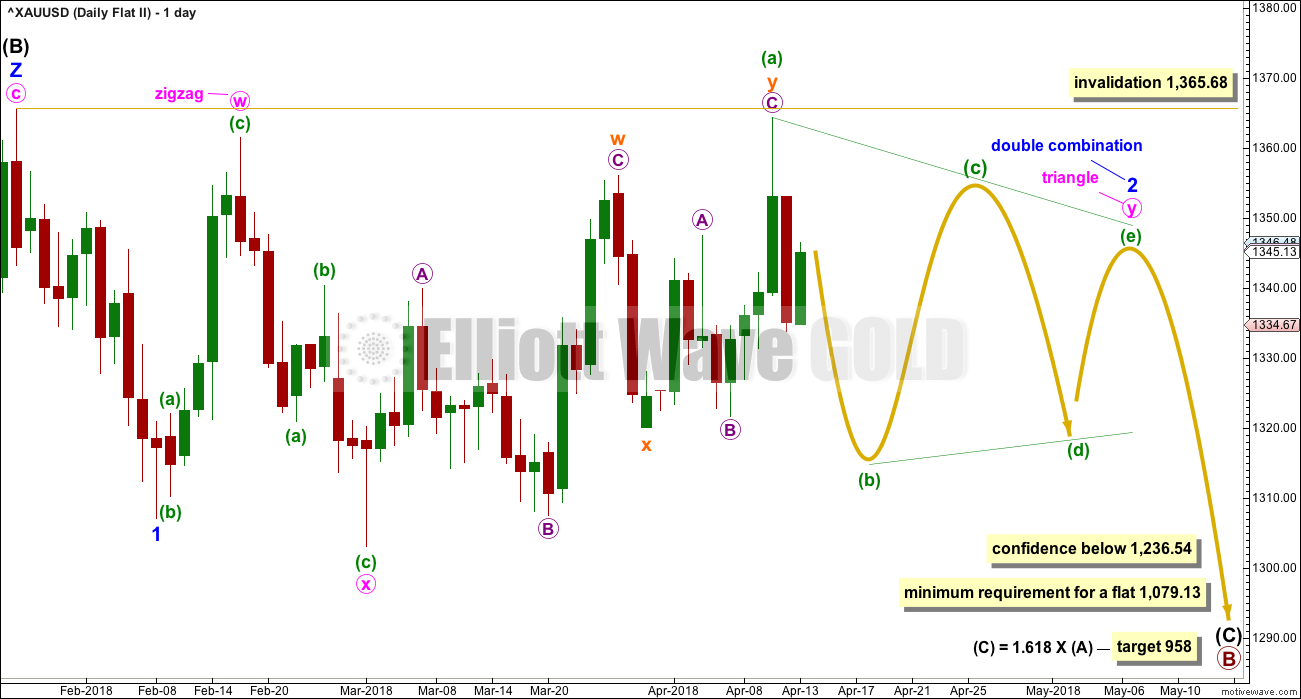
Click chart to enlarge.
Minor wave 1 may have been a relatively brief impulse over at the low of the 8th of February. Thereafter, minor wave 2 may be an incomplete double combination.
The first structure in the double may be a zigzag labelled minute wave w. The double may be joined by a three in the opposite direction, a zigzag labelled minute wave x. The second structure in the double may be an incomplete triangle labelled minute wave y. This structure may yet take some weeks to complete. In my experience a double combination with a triangle for minute wave y is not very common. This reduces the probability of this wave count, but it remains valid.
This wave count is a good solution for this bearish wave count. All subdivisions fit and there are no rare structures so far within intermediate wave (C).
TECHNICAL ANALYSIS
WEEKLY CHART
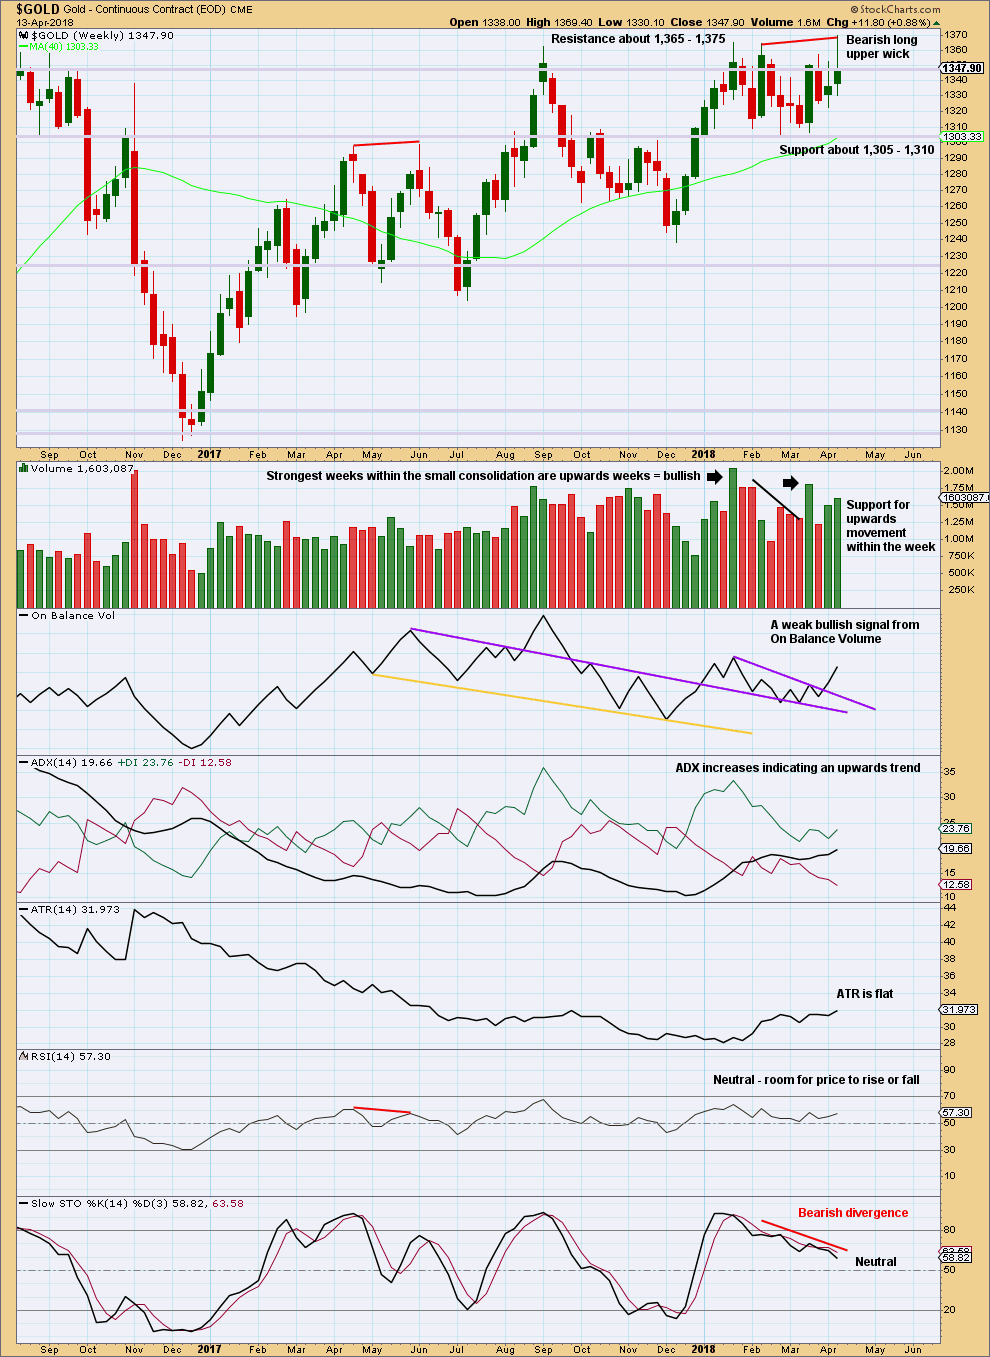
Click chart to enlarge. Chart courtesy of StockCharts.com.
Gold is within a small consolidation with resistance about 1,365 to (final) 1,375 and strong support about 1,310 to 1,305. Volume suggests an upwards breakout is more likely than downwards.
The bullish signal last week from On Balance Volume is weak because the purple line, which has been breached, has a reasonable slope and was only tested twice prior.
Reasonable weight should be given to the long upper wick on this weekly candlestick; it is reasonably bearish. With price at resistance at the high of this candlestick, and Stochastics exhibiting bearish divergence, it seems reasonable to expect a downwards swing to support next week.
DAILY CHART
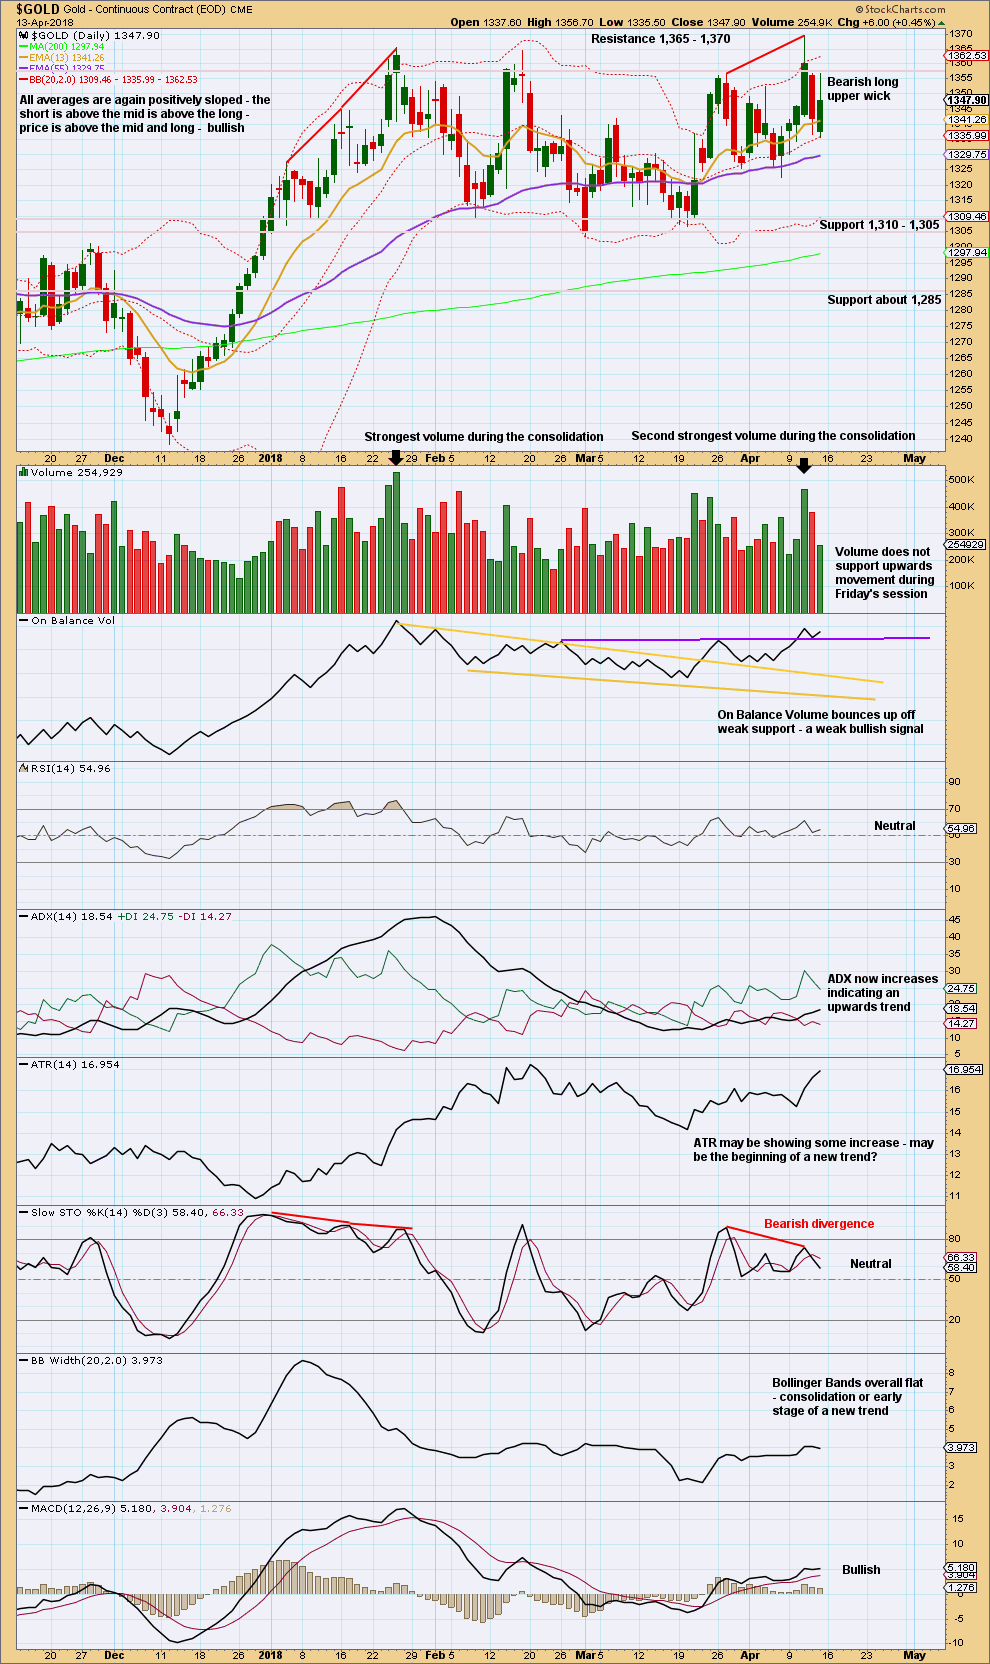
Click chart to enlarge. Chart courtesy of StockCharts.com.
Gold is within a smaller consolidation that began back on about the 3rd of January. This consolidation is delineated by resistance about 1,360 to 1,365 and support about 1,310 to 1,305. It is the upwards days of the 15th of January and the 11th of April that have strongest volume. This strongly suggests an upwards breakout may be more likely than downwards.
The bearish long upper wick of Friday’s candlestick may be given some weight, particularly as it does not have support from volume and there is divergence with price and Stochastcis at highs.
GDX WEEKLY CHART
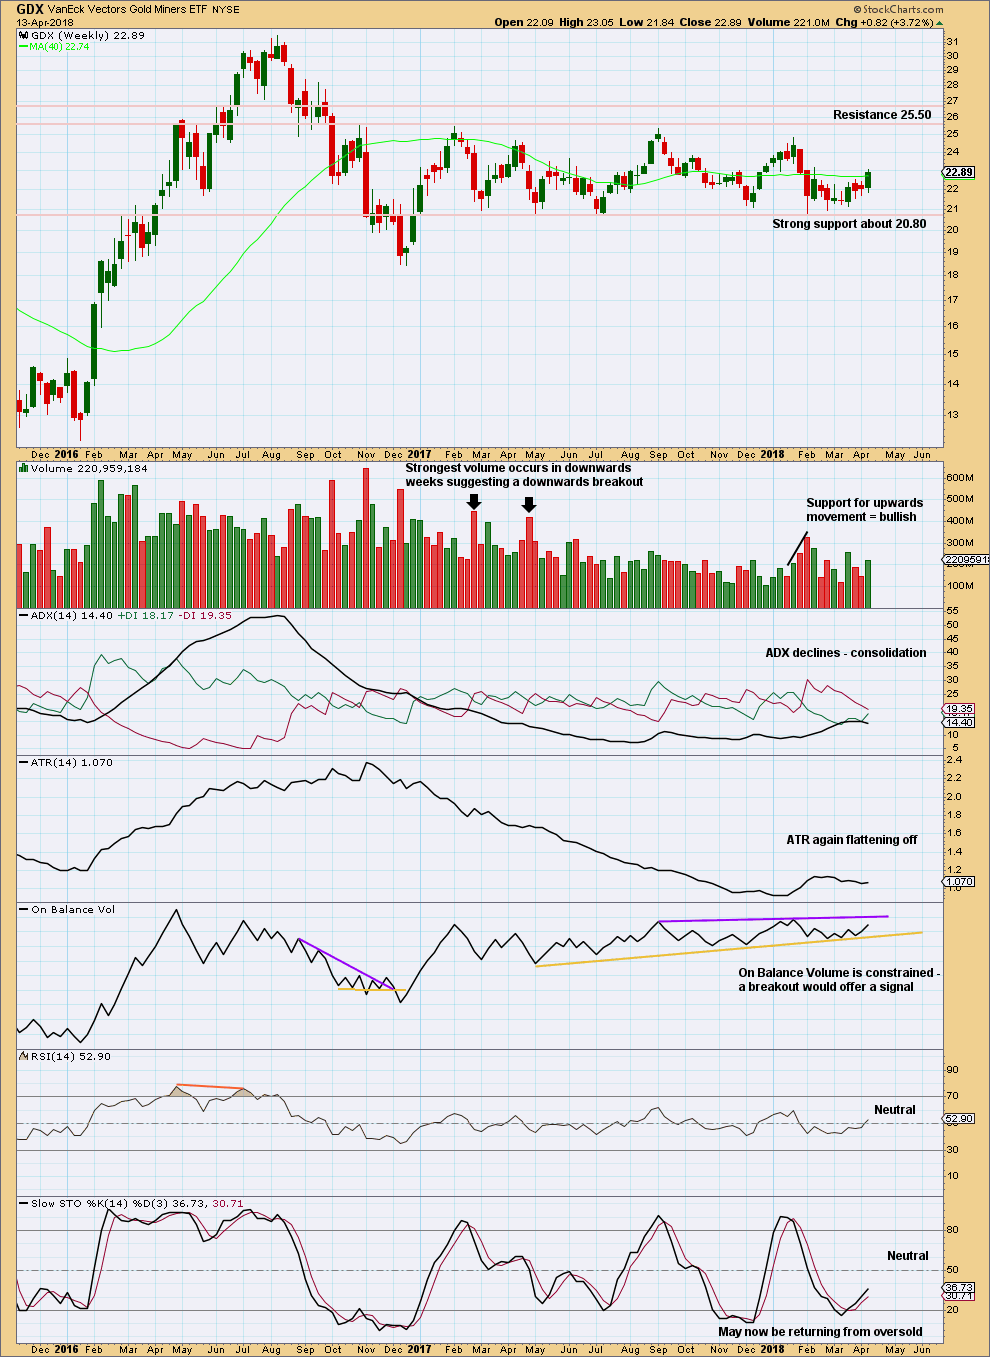
Click chart to enlarge. Chart courtesy of StockCharts.com.
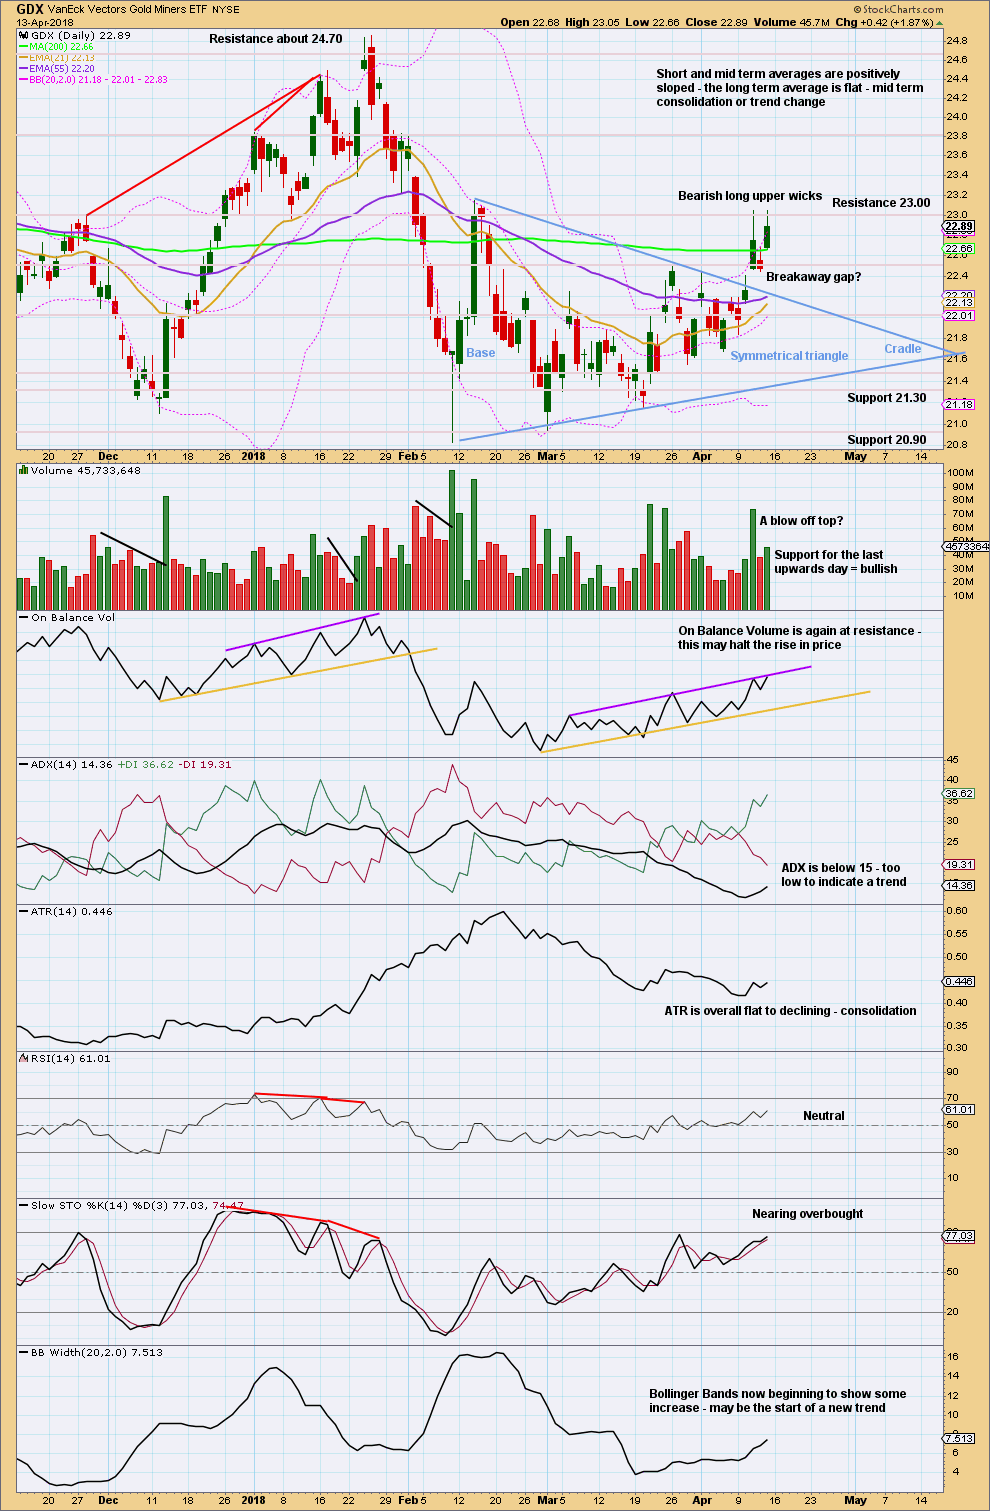
Support about 20.80 has been tested about eight times and so far has held. The more often a support area is tested and holds, the more technical significance it has.
In the first instance, expect this area to continue to provide support. Only a strong downwards day, closing below support and preferably with some increase in volume, would constitute a downwards breakout from the consolidation that GDX has been in for a year now.
Resistance is about 25.50. Only a strong upwards day, closing above resistance and with support from volume, would constitute an upwards breakout.
The last week is a strong green candlestick with support from volume. There is some distance to go before On Balance Volume finds resistance. It looks like an upwards swing may be underway for GDX to resistance. Do not expect it to move in a straight line.
GDX DAILY CHART
Click chart to enlarge. Chart courtesy of StockCharts.com.
On trading triangles from Dhalquist and Kirkpatrick, page 319:
“The ideal situation for trading triangles is a definite breakout, a high trading range within the triangle, an upward-sloping volume trend during the formation of the triangle, and especially a gap on the breakout. These patterns seem to work better with small-cap stocks in a rising market.
Although triangles are plentiful, their patterns suffer from many false and premature breakouts. This requires that a very strict breakout rule be used, either a wide filter or a number of closes outside the breakout zone. It also requires a close protective stop at the breakout level in case the breakout is false. Once these defensive levels have been exceeded, and price is on its way, the trader can relax for a little while because the failure rate after a legitimate breakout is relatively low. Trailing stops should then be placed at each preceding minor reversal.
…. in symmetrical triangles, the best performance comes from late breakouts in the 73% – 75% distance.
Volume on the breakout seems more desirable in symmetrical triangles.”
In this case, the breakout has come 61% of the triangle length from base to cradle. Volume towards the end of the triangle declined. The breakout is accompanied by a gap and has good support from volume.
Pullbacks occur 59% of the time for symmetrical triangles.
Any long positions entered on a pullback may use the breakaway gap as a place for stops just below 22.41. If that gap is closed, then it may be an exhaustion gap and the breakout may have failed. The gap remains open at this time. If this is correctly labelled as a breakaway gap, then price should bounce up from here. If it is closed, then next support may be about the upper trend line of the triangle.
A profit target is calculated by adding the triangle width to the breakout point. This gives a target at 24.61.
At this time, there is strong resistance about 23.00 and On Balance Volume is at resistance. Resistance and long upper wicks suggest another pullback may be coming shortly. Any long positions should be protected with stops.
US OIL
A new high above 66.65 has substantially reduced the probability of the main Elliott wave count and increased the probability of the alternate. This week the two wave counts should be swapped over.
Summary: The probability that Oil is in a huge new bull market looks much higher this week. This main wave count still expects a pullback to end just below 58.13, but not below 55.24, for the short term though. Thereafter, a strong bull run may begin. A bull market for Oil has strong support from classic technical analysis at the monthly chart level.
Upwards movement of the last two days is looking weak; volume and range are sharply declining. This favours the idea of a pullback about here.
Always practice good risk management as the most important aspect of trading. Always trade with stops and invest only 1-5% of equity on any one trade. Failure to manage risk is the most common mistake new traders make.
MAIN WAVE COUNT
MONTHLY CHART
Click chart to enlarge.
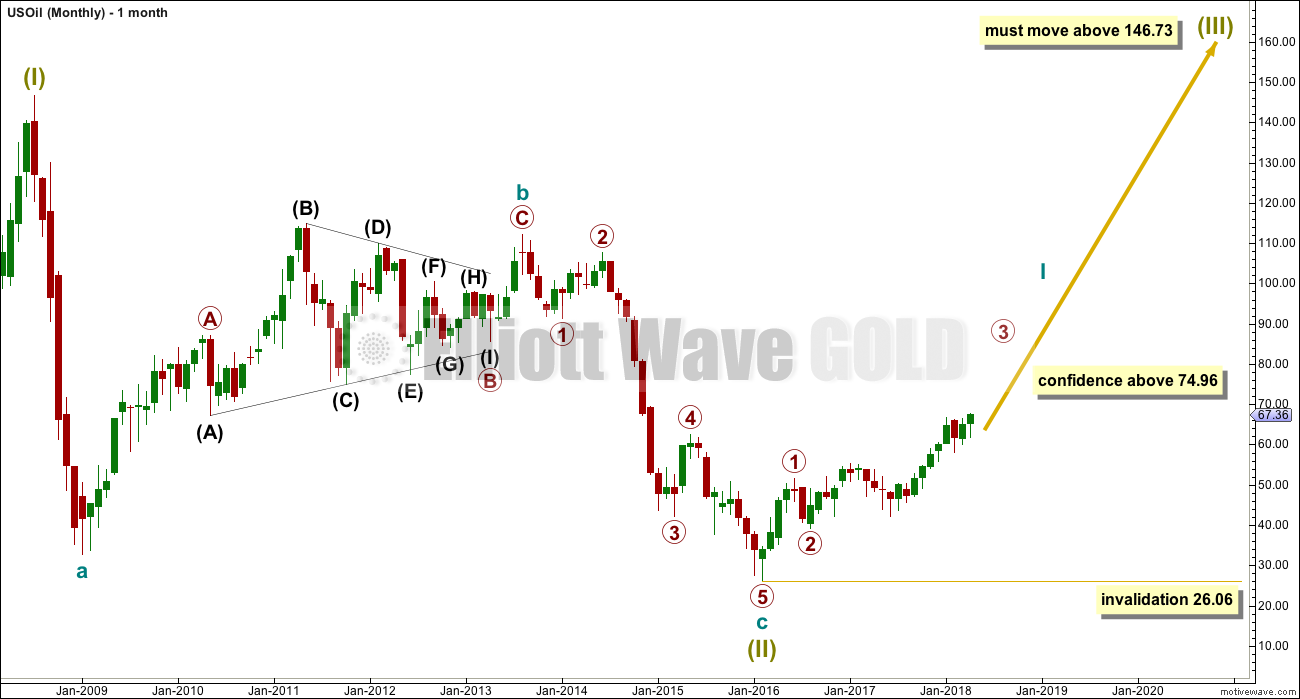
It is possible that the bear market for Oil is over and a new bull market is in the very early stages.
A huge zigzag down to the last low may be complete and is labelled here Super Cycle wave (II).
Cycle wave b must be seen as complete in August 2013 for this wave count to work. It cannot be seen as complete at the prior major swing high in May 2011.
Cycle wave b is seen as a zigzag, and within it primary wave B is seen as a running contracting triangle. These are fairly common structures, although nine wave triangles are uncommon. All subdivisions fit.
Primary wave C moves beyond the end of primary wave A, so it avoids a truncation. But it does not have to move above the price territory of primary wave B to avoid a truncation, which is an important distinction.
If cycle wave b begins there, then cycle wave c may be seen as a complete five wave impulse.
Super Cycle wave (III) must move beyond the end of Super Cycle wave (I). It must move far enough above that point to allow room for a subsequent Super Cycle wave (IV) to unfold and remain above Super Cycle wave (I) price territory.
Cycle wave I may be incomplete. It may be ready to move through the middle and end of its third wave at primary degree, which may be the strongest upwards portion of cycle wave I; a strong increase in momentum and range may be ahead.
When cycle wave I is complete, then cycle wave II may be a deep correction that may not move beyond the start of cycle wave I below 26.06.
Data from FXCM for USOil does not go back to the beginning of Super Cycle wave (I). Without an accurate known length of Super Cycle wave (I) a target cannot be calculated for Super Cycle wave (III) to end using Fibonacci ratios. The target for Super Cycle wave (III) may be calculated when cycle waves I, II, III and IV within it are complete. That cannot be done for many years.
WEEKLY CHART
Click chart to enlarge.
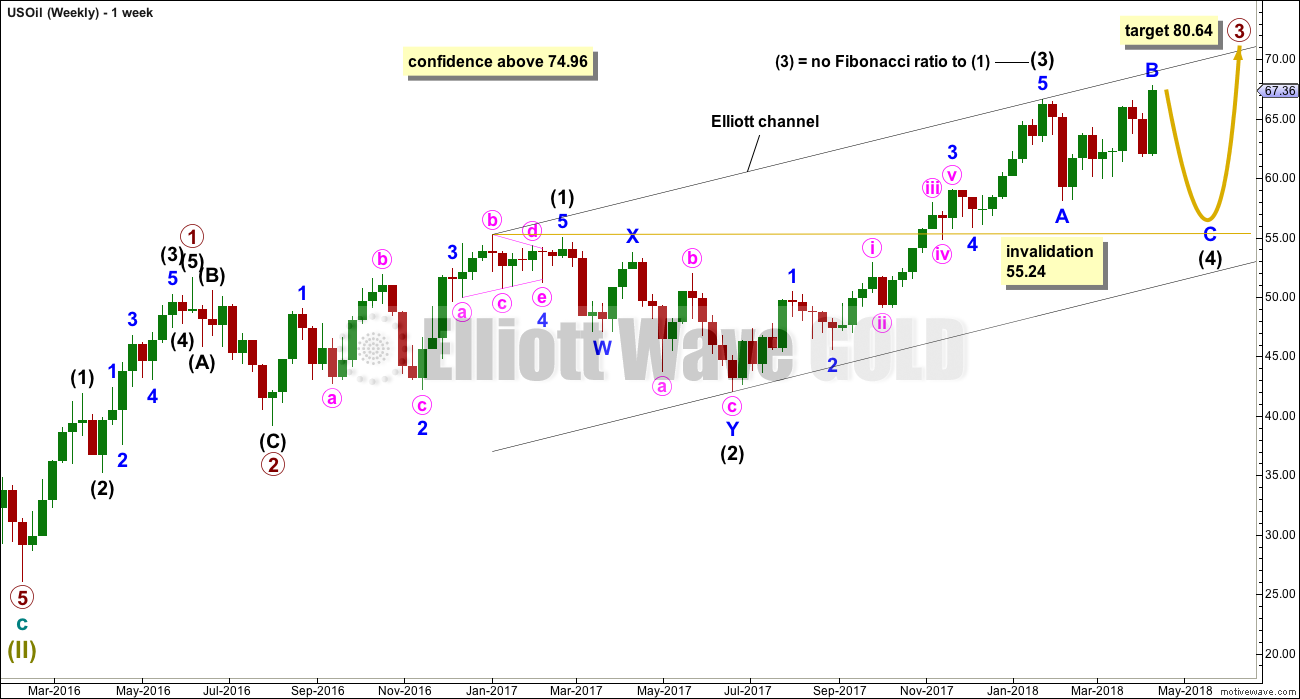
If a new bull market is in the very early stages for Oil, then it may have begun with two overlapping first and second waves at primary then at intermediate degree.
Primary wave 3 may only subdivide as an impulse, and within it intermediate wave (3) may be complete.
Intermediate wave (4) may not move into intermediate wave (1) price territory below 55.24. Intermediate wave (4) would most likely be incomplete. It may continue further sideways or lower.
Intermediate wave (2) is labelled as a double zigzag. To exhibit alternation intermediate wave (4) may most likely be a flat, combination or triangle. Intermediate wave (2) lasted 17 weeks. For good proportion and the right look, intermediate wave (4) may last a Fibonacci 13 or even 21 weeks in total. So far it has lasted only 11 weeks.
Commodities typically exhibit swift and strong fifth waves within their impulses, and this tendency is particularly common for third wave impulses. Intermediate wave (5) may be a swift strong upwards wave when it arrives.
DAILY CHART
Click chart to enlarge.
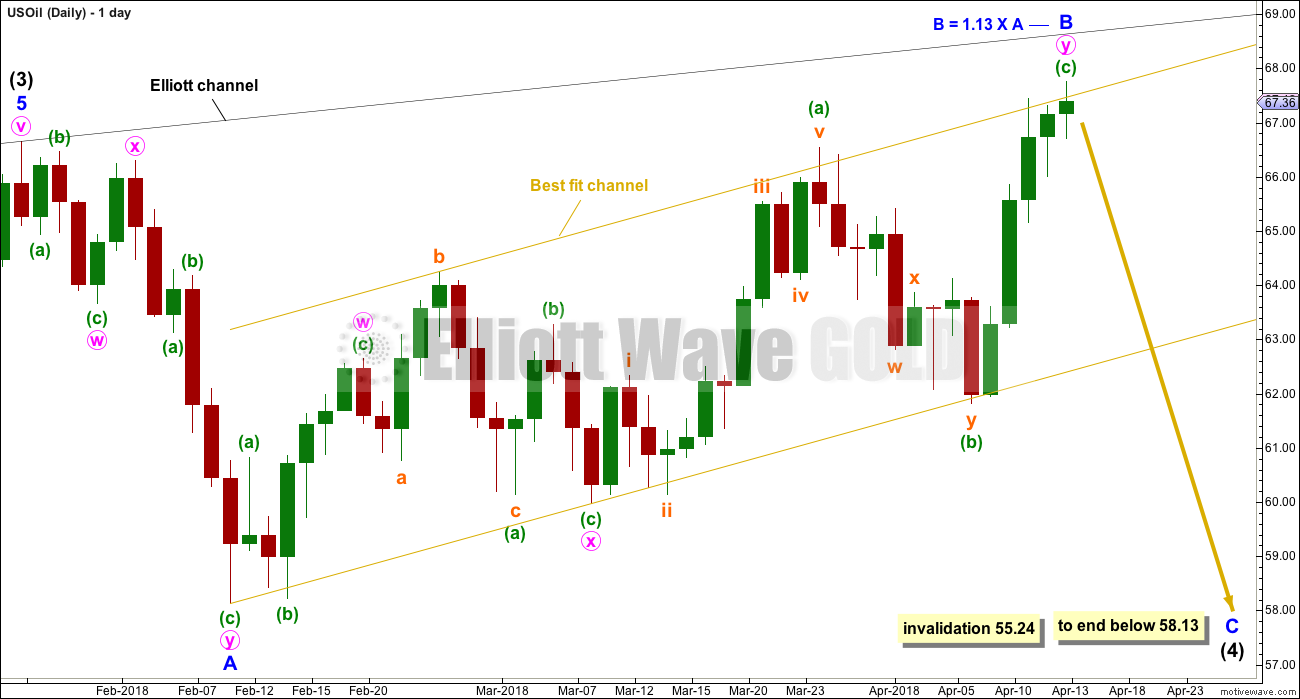
It would be unlikely that intermediate wave (4) would be over a the last low labelled minor wave A. That would be too brief.
If intermediate wave (4) is continuing, then it may be as a flat correction. If minor wave B is now over at 1.13 the length of minor wave A, then intermediate wave (4) may be an expanded flat correction. Expanded flats do not fit well into trend channels.
Minor wave B now fits neatly into a best fit channel at this stage, and it may be ending about resistance at the upper edge of this channel.
Minor wave C downwards must be a five wave structure. It would be extremely likely to move at least slightly below the end of minor wave A at 58.13 to avoid a truncation and a very rare running flat.
ALTERNATE WAVE COUNT
MONTHLY CHART
Click chart to enlarge.
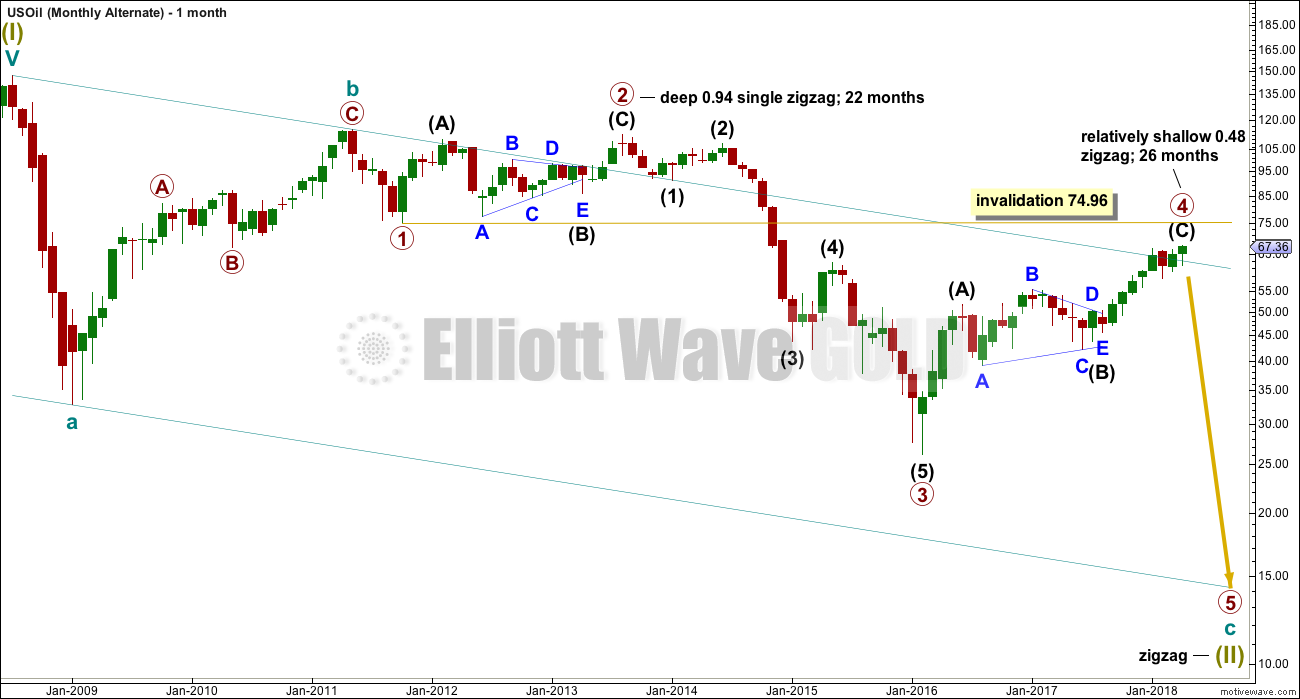
Within the bear market, cycle wave b is seen as ending in May 2011. Thereafter, a five wave structure downwards for cycle wave c begins.
Primary wave 1 is a short impulse lasting five months. Primary wave 2 is a very deep 0.94 zigzag lasting 22 months. Primary wave 3 is a complete impulse with no Fibonacci ratio to primary wave 1. It lasted 30 months.
There is alternation in depth with primary wave 2 very deep and primary wave 4 relatively shallow. There is inadequate alternation in structure, both are zigzags. So far primary wave 4 has lasted 26 months. At this stage, there is still reasonable proportion between primary waves 2 and 4.
Primary wave 4 may not move into primary wave 1 price territory above 74.96.
The wider Elliott channel (teal) about this whole movement may offer support to primary wave 5.
WEEKLY CHART
Click chart to enlarge.
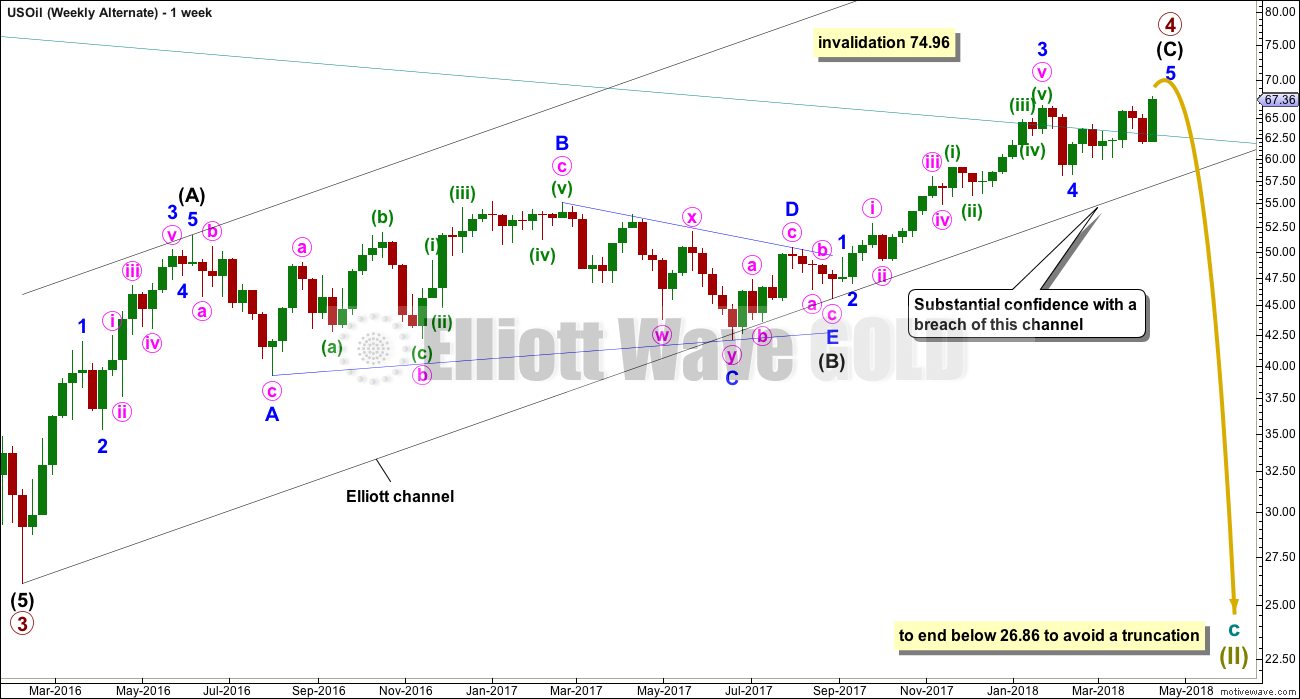
The structure of primary wave 4 up until this week looked like a possibly completed zigzag with good proportion between minor waves 2 and 4 within the last wave up of intermediate wave (C).
Some upwards movement is required at this time for this more bearish wave count to complete minor wave 5. Thereafter, a huge trend change would be expected for a new wave down for primary wave 5, which may last about a year or so. Primary wave 5 would be likely to make at least a slight new low below 26.86 to move below the end of primary wave 3 and avoid a truncation.
An Elliott channel is added to this possible zigzag for primary wave 4. A breach of the lower edge of this channel would provide a very strong indication that primary wave 4 should be over and primary wave 5 should be underway. Look out for some support on the way down, perhaps a short term bounce about the lower edge of the channel.
DAILY CHART
Click chart to enlarge.
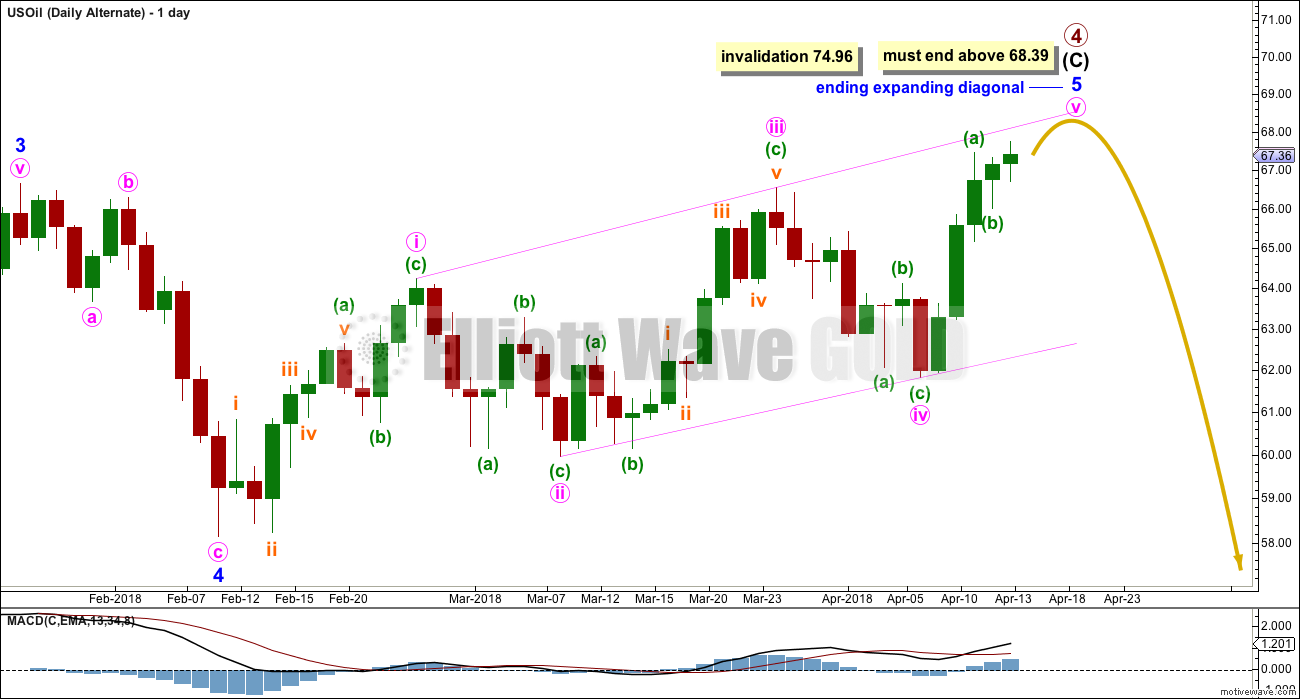
Minor wave 5 will fit so far as a possible ending expanding diagonal. The trend lines slightly diverge. Within the diagonal, minute wave iii is longer than minute wave i and minute wave iv is longer than minute wave ii. Minute wave v must be longer than minute wave iii. Minute wave v would reach equality with minute wave iii at 68.39, so as soon as price makes a new high above this point the diagonal may be complete and all Elliott wave rules would be met.
Within an ending diagonal, all sub-waves must subdivide as zigzags and the fourth wave must overlap first wave price territory. Rules for diagonals are different to rules for impulses.
If price continues slightly higher and makes a new high above 68.39 by any amount at any time frame, and then turns around strongly, then this wave count would remain valid and entirely possible.
This wave cound does not at this point have support from classic technical analysis on the monthly chart.
TECHNICAL ANALYSIS
MONTHLY CHART
Click chart to enlarge. Chart courtesy of StockCharts.com.
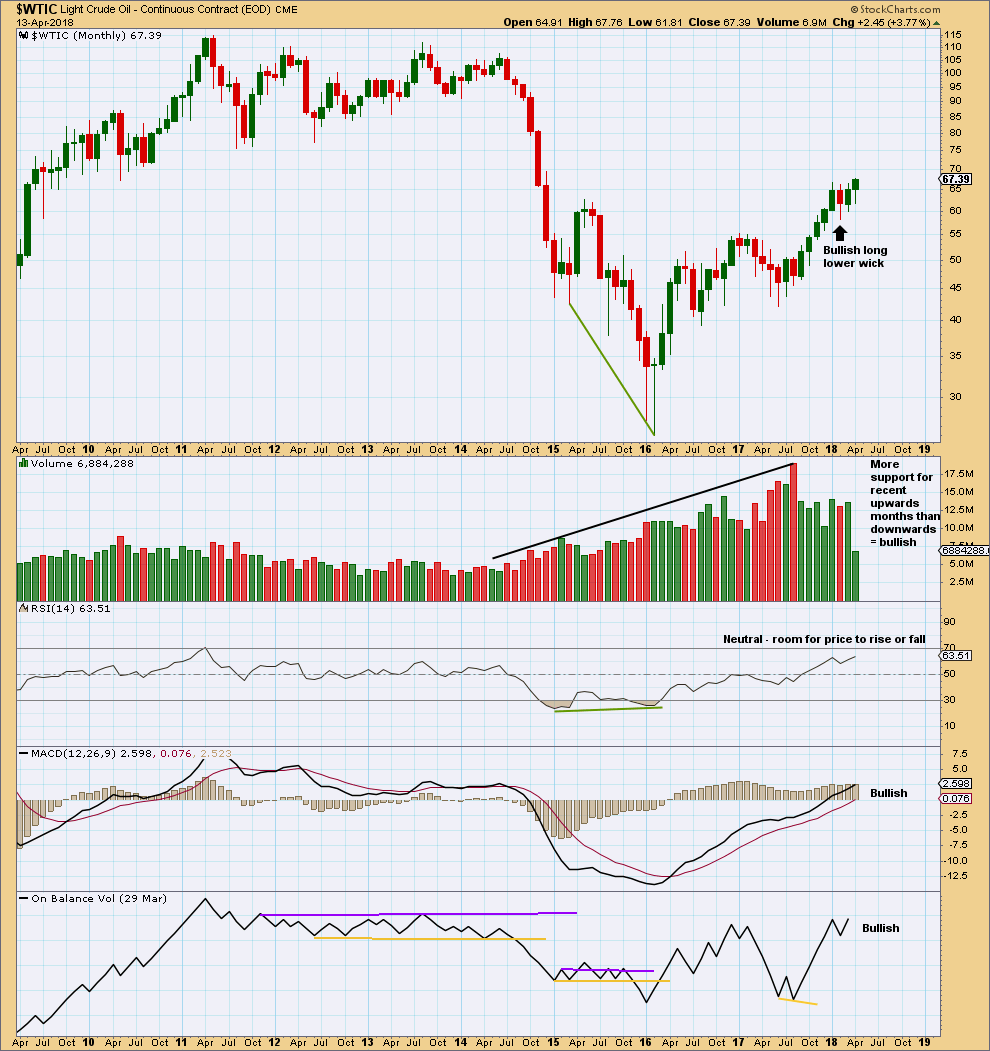
The strongest recent monthly volume is for the downwards month of August 2017. This is bearish.
For the last three months all now complete, the volume profile is bullish.
This chart is overwhelmingly bullish. It supports the new main Elliott wave count.
Strong volume for the month of June 2017 may have been a selling climax. This is typical behaviour of commodities.
DAILY CHART
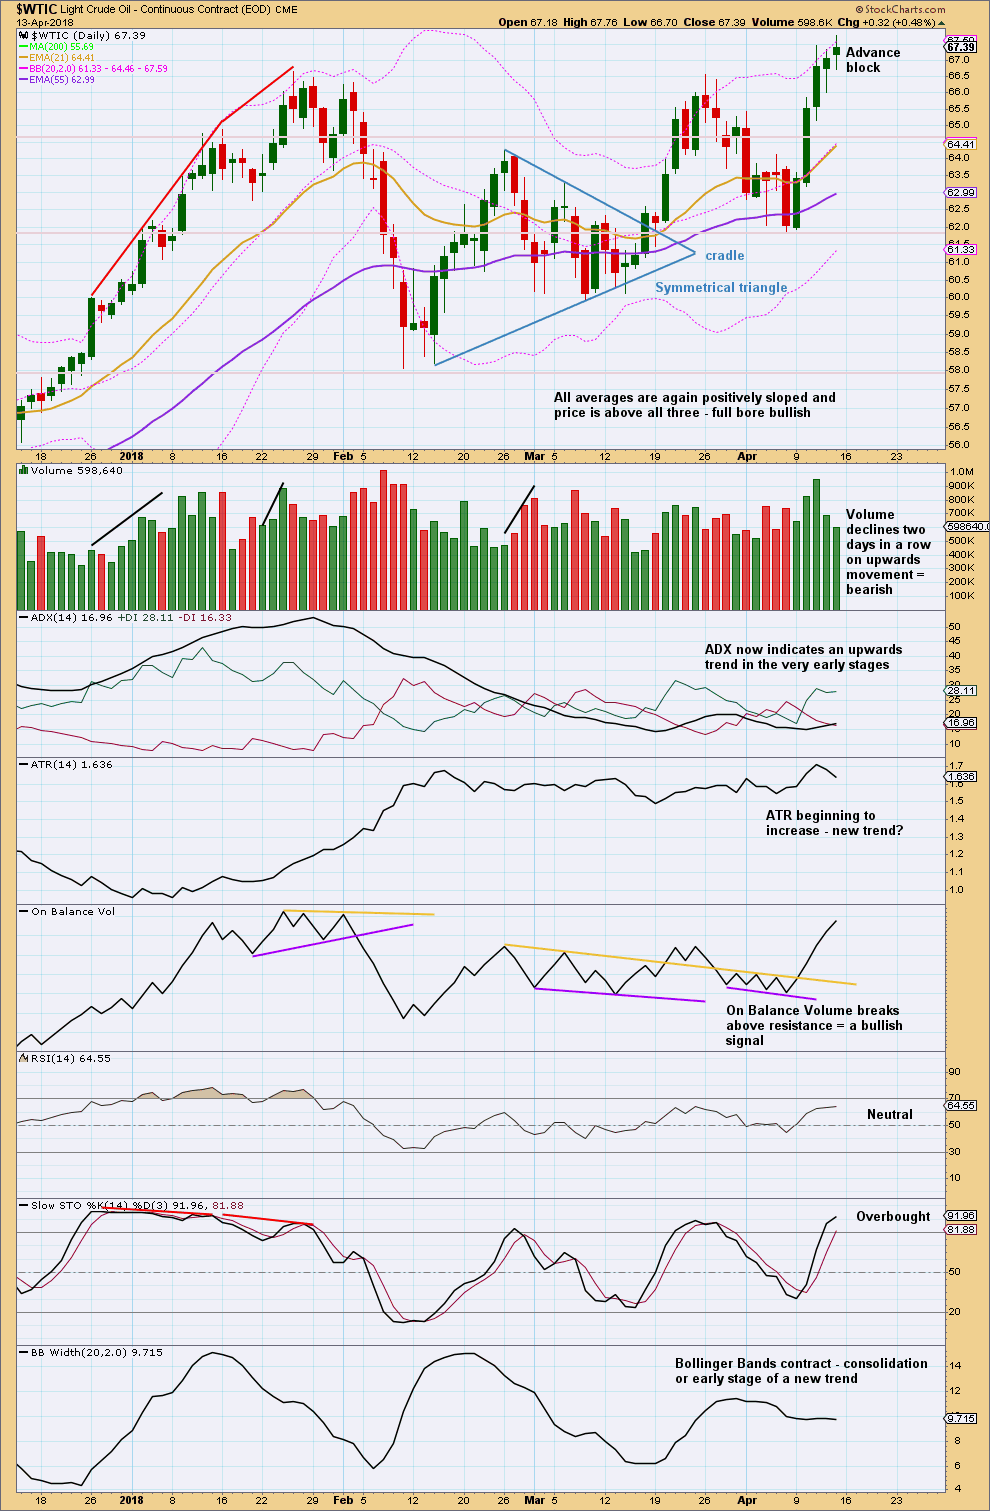
Click chart to enlarge. Chart courtesy of StockCharts.com.
On Balance Volume provided a bullish signal on the 10th of April. This signal is strong.
This is now a somewhat mature upwards trend. The advance block pattern indicates signs of weakening. From Nison, page 99: “…the rally is running into trouble and longs should protect themselves. Be especially cautions about this pattern during a mature uptrend. Signs of weakening could be progressively smaller white real bodies, or relatively long upper shadows.”
In conjunction with strongly declining volume and overbought Stochastics, it looks reasonable to expect a pullback about here. This favours the new wave count for short to mid term expectations.
Thank you Lara. Certainly some new developments in GDX and especially oil. I have been long GDX / NUGT this week. I think it is time to move the stops up to a guaranteed profitable exit. It will be interesting to see how these play out into the summer.
Welcome to all our new members for Lara’s Weekly.
If you have questions for me on this analysis this is a good place to post them.
I encourage you to participate in comments. We have a large membership of some very experienced traders who are kind enough to share their knowledge. You may learn from each other and become better traders.
If you are placing a trade in a live account and wish to share what / how you’re doing that, you are legally fine to do so. Remember, all trading ideas are shared in the spirit of helping each other, and it is up to each member to responsibly manage their own risk. Expect losses as inevitable and manage them.
Before commenting please read the comments guidelines. I am very strict here. Strong moderation has over the years fostered a supportive and positive community where everyone feels free to express different ideas without fear of a negative consequence.