

S&P 500
Price gapped higher but did not reach the short term target before turning a little lower in a mostly sideways day for Friday.
At the end of this week, there are signals from On Balance Volume, the AD line, and VIX that support the Elliott wave counts.
Summary: A multi week consolidation may be over. An upwards breakout may be imminent. The target is at at 2,940. However, the risk still remains that a low is not yet in place. If price does move a little lower, then risk is at 2,553.80.
For the short term, expect some sideways / lower movement for Monday to a short term target at 2,653. Thereafter, expect an increase in upwards momentum.
Always practice good risk management. Always trade with stops and invest only 1-5% of equity on any one trade.
The biggest picture, Grand Super Cycle analysis, is here.
Last historic analysis with monthly charts is here. Video is here.
An alternate idea at the monthly chart level is given here.
An historic example of a cycle degree fifth wave is given at the end of the analysis here.
MAIN ELLIOTT WAVE COUNT
WEEKLY CHART
Click chart to enlarge.
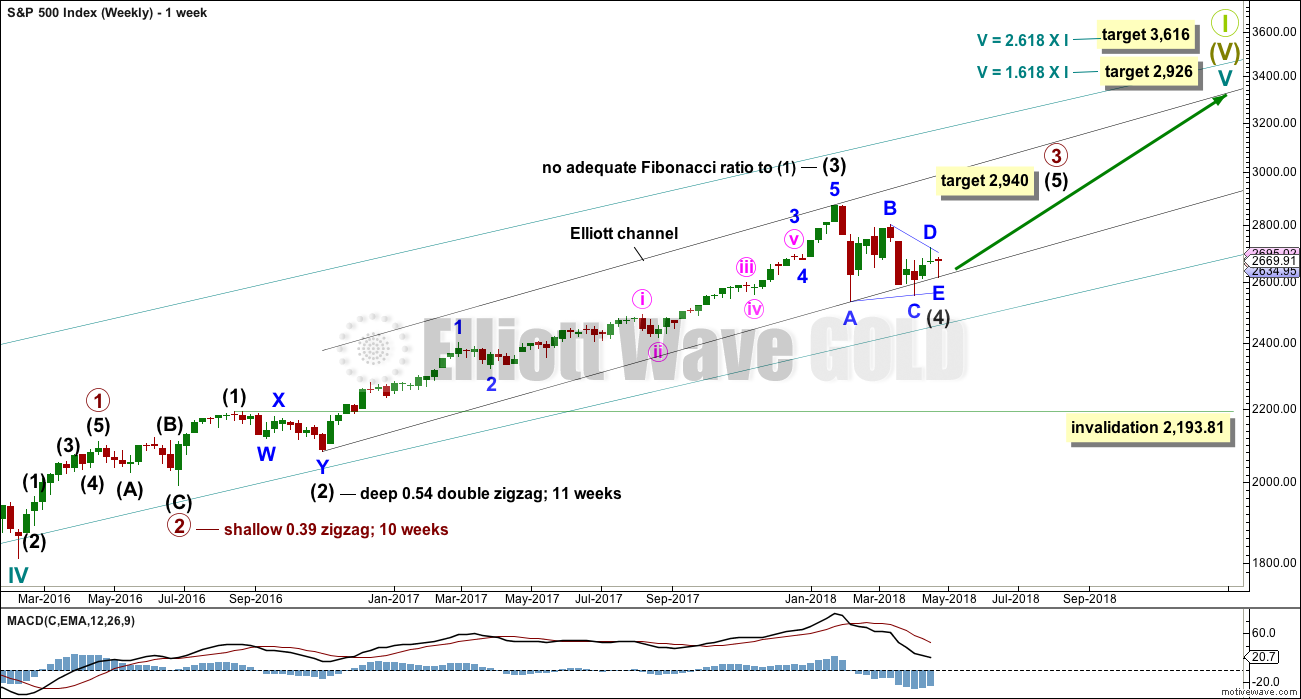
Cycle wave V must complete as a five structure, which should look clear at the weekly chart level. It may only be an impulse or ending diagonal. At this stage, it is clear it is an impulse.
Within cycle wave V, the third waves at all degrees may only subdivide as impulses.
Intermediate wave (4) has breached an Elliott channel drawn using Elliott’s first technique. The channel is redrawn using Elliott’s second technique: the first trend line from the ends of intermediate waves (2) to (4), then a parallel copy on the end of intermediate wave (3). Intermediate wave (5) may end either midway within the channel, or about the upper edge.
At least three wave counts remain valid at the daily chart level. It is possible still that a low may not be in place; intermediate wave (4) could still continue further. Intermediate wave (4) may not move into intermediate wave (1) price territory below 2,193.81. However, it would be extremely likely to remain within the wider teal channel (copied over from the monthly chart) if it were to be reasonably deep. This channel contains the entire bull market since the low in March 2009, with only two small overshoots at the end of cycle wave IV. If this channel is breached, then the idea of cycle wave V continuing higher would be discarded well before the invalidation point is breached.
If intermediate wave (4) ends anytime within this week, then it would total a Fibonacci 13 weeks. It would have excellent proportion with intermediate wave (2), and there would be perfect alternation if it is over as a shallow triangle.
At this stage, there are still three possible structures for intermediate wave (4): a triangle, a combination, and a flat correction. All three will be published. The triangle is preferred because that would see price continue to find support about the 200 day moving average. While this average continues to provide support, it is reasonable to expect it to continue (until it is clearly breached).
DAILY CHART
Click chart to enlarge.
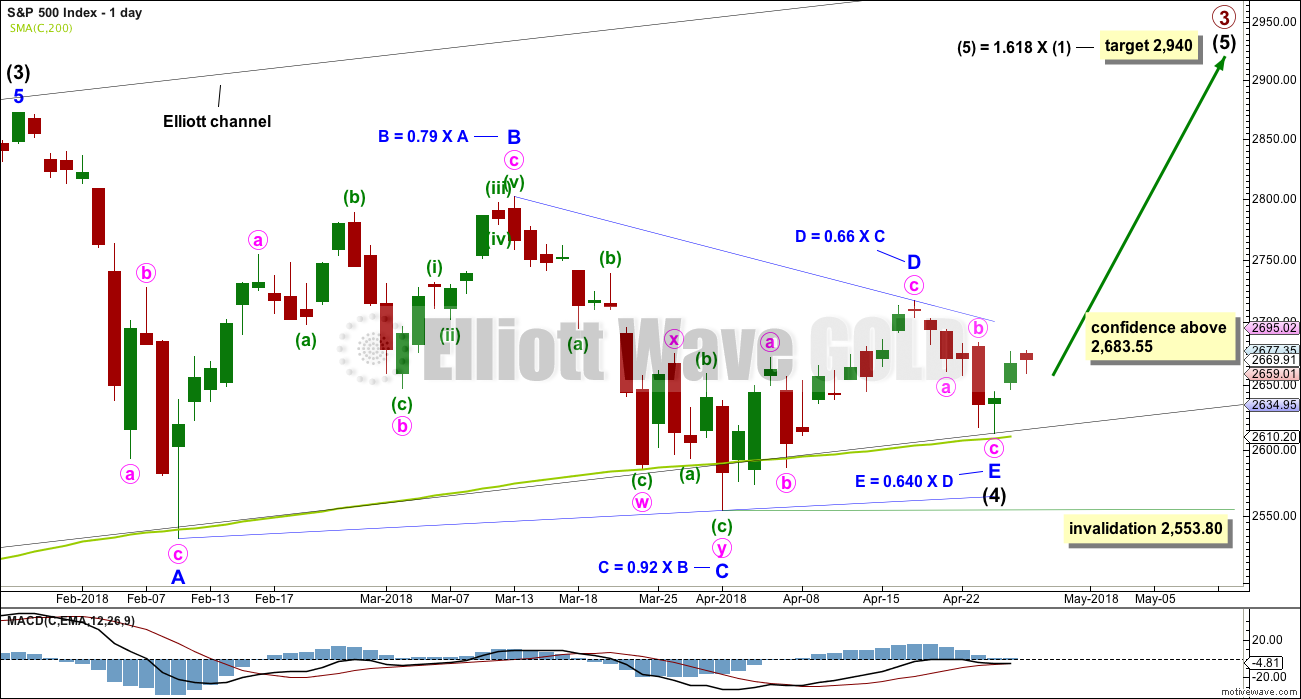
It is possible that intermediate wave (4) is a complete regular contracting triangle, the most common type of triangle. Minor wave E may have found support just above the 200 day moving average and ending reasonably short of the A-C trend line. This is the most common look for E waves of triangles.
Intermediate wave (3) exhibits no Fibonacci ratio to intermediate wave (1). It is more likely then that intermediate wave (5) may exhibit a Fibonacci ratio to either of intermediate waves (1) or (3). The most common Fibonacci ratio would be equality in length with intermediate wave (1), but in this instance that would expect a truncation. The next common Fibonacci ratio is used to calculate a target for intermediate wave (5) to end.
It must still be accepted that the risk with this wave count is that a low may not yet be in place; intermediate wave (4) could continue lower. For this triangle wave count, minor wave E may not move beyond the end of minor wave C below 2,553.80.
ALTERNATE WAVE COUNTS
DAILY CHART – COMBINATION
Click chart to enlarge.
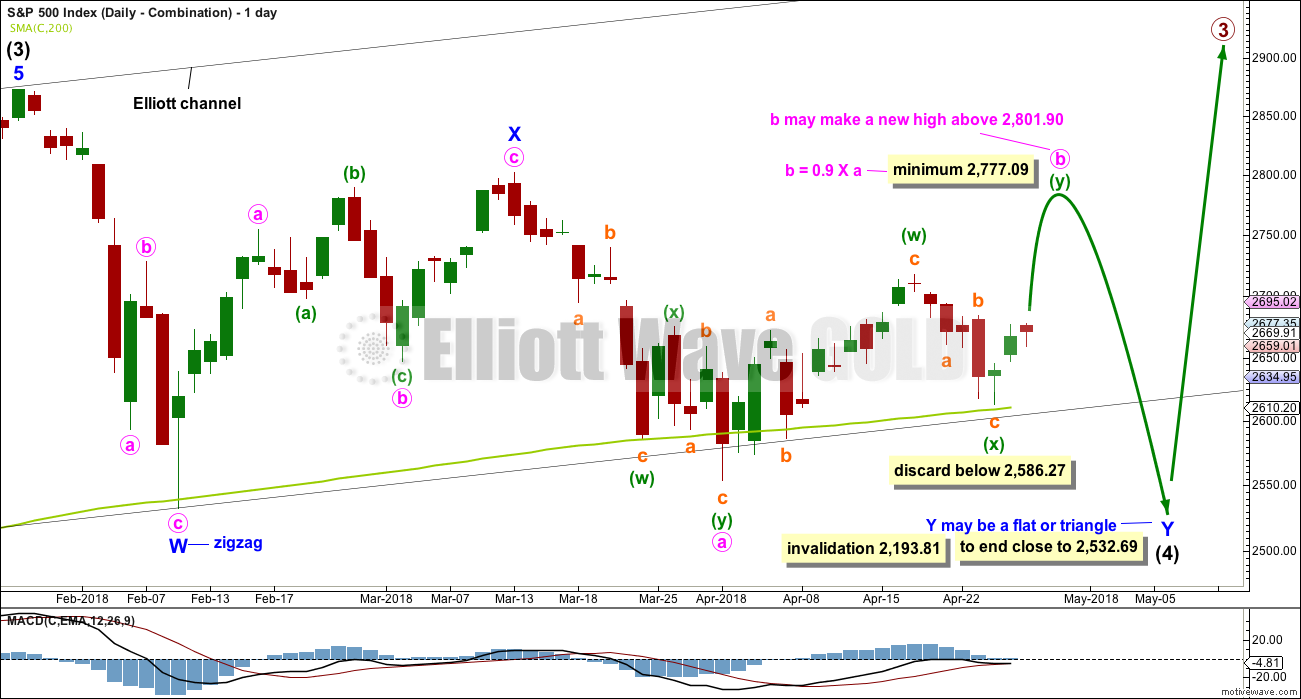
I have charted a triangle a great many times over the years, sometimes even to completion, only to see the structure subsequently invalidated by price. When that has happened, the correction has turned out to be something else, usually a combination. Therefore, it is important to always consider an alternate when a triangle may be unfolding or complete.
Double combinations are very common structures. The first structure in a possible double combination for intermediate wave (4) would be a complete zigzag labelled minor wave W. The double should be joined by a three in the opposite direction labelled minor wave X, which may be a complete zigzag. X waves within combinations are typically very deep; if minor wave X is over at the last high, then it would be a 0.79 length of minor wave W, which is fairly deep giving it a normal look. There is no minimum nor maximum requirement for X waves within combinations.
The second structure in the double would most likely be a flat correction labelled minor wave Y. It may also be a triangle, but in my experience this is very rare, so it will not be expected. The much more common flat for minor wave Y will be charted and expected.
A flat correction would subdivide 3-3-5. Minute wave a must be a three wave structure, most likely a zigzag. It may also be a double zigzag.
Minute wave b must now reach a minimum 0.90 length of minute wave a. Minute wave b may be unfolding as a double zigzag. Within a double zigzag, the second zigzag exists to deepen the correction when the first zigzag did not move price deep enough. Double zigzags normally have a strong slope like single zigzags. To achieve a strong slope the X wave within a double zigzag is normally brief and shallow, most importantly shallow (it rarely moves beyond the start of the first zigzag). A new low now below 2,586.27 should see the idea of a double zigzag for minute wave b discarded.
The purpose of combinations is to take up time and move price sideways. To achieve this purpose the second structure in the double usually ends close to the same level as the first. Minor wave Y would be expected to end about the same level as minor wave W at 2,532.69. This would require a strong overshoot or breach of the 200 day moving average, which looks unlikely but does have precedent in this bull market.
Minute wave b may make a new high above the start of minute wave a if minor wave Y is an expanded flat. There is no maximum length for minute wave b, but there is a convention within Elliott wave that states when minute wave b is longer than twice the length of minute wave a the idea of a flat correction continuing should be discarded based upon a very low probability. That price point would be at 3,050. However, if price makes a new all time high and upwards movement exhibits strength, then this idea would be discarded at that point. Minute wave b should exhibit obvious internal weakness, not strength.
At this stage, the very bullish signal this week from the AD line making a new all time high puts substantial doubt on this wave count. It has very little support from classic technical analysis.
DAILY CHART – FLAT
Click chart to enlarge.
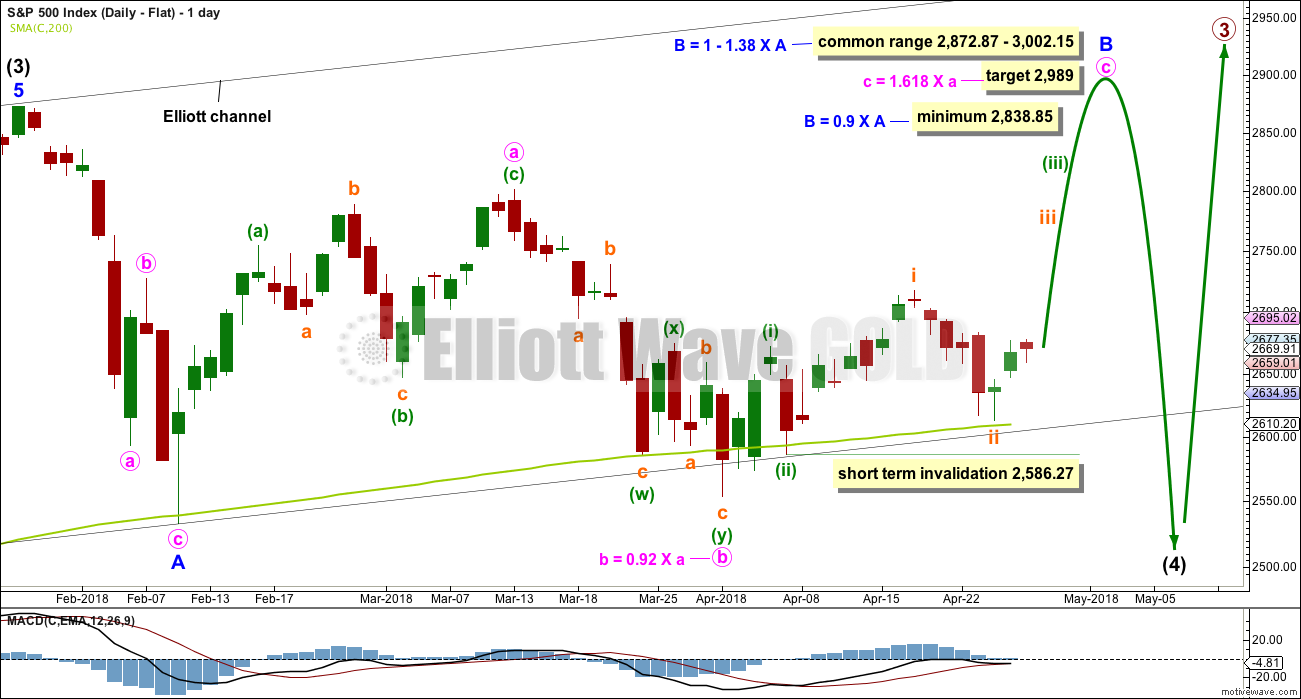
Flat corrections are very common. The most common type of flat is an expanded flat. This would see minor wave B move above the start of minor wave A at 2,872.87.
Within a flat correction, minor wave B must retrace a minimum 0.9 length of minor wave A at 2,838.85. The most common length for minor wave B within a flat correction would be 1 to 1.38 times the length of minor wave A at 2,872.87 to 3,002.15. An expanded flat would see minor wave B 1.05 times the length of minor wave A or longer, at 2,889.89 or above. A target is calculated for minor wave B to end, which would see it end within the common range.
Minor wave B may be a regular flat correction, and within it minute wave a may have been a single zigzag and minute wave b may have been a double zigzag. This has a very good fit.
However, minute wave c must be a five wave structure for this wave count and now the depth and duration of subminuette wave ii looks wrong. The probability that minute wave c upwards is unfolding as an impulse is now reduced. It is possible that it could be a diagonal, but that too has a relatively low probability as the diagonal would need to be expanding to achieve the minimum price target for minor wave B, and expanding ending diagonals are not very common.
At its end minor wave B should exhibit obvious weakness. If price makes a new all time high and exhibits strength, then this wave count should be discarded.
This wave count would require a very substantial breach of the 200 day moving average for the end of intermediate wave (4). This is possible but may be less likely than a smaller breach.
TECHNICAL ANALYSIS
WEEKLY CHART
Click chart to enlarge. Chart courtesy of StockCharts.com.
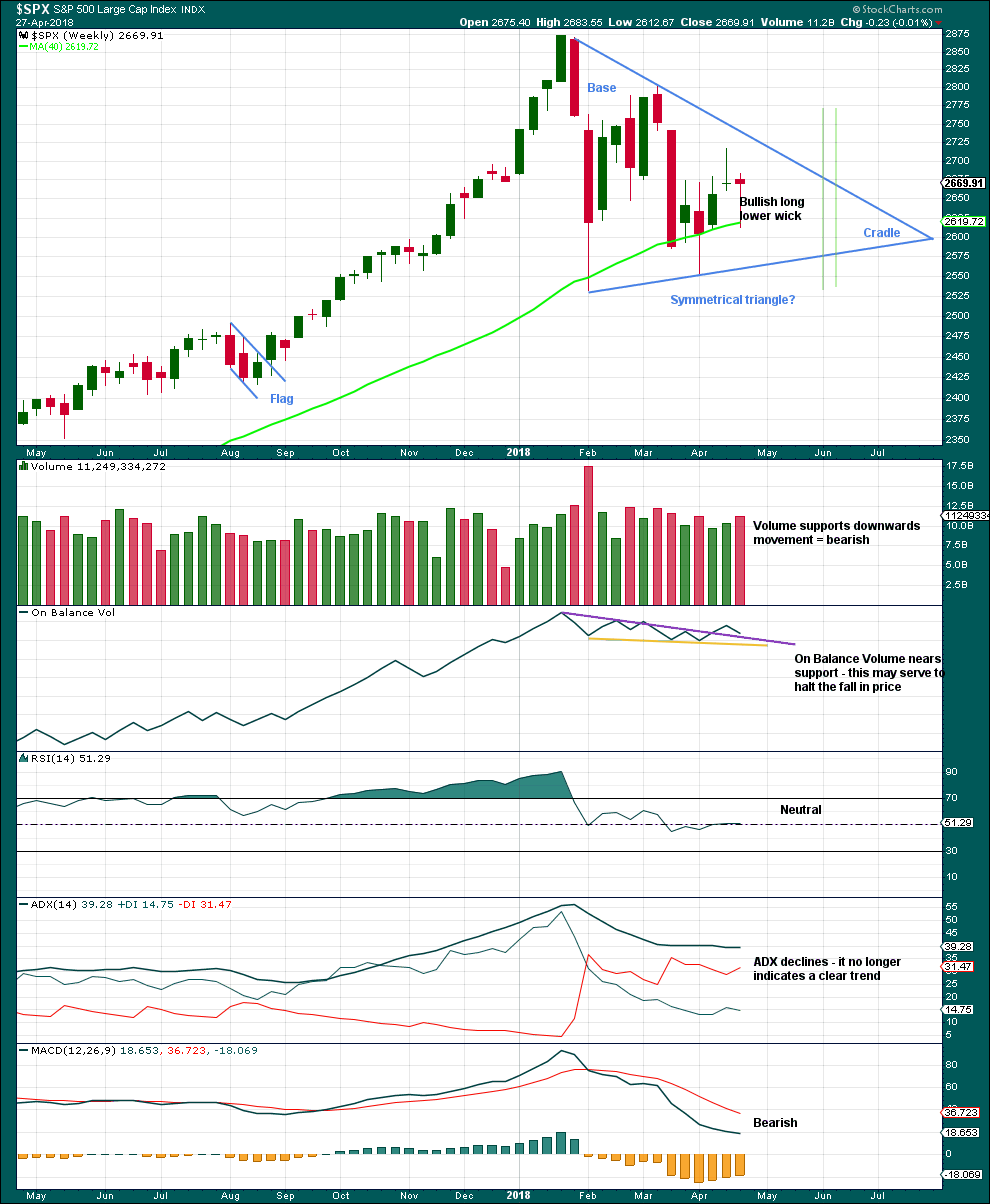
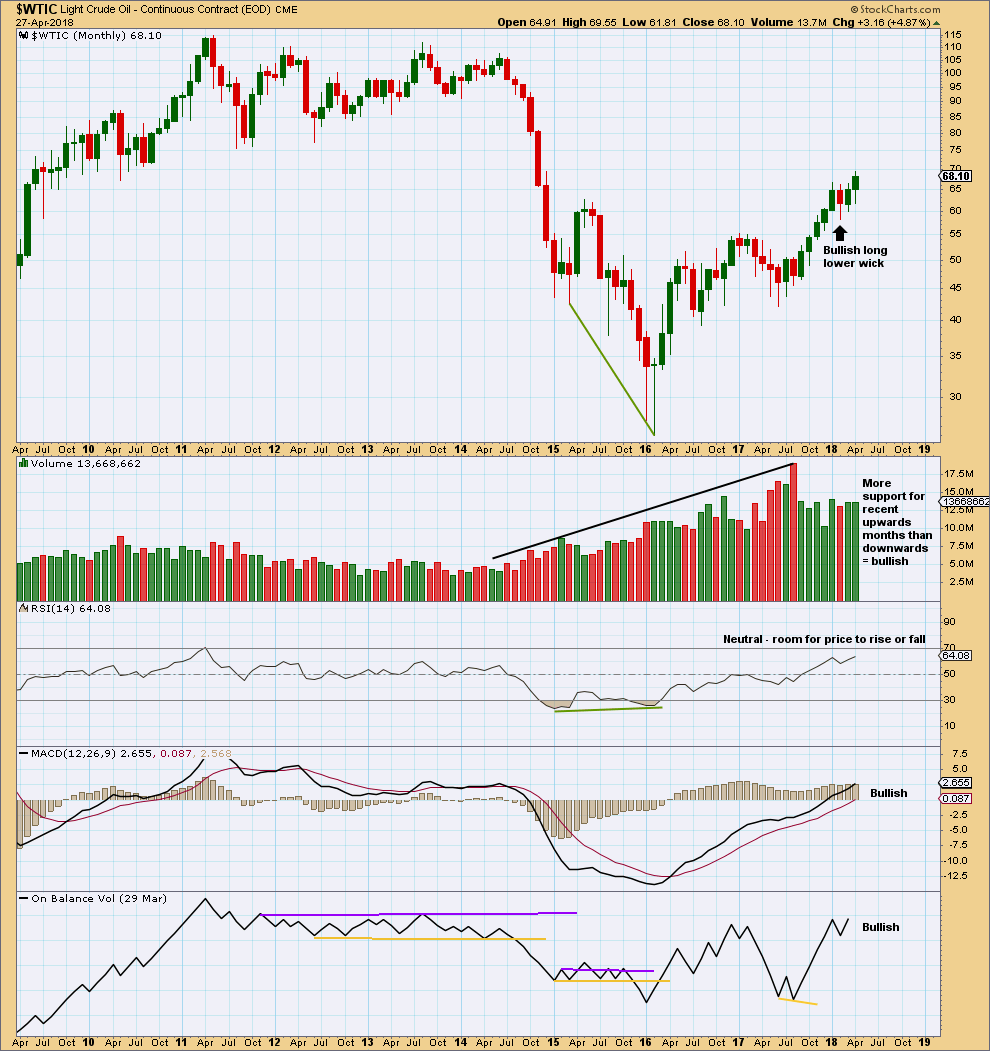
A classic symmetrical triangle pattern may be forming. These are different to Elliott wave triangles. Symmetrical triangles may be either continuation or reversal patterns, while Elliott wave triangles are always continuation patterns and have stricter rules.
The vertical green lines are 73% to 75% of the length of the triangle from cradle to base, where a breakout most commonly occurs.
From Dhalquist and Kirkpatrick on trading triangles:
“The ideal situation for trading triangles is a definite breakout, a high trading range within the triangle, an upward-sloping volume trend during the formation of the triangle, and especially a gap on the breakout.”
For this example, the breakout has not yet happened. There is a high trading range within the triangle, but volume is declining.
The triangle may yet have another 6 – 7 weeks if it breaks out at the green lines.
A bullish long lower wick and support here or very close by for On Balance Volume suggest the pullback this week may be over, despite volume increasing. Looking inside the week at daily volume gives a clearer picture of where greatest support was this week.
DAILY CHART
Click chart to enlarge. Chart courtesy of StockCharts.com.
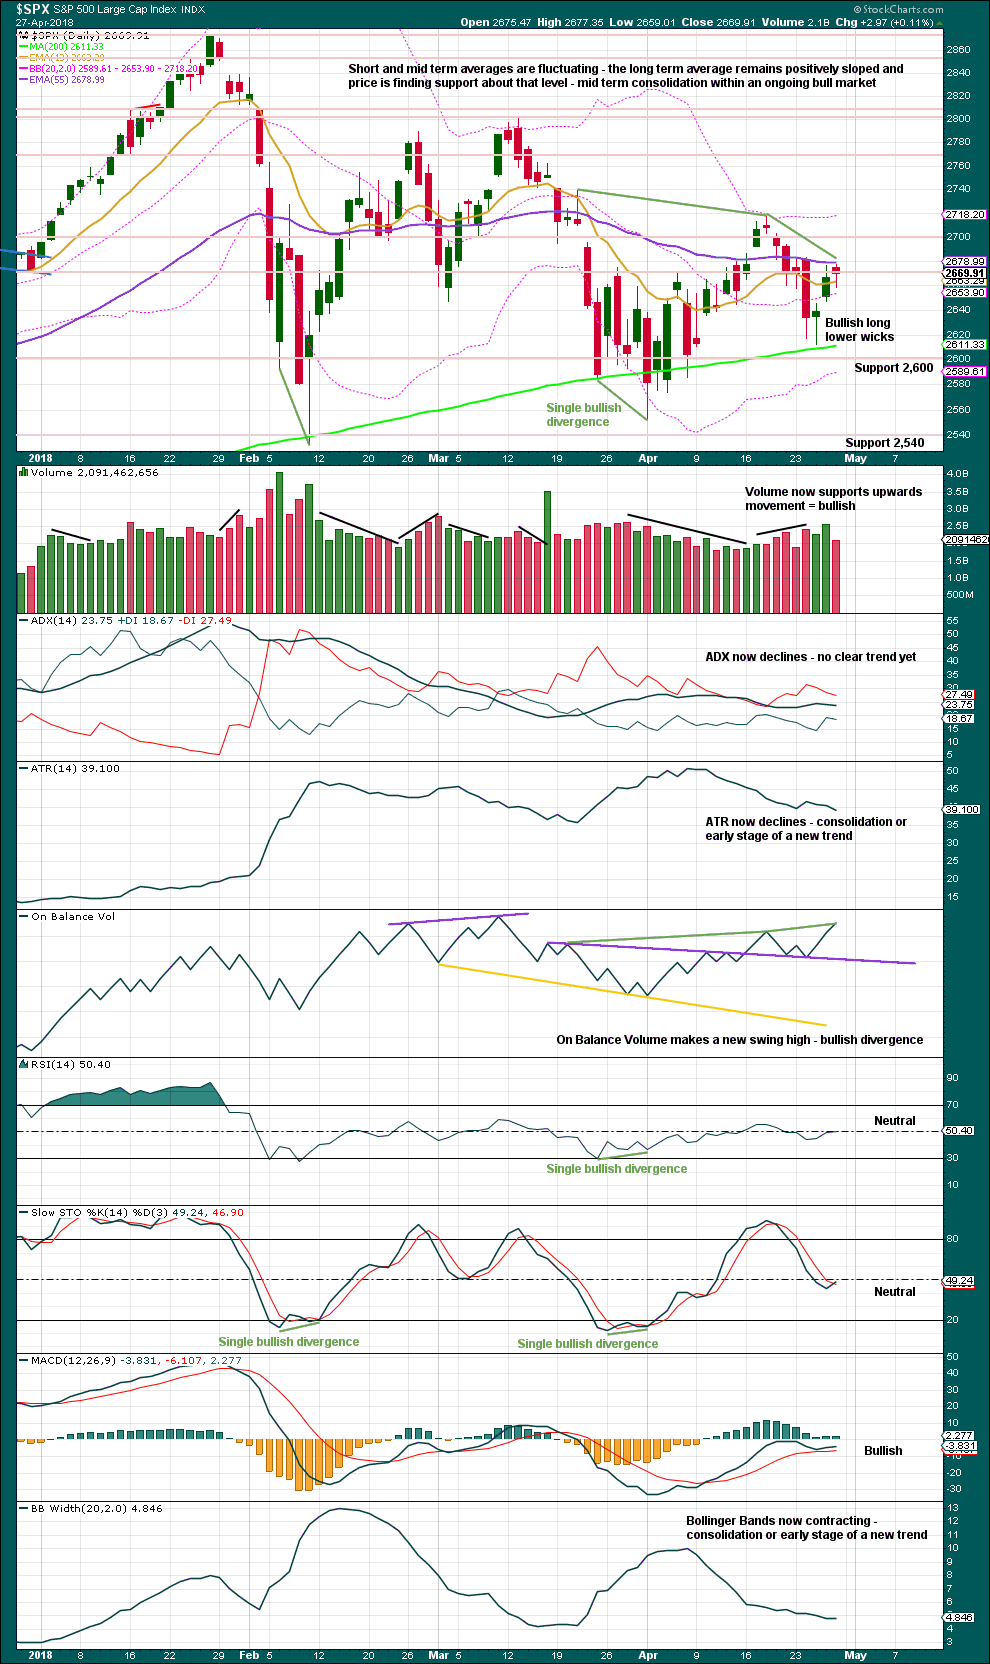
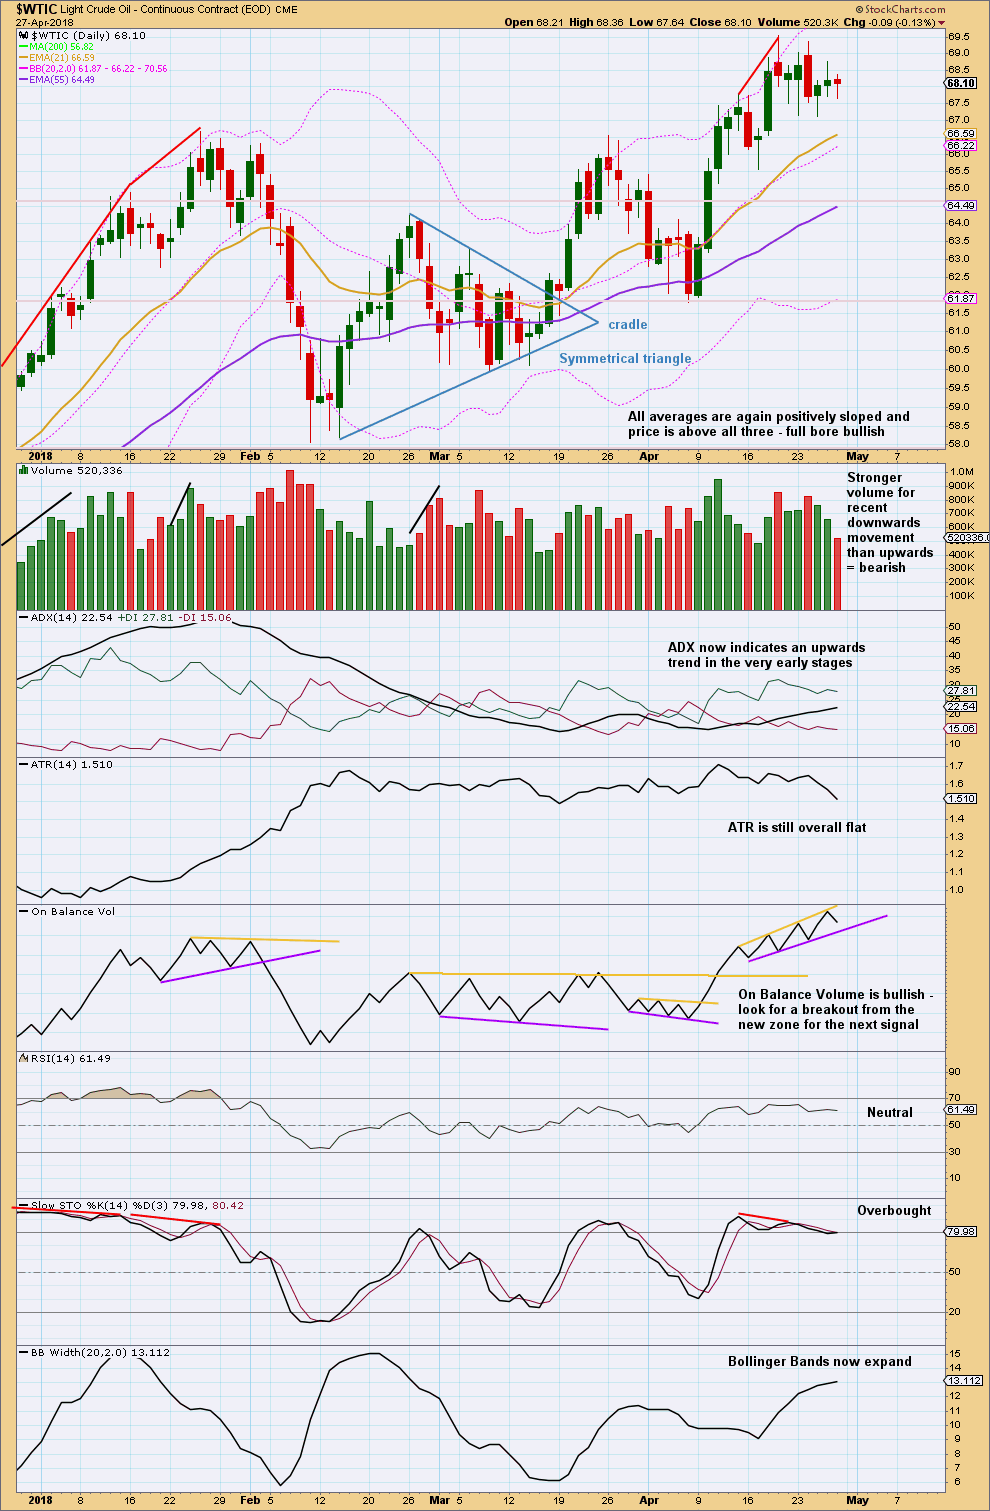
Within the last few days, there is more support for upwards days than downwards.
Friday’s upwards movement did not make a new high for price above the prior swing high of the 18th of April, but On Balance Volume has made a new high. This divergence is bullish as On Balance Volume should be read as a leading indicator. This supports the Elliott wave counts.
VOLATILITY – INVERTED VIX CHART
Click chart to enlarge. Chart courtesy of StockCharts.com.
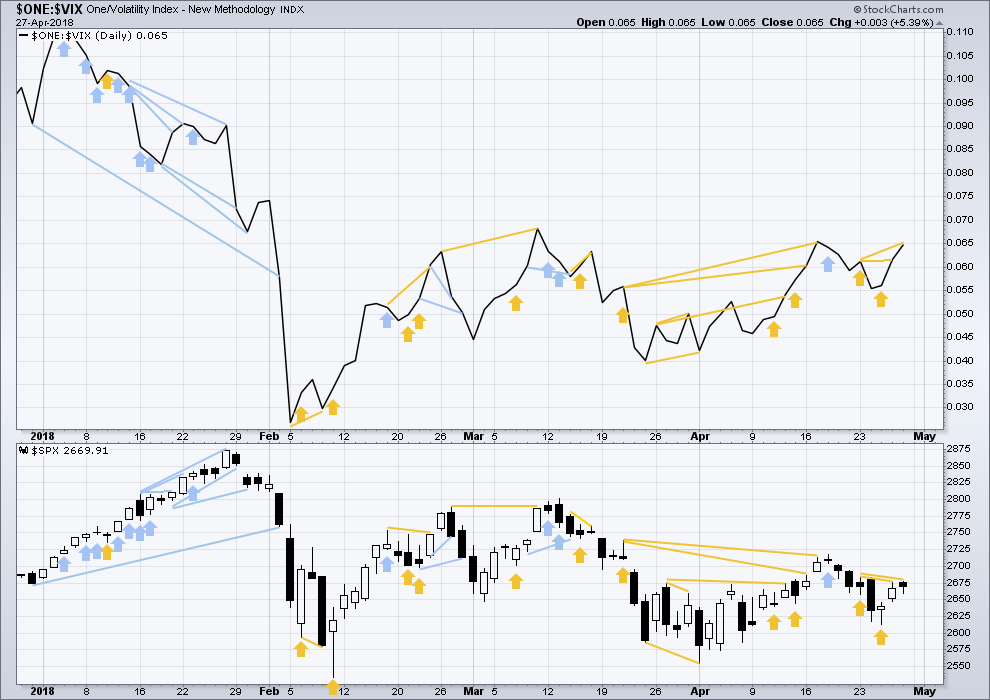
So that colour blind members are included, bearish signals will be noted with blue and bullish signals with yellow.
Normally, volatility should decline as price moves higher and increase as price moves lower. This means that normally inverted VIX should move in the same direction as price.
Inverted VIX has made another small new swing high above the prior high of the 23rd of April, but price has not. If VIX is a leading indicator, then this divergence is bullish.
BREADTH – AD LINE
Click chart to enlarge. Chart courtesy of StockCharts.com.
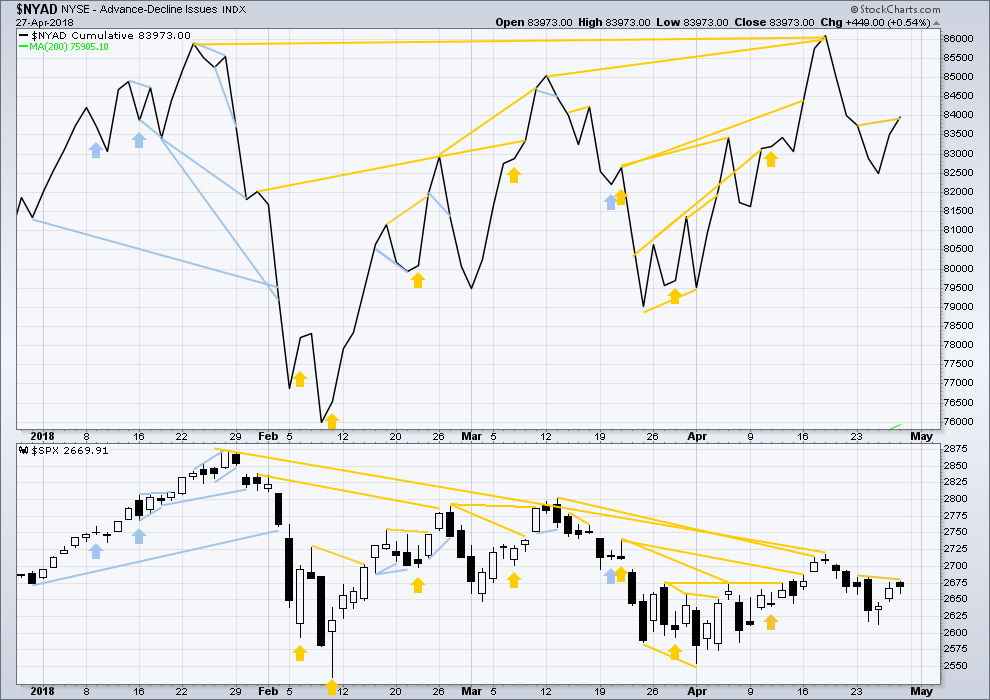
There is normally 4-6 months divergence between price and market breadth prior to a full fledged bear market. This has been so for all major bear markets within the last 90 odd years. With no longer term divergence yet at this point, any decline in price should be expected to be a pullback within an ongoing bull market and not necessarily the start of a bear market. A new all time high from the AD line this week means that any bear market may now be an absolute minimum of 4 months away.
All of small, mid and large caps have made at least slight new lows below their prior swing lows of the 13th of April. This pullback has support from falling market breadth.
Breadth should be read as a leading indicator.
The new all time high from the AD line remains very strongly bullish and supports the main Elliott wave count.This new all time high from the AD line will be given much weight in this analysis. This is the piece of technical evidence on which I am today relying most heavily in expecting a low may be in place here or very soon.
There has been a cluster of bullish signals from the AD line in the last few weeks. This also overall offers good support to the main Elliott wave count.
The AD line has made a new swing high above the prior high of the 23rd of April, but price has not. This divergence is read as bullish as the AD line is read as a leading indicator.
DOW THEORY
The following lows need to be exceeded for Dow Theory to confirm the end of the bull market and a change to a bear market:
DJIA: 23,360.29.
DJT: 9,806.79.
S&P500: 2,532.69.
Nasdaq: 6,630.67.
At this stage, only DJIA has made a new major swing low. DJT also needs to make a new major swing low for Dow Theory to indicate a switch from a bull market to a bear market. For an extended Dow Theory, which includes the S&P500 and Nasdaq, these two markets also need to make new major swing lows.
GOLD
At least two different structures for this consolidation remain valid. The target remains the same.
Summary: For the short term, price may move higher to begin the new week to above 1,332.34 but not above 1,333.84. Alternatively, it may just move sideways for a few days remaining below 1,332.34.
Thereafter, the downwards swing may resume to the target at 1,306.
At its end this downwards swing may offer a very good entry point for a long position prior to an upwards breakout. This downwards swing may be the last swing within the consolidation that began back in January.
Always trade with stops to protect your account. Risk only 1-5% of equity on any one trade.
Grand SuperCycle analysis is here.
Last in-depth historic analysis with monthly and several weekly charts is here, video is here.
There are multiple wave counts at this time at the weekly and monthly chart levels. In order to make this analysis manageable and accessible only two will be published on a daily basis, one bullish and one bearish. This does not mean the other possibilities may not be correct, only that publication of them all each day is too much to digest. At this stage, they do not diverge from the two possibilities below.
BULLISH ELLIOTT WAVE COUNT
FIRST WEEKLY CHART
Click chart to enlarge.
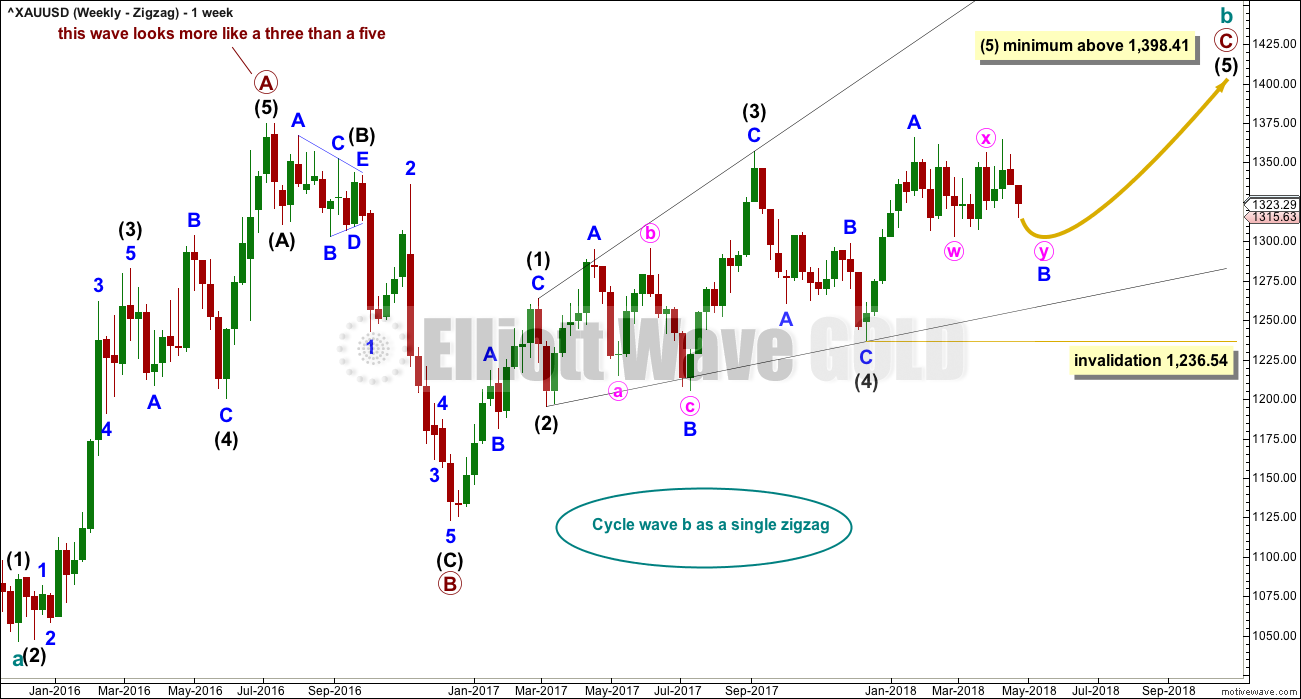
Cycle wave b may be a single zigzag. Zigzags subdivide 5-3-5. Primary wave C must subdivide as a five wave structure and may be either an impulse or an ending diagonal. Overlapping at this stage indicates an ending diagonal.
Within an ending diagonal, all sub-waves must subdivide as zigzags. Intermediate wave (4) must overlap into intermediate wave (1) price territory. This diagonal is expanding: intermediate wave (3) is longer than intermediate wave (1) and intermediate wave (4) is longer than intermediate wave (2). Intermediate wave (5) must be longer than intermediate wave (3), so it must end above 1,398.41 where it would reach equality in length with intermediate wave (3).
Within the final zigzag of intermediate wave (5), minor wave B may not move beyond the start of minor wave A below 1,236.54. However, if it were now to turn out to be relatively deep, it should not get too close to this invalidation point as the lower (2)-(4) trend line should provide strong support. Diagonals normally adhere very well to their trend lines.
Within the diagonal of primary wave C, each sub-wave is extending in price and so may also do so in time. Within each zigzag, minor wave B may exhibit alternation in structure and may show an increased duration.
Within intermediate wave (1), minor wave B was a triangle lasting 11 days. Within intermediate wave (3), minor wave B was a regular flat lasting 60 days. Intermediate wave (5) is expected to be longer in price than intermediate wave (3), and so it may also be longer in duration. Minor wave B within it may last longer than minor wave B within intermediate wave (3).
At this stage, minor wave B may now be a double flat or triangle. These two ideas are separated out in daily charts below.
This first weekly chart sees the upwards wave labelled primary wave A as a five wave structure. It must be acknowledged that this upwards wave looks better as a three than it does as a five. The fifth weekly chart below will consider the possibility that it was a three.
FIRST DAILY CHART – DOUBLE FLAT
Click chart to enlarge.
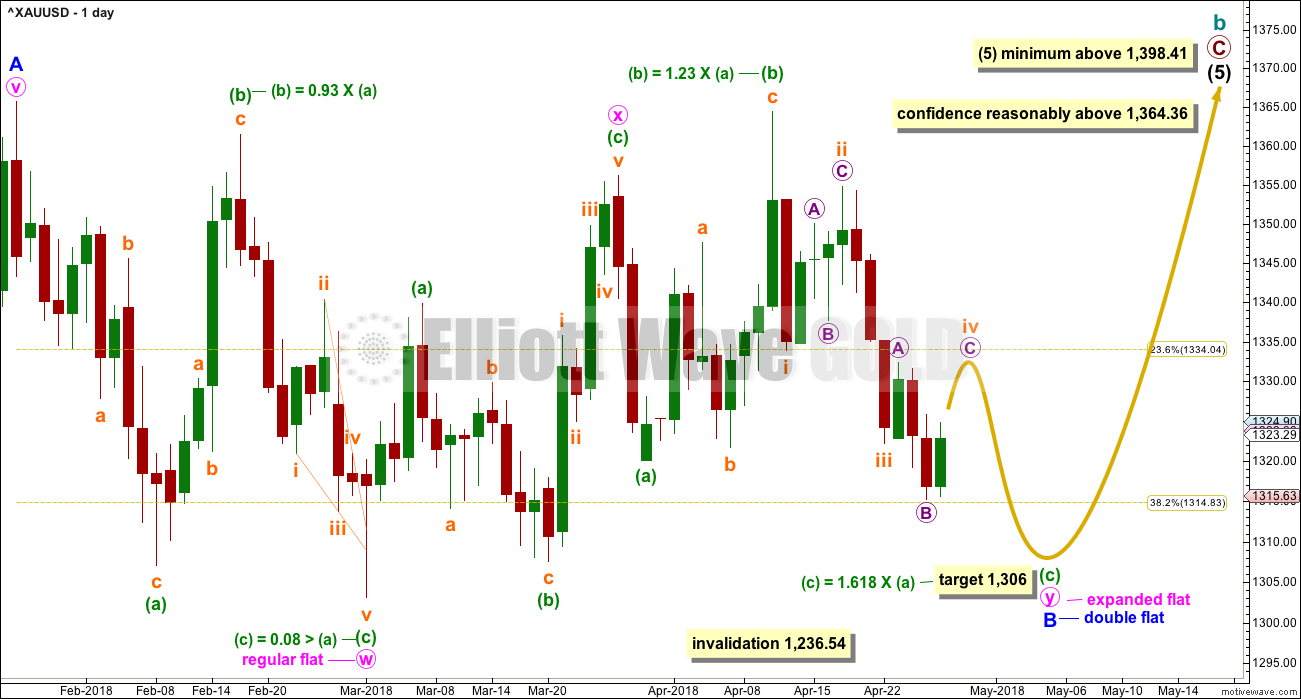
Minor wave B may be a relatively rare double flat correction.
Within this possible double flat, the first flat labelled minute wave w is a regular flat. The second flat labeled minute wave y may be an expanded flat, providing alternation with the first.
Within the expanded flat of minute wave y, minuette wave (b) is within the common range of from 1 to 1.38 times the length of minuette wave (a). The most common Fibonacci ratio for minuette wave (c) is used to calculate a target for it to end. The target is now widened to a small zone with a second calculation at subminuette degree.
The target would see minute wave y end close to the same level as minute wave w; the double flat would have a sideways look and achieve its purpose of taking up time and moving sideways. This target is also within a strong area of support.
Minuette wave (c) may now be completing as a five wave impulse, and within it subminuette wave iv may be continuing further. Subminuette wave ii was a deep 0.69 double zigzag lasting four days. Subminuette wave iv may be continuing as an expanded flat that so far has lasted four days. If it continues for a further one or two days, it may total five or six, which would still have good proportion with subminuette wave ii.
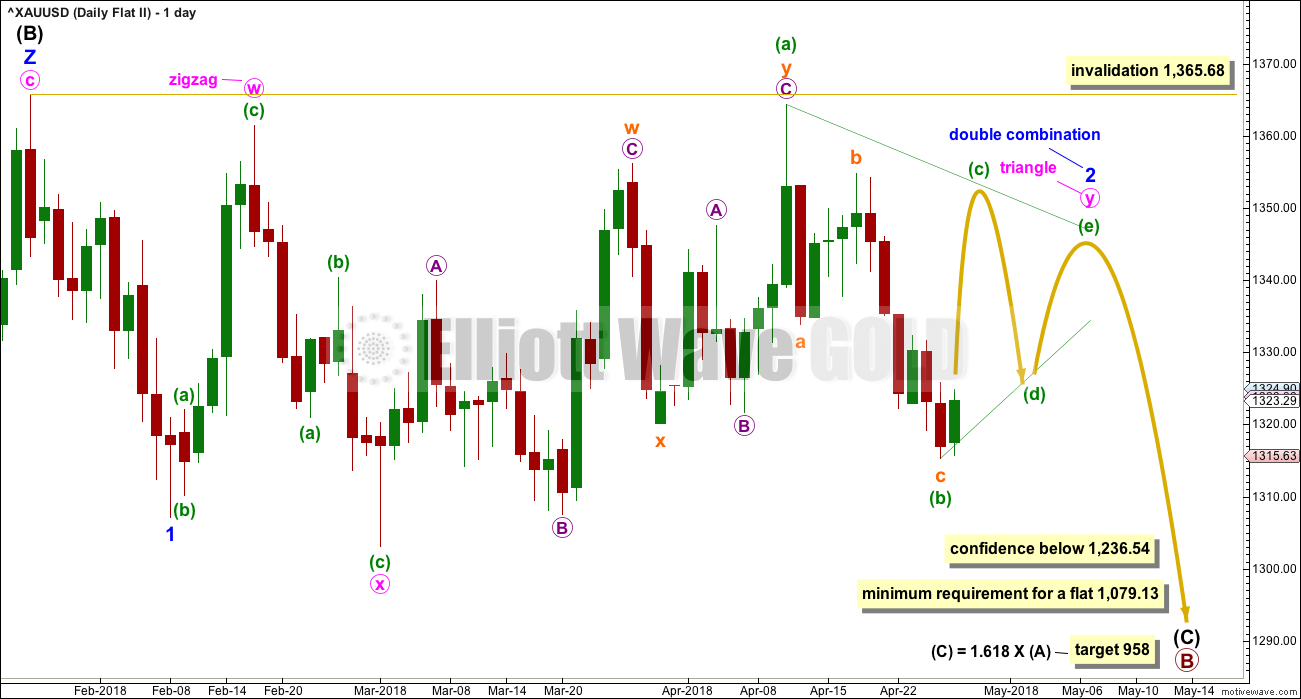
SECOND DAILY CHART – TRIANGLE
Click chart to enlarge.
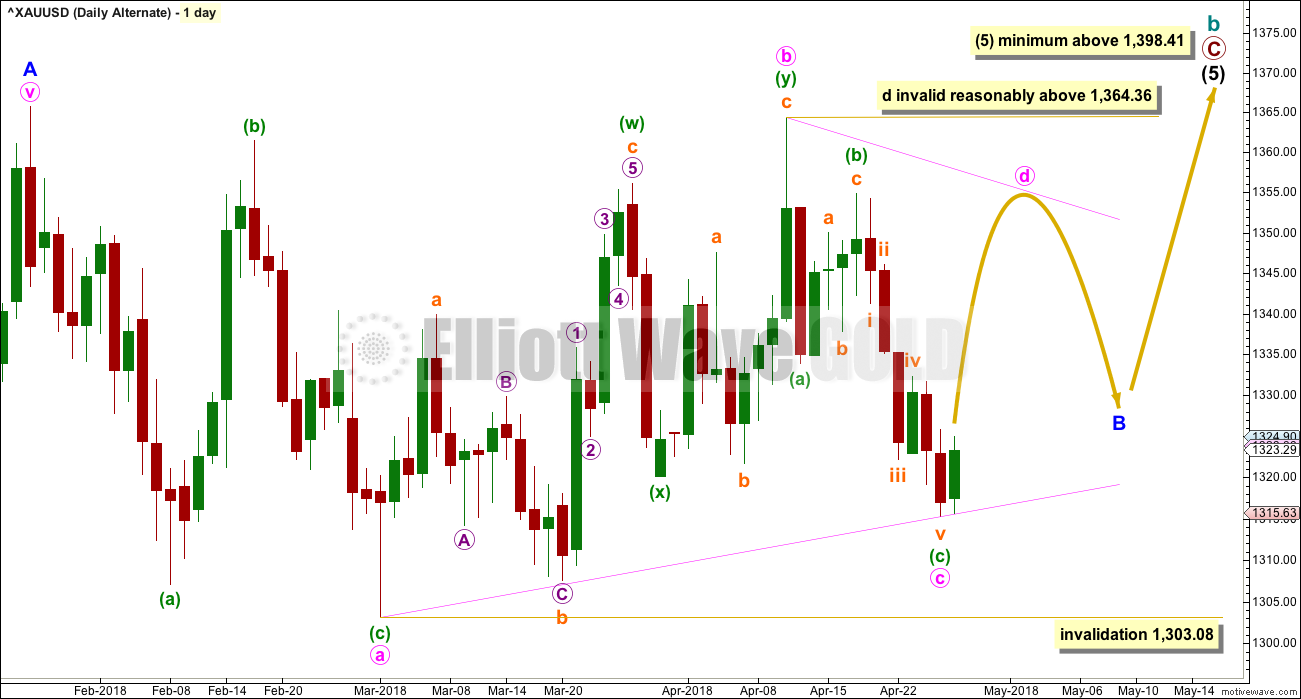
This daily chart is identical to the first daily chart up to the high labelled minor wave A. Thereafter, it looks at a different structure for minor wave B.
A triangle for minor wave B may still be valid. Within a triangle, four of the five sub-waves must sub-divide as zigzags and one sub-wave usually subdivides as a double zigzag; the double zigzag is most commonly wave C of the triangle, but it may be any sub-wave. Here, it may have been minute wave b.
All remaining triangles must be simple A-B-C structures, most likely zigzags.
It is again possible now that minute wave c may have been over. Triangles normally adhere strictly to their trend lines; with downwards movement continuing this week, the lower a-c trend line now has no overshoots nor breaches.
Minute wave c may not move beyond the end of minute wave a below 1,303.08 for both a contracting or barrier triangle. Thereafter, minute wave d may not move above the end of minute wave b at 1,364.36 for a contracting triangle. For a barrier triangle, minute wave d may end about the same level as minute wave b in order for the b-d trend line to look essentially flat.
A final small zigzag downwards for minute wave e would most likely fall short of the a-c trend line.
This wave count still allows for choppy overlapping movement in an ever decreasing range for several weeks. Minor wave B may be as long lasting as a Fibonacci 21 weeks if it is a triangle, as triangles do tend to be very long lasting structures.
BEARISH ELLIOTT WAVE COUNT
FIFTH WEEKLY CHART
Click chart to enlarge.
There were five weekly charts published in the last historic analysis. This fifth weekly chart is the most immediately bearish wave count, so this is published as a bearish possibility.
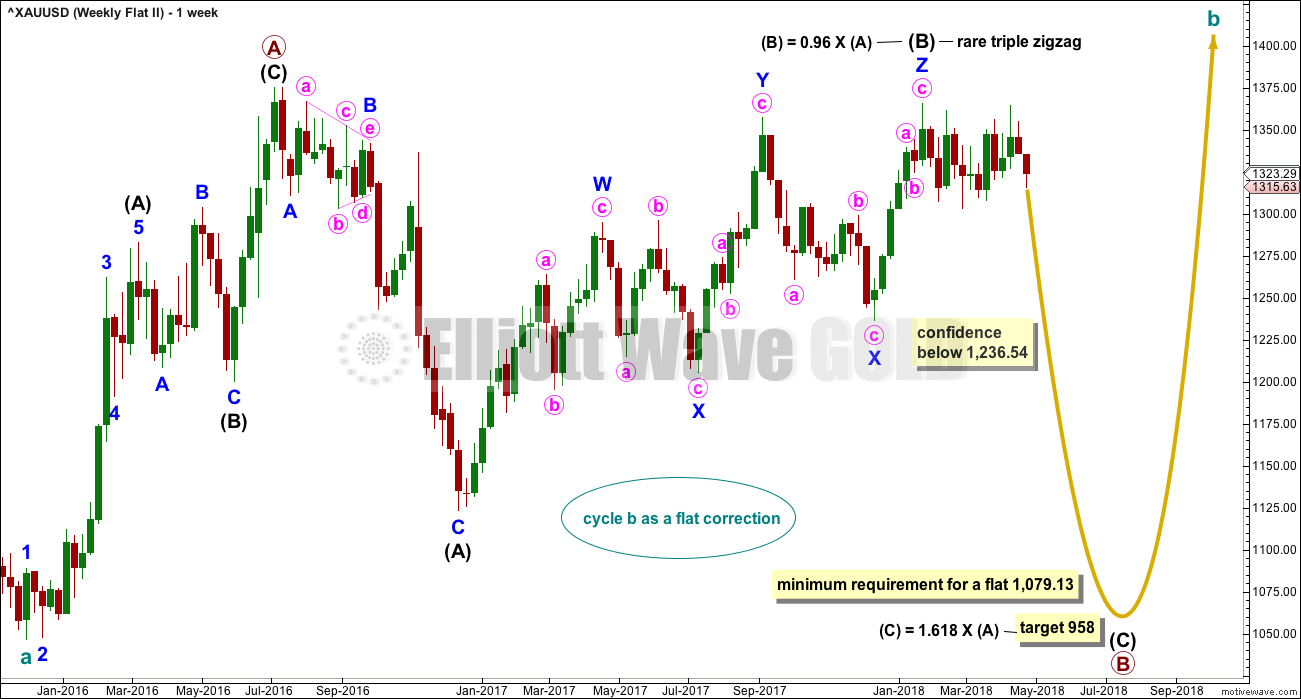
This fifth weekly chart sees cycle wave b as a flat correction.
If cycle wave b is a flat correction, then within it primary wave B must retrace a minimum 0.9 length of primary wave A at 1,079.13 or below. The most common length of B waves within flats is from 1 to 1.38 times the length of the A wave. The target calculated would see primary wave B end within this range.
Primary wave B may be subdividing as a regular flat correction, and within it both intermediate waves (A) and (B) subdivide as three wave structures. Intermediate wave (B) fits as a triple zigzag.
I have only seen two triple zigzags before during my 10 years of daily Elliott wave analysis. If this wave count turns out to be correct, this would be the third. The rarity of this structure is identified on the chart.
FIFTH DAILY CHART
Click chart to enlarge.
Minor wave 1 may have been a relatively brief impulse over at the low of the 8th of February. Thereafter, minor wave 2 may be an incomplete double combination.
The first structure in the double may be a zigzag labelled minute wave w. The double may be joined by a three in the opposite direction, a zigzag labelled minute wave x. The second structure in the double may be an incomplete triangle labelled minute wave y. This structure may yet take some weeks to complete. In my experience a double combination with a triangle for minute wave y is not very common. This reduces the probability of this wave count, but it remains valid.
This wave count is a good solution for this bearish wave count. All subdivisions fit and there are no rare structures so far within intermediate wave (C).
TECHNICAL ANALYSIS
WEEKLY CHART
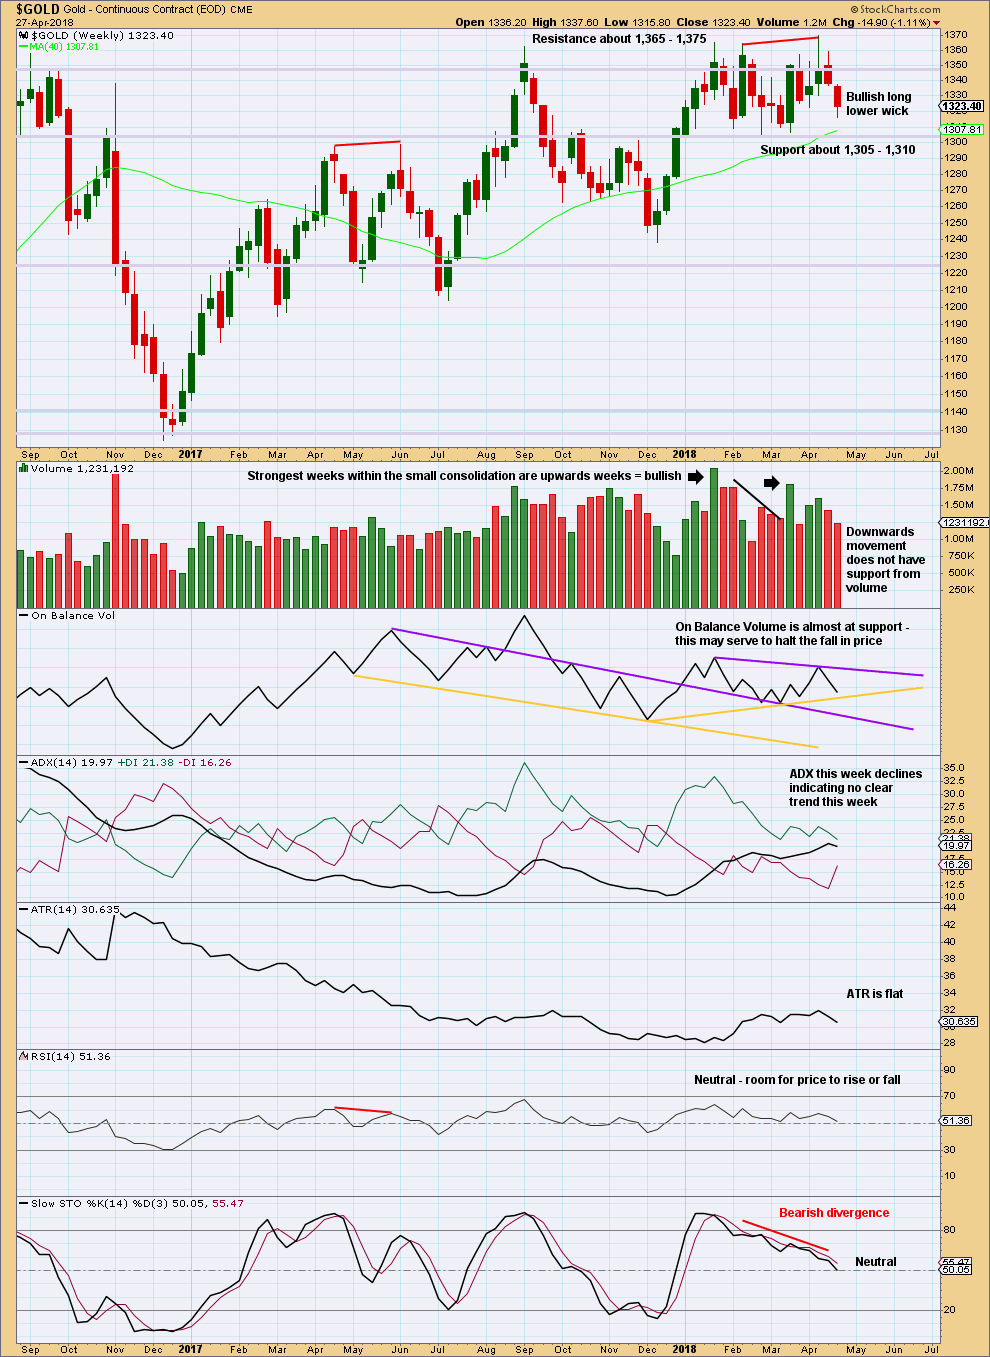
Click chart to enlarge. Chart courtesy of StockCharts.com.
Gold is within a small consolidation with resistance about 1,365 to (final) 1,375 and strong support about 1,310 to 1,305. Volume suggests an upwards breakout is more likely than downwards.
The long lower wick on this last weekly candlestick suggests a bounce for next week, as does support for On Balance Volume.
DAILY CHART
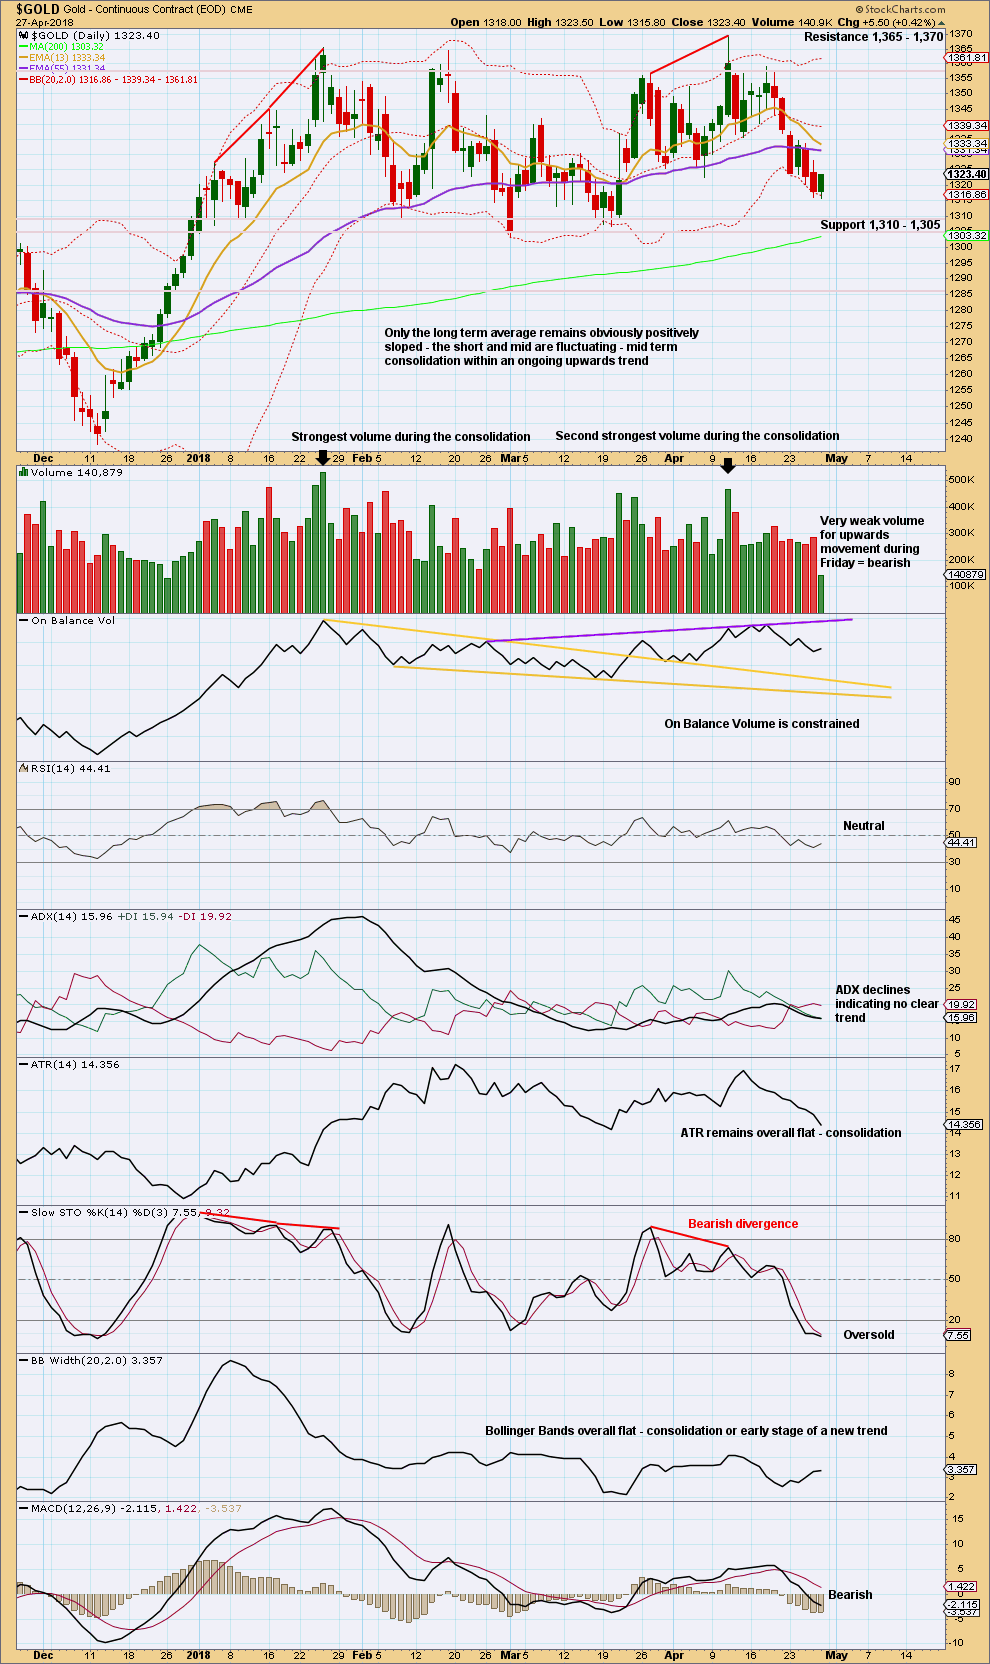
Click chart to enlarge. Chart courtesy of StockCharts.com.
Gold is within a smaller consolidation that began back on about the 3rd of January. This consolidation is delineated by resistance about 1,360 to 1,365 and support about 1,310 to 1,305. It is the upwards days of the 15th of January and the 11th of April that have strongest volume. This strongly suggests an upwards breakout may be more likely than downwards.
Price was at resistance and exhibited divergence with Stochastics at the last high. It still looks reasonable to expect a downwards swing overall to continue here until price finds support and Stochastics reaches oversold. Do not expect this swing to move in a straight line because that is not how price moves within a consolidation.
Very weak volume for Friday suggests upwards movement is weak and may be limited. This offers some support to the Elliott wave count that sees it is a counter trend movement within this downwards swing. Stochastics is oversold, but price is not yet at support.
GDX WEEKLY CHART
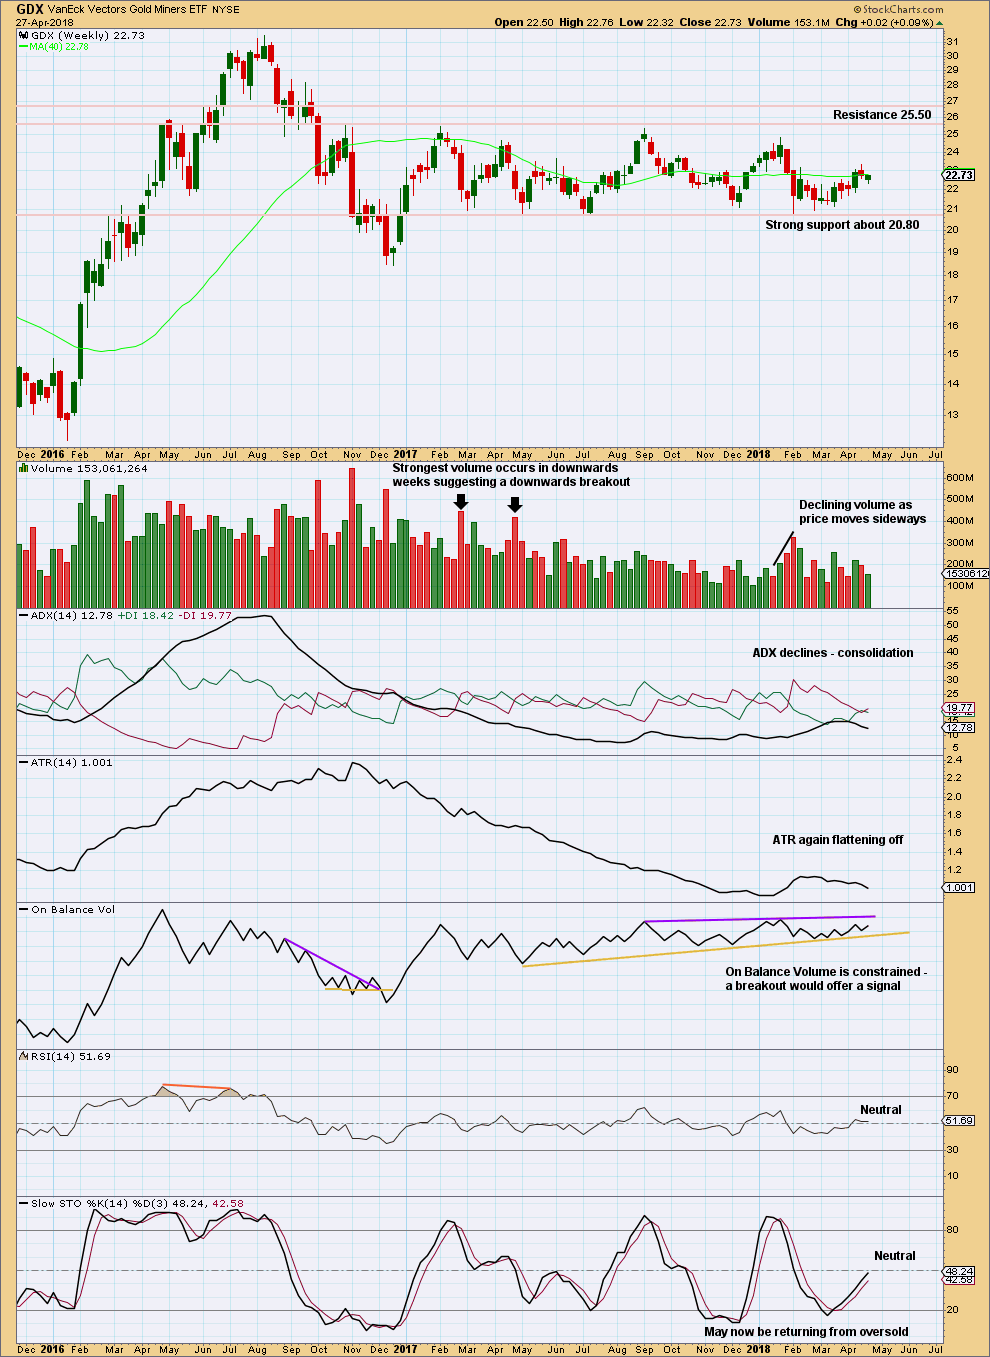
Click chart to enlarge. Chart courtesy of StockCharts.com.
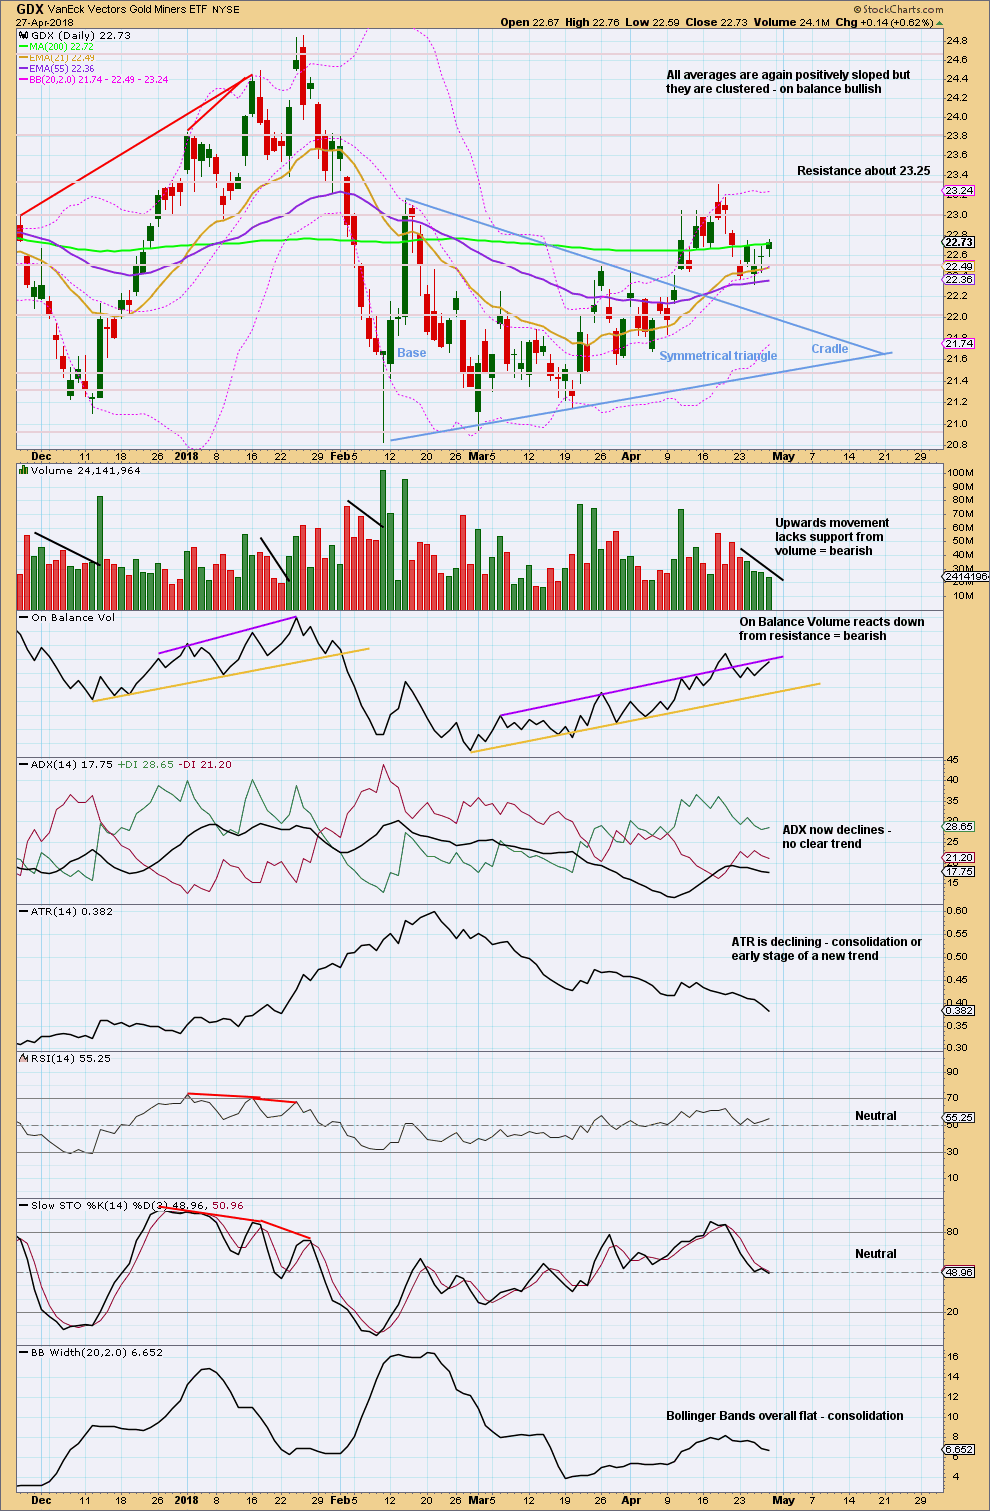
Support about 20.80 has been tested about eight times and so far has held. The more often a support area is tested and holds, the more technical significance it has.
In the first instance, expect this area to continue to provide support. Only a strong downwards day, closing below support and preferably with some increase in volume, would constitute a downwards breakout from the consolidation that GDX has been in for a year now.
Resistance is about 25.50. Only a strong upwards day, closing above resistance and with support from volume, would constitute an upwards breakout.
Overall, a slow upwards swing may be underway. Do not expect it to move in a straight line; it may have downwards weeks within it.
GDX DAILY CHART
Click chart to enlarge. Chart courtesy of StockCharts.com.
On trading triangles from Dhalquist and Kirkpatrick, page 319:
“The ideal situation for trading triangles is a definite breakout, a high trading range within the triangle, an upward-sloping volume trend during the formation of the triangle, and especially a gap on the breakout. These patterns seem to work better with small-cap stocks in a rising market.
Although triangles are plentiful, their patterns suffer from many false and premature breakouts. This requires that a very strict breakout rule be used, either a wide filter or a number of closes outside the breakout zone. It also requires a close protective stop at the breakout level in case the breakout is false. Once these defensive levels have been exceeded, and price is on its way, the trader can relax for a little while because the failure rate after a legitimate breakout is relatively low. Trailing stops should then be placed at each preceding minor reversal.
…. in symmetrical triangles, the best performance comes from late breakouts in the 73% – 75% distance.
Volume on the breakout seems more desirable in symmetrical triangles.”
In this case, the breakout has come 61% of the triangle length from base to cradle. Volume towards the end of the triangle declined. The breakout is accompanied by a gap and has good support from volume.
Pullbacks occur 59% of the time for symmetrical triangles.
Any long positions entered on a pullback may use the breakaway gap as a place for stops just below 22.41. If that gap is closed, then it may be an exhaustion gap and the breakout may have failed. The gap remains open at this time. If this is correctly labelled as a breakaway gap, then price should bounce up from here. If it is closed, then next support may be about the upper trend line of the triangle.
A profit target is calculated by adding the triangle width to the breakout point. This gives a target at 24.61.
This downwards pullback may be a pullback after the triangle breakout; it may be deep and find support about the upper edge of the triangle trend lines. Upwards movement of the last three days is very weak, so it looks reasonable to expect GDX to move lower next week.
US OIL
A small inside week closing as a doji saw only sideways movement from Oil. This leaves the analysis the same.
Summary: Classic technical analysis remains overly bullish. There is an upwards trend in place. Pullbacks are an opportunity to join the trend.
At this stage, three daily Elliott wave charts all conclude there may be a deep pullback here, but this does not have good support from classic technical analysis.
Always practice good risk management as the most important aspect of trading. Always trade with stops and invest only 1-5% of equity on any one trade. Failure to manage risk is the most common mistake new traders make.
MAIN WAVE COUNT
MONTHLY CHART
Click chart to enlarge.
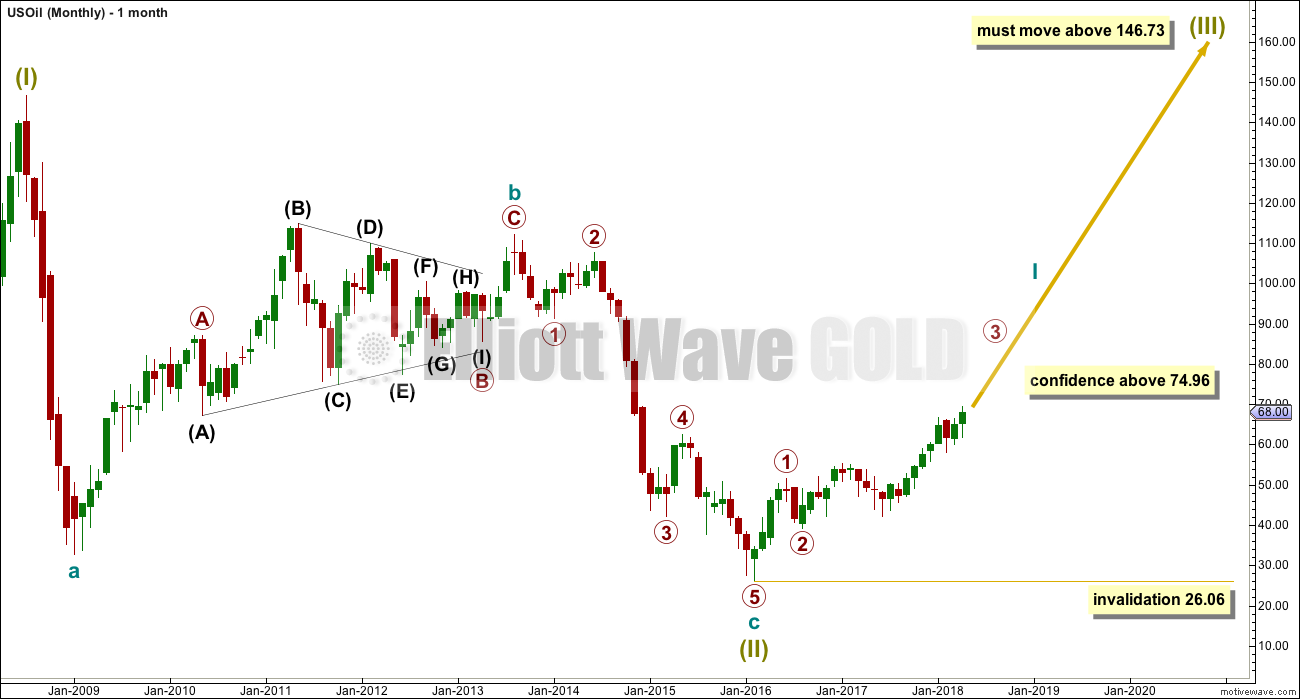
It is possible that the bear market for Oil is over and a new bull market is in the very early stages.
A huge zigzag down to the last low may be complete and is labelled here Super Cycle wave (II).
Cycle wave b must be seen as complete in August 2013 for this wave count to work. It cannot be seen as complete at the prior major swing high in May 2011.
Cycle wave b is seen as a zigzag, and within it primary wave B is seen as a running contracting triangle. These are fairly common structures, although nine wave triangles are uncommon. All subdivisions fit.
Primary wave C moves beyond the end of primary wave A, so it avoids a truncation. But it does not have to move above the price territory of primary wave B to avoid a truncation, which is an important distinction.
If cycle wave b begins there, then cycle wave c may be seen as a complete five wave impulse.
Super Cycle wave (III) must move beyond the end of Super Cycle wave (I). It must move far enough above that point to allow room for a subsequent Super Cycle wave (IV) to unfold and remain above Super Cycle wave (I) price territory.
Cycle wave I may be incomplete. It may be ready to move through the middle and end of its third wave at primary degree, which may be the strongest upwards portion of cycle wave I; a strong increase in momentum and range may be ahead.
When cycle wave I is complete, then cycle wave II may be a deep correction that may not move beyond the start of cycle wave I below 26.06.
Data from FXCM for USOil does not go back to the beginning of Super Cycle wave (I). Without an accurate known length of Super Cycle wave (I) a target cannot be calculated for Super Cycle wave (III) to end using Fibonacci ratios. The target for Super Cycle wave (III) may be calculated when cycle waves I, II, III and IV within it are complete. That cannot be done for many years.
WEEKLY CHART
Click chart to enlarge.
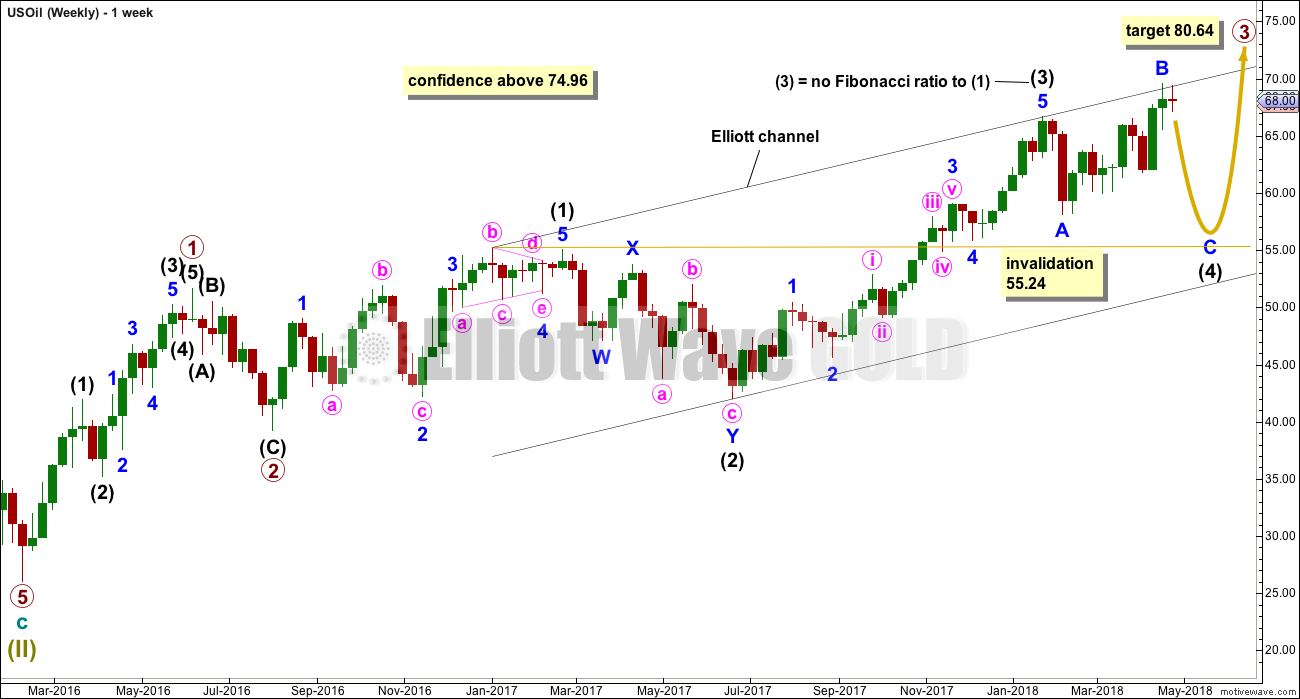
If a new bull market is in the very early stages for Oil, then it may have begun with two overlapping first and second waves at primary then at intermediate degree.
Primary wave 3 may only subdivide as an impulse, and within it intermediate wave (3) may be complete.
Intermediate wave (4) may not move into intermediate wave (1) price territory below 55.24. Intermediate wave (4) would most likely be incomplete. It may continue further sideways or lower.
Intermediate wave (2) is labelled as a double zigzag. To exhibit alternation intermediate wave (4) may most likely be a flat, combination or triangle. Intermediate wave (2) lasted 17 weeks. For good proportion and the right look, intermediate wave (4) may last a Fibonacci 13 or even 21 weeks in total. So far it has lasted 13 weeks.
Intermediate wave (4) would have to be over at the low labelled minor wave A to label it as complete, and would have lasted only two weeks. That idea has gross disproportion between intermediate waves (2) and (4), so it looks highly unlikely. What looks much more likely is that intermediate wave (4) should be continuing further.
Within all of a flat, triangle or combination, minor wave B (or X) may make a new high above the start of minor wave A (or W). The new high for minor wave B is entirely acceptable as part of intermediate wave (4).
Commodities typically exhibit swift and strong fifth waves within their impulses, and this tendency is particularly common for third wave impulses. Intermediate wave (5) may be a swift strong upwards wave when it arrives.
DAILY CHART
Click chart to enlarge.
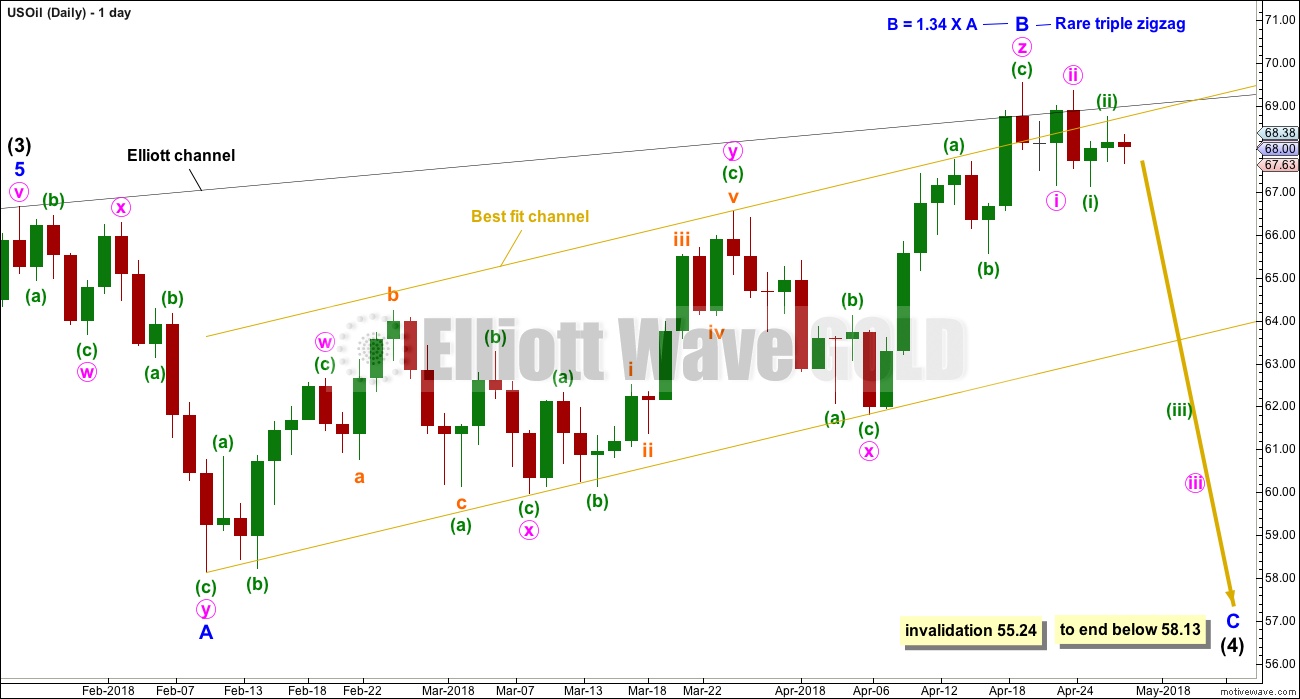
Minor wave B may have continued higher this week as a triple zigzag. If upwards movement is a completed corrective structure, this is how it fits best. However, I have only ever seen two or three triple zigzags before in my now 10 years of daily Elliott wave analysis on one to four markets. If this wave count is correct, this would be the third or fourth. These are in my experience very rare structures.
Intermediate wave (4) may still be any one of a flat, combination or triangle. Of these three options a flat would be the most common and so most likely. If intermediate wave (4) is a flat, then minor wave C within it should make a new low below the end of minor wave A at 58.13 to avoid a truncation and a very rare running flat.
Intermediate wave (4) may also be a combination labelled minor waves W-X-Y. However, this idea would require the first wave down (labelled minor wave A on the chart) to be seen as a single zigzag, not a double. This downwards wave does fit better as a double zigzag rather than a single. The double would be now joined by a three in the opposite direction labelled minor wave X. A flat correction would now be most likely to unfold sideways for minor wave Y.
Intermediate wave (4) may be a triangle with minor waves A and B complete. Minor wave C should end above the end of minor wave A at 58.13 for a triangle, and thereafter minor waves D and E should continue sideways in an ever decreasing range. A triangle may take several more weeks to unfold sideways.
DAILY CHART II
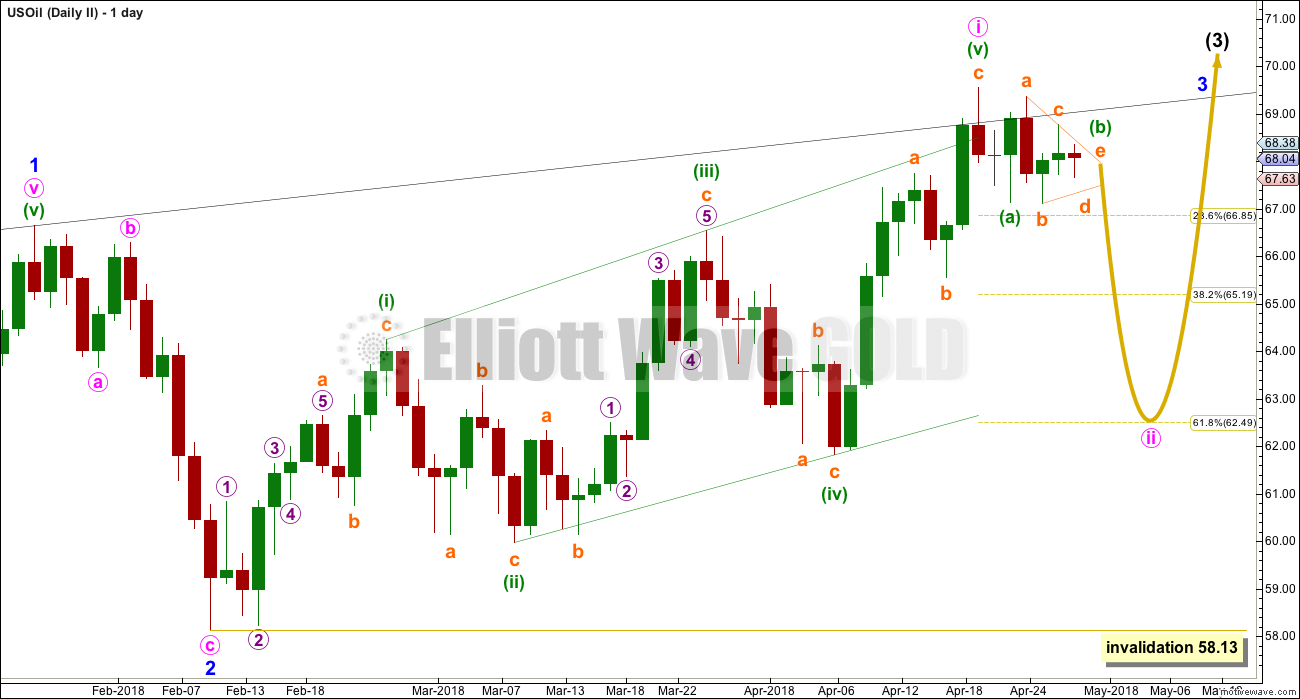
Click chart to enlarge.
By moving the degree of labelling within intermediate wave (3) all down one degree, it is possible that it is incomplete and so far only minor waves 1 and 2 may be complete.
Minor wave 3 may have begun with a leading expanding diagonal for minute wave i. The subdivisions of this upwards movement are almost the same as the first daily chart, but now the problem of a very rare triple zigzag is resolved. Leading diagonals are not rare structures.
Second wave corrections following leading diagonals in first wave positions are commonly very deep; they may be deeper than the 0.618 Fibonacci ratio of the first wave diagonal. Minute wave ii may be expected to reach at least 62.49 and may well be deeper, if this wave count is correct.
Minute wave ii may be unfolding as a zigzag, and within it minuette wave (b) may be a running contracting triangle. This fits sideways movement best so far for this week.
Minute wave ii may not move beyond the start of minute wave i below 58.13.
When minute wave ii is complete, then this wave count would expect a third wave up to unfold at four degrees. The expectation would be for explosive upwards movement.
ALTERNATE WAVE COUNT
MONTHLY CHART
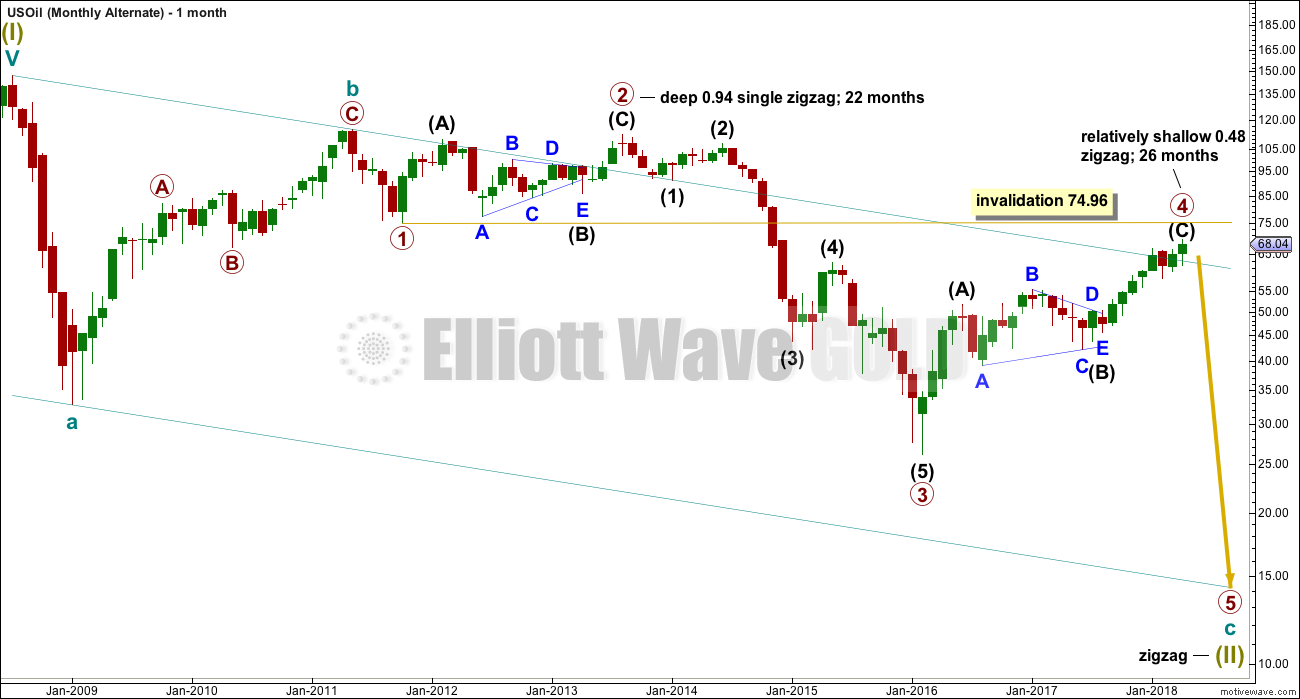
Click chart to enlarge.
Within the bear market, cycle wave b is seen as ending in May 2011. Thereafter, a five wave structure downwards for cycle wave c begins.
Primary wave 1 is a short impulse lasting five months. Primary wave 2 is a very deep 0.94 zigzag lasting 22 months. Primary wave 3 is a complete impulse with no Fibonacci ratio to primary wave 1. It lasted 30 months.
There is alternation in depth with primary wave 2 very deep and primary wave 4 relatively shallow. There is inadequate alternation in structure, both are zigzags. So far primary wave 4 has lasted 26 months. At this stage, there isstill reasonable proportion between primary waves 2 and 4.
Primary wave 4 may not move into primary wave 1 price territory above 74.96.
The wider Elliott channel (teal) about this whole movement may offer support to primary wave 5.
WEEKLY CHART
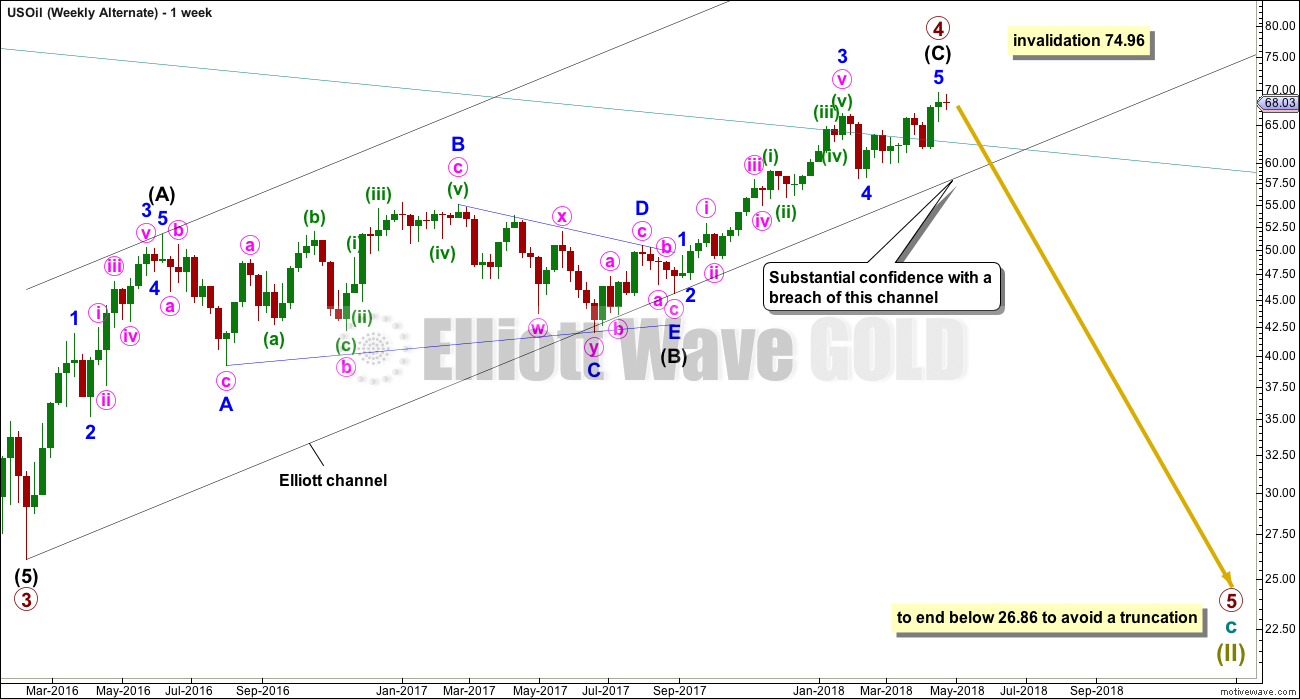
Click chart to enlarge.
This wave count now expects a huge trend change for a new wave down for primary wave 5, which may last about a year or so. Primary wave 5 would be likely to make at least a slight new low below 26.86 to move below the end of primary wave 3 and avoid a truncation.
An Elliott channel is added to this possible zigzag for primary wave 4. A breach of the lower edge of this channel would provide a very strong indication that primary wave 4 should be over and primary wave 5 should be underway. Look out for some support on the way down, perhaps a short term bounce about the lower edge of the channel.
DAILY CHART
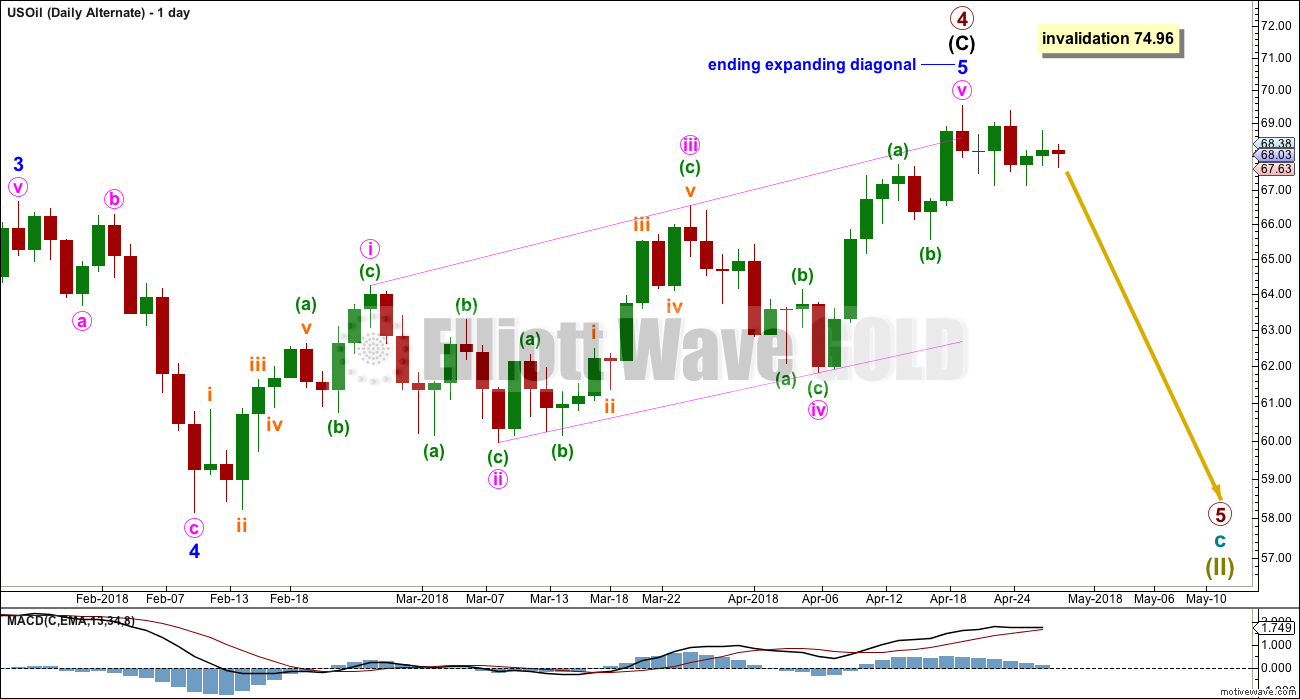
Click chart to enlarge.
Minor wave 5 may now be a complete ending expanding diagonal, ending with an overshoot of the i-iii trend line.
A reversal would now be expected. A new low below 55.24 is required for confidence in this wave count. At that stage, the main wave count would be invalidated.
For US Oil, it is new trends that very often start out with time consuming and deep second wave corrections. There is an excellent example of this tendency on the alternate monthly chart above for primary wave 2.
This wave cound does not at this point have support from classic technical analysis on the monthly chart.
TECHNICAL ANALYSIS
MONTHLY CHART
Click chart to enlarge. Chart courtesy of StockCharts.com.
The strongest recent monthly volume is for the downwards month of August 2017. This is bearish.
For the last three months all now complete, the volume profile is bullish.
This chart is overwhelmingly bullish. It supports the main Elliott wave count.
Strong volume for the month of June 2017 may have been a selling climax. This is typical behaviour of commodities.
DAILY CHART
Click chart to enlarge. Chart courtesy of StockCharts.com.
The last seven sessions are completing a small consolidation. This may be a flag pattern that would expect an upwards breakout, which is bullish. But during the last seven sessions it is two downwards days that have strongest volume, suggesting a downwards breakout may be more likely than upwards. This offers a little support now to the Elliott wave counts.
If On Balance Volume breaks below support next week, that would offer more support to the Elliott wave counts.
Thank you Lara as always.
Great learning experience. The new count for gold fits well with current action with intermediate still being the same.
I honestly thought the S&P correction would have been more, but your count has been uncannily correct.
Thanks Dave.
Yes, that S&P count is working very well so far. Which actually makes me a bit nervous. When it’s that good… I’m worried that it’ll turn out to be invalidated.
I stop and spend some time thinking “what if?” What if I’ve gotten it wrong? What else could be happening? If price moves strongly in the opposite direction, what would a wave count for that look like?
If I can find a good looking alternate I’ll publish it. Especially if it has support from classic TA.
But if On Balance Volume makes a new all time high, then my confidence in new all time highs from price for the S&P would be over 90%.
While Lara’s Weekly is a once a week publication, I will from time to time publish updated charts or make comments here if / when I see price is at a critical point.
If there’s nothing to update during the week then I won’t.
Updated S&P500 chart today:
I think this may also have a low in place for a second wave correction today.
Looking now for an increase in upwards momentum, an upwards breakout from the triangle trend lines.
Updated S&P500 TA chart today:
Support about the 200 day moving average. Today’s candlestick looks pretty bullish.
Watch On Balance Volume carefully as this week continues. If it makes a new all time high that would be a very bullish signal, take that very seriously, give it weight. Today it’s very close!
There are also bullish signals today from VIX and the AD line.
Updated daily chart for Gold today:
I’ve changed how I’m labelling the structure of minor wave B, but it makes no difference to the wave count at intermediate degree. I think it may have been a more simple single regular flat correction. It fits very neatly into it’s channel, today’s low is almost right at support there. The ratio of equality between minute waves a and c is extremely close.
Note the target at 1,431.
Risk remains at 1,236.54. But if minor B moves a bit lower it shouldn’t be by much.
Remember my two Golden Risk Management Rules:
1. Always trade with stops.
2. Risk only 1-5% of equity on any one trade.
Today stops may be set just below the low for this last session.
Updated TA chart for Gold today:
Bullish signals today from:
– two long lower candlestick wicks
– price closing in strong support
– Stochastics oversold and now exhibits clearer divergence with price
This is contradicted by bearish ADX, MACD and for most recent days (the last two weeks) a bearish short term volume profile.
Overall this chart is bullish and I think it is very likely a low is in place today for Gold. But I’m not always right, and this chart does have some bearishness. That is why risk management is vital to protect your accounts when I am wrong.
it would be helpful wouldn’t it if I posted an updated chart!
This article indicates extreme bullish sentiment in fund managers– Isn’t this exactly what we (as elliotticians) should expect before a pullback?
https://www.reuters.com/article/us-oil-prices-kemp/oil-market-locked-almost-all-funds-expect-further-price-rises-kemp-idUSKBN1H31V8
Yes, that’s the contrarian Elliott wave view.
yours trading ideas is very beneficial for me .
gold downward swing approaches to the target at 1306.according yours experience can i place order upward swing and kindly guid me about best entry point for long position.
thank you
RAZA
At appropriate points I’ll post comments and updated charts here in comments. I’ll be doing that above for Gold today.
Lara
Always find your weekly summaries informative and instructive.
Can you elaborate a little more on oil? It seemed you are saying the wave counts in the daily charts point to a pullback or that we are already in a corrective wave. Then is the only indicator from a technical analysis standpoint that is bullish the volume? Any further explanation on this would be helpful.
Thanks
Rich
All the EW counts for Oil expect a pullback, the second daily the least of the three.
It’s not just volume that’s bullish. The last three long lower wicks on the monthly candlesticks are bullish, and I give reasonable weight to candlesticks. On the monthly chart MACD and On Balance Volume are also bullish.
At the daily chart level ADX tells us there is an upwards trend. It is a lagging indicator (it’s based upon averages) but it is best to follow it than ignore it.
Short term on the daily chart there is a slight bearishness: Stochastics is overbought and exhibits bearish divergence, often this is an indication of a pullback about to occur (often, not always), and the short term volume profile is bearish (just the volume within the last few days of sideways chop).
Does that help?
Sorry. Oil is difficult at this time. It’s just not clear.
Yes it does as there is some difference in what wave count and technical analysis is telling you. And as you said at the end, it’s not clear. Waiting fora pullback this point makes more sense.
Thank you