

S&P 500
Another signal from the AD line to end the trading week gives strong confidence in the Elliott wave analysis.
In light of recent signals from the AD line and On Balance Volume, it is time to step back and look again at monthly charts for the Elliott wave count, and some key indicators.
Summary: Another new all time high from the AD line is very bullish. Expect upwards movement as most likely next week.
For the short term, a little more downwards movement may end about 2,686 to complete a classic pullback after an upwards breakout from the symmetrical triangle.
The long to mid term Elliott wave target is at 2,922, and a classic analysis target is now at 3,045.
Corrections are an opportunity to join the trend.
Always practice good risk management. Always trade with stops and invest only 1-5% of equity on any one trade.
The biggest picture, Grand Super Cycle analysis, is here.
An historic example of a cycle degree fifth wave is given at the end of the analysis here.
ELLIOTT WAVE COUNT
MONTHLY CHART
Click chart to enlarge.
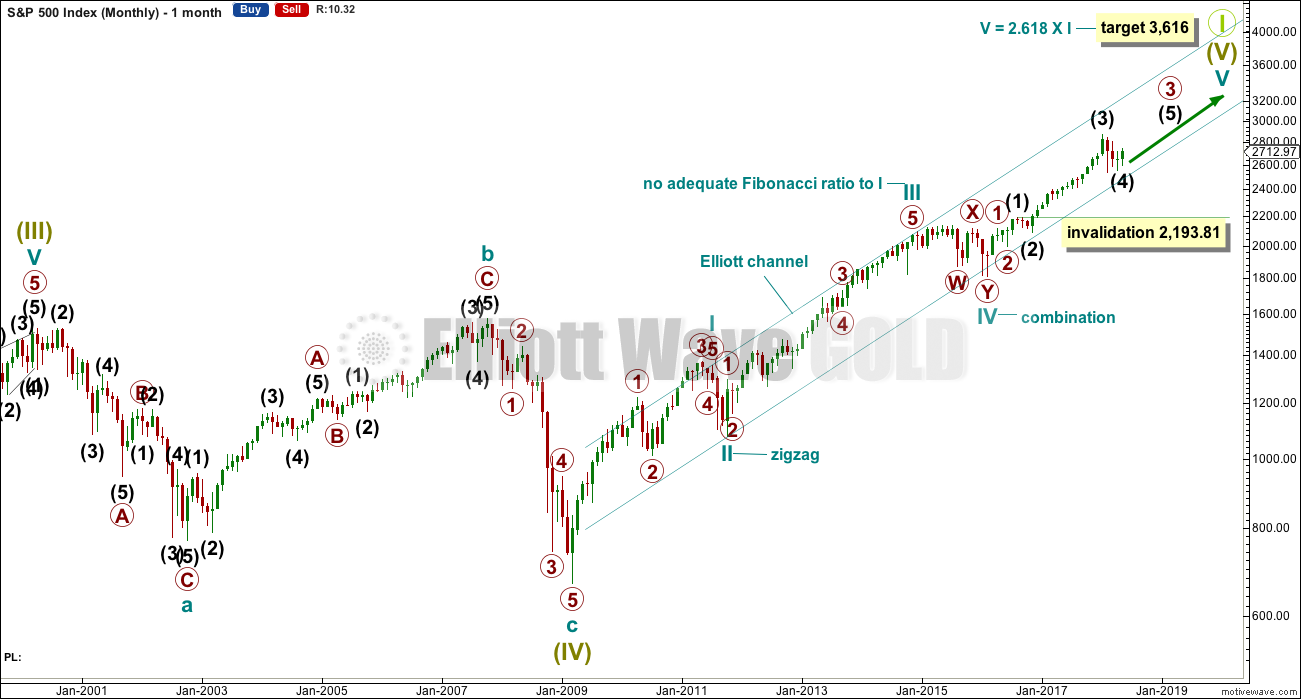
The large expanded flat labelled Super Cycle wave (IV) completed a 8.5 year correction. Thereafter, the bull market continues for Super Cycle wave (V). The structure of Super Cycle wave (V) is incomplete. At this stage, it is subdividing as an impulse.
There is no Fibonacci ratio between cycle waves I and III within Super Cycle wave (V). This makes it more likely that cycle wave V will exhibit a Fibonacci ratio to either of cycle waves I or III. Cycle wave V has passed equality in length with cycle wave I. The Fibonacci ratio of 2.618 is used for cycle wave V to allow enough room for the structure to complete.
The teal channel is drawn using Elliott’s first technique about an impulse. Draw the first trend line from the ends of cycle waves I to III (from the months of July 2011 to December 2014), then place a parallel copy on the low of cycle wave II. Cycle wave IV has found support very close to the lower edge of this channel, so the channel looks about right. The lower edge should continue to provide support, and the upper edge may provide resistance if price gets up that high.
Copy this large channel over to weekly and daily charts, all on a semi log scale. The lower edge will be important.
Cycle wave II was a shallow 0.41 zigzag lasting three months. Cycle wave IV is now seen as a more shallow 0.28 double combination lasting 14 months. Cycle wave II was a sharp movement that travelled a reasonable distance in a short time. Although cycle waves II and IV are disproportionate in terms of duration, the distance covered still gives the wave count the right look. There is excellent alternation between them.
Cycle wave I lasted 28 months (not a Fibonacci number), cycle wave II lasted a Fibonacci 3 months, cycle wave III lasted 38 months (not a Fibonacci number), and cycle wave IV lasted 14 months (one more than a Fibonacci 13).
Cycle wave V has begun its 27th month. The structure needs several more months to complete. It may last another 7 months to total a Fibonacci 34, or it may continue for as long as another 28 months to total a Fibonacci 55.
It is also possible that cycle wave V may not exhibit a Fibonacci duration.
Within cycle wave V, the correction for intermediate wave (4) may not move back down into intermediate wave (1) price territory below 2,193.81.
WEEKLY CHART
Click chart to enlarge.
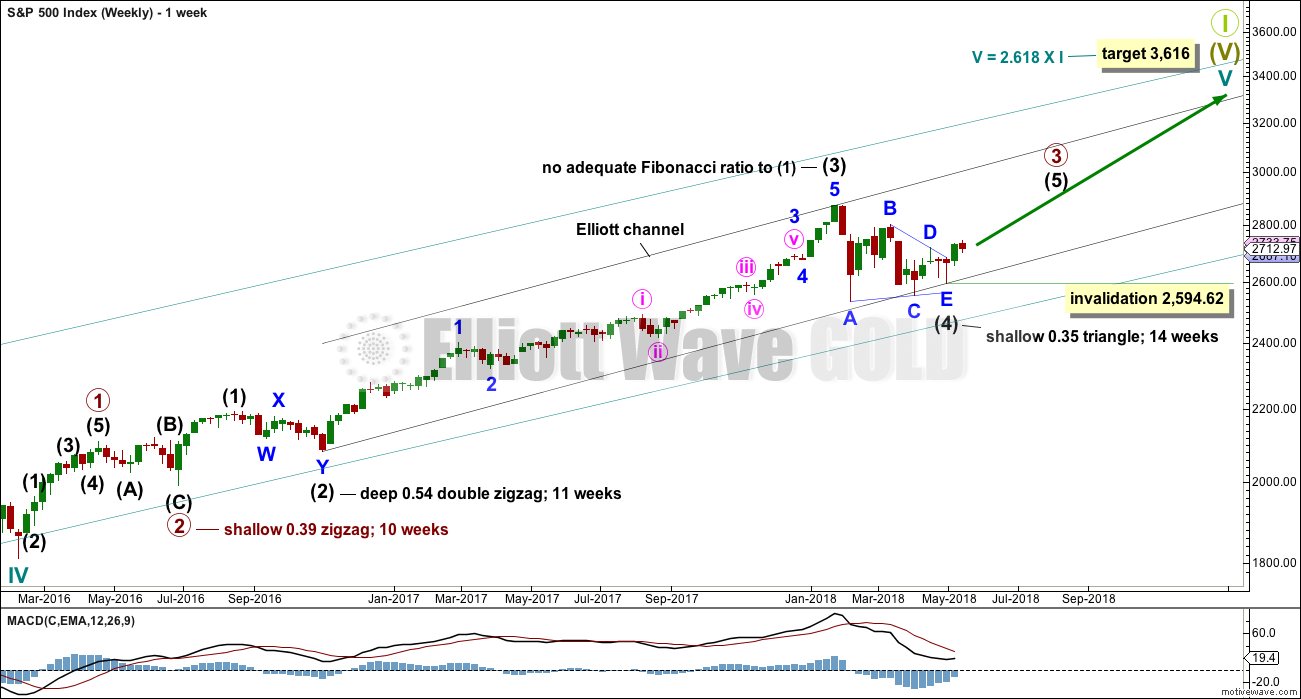
Cycle wave V must complete as a five structure, which should look clear at the weekly chart level. It may only be an impulse or ending diagonal. At this stage, it is clear it is an impulse.
Within cycle wave V, the third waves at all degrees may only subdivide as impulses.
Intermediate wave (4) has breached an Elliott channel drawn using Elliott’s first technique. The channel is redrawn using Elliott’s second technique: the first trend line from the ends of intermediate waves (2) to (4), then a parallel copy on the end of intermediate wave (3). Intermediate wave (5) may end either midway within the channel, or about the upper edge.
Intermediate wave (4) may now be a complete regular contracting triangle lasting fourteen weeks, one longer than a Fibonacci thirteen. There is perfect alternation and excellent proportion between intermediate waves (2) and (4).
If intermediate wave (4) were to continue further as either a flat or combination, both possibilities would require another deep pullback to end at or below 2,532.69. With both On Balance Volume and the AD line making new all time highs, that possibility looks extremely unlikely.
If intermediate wave (4) were to continue further, it would now be grossly disproportionate to intermediate wave (2). Both classic technical analysis and Elliott wave analysis now suggest these alternate ideas should be discarded based upon a very low probability.
The AD line today makes yet another all time high, so the invalidation point is moved higher at the weekly chart level. Within intermediate wave (5), no second wave correction may move beyond the start of its first wave below 2,594.62.
DAILY CHART
Click chart to enlarge.
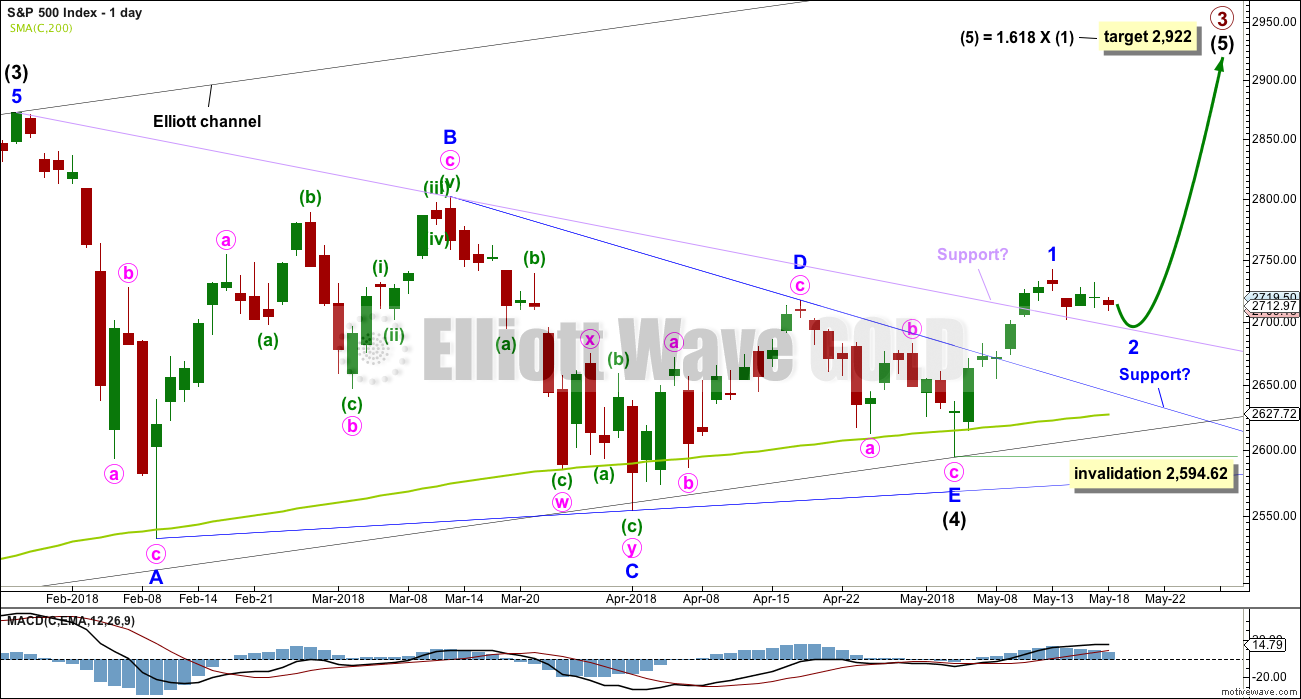
It is possible that intermediate wave (4) is a complete regular contracting triangle, the most common type of triangle. Minor wave E may have found support just below the 200 day moving average and ending reasonably short of the A-C trend line. This is the most common look for E waves of triangles.
Intermediate wave (3) exhibits no Fibonacci ratio to intermediate wave (1). It is more likely then that intermediate wave (5) may exhibit a Fibonacci ratio to either of intermediate waves (1) or (3). The most common Fibonacci ratio would be equality in length with intermediate wave (1), but in this instance that would expect a truncation. The next common Fibonacci ratio is used to calculate a target for intermediate wave (5) to end.
Price has clearly broken out above the upper triangle B-D trend line. This indicates that it should now be over if the triangle is correctly labelled.
A resistance line in lilac is added to this chart. It is the same line as the upper edge of the symmetrical triangle on the daily technical analysis chart. Upwards movement has sliced cleanly through this line, finding no resistance before breaking it. This line may offer some support for any pullbacks. Price is finding support at that line so far. A breach of that line does not mean the classic triangle is invalid and that price must make new lows, only that the pullback is deeper. Look for next support at the blue Elliott wave triangle B-D trend line.
Sometimes the point at which the triangle trend lines cross over sees a trend change. A trend change at that point may be a minor one or a major one. That point is now about the 5th of June.
ALTERNATE MONTHLY CHART
Click chart to enlarge.
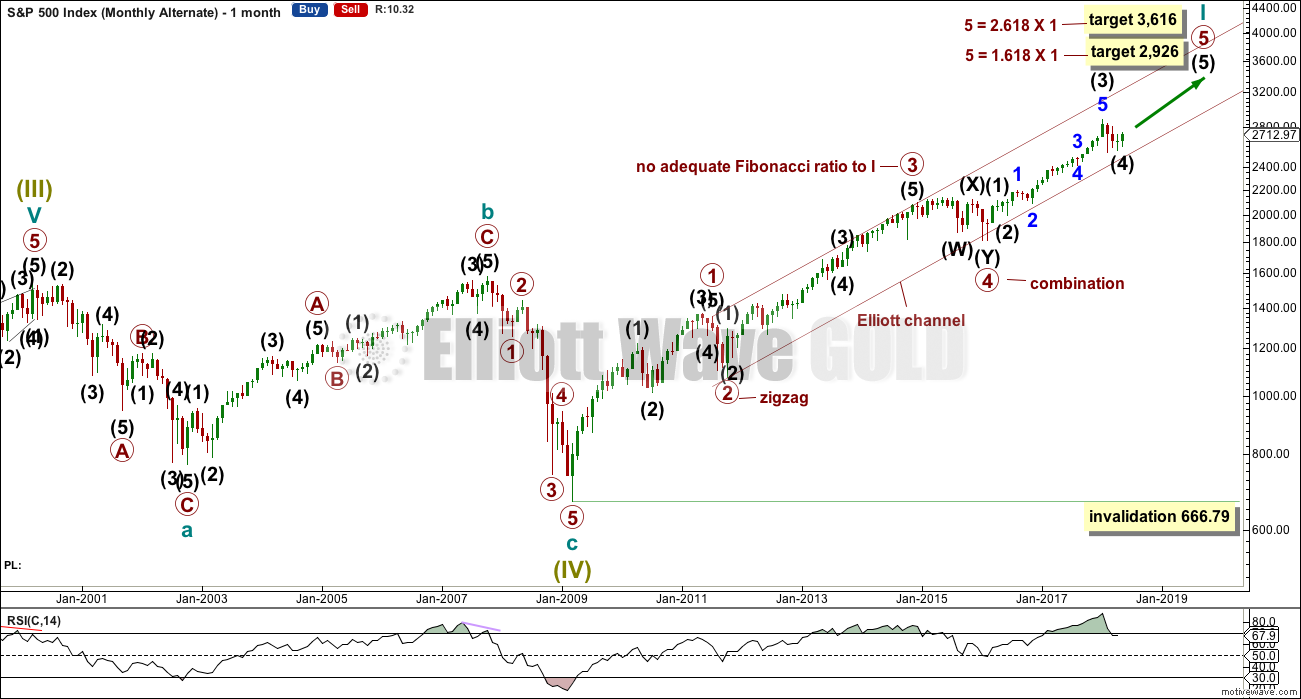
This alternate wave count is identical to the main monthly chart up to the low labelled Super Cycle wave (IV). Thereafter, only the degree of labelling is moved down one degree and the subdivisions of the following bull market are seen in the same way.
In the Grand Super Cycle analysis, Super Cycle wave (I) lasted over 60 years (my data does not go all the way to the start of Grand Super Cycle wave I); Super Cycle wave (II) lasted just 8 years (the market crash which began in 1929); Super Cycle wave III lasted 66 years, up to the high of 2000; and, Super Cycle wave (IV) ending in March 2009 lasted just 8.5 years.
Both of Super Cycle waves (I) and (III) are long extensions. This means Super Cycle wave (V) may not be a long extension because only two of the three actionary waves within Grand Super Cycle wave I may be extended.
If the degree of labelling within Super Cycle wave (V) is moved down one, it may be that only cycle wave I is nearing its end. The following correction for cycle wave II may not move beyond the start of cycle wave I below 666.79.
If only cycle wave I is nearing an end, then so far it has lasted 9 years. This does not look right for the Grand Super Cycle analysis because it would have to see a longer third wave for cycle wave III, and then Super Cycle wave (V) would look extended and the Elliott wave rule would be violated.
However, it is possible that cycle wave III could be relatively short, as could cycle wave V to end Super Cycle wave (V). And so this alternate may be considered, although it looks like it may have a low probability if the Grand Super Cycle wave count is correct.
TECHNICAL ANALYSIS
MONTHLY CHART
Click chart to enlarge. Chart courtesy of StockCharts.com.
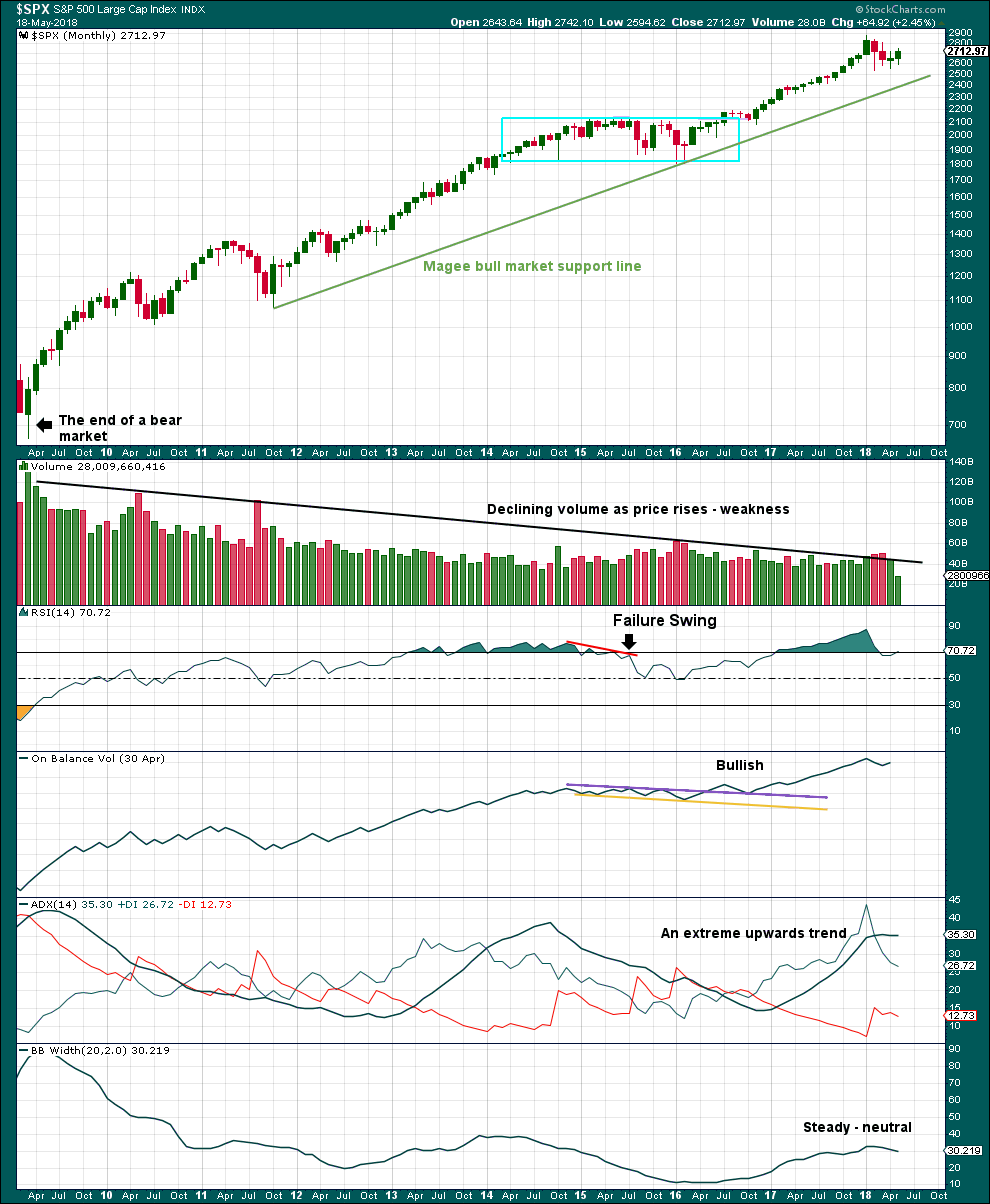
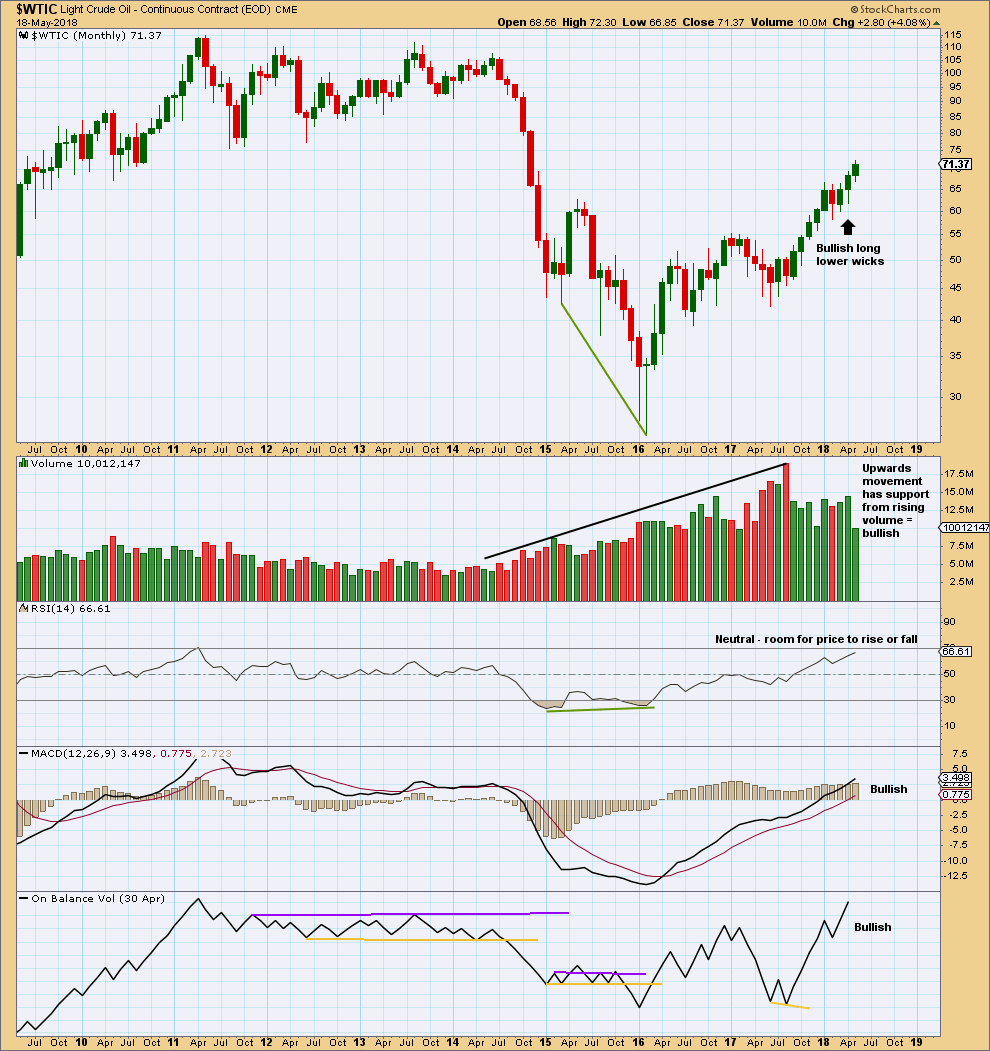
This monthly chart shows the entire bull market from the low in March 2009.
A persistent feature of this bull market is rising price on declining volume. This is normally unsustainable, but in this market the fact is it has been sustained now for some years. It must be accepted that it could continue further yet for more years.
Eventually, this bull market will end as they all do. When the bear market arrives, light volume indicates there may be little support for falling price. The eventual bear market could see price fall very far very fast.
ADX can remain very extreme for many months in a strong bull market. It is hopeless as a timing tool for an end to a bull run, even at this time frame.
The Magee bull market trend line is drawn across the first two major swing lows. It should be assumed the bull market remains intact while price remains above this line. If this line is breached at the monthly chart level, then a bear market may have arrived.
At its end, I will be looking for the following conditions before a bear market may be considered:
1. Divergence between price and RSI, and preferably another failure swing.
2. A bearish signal from On Balance Volume.
3. Finally, a breach of the Magee bull market trend line.
WEEKLY CHART
Click chart to enlarge. Chart courtesy of StockCharts.com.
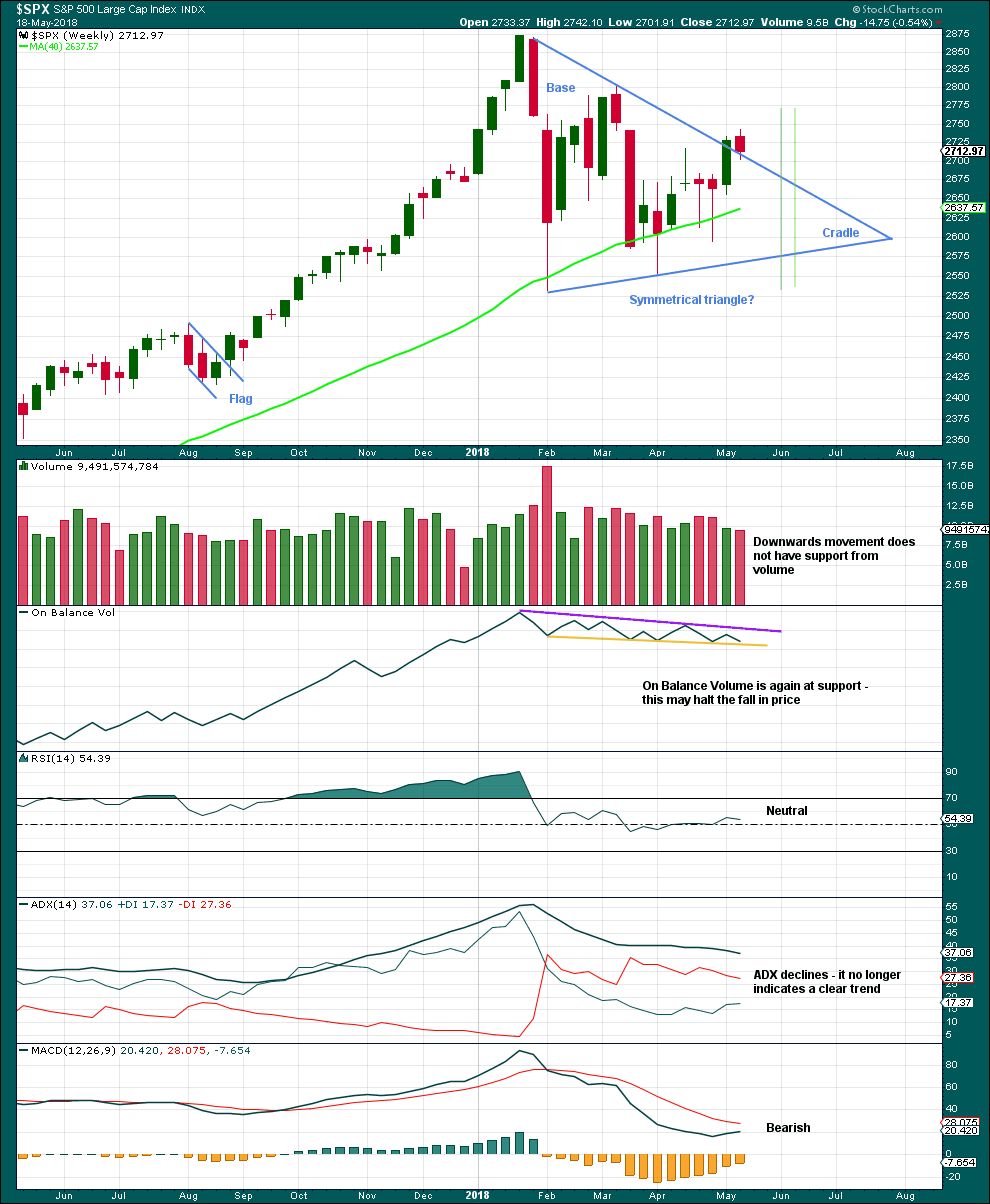
From Dhalquist and Kirkpatrick on trading triangles:
“The ideal situation for trading triangles is a definite breakout, a high trading range within the triangle, an upward-sloping volume trend during the formation of the triangle, and especially a gap on the breakout.”
For this example, the breakout may have now happened. There was a high trading range within the triangle, but volume declined. A downwards week may be a typical pullback following the breakout.
DAILY CHART
Click chart to enlarge. Chart courtesy of StockCharts.com.
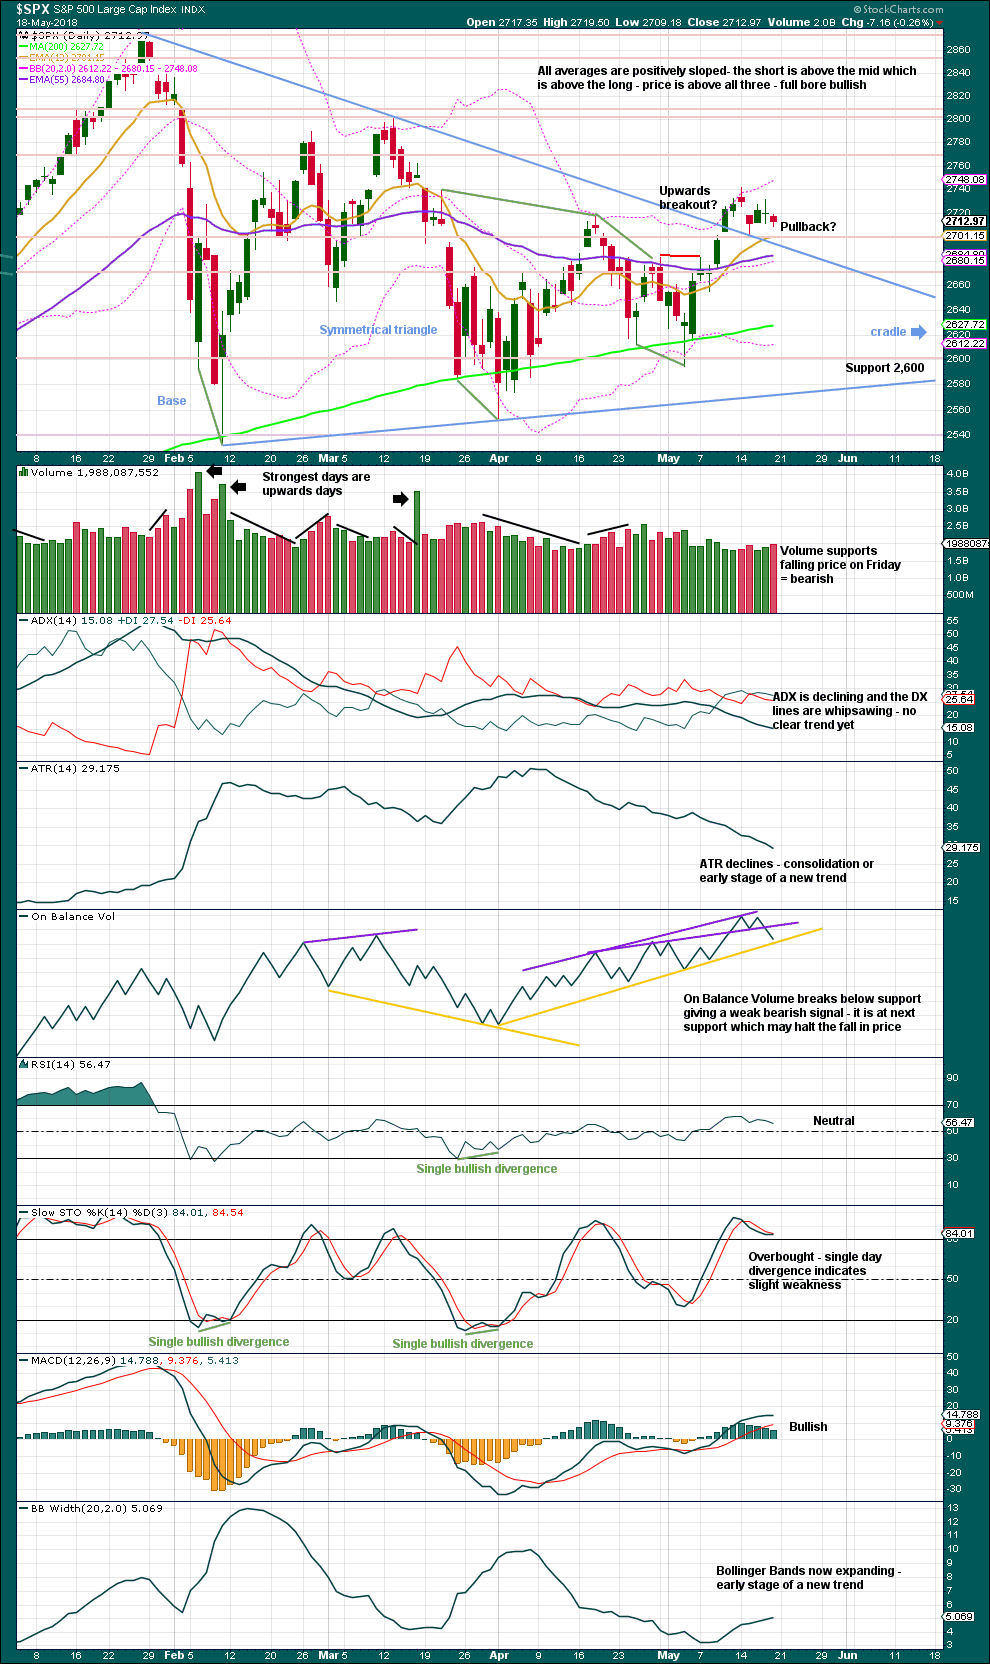
The symmetrical triangle may now be complete, and price has completed an upwards breakout. There may be some small cause for concern that the upwards breakout does not have support from volume. However, in current market conditions only some small concern is had here. Rising price on light and declining volume has been a feature of this market for years, yet price continues to rise.
After an upwards breakout, pullbacks occur 59% of the time. A pullback may find support at the upper triangle trend line and may be used as an opportunity to join a trend.
Symmetrical triangles suffer from many false breakouts. If price returns back into the triangle, then the breakout will be considered false and the triangle trend line will be redrawn.
The base distance is 340.18. Added to the breakout point of 2,704.54 this gives a target at 3,044.72. This is above the Elliott wave target at 2,922, so the Elliott wave target may be inadequate.
For the short term, the next smaller consolidation or pullback may come about 2,811. This shorter term target is calculated using the measuring gap. That gap may now provide support and may be used to pull up stops on long positions. The gap still remains just open; this target remains valid.
On Balance Volume has made a new all time high, providing a very strong bullish signal; expect price to follow. The bearish signal from On Balance Volume breaking below the purple support line is weak because this line has been broken recently. The next support line offers slightly better technical significance; it may halt the fall in price now.
VOLATILITY – INVERTED VIX CHART
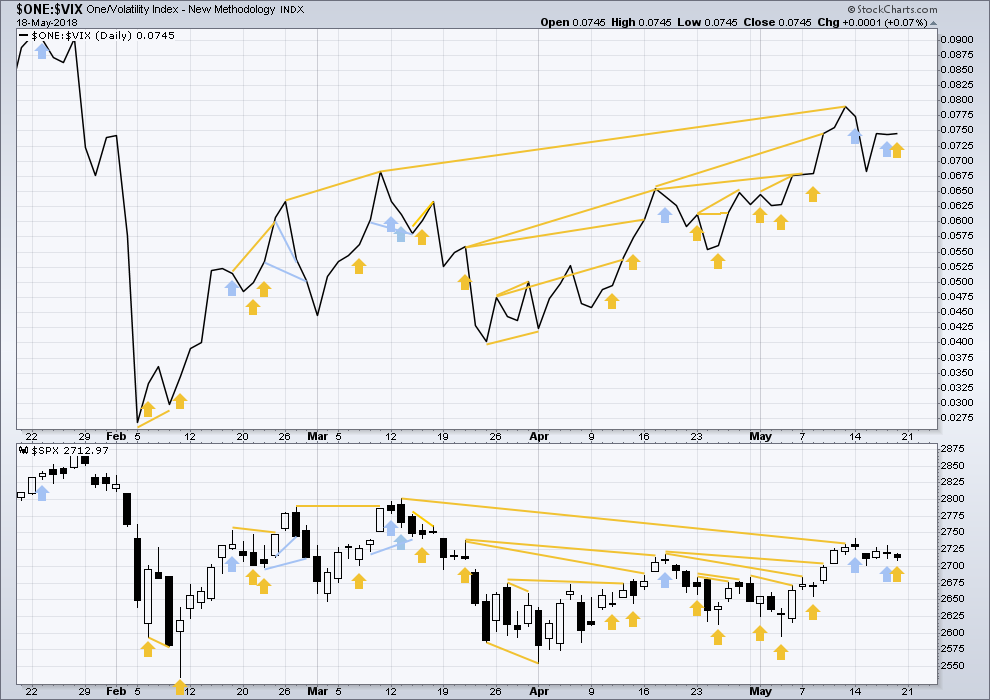
Click chart to enlarge. Chart courtesy of StockCharts.com. So that colour blind members are included, bearish signals
will be noted with blue and bullish signals with yellow.
Normally, volatility should decline as price moves higher and increase as price moves lower. This means that normally inverted VIX should move in the same direction as price.
There is still a cluster of bullish signals on inverted VIX. Overall, this may offer support to the main Elliott wave count.
Inverted VIX is much higher than the prior swing high of the 9th / 13th March, but price is not yet. Reading VIX as a leading indicator, this divergence is bullish.
Price moved slightly lower, but inverted VIX moved slightly higher. This divergence is bullish, but only weakly so.
BREADTH – AD LINE
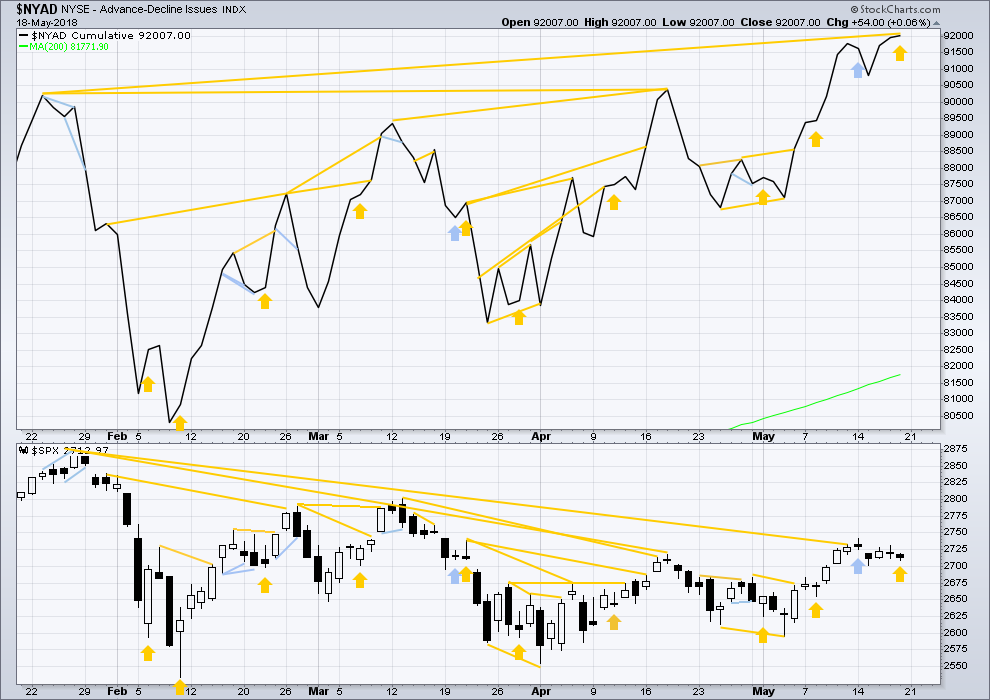
Click chart to enlarge. Chart courtesy of StockCharts.com.
There is normally 4-6 months divergence between price and market breadth prior to a full fledged bear market. This has been so for all major bear markets within the last 90 odd years. With no longer term divergence yet at this point, any decline in price should be expected to be a pullback within an ongoing bull market and not necessarily the start of a bear market. New all time highs from the AD line means that any bear market may now be an absolute minimum of 4 months away. It may of course be a lot longer than that. My next expectation for the end of this bull market may now be October 2019.
Small caps continue to make new all time highs, but mid and large caps have yet to do so. This divergence may be interpreted as bullish. Small caps may now be leading the market.
Breadth should be read as a leading indicator.
There has been a cluster of bullish signals from the AD line in the last few weeks. This also overall offers good support to the main Elliott wave count.
The AD line has made another new all time high. This is a very strong bullish signal, and is one reason why the more bearish Elliott wave counts are discarded. It is extremely likely now that price shall follow with a new all time high.
Price moved slightly lower, but the AD line moved slightly higher to make another new all time high. The divergence is weakly bullish, but the new all time high supports the Elliott wave count at higher time frames. When the AD line makes new all time highs, expect price to follow.
DOW THEORY
The following lows need to be exceeded for Dow Theory to confirm the end of the bull market and a change to a bear market:
DJIA: 23,360.29.
DJT: 9,806.79.
S&P500: 2,532.69.
Nasdaq: 6,630.67.
At this stage, only DJIA has made a new major swing low. DJT also needs to make a new major swing low for Dow Theory to indicate a switch from a bull market to a bear market. For an extended Dow Theory, which includes the S&P500 and Nasdaq, these two markets also need to make new major swing lows.
GOLD
Friday moved price a little higher. The main Elliott wave count remains correct so far.
Summary: The target is now 1,412. Bullish divergence between price and Stochastics still suggests a low is in place here or very soon. If price continues lower, a target is now at 1,276.
Confidence now that a low is in place would come with a breach of the green Elliott channel.
Always trade with stops to protect your account. Risk only 1-5% of equity on any one trade.
Grand SuperCycle analysis is here.
Last in-depth historic analysis with monthly and several weekly charts is here, video is here.
There are multiple wave counts at this time at the weekly and monthly chart levels. In order to make this analysis manageable and accessible only two will be published on a daily basis, one bullish and one bearish. This does not mean the other possibilities may not be correct, only that publication of them all each day is too much to digest. At this stage, they do not diverge from the two possibilities below.
BULLISH ELLIOTT WAVE COUNT
FIRST WEEKLY CHART
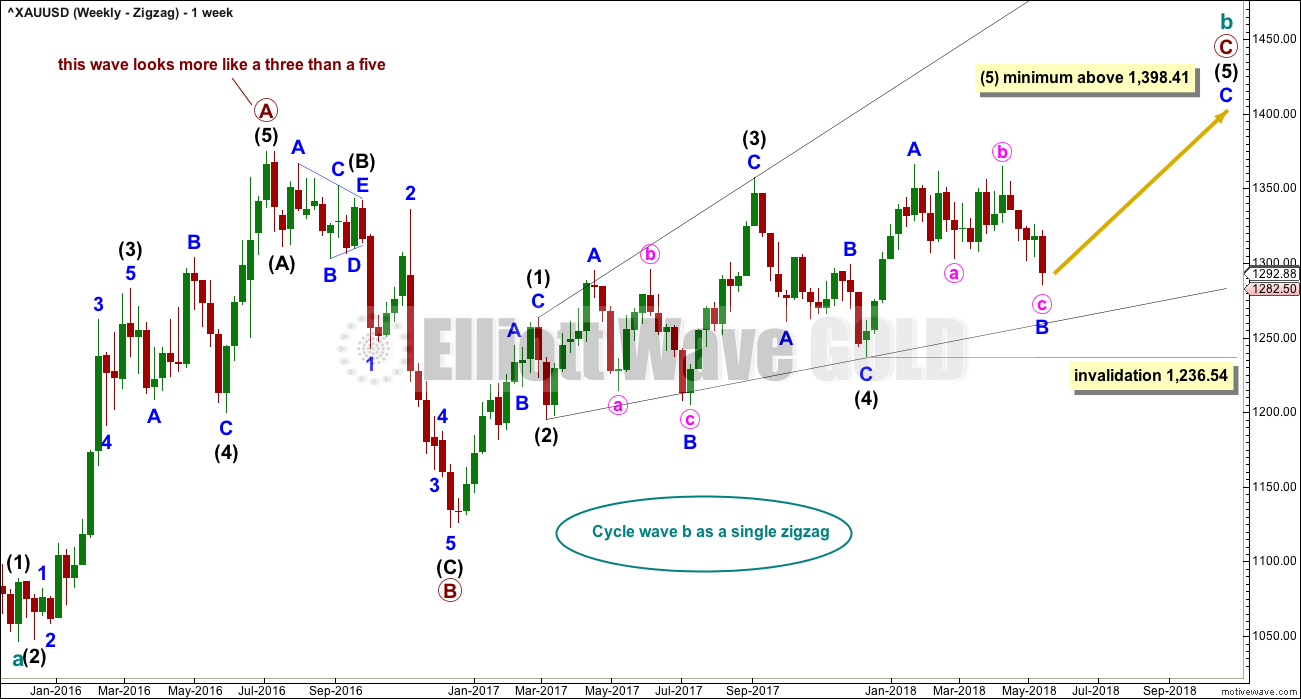
Click chart to enlarge.
Cycle wave b may be a single zigzag. Zigzags subdivide 5-3-5. Primary wave C must subdivide as a five wave structure and may be either an impulse or an ending diagonal. Overlapping at this stage indicates an ending diagonal.
Within an ending diagonal, all sub-waves must subdivide as zigzags. Intermediate wave (4) must overlap into intermediate wave (1) price territory. This diagonal is expanding: intermediate wave (3) is longer than intermediate wave (1) and intermediate wave (4) is longer than intermediate wave (2). Intermediate wave (5) must be longer than intermediate wave (3), so it must end above 1,398.41 where it would reach equality in length with intermediate wave (3).
Within the final zigzag of intermediate wave (5), minor wave B may not move beyond the start of minor wave A below 1,236.54. However, if it were now to turn out to be relatively deep, it should not get too close to this invalidation point as the lower (2)-(4) trend line should provide strong support. Diagonals normally adhere very well to their trend lines.
Within the diagonal of primary wave C, each sub-wave is extending in price and so may also do so in time. Within each zigzag, minor wave B may exhibit alternation in structure and may show an increased duration.
Within intermediate wave (1), minor wave B was a triangle lasting 11 days. Within intermediate wave (3), minor wave B was a regular flat lasting 60 days. Intermediate wave (5) is expected to be longer in price than intermediate wave (3), and it may also be longer in duration, and so minor wave B within it may also be longer in duration. If minor wave B is over at today’s low, it would have lasted 81 days.
This first weekly chart sees the upwards wave labelled primary wave A as a five wave structure. It must be acknowledged that this upwards wave looks better as a three than it does as a five. The fifth weekly chart below will consider the possibility that it was a three.
FIRST DAILY CHART
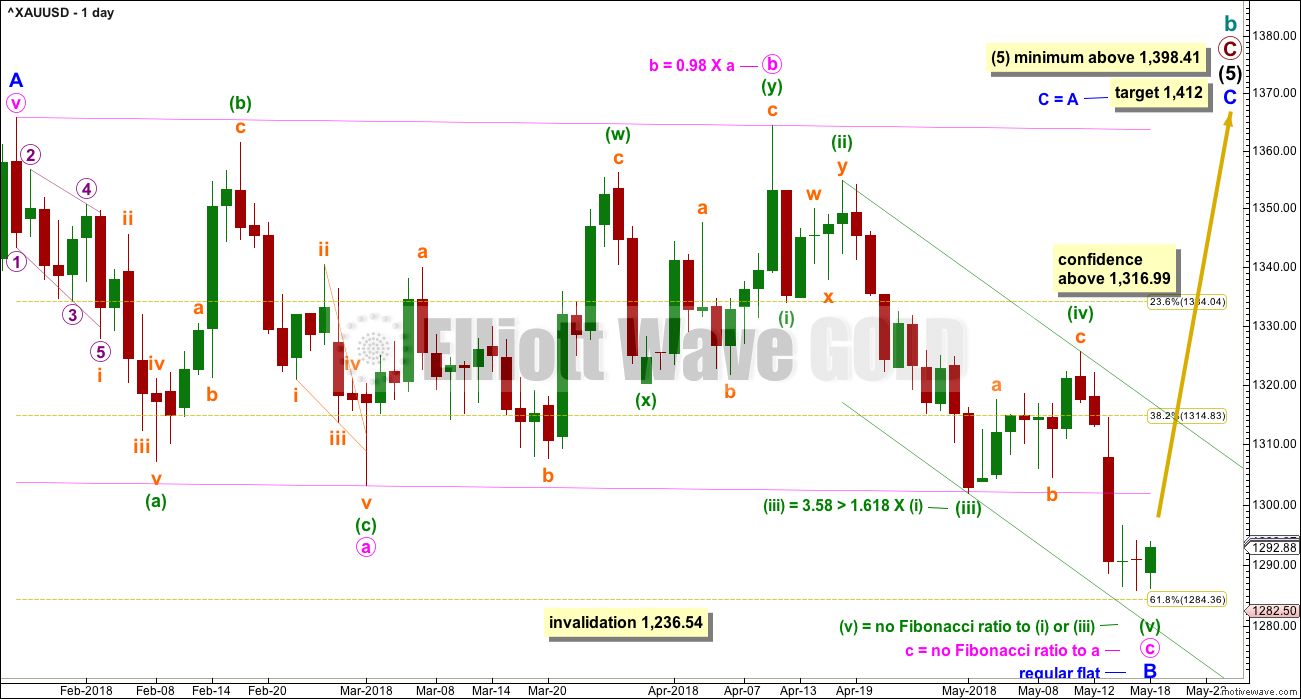
Click chart to enlarge.
Minor wave B may be a complete regular flat correction. Minute wave c has overshot the lower trend line. Although this is not the most common look for a regular flat, it does sometimes happen.
The bottom line for this wave count is it now requires a breach of the green Elliott channel about minute wave c for confidence that a low is now in place.
The target for minor wave C is calculated using the most common Fibonacci ratio to minor wave A. This would see intermediate wave (5) reach beyond its minimum required length. All Elliott wave rules would be met.
BEARISH ELLIOTT WAVE COUNT
FIFTH WEEKLY CHART
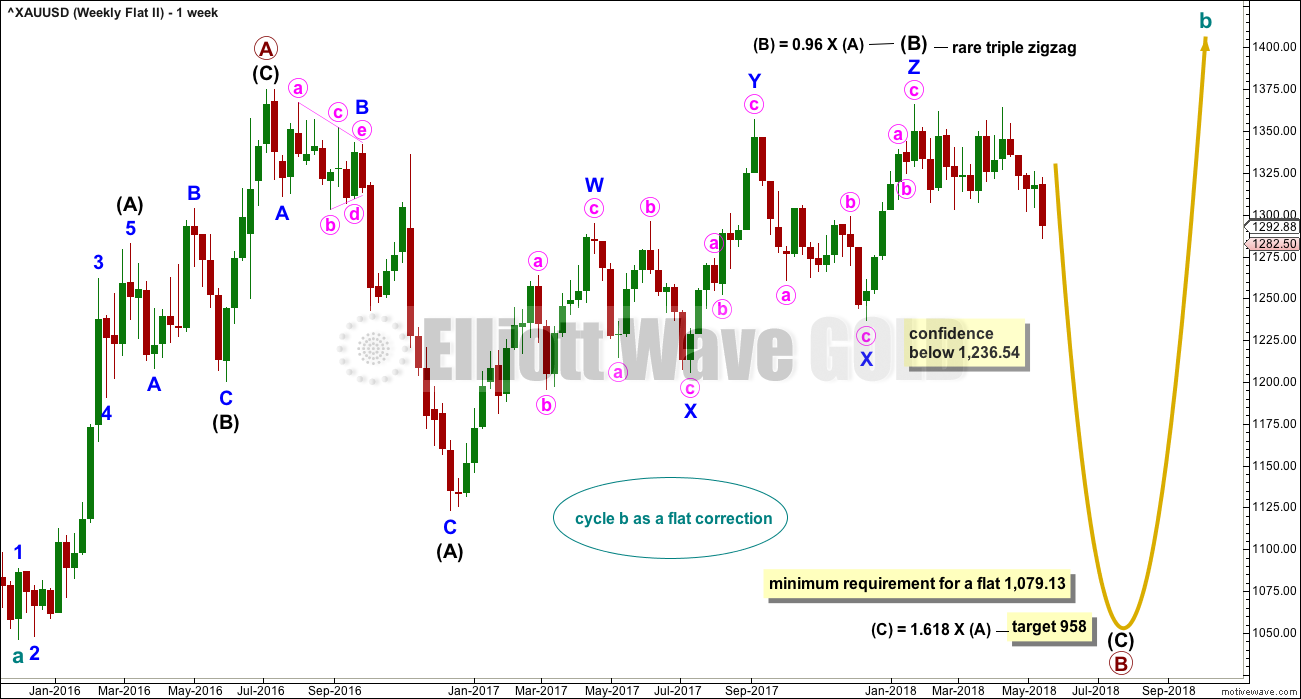
Click chart to enlarge.
There were five weekly charts published in the last historic analysis. This fifth weekly chart is the most immediately bearish wave count, so this is published as a bearish possibility.
This fifth weekly chart sees cycle wave b as a flat correction.
If cycle wave b is a flat correction, then within it primary wave B must retrace a minimum 0.9 length of primary wave A at 1,079.13 or below. The most common length of B waves within flats is from 1 to 1.38 times the length of the A wave. The target calculated would see primary wave B end within this range.
Primary wave B may be subdividing as a regular flat correction, and within it both intermediate waves (A) and (B) subdivide as three wave structures. Intermediate wave (B) fits as a triple zigzag.
I have only seen two triple zigzags before during my 10 years of daily Elliott wave analysis. If this wave count turns out to be correct, this would be the third. The rarity of this structure is identified on the chart.
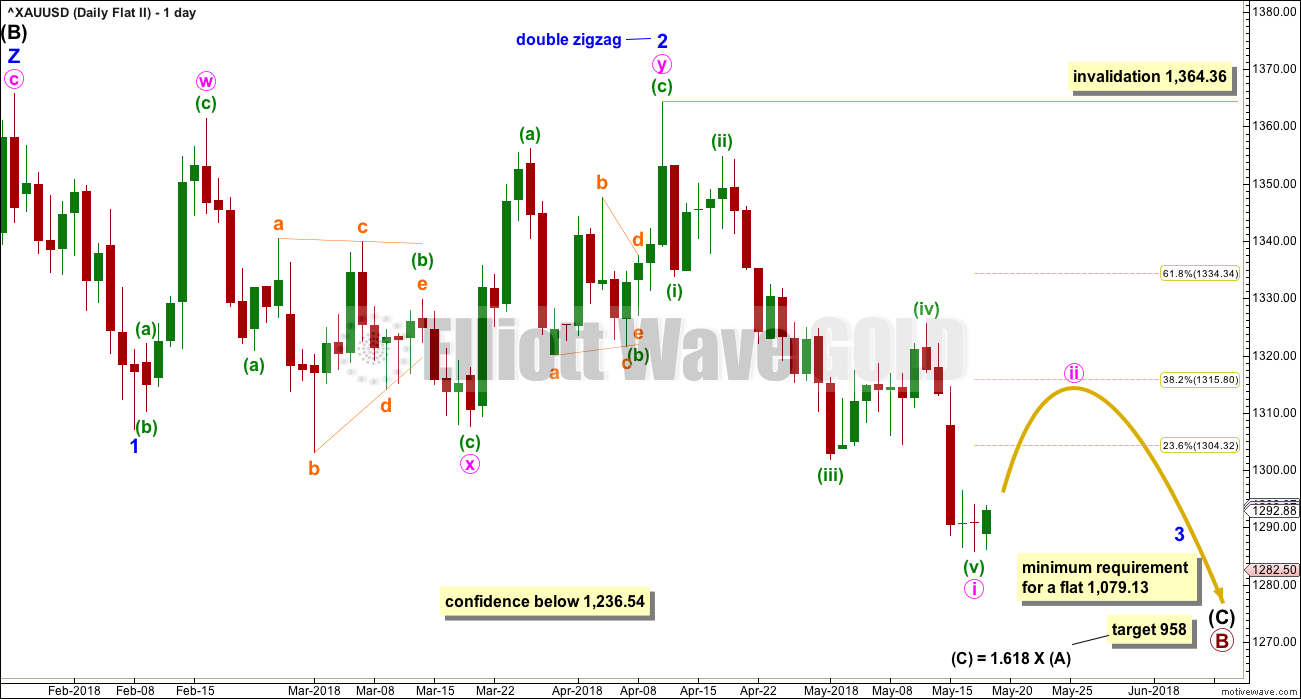
FIFTH DAILY CHART
Click chart to enlarge.
Minor wave 1 may have been a relatively brief impulse over at the low of the 8th of February.
I have found a reasonable solution that can see minor wave 2 over at the last high as a double zigzag. All subdivisions fit and all Elliott wave rules are met. The second zigzag in the double does deepen the correction, which is its purpose, although it is not by very much.
It is possible that a third wave, minor wave 3, began at the last high labelled minor wave 2. Minor wave 3 may only subdivide as an impulse.
Within minor wave 3, minute wave i may be over at the last low. Minute wave ii may be a multi day bounce or sideways movement that may end about the 0.382 or 0.618 Fibonacci ratios, but the pull of the middle of a third wave down may now force it to be more shallow than second wave corrections usually are; the 0.382 Fibonacci ratio may be slightly favoured.
Minute wave ii may not move beyond the start of minute wave i above 1,364.36.
TECHNICAL ANALYSIS
WEEKLY CHART
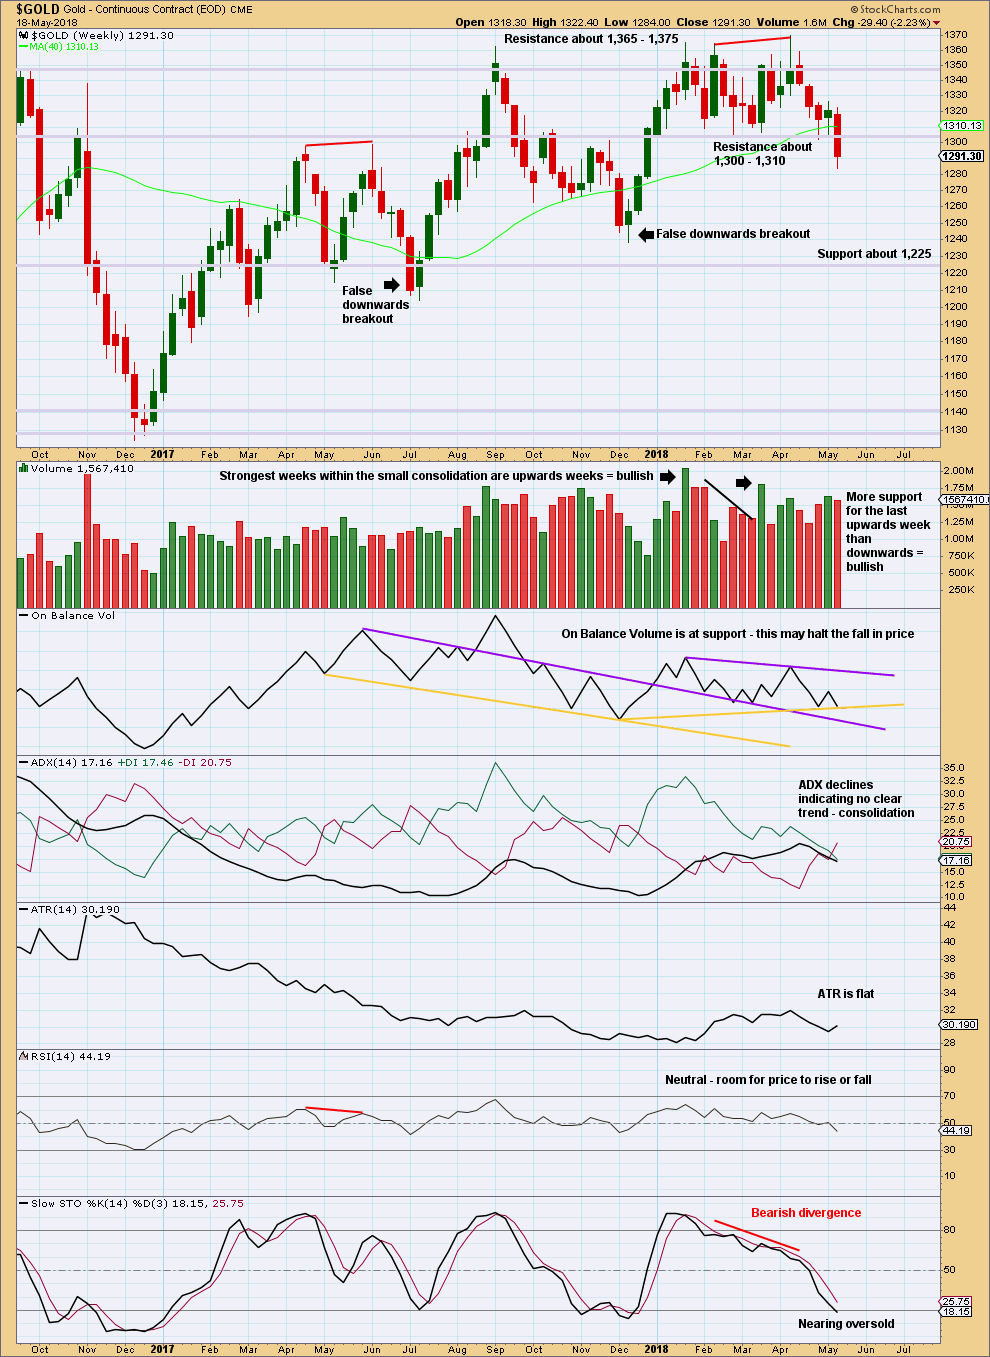
Click chart to enlarge. Chart courtesy of StockCharts.com.
Price has closed below support this week, although at this time frame it does not have support from volume. However, a downwards breakout does not require support from volume for confidence.
Next support at this time frame is about 1,225.
At this stage, with the data in hand, this looks like a possible downwards breakout. However, there are two recent examples of false downwards breakouts on this chart. As noted, price closed below support at the weekly chart time frame in both instances, but within two weeks afterwards price was back within the prior consolidation zone. In both instances, the clue was in volume during the consolidation: both instances saw the strongest volume during the consolidation for upwards weeks.
That could be the case again here as volume during the last consolidation was for upwards weeks. For this reason some suspicion may be had on this possible downwards breakout. If it is followed by another downwards week, then some confidence may then be had in it.
DAILY CHART
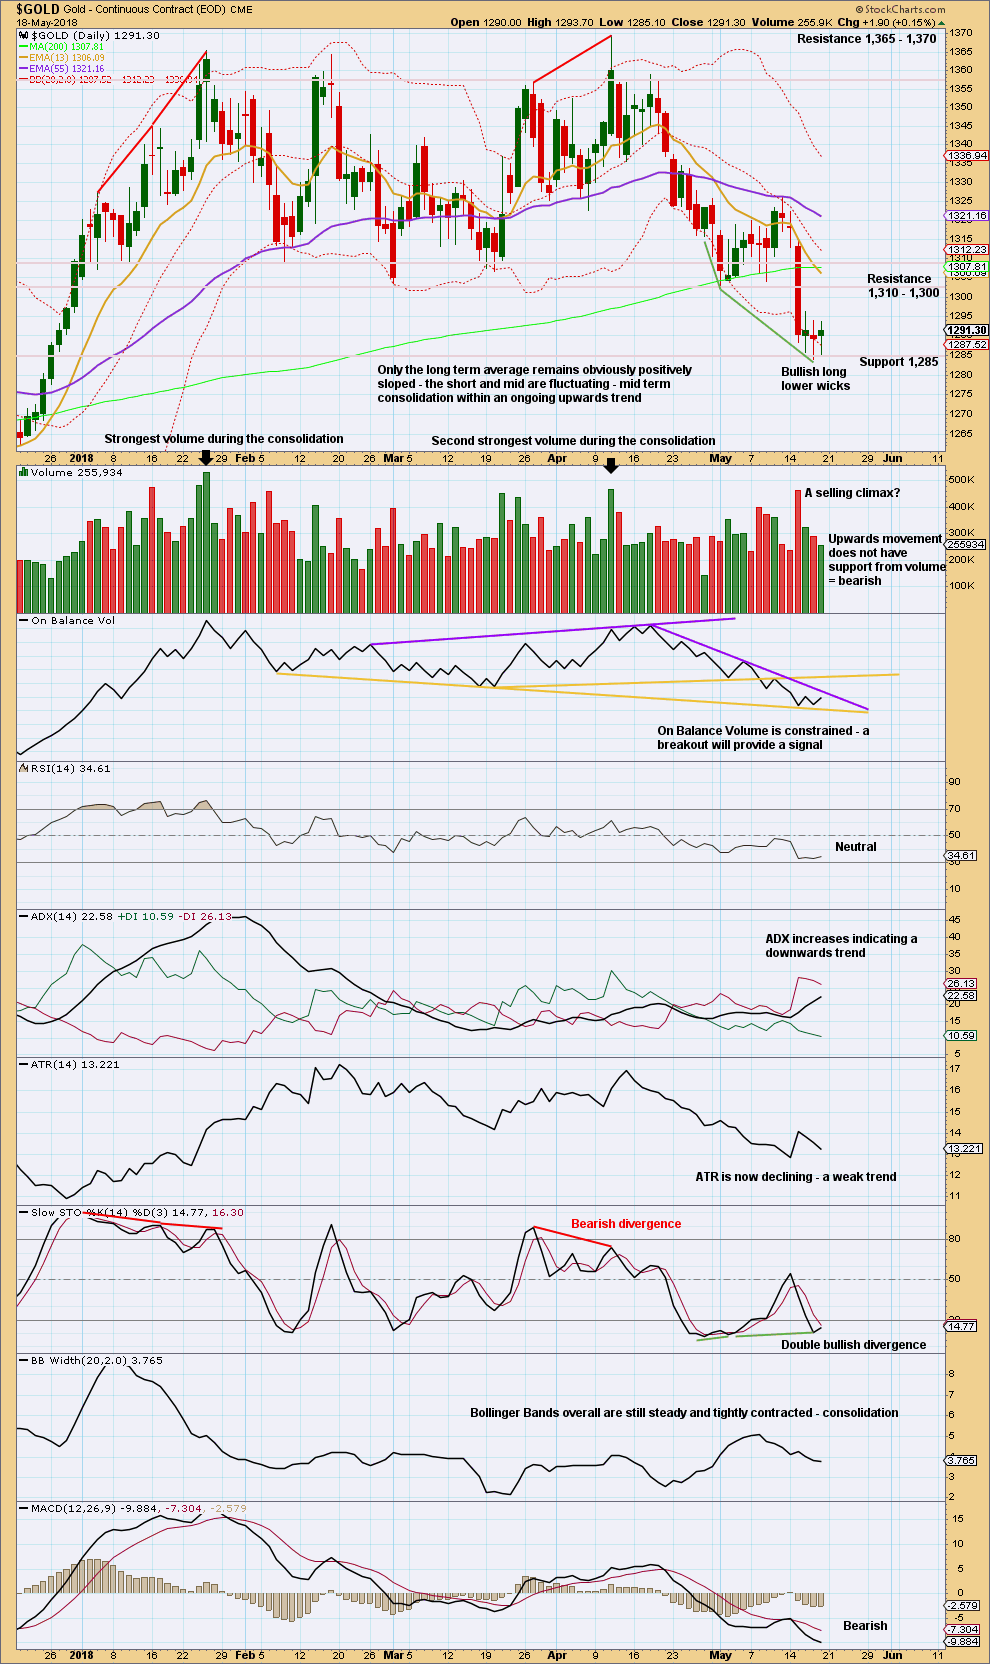
Click chart to enlarge. Chart courtesy of StockCharts.com.
Gold has broken below support about 1,310 – 1,305 on a downwards day with support from volume. This may be a downwards breakout from the consolidation. The last two days may be a small beginning of a throwback, or possibly a bear flag pattern.
In order to judge the possibility of a low in place as the main Elliott wave count expects, let us look back at major lows from November 2015 and see how price behaved in the days immediately after.
A major low was found on the 3rd of December, 2015. The following day for the 4th of December saw a strong Bullish Engulfing reversal pattern with support from volume, and it came with strong double bullish divergence between price and both of RSI and Stochastics. That low in hindsight looks fairly strong.
Another reasonable low was found on the 31st of May, 2016. There was no reasonable bullish divergence at the low between price and either of RSI or Stochastics. At the low, the candlestick had a bullish long lower wick (although with a reasonable upper wick, it is not properly a Hammer reversal pattern). The two days following the low for the 1st and 2nd of June were inconclusive; both closed red and could at the time have been considered a potential bear flag pattern developing; both had a balance of volume downwards but showed strongly declining volume. Not until the third day, with a very strong upwards day with support from volume to complete a very strong Bullish Engulfing reversal pattern, was a low set in place.
A major low was found on the 15th of December, 2016. At the low, the candlestick had a somewhat bullish long lower wick; volume for the last downwards day supported the fall in price; and, there was clear and strong bullish divergence between price and RSI and Stochastics. The next two days closed green but did not have support from volume. The following two days closed red and did have support from volume. At that stage, four days out from a major low, the short term volume profile was bearish and it looked like a bear flag pattern may be developing. It was not until seven days after the low on the 27th of December that a reasonable bullish day unfolded, and even then it did not have good support from volume. This low did not look clear.
The next low to study occurred on the 10th of March, 2017. That day was inconclusive, closing green, but the balance of volume was downwards and volume supported that downwards movement. At the low, there was no reasonable bullish divergence between price and either of RSI or Stochastics. It was not until three days after the low on the 15th of March that price bounced strongly to complete a strong Bullish Engulfing reversal pattern, which had good support from volume.
The next low to study occurred on the 9th of May, 2017. On that day RSI reached oversold, but there was no divergence between it and price nor price and Stochastics. Right up until six days after the low the short term volume profile could have been judged to be bearish; rising price did not have support from volume. It was clear a low was in place on the 17th of May as a very strong Bullish Engulfing reversal pattern unfolded with strong support from volume. The small bounce up until that date could have been judged to be a bounce within an ongoing downwards trend.
The next low to study occurred on the 10th of July, 2017. There was no divergence at the low between price and RSI, but there was strong clear bullish divergence between price and Stochastics. There were two candlesticks with bullish long lower wicks at the low, but volume remained lighter than the prior downwards day of the 9th of July. This looks like a selling climax in hindsight, but at the time it could have been judged to support downwards movement. Right up until the 14th of July, five days after the low, it could have been considered a bear flag pattern unfolding. On the 14th of July a strong Bullish Engulfing pattern unfolded with some support from volume.
The last low to study is a very important one on the 12th of December, 2017. This occurred after a downwards breakout below support, which was previously at 1,262. That downwards breakout was short lived; price remained below support for two weeks, and found a low only five days after the breakout. At the low, there was no bullish divergence between price and either of RSI or Stochastics. The first upwards day on the 13th of December had a wide range but a very small real body. It did have good support from volume, but volume remained lighter than most prior downwards days. After that low, price moved steadily higher for weeks, initially on light and declining volume. That low in hindsight was very difficult to pick.
Some conclusions may be drawn in relation to the current situation. The first and strongest conclusion is that lows for Gold (at least for the last two years and five months) are not always very clear at the time. Price can be weak in days immediately following lows; it can remain weak for about five to seven days following lows. Lows do not always come with divergence between price and RSI nor even price and Stochastics, but when they do that offers a clue.
Although the last few days of this week have seen unexpected downwards movement, some suspicion may be had that this is a downwards breakout. ADX at this time indicates a downward trend is in place, but this is a lagging indicator. Look out for at least a short term bounce here, and do not be surprised if it begins to show some strength towards the end of next week. If it remains persistently weak, then short positions may be taken for a downwards trend (the new labelling for the fifth wave count could be correct). If it shows strength, that would support the first wave count; the downwards breakout may have been yet another false breakout.
GDX WEEKLY CHART
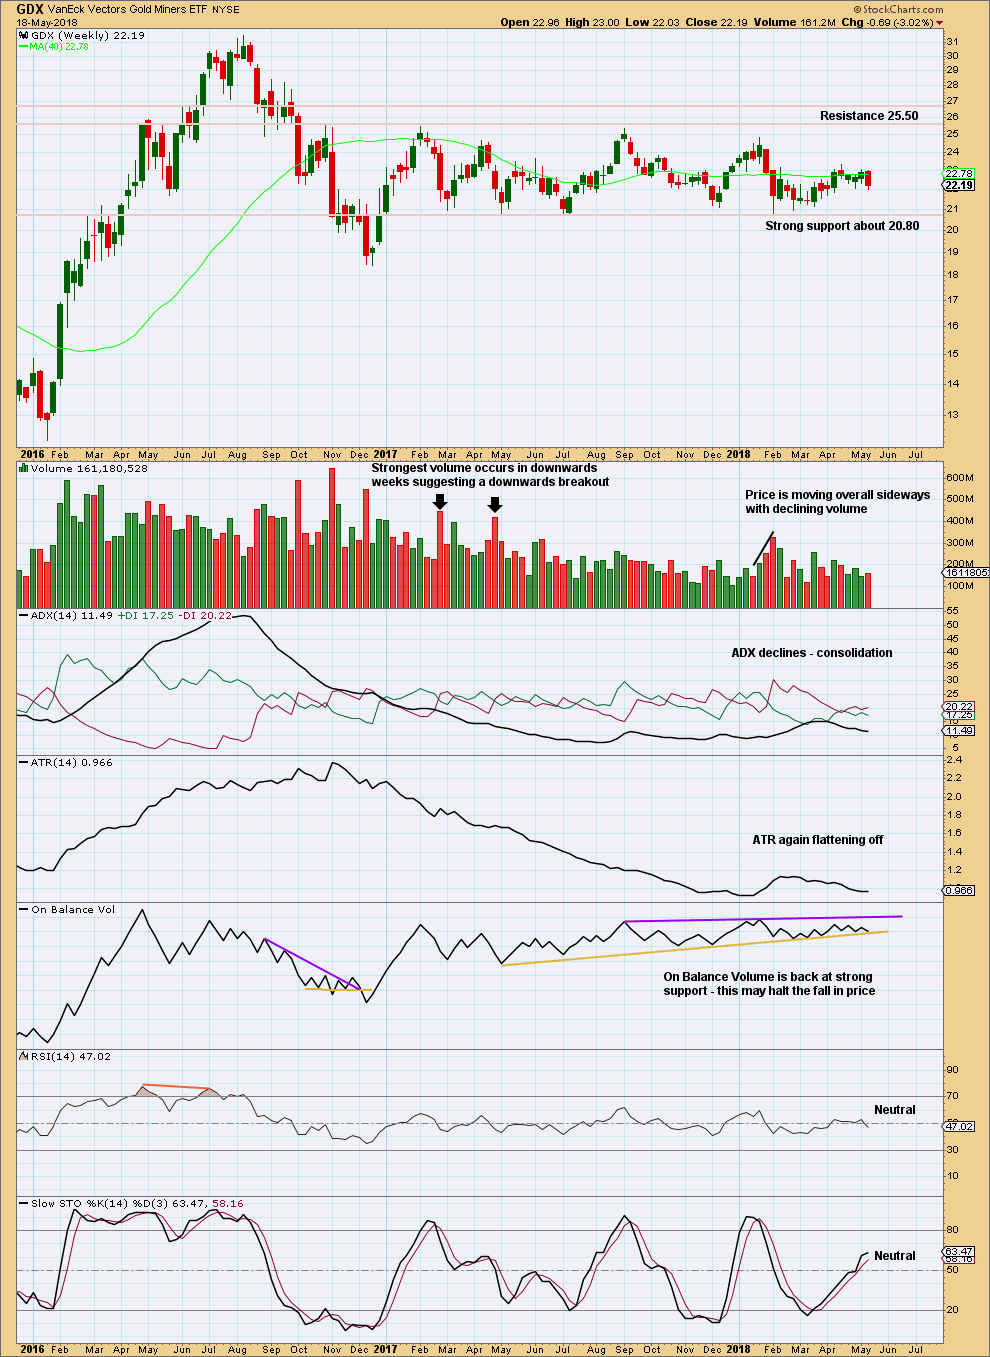
Click chart to enlarge. Chart courtesy of StockCharts.com.
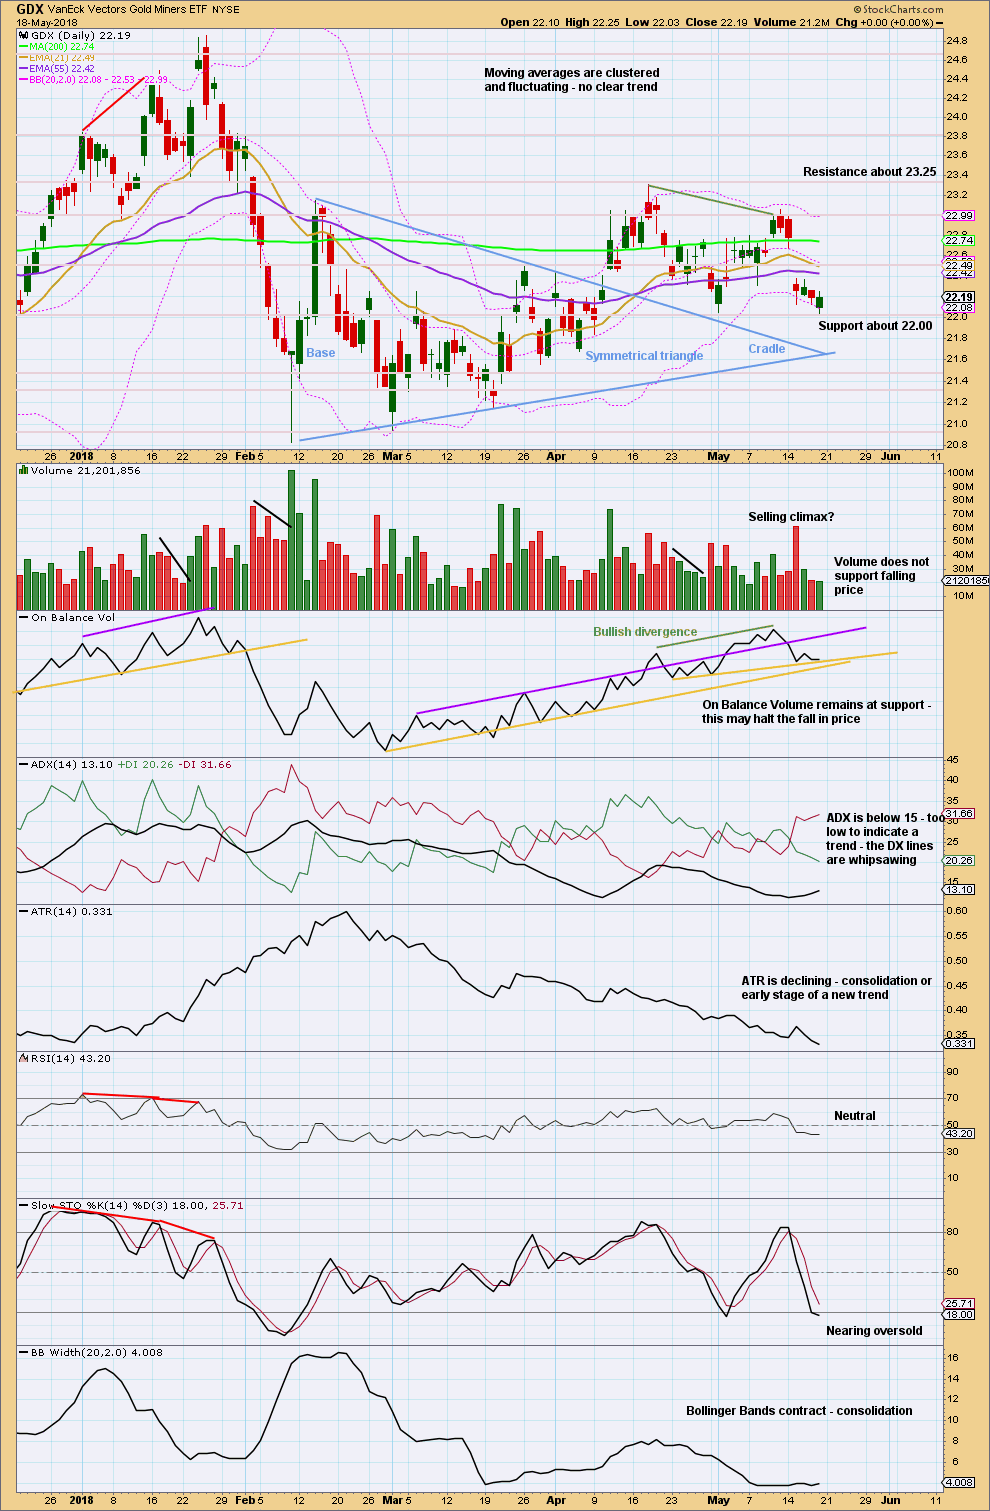
Support about 20.80 has been tested about eight times and so far has held. The more often a support area is tested and holds, the more technical significance it has.
In the first instance, expect this area to continue to provide support. Only a strong downwards day, closing below support and preferably with some increase in volume, would constitute a downwards breakout from the consolidation that GDX has been in for a year now.
Resistance is about 25.50. Only a strong upwards day, closing above resistance and with support from volume, would constitute an upwards breakout.
Overall, a slow upwards swing may be underway. Do not expect it to move in a straight line; it may have downwards weeks within it.
GDX DAILY CHART
Click chart to enlarge. Chart courtesy of StockCharts.com.
On trading triangles from Dhalquist and Kirkpatrick, page 319:
“The ideal situation for trading triangles is a definite breakout, a high trading range within the triangle, an upward-sloping volume trend during the formation of the triangle, and especially a gap on the breakout. These patterns seem to work better with small-cap stocks in a rising market.
Although triangles are plentiful, their patterns suffer from many false and premature breakouts. This requires that a very strict breakout rule be used, either a wide filter or a number of closes outside the breakout zone. It also requires a close protective stop at the breakout level in case the breakout is false. Once these defensive levels have been exceeded, and price is on its way, the trader can relax for a little while because the failure rate after a legitimate breakout is relatively low. Trailing stops should then be placed at each preceding minor reversal.
…. in symmetrical triangles, the best performance comes from late breakouts in the 73% – 75% distance.
Volume on the breakout seems more desirable in symmetrical triangles.”
In this case, the breakout has come 61% of the triangle length from base to cradle. Volume towards the end of the triangle declined. The breakout is accompanied by a gap and has good support from volume.
Pullbacks occur 59% of the time for symmetrical triangles.
The pullback has continued lower. Price remains at support about 22.00, and On Balance Volume remains at support. So far this still looks like another test of lows during the pullback.
Bullish divergence between price and On Balance Volume at the last highs still remains valid, and it still supports the idea of new highs from price to follow through.
US OIL
Last analysis expected more upwards movement for the week, which is what has happened.
Summary: Classic technical analysis remains overly bullish. There is an upwards trend in place. Pullbacks are an opportunity to join the trend.
The mid term target is now at 97.92. A longer term target is at 106.25.
For the short term, if price makes a new low below 66.86, then a deeper pullback may be underway. The target would be at 63.54.
Always practice good risk management as the most important aspect of trading. Always trade with stops and invest only 1-5% of equity on any one trade. Failure to manage risk is the most common mistake new traders make.
MAIN WAVE COUNT
MONTHLY CHART
Click chart to enlarge.
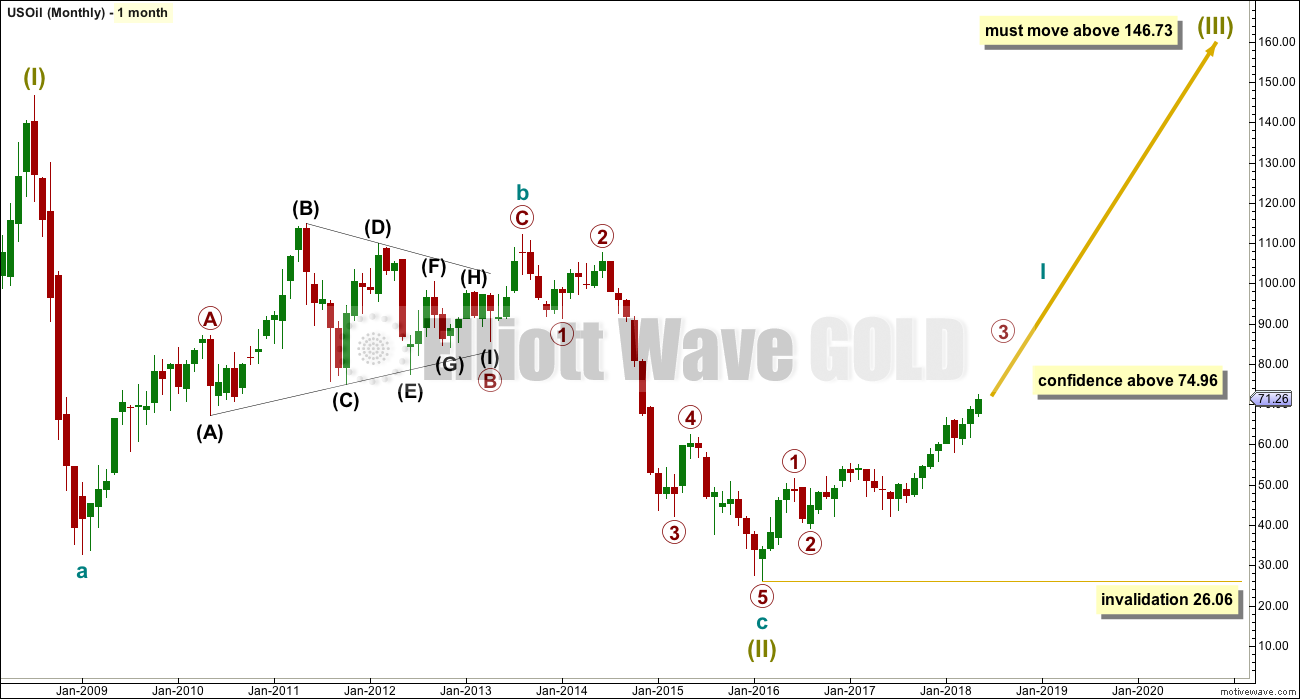
It is possible that the bear market for Oil is over and a new bull market is in the very early stages.
A huge zigzag down to the last low may be complete and is labelled here Super Cycle wave (II).
Cycle wave b must be seen as complete in August 2013 for this wave count to work. It cannot be seen as complete at the prior major swing high in May 2011.
Cycle wave b is seen as a zigzag, and within it primary wave B is seen as a running contracting triangle. These are fairly common structures, although nine wave triangles are uncommon. All subdivisions fit.
Primary wave C moves beyond the end of primary wave A, so it avoids a truncation. But it does not have to move above the price territory of primary wave B to avoid a truncation, which is an important distinction.
If cycle wave b begins there, then cycle wave c may be seen as a complete five wave impulse.
Super Cycle wave (III) must move beyond the end of Super Cycle wave (I). It must move far enough above that point to allow room for a subsequent Super Cycle wave (IV) to unfold and remain above Super Cycle wave (I) price territory.
Cycle wave I may be incomplete. It may be ready to move through the middle and end of its third wave at primary degree, which may be the strongest upwards portion of cycle wave I; a strong increase in momentum and range may be ahead.
When cycle wave I is complete, then cycle wave II may be a deep correction that may not move beyond the start of cycle wave I below 26.06.
Data from FXCM for USOil does not go back to the beginning of Super Cycle wave (I). Without an accurate known length of Super Cycle wave (I) a target cannot be calculated for Super Cycle wave (III) to end using Fibonacci ratios. The target for Super Cycle wave (III) may be calculated when cycle waves I, II, III and IV within it are complete. That cannot be done for many years.
WEEKLY CHART
Click chart to enlarge.
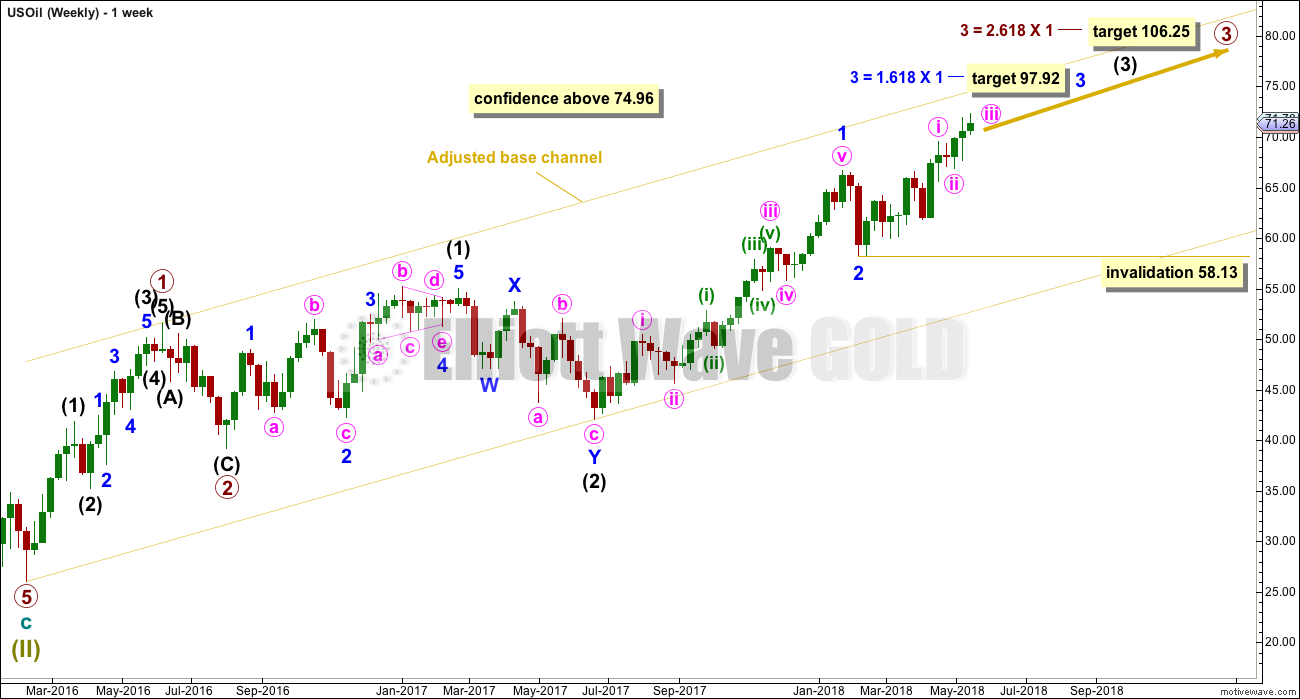
If a new bull market is in the very early stages for Oil, then it may have begun with two overlapping first and second waves at primary then at intermediate degree.
Primary wave 3 may only subdivide as an impulse, and within it intermediate wave (3) may be incomplete.
Within intermediate wave (3), only minor waves 1 and 2 may be complete. Minor wave 3 may have just begun. The most common Fibonacci ratio is used to calculate a target for it to end. Minor wave 3 may only subdivide as an impulse, and within it minute wave ii may not move beyond the start of minute wave i below 58.13.
A target is calculated for primary wave 3 to end, which fits with the lower target for minor wave 3 to end.
Commodities typically exhibit swift and strong fifth waves within their impulses, and this tendency is particularly common for third wave impulses. Intermediate wave (5) may be a swift strong upwards wave when it arrives.
DAILY CHART
Click chart to enlarge.
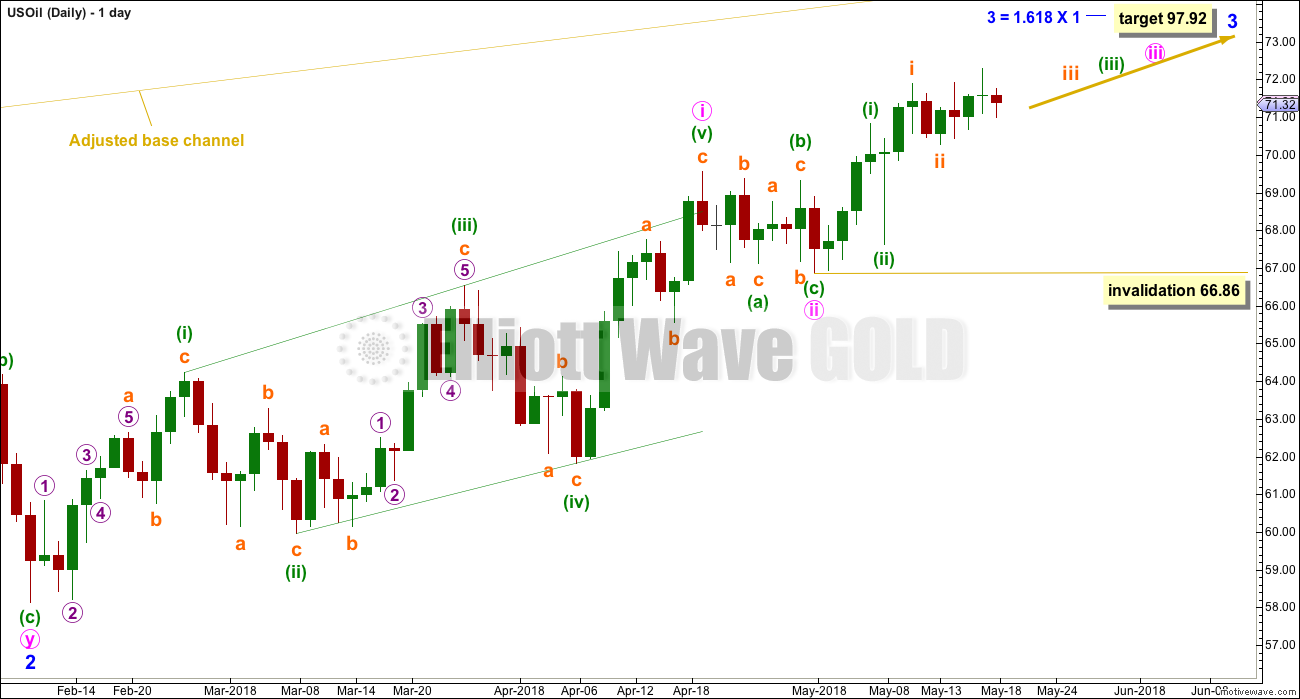
Minor wave 3 may have begun with a leading expanding diagonal for minute wave i.
It is possible that minute wave ii may be over as a relatively brief and shallow regular flat correction.
Although it would be unusual for a second wave correction following a first wave leading diagonal to be this shallow, continuing upwards movement shows that this wave count is now more likely correct.
This wave count would now expect explosive upwards movement.
Within minute wave iii, no second wave correction may move beyond its start below 66.86.
DAILY CHART II
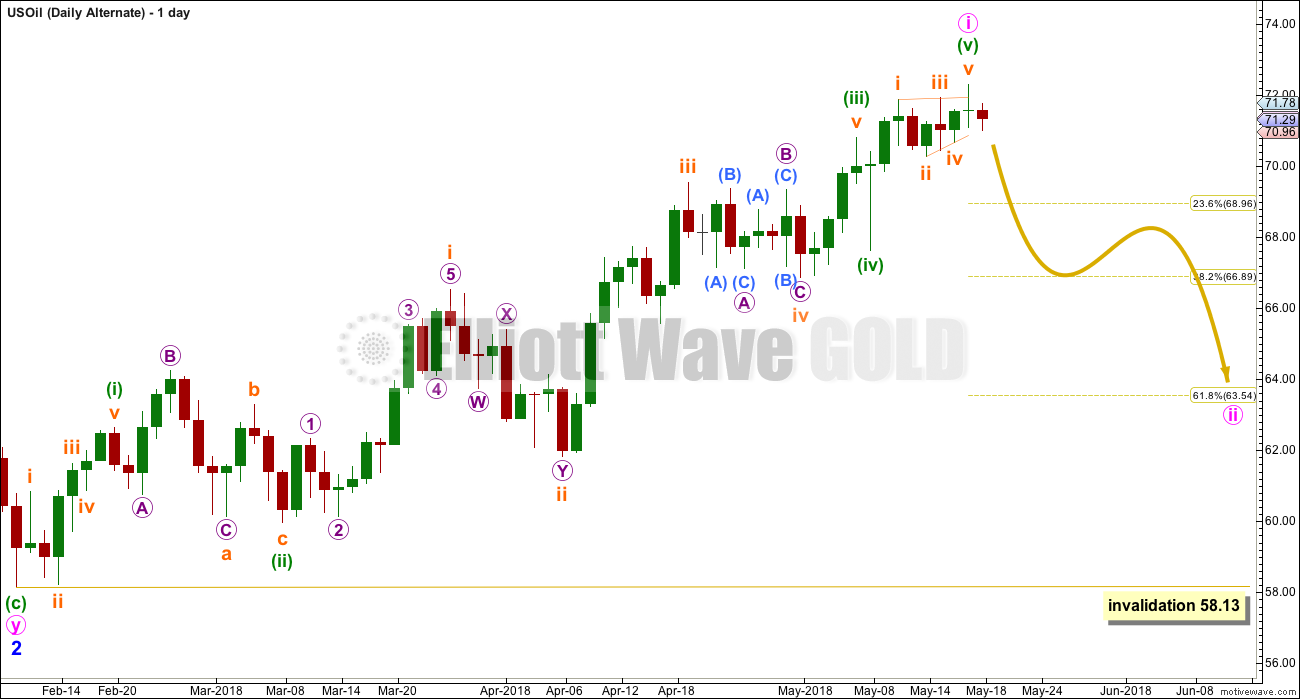
Click chart to enlarge.
It is again possible to see another impulse complete at the last high. This may be minute wave i.
If price makes a new low below 66.86, then a deeper pullback may have begun. The target would be the 0.618 Fibonacci ratio at 63.54.
A problem with this wave count is subminuette wave iii because this wave looks like a three and not a five.
There is a second problem this week. Minuette wave (v) is labelled as an ending contracting diagonal. For this to work, subminuette wave iv within it must end with a reasonable truncation. This problem must necessarily reduce the probability of this wave count.
This wave count does not have good support from classic technical analysis, so it is judged to have a lower probability.
ALTERNATE WAVE COUNT
MONTHLY CHART
Click chart to enlarge.
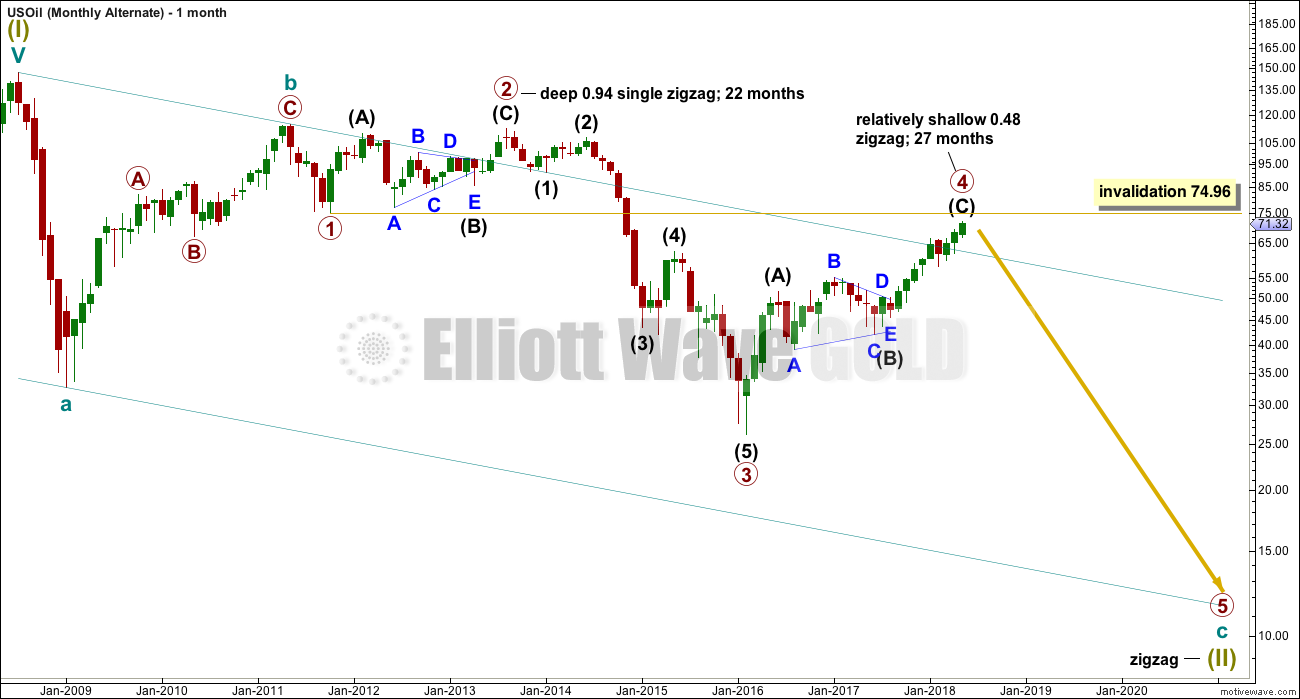
Within the bear market, cycle wave b is seen as ending in May 2011. Thereafter, a five wave structure downwards for cycle wave c begins.
Primary wave 1 is a short impulse lasting five months. Primary wave 2 is a very deep 0.94 zigzag lasting 22 months. Primary wave 3 is a complete impulse with no Fibonacci ratio to primary wave 1. It lasted 30 months.
There is alternation in depth with primary wave 2 very deep and primary wave 4 relatively shallow. There is inadequate alternation in structure, both are zigzags. So far primary wave 4 has lasted 27 months. At this stage, there is still reasonable proportion between primary waves 2 and 4.
Primary wave 4 may not move into primary wave 1 price territory above 74.96.
The wider Elliott channel (teal) about this whole movement may offer support to primary wave 5.
WEEKLY CHART
Click chart to enlarge.
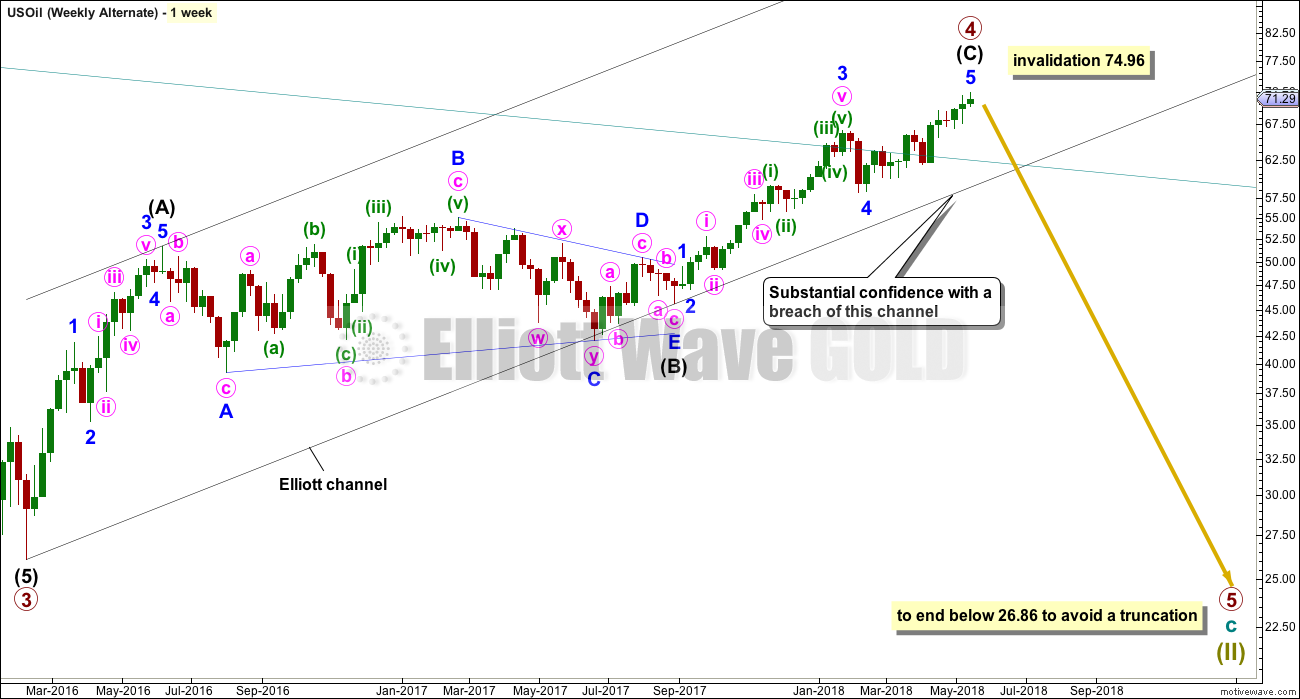
This wave count now expects a huge trend change for a new wave down for primary wave 5, which may last about a year or so. Primary wave 5 would be likely to make at least a slight new low below 26.86 to move below the end of primary wave 3 and avoid a truncation.
An Elliott channel is added to this possible zigzag for primary wave 4. A breach of the lower edge of this channel would provide a very strong indication that primary wave 4 should be over and primary wave 5 should be underway. Look out for some support on the way down, perhaps a short term bounce about the lower edge of the channel.
DAILY CHART
Click chart to enlarge.
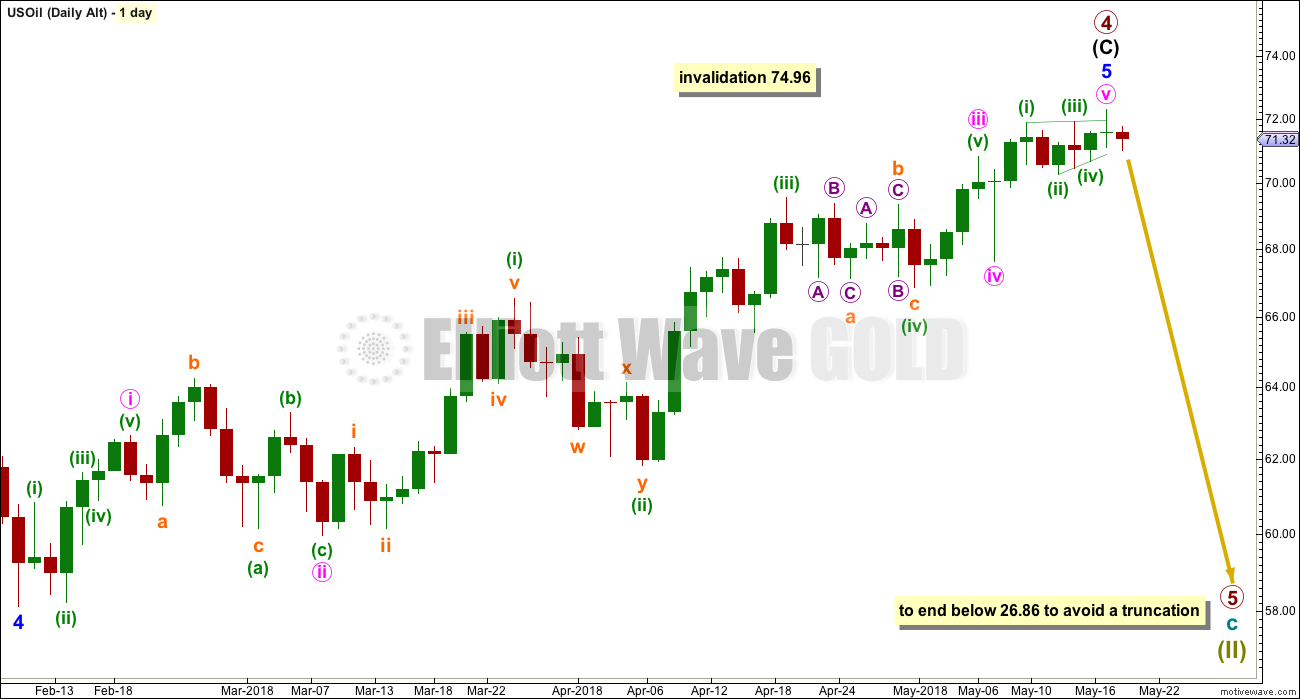
Minor wave 5 will subdivide as an impulse. The same two problems are seen here as for the other alternate daily wave count: minuette wave (iii) looks like a three but should be a five, and the ending diagonal of minute wave v includes a truncation for minuette wave (iv).
There is almost no room left for primary wave 4 to move into. If this alternate wave count is correct, then price must reverse here or very soon indeed.
A new low below 58.13 would add a little confidence to this wave count. It would also require a breach of the black channel on the weekly chart for reasonable confidence.
TECHNICAL ANALYSIS
MONTHLY CHART
Click chart to enlarge. Chart courtesy of StockCharts.com.
For the last four months all now complete, the volume profile is bullish. There are now three completed monthly candlesticks with long lower wicks.
This chart is overwhelmingly bullish. It supports the main Elliott wave count.
Strong volume for the month of June 2017 may have been a selling climax. This is typical behaviour of commodities.
The strongest recent volume is a downwards month for August 2017. This is the only bearish indication on this chart.
DAILY CHART
Click chart to enlarge. Chart courtesy of StockCharts.com.
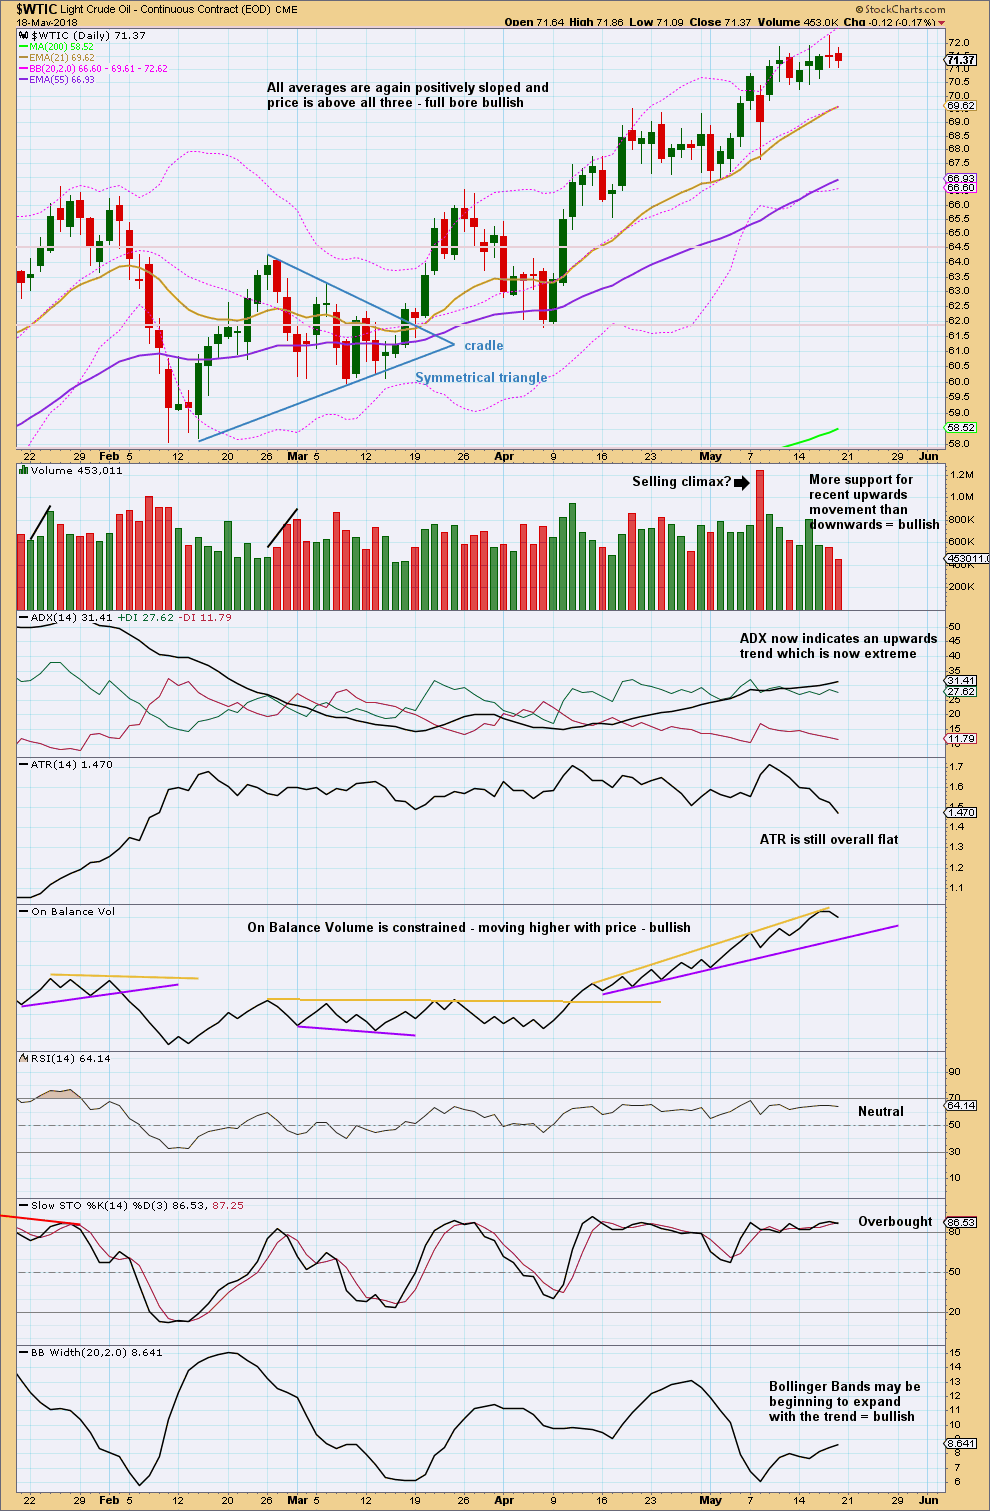
ADX may reach very extreme, and remain there for a long period of time, when Oil has a strong trend. Stochastics may reach overbought and remain so for a very long time. Neither of these indicators are useful in predicting the end of a trend.
At this time, Oil is moving through an area with little prior support to offer resistance. Next resistance is about 72.50, which is weak.
RSI is not yet overbought. Only when RSI is overbought and then exhibits clear divergence with price should a reasonable correction be expected as likely.
This chart is very bullish and supports the main Elliott wave count. The short term volume profile is also bullish.
There is some small cause for concern for bulls that this week ATR may be beginning to show some decline.
Comment today for the S&P500:
The AD line today makes a new high with strong upwards movement, this is almost vertical.
I put a lot of weight on this indicator. With it moving so strongly higher I am now considering that not only should price follow on through, but on the way up now pullbacks may be more brief and shallow than many traders may expect.
Look out for upwards movement from price to continue, and use the little corrections as opportunities to join the trend. Allow the market room to move for longer term trades, place stops a reasonable distance away, and be prepared to hold an underwater position for about three or four days if your timing is a bit off.
Reduce position size so that you risk only 1-5% of equity on any one trade.
With price right now below the high five sessions ago, this may still be a good entry point here.
Of all the three markets covered in Lara’s Weekly, it is the S&P500 of which I have the most confidence in my analysis at this time.