

S&P 500
Upwards movement has overall continued as the week expected, but the weekly candlestick has closed as a doji and price ended the week with mostly sideways movement.
Summary: The bottom line at the end of the week is price is range bound. To indicate the next movement there needs to be a breakout.
A new high above 2,813.49 would indicate the upwards trend remains intact. The target would then be at 2,856.
A breach of the black channel on the daily chart would indicate a deeper pullback has arrived for primary wave 2. Targets would be 2,635 and 2,525.
The biggest picture, Grand Super Cycle analysis, is here.
Last published monthly charts are here. Video is here.
ELLIOTT WAVE COUNT
WEEKLY CHART
Click chart to enlarge.
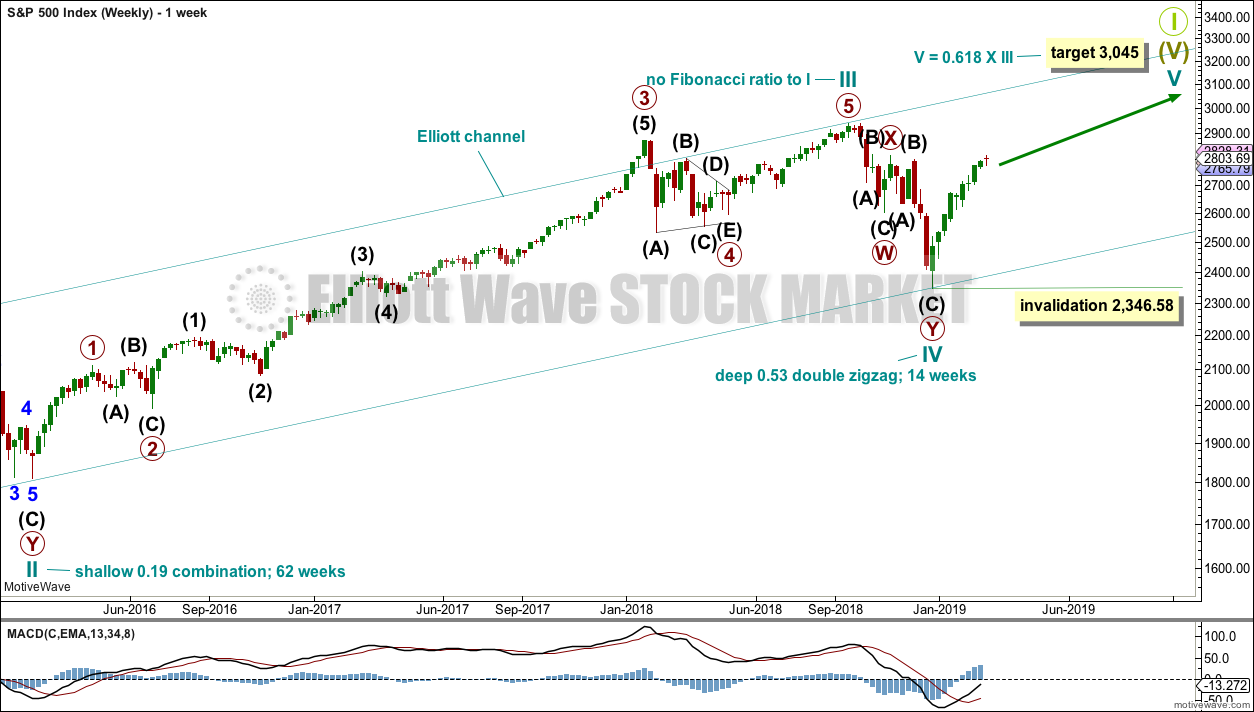
This weekly chart shows all of cycle waves III, IV and V so far.
Cycle wave II fits as a time consuming double combination: flat – X – zigzag. Combinations tend to be more time consuming corrective structures than zigzags. Cycle wave IV has completed as a multiple zigzag that should be expected to be more brief than cycle wave II.
Cycle wave IV may have ended at the lower edge of the Elliott channel.
Within cycle wave V, no second wave correction may move beyond the start of its first wave below 2,346.58.
Although both cycle waves II and IV are labelled W-X-Y, they are different corrective structures. There are two broad groups of Elliott wave corrective structures: the zigzag family, which are sharp corrections, and all the rest, which are sideways corrections. Multiple zigzags belong to the zigzag family and combinations belong to the sideways family. There is perfect alternation between the possible double zigzag of cycle wave IV and the combination of cycle wave II.
Although there is gross disproportion between the duration of cycle waves II and IV, the size of cycle wave IV in terms of price makes these two corrections look like they should be labelled at the same degree. Proportion is a function of either or both of price and time.
Draw the Elliott channel about Super Cycle wave (V) with the first trend line from the end of cycle wave I (at 2,079.46 on the week beginning 30th November 2014) to the high of cycle wave III, then place a parallel copy on the low of cycle wave II. Cycle wave V may find resistance about the upper edge.
It is possible that cycle wave V may end in October 2019. If it does not end there, or if the AD line makes new all time highs during or after June 2019, then the expectation for cycle wave V to end would be pushed out to March 2020 as the next possibility. Thereafter, the next possibility may be October 2020. March and October are considered as likely months for a bull market to end as in the past they have been popular. That does not mean though that this bull market may not end during any other month.
DAILY CHART
Click chart to enlarge.
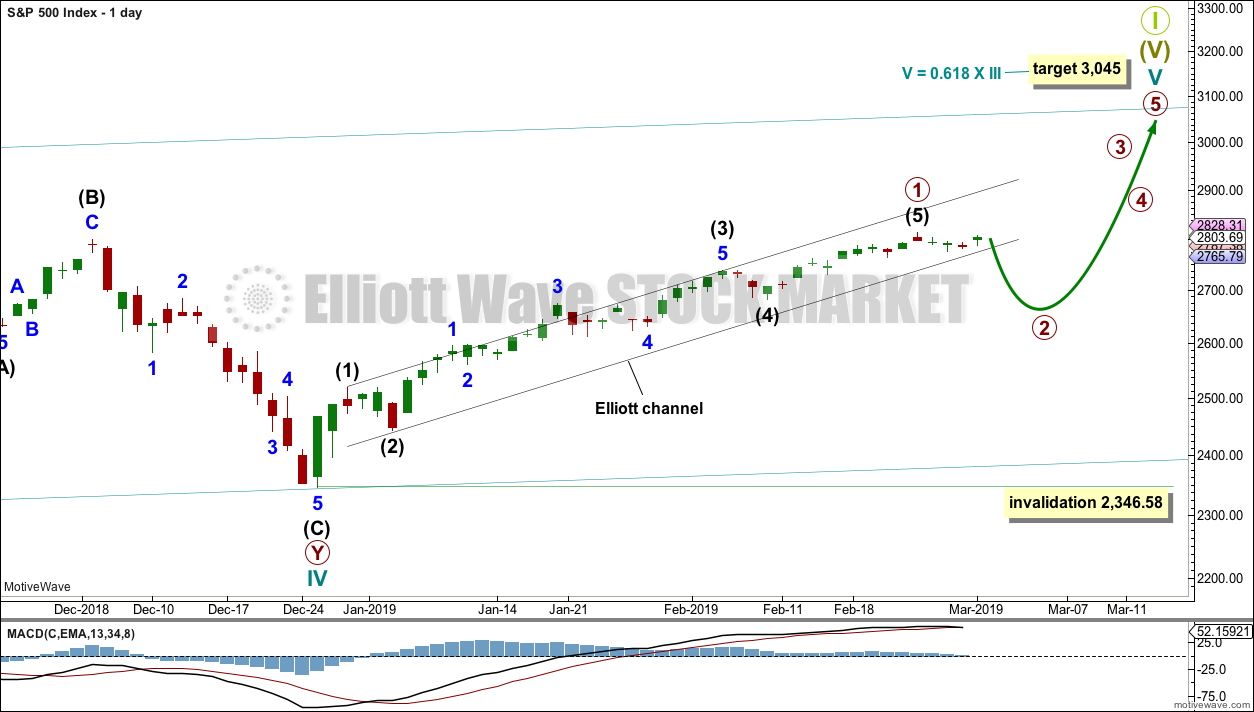
The daily chart will focus on the structure of cycle wave V.
Within Super Cycle wave (V), cycle wave III may not be the shortest actionary wave. Because cycle wave III is shorter than cycle wave I, this limits cycle wave V to no longer than equality in length with cycle wave III at 3,477.39. A target is calculated for cycle wave V to end prior to this point.
Cycle wave V must subdivide as a five wave motive structure, either an impulse or an ending diagonal. An impulse is much more common and that will be how it is labelled. A diagonal would be considered if overlapping suggests it.
Primary wave 1 is again labelled as possibly complete, but this labelling is tentative. A breach of the black channel is required for confidence that primary wave 1 is over and primary wave 2 has begun.
An Elliott channel is drawn about the impulse of primary wave 1. When a full daily candlestick prints below the lower edge of the channel and not touching the lower edge, that may be taken as confirmation of a trend change.
If price makes a new high next week by any amount at any time frame above 2,813.49, then primary wave 1 would be relabelled as incomplete and the target would be at 2,856.
Primary wave 2 may not move beyond the start of primary wave 1 below 2,346.58.
TECHNICAL ANALYSIS
WEEKLY CHART
Click chart to enlarge. Chart courtesy of StockCharts.com.
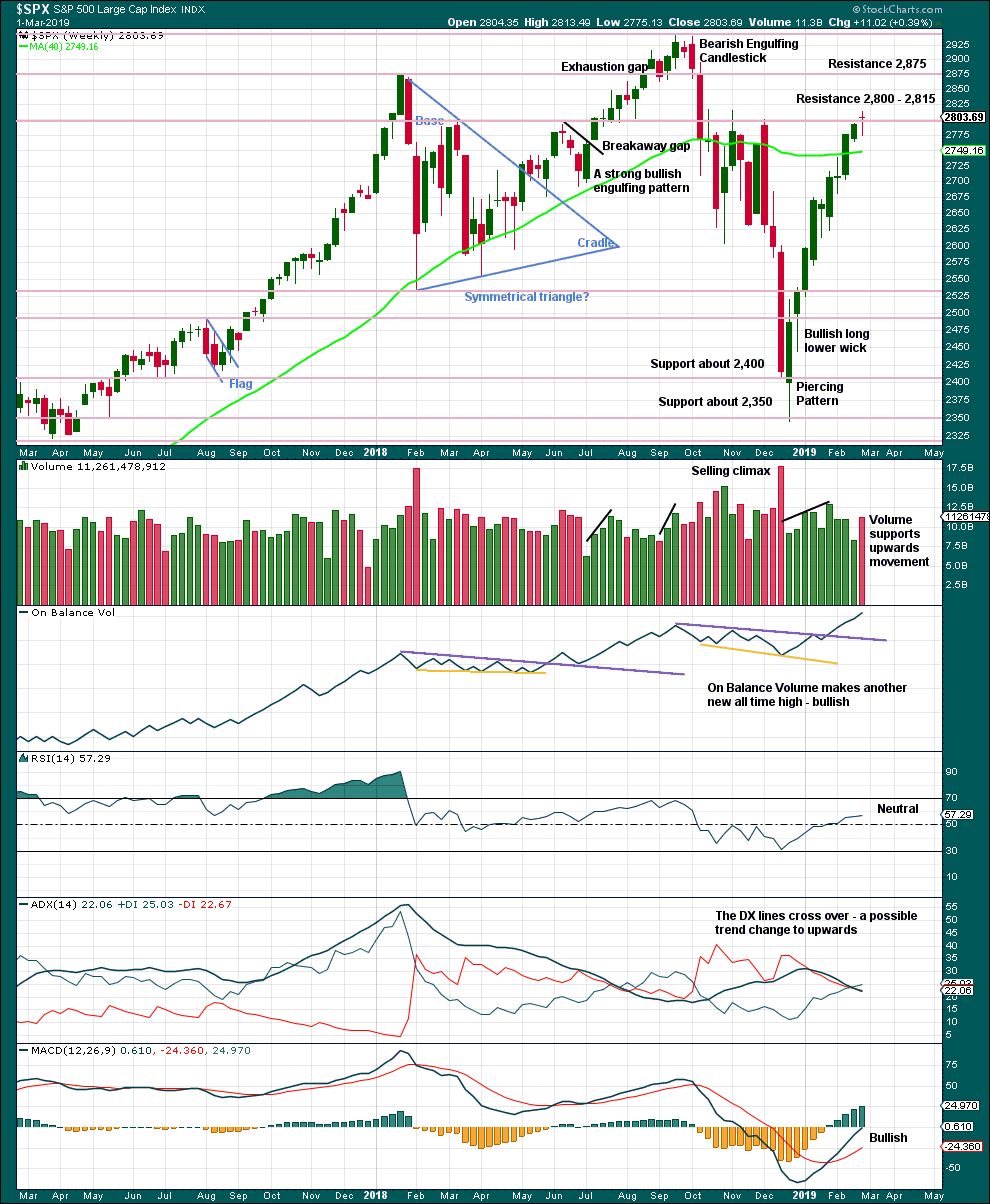
Volume and On Balance Volume are very bullish. But the doji candlestick this week again signals a warning. A doji on its own is not a reversal signal, but it is enough to put the trend from up into more neutral territory.
DAILY CHART
Click chart to enlarge. Chart courtesy of StockCharts.com.
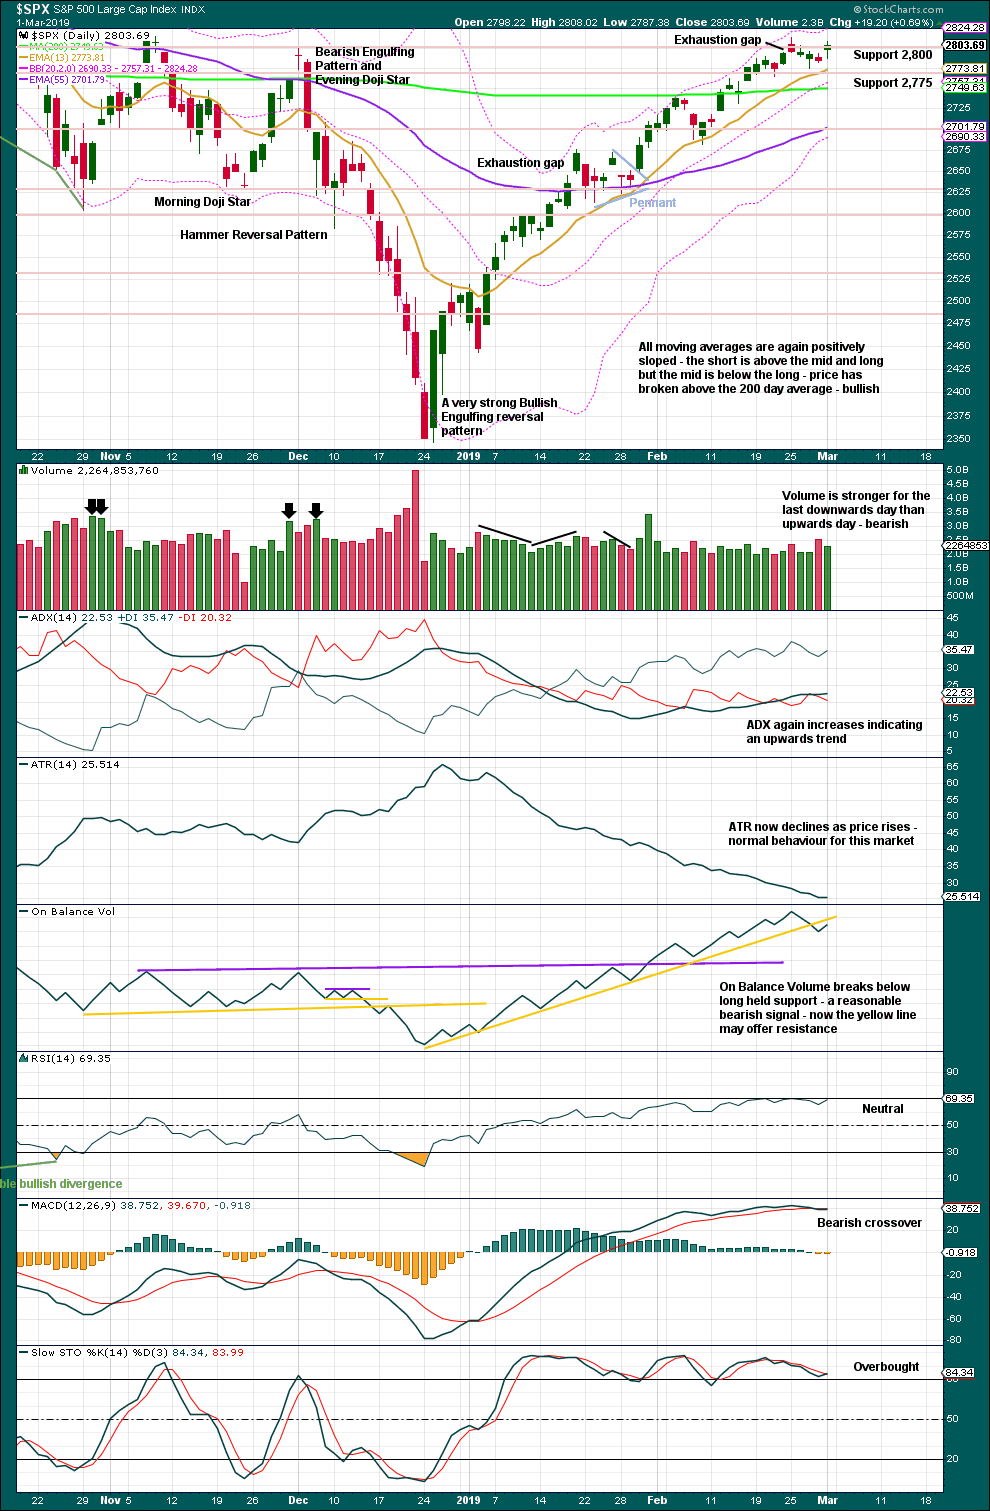
Over a fairly long period of time this ageing bull market has been characterised by upwards movement on light and declining volume and low ATR. For the short to mid term, little concern may be had if price now rises again on declining volume. Current market conditions have allowed for this during a sustained rise in price.
It is also normal for this market to have lower ATR during bullish phases, and strongly increasing ATR during bearish phases. Currently, declining ATR is normal and not of a concern.
Considering the larger picture from the Elliott wave count, some weakness approaching the end of Grand Super Cycle wave I is to be expected.
From Kirkpatrick and Dhalquist, “Technical Analysis” page 152:
“A 90% downside day occurs when on a particular day, the percentage of downside volume exceeds the total of upside and downside volume by 90% and the percentage of downside points exceeds the total of gained points and lost points by 90%. A 90% upside day occurs when both the upside volume and points gained are 90% of their respective totals”…
and “A major reversal is singled when an NPDD is followed by a 90% upside day or two 80% upside days back-to-back”.
The current situation saw two 80% downside days on December 20th and 21st, then a near 90% downside day with 88.97% downside on December 24th. This very heavy selling pressure on three sessions together may be sufficient to exhibit the pressure observed in a 90% downside day.
This has now been followed by two 90% upside days: on December 26th and again on 4th January.
The current situation looks very much like a major low has been found.
This chart is overall very bullish. Only the moving averages are not yet full bore bullish.
The last gap is now closed, so it is renamed an exhaustion gap. This is bearish and may be the first warning of a deeper pullback. But equally as likely, at this stage, it may only indicate another relatively brief pullback or sideways consolidation.
Yesterday’s bearish signal from On Balance Volume in conjunction with price halting at very strong resistance support the idea that primary wave 1 may be over and primary wave 2 may have begun.
Another new high would signal the bull run is not over.
BREADTH – AD LINE
WEEKLY CHART
Click chart to enlarge. Chart courtesy of StockCharts.com. So that colour blind members are included, bearish signals
will be noted with blue and bullish signals with yellow.
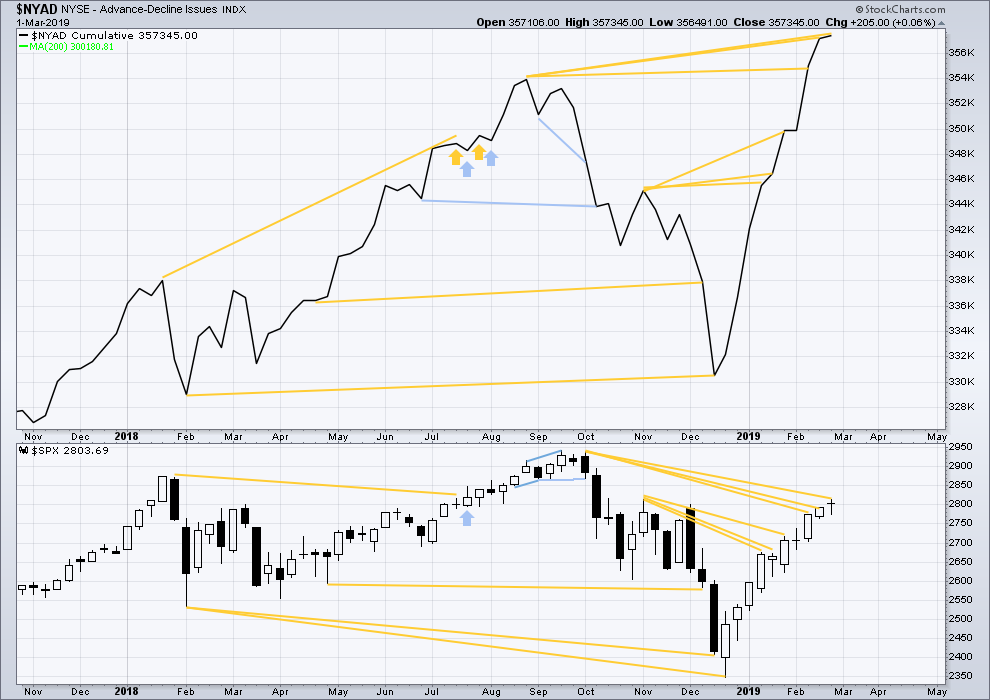
Every single bear market from the Great Depression and onwards has been preceded by a minimum of 4-6 months divergence between price and the AD line. With the AD line making a new all time high again this week, the end of this bull market and the start of a new bear market must be a minimum of 4 months away, which is mid to end June 2019 at this time.
DAILY CHART
Click chart to enlarge. Chart courtesy of StockCharts.com. So that colour blind members are included, bearish signals
will be noted with blue and bullish signals with yellow.
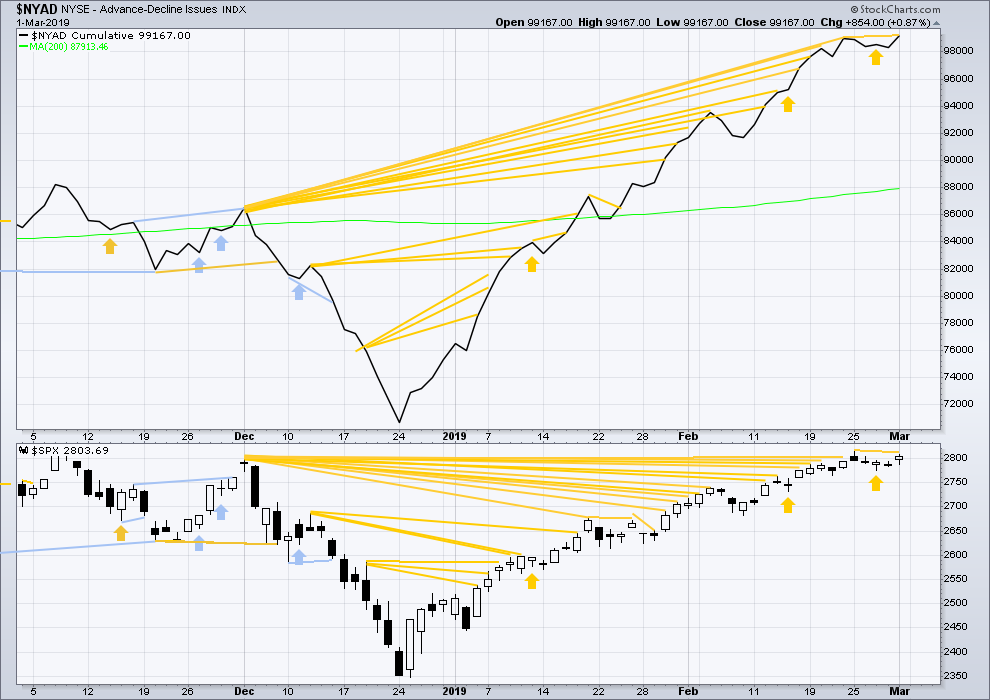
Breadth should be read as a leading indicator.
There is now a cluster of bullish signals from the AD line. This supports the Elliott wave count.
The AD line has made a slight new high above the prior high 4/5 sessions ago, but price has not. This divergence is bullish for the short term, but it is weak.
VOLATILITY – INVERTED VIX CHART
WEEKLY CHART
Click chart to enlarge. Chart courtesy of StockCharts.com. So that colour blind members are included, bearish signals
will be noted with blue and bullish signals with yellow.
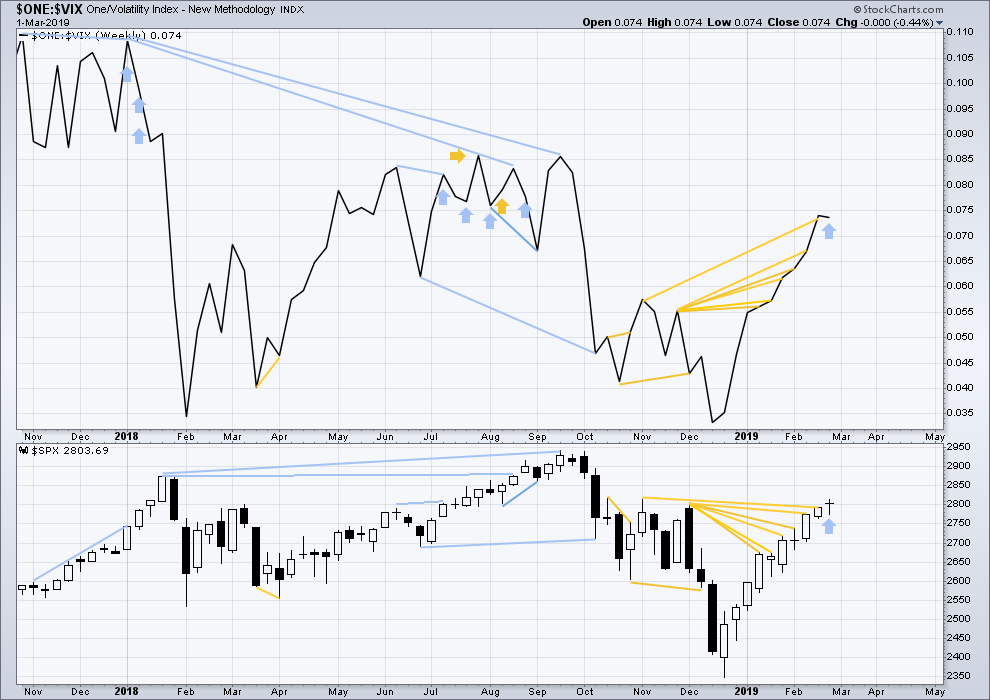
Upwards movement for this week came with a normal corresponding decline in VIX. There is no new divergence.
DAILY CHART
Click chart to enlarge. Chart courtesy of StockCharts.com. So that colour blind members are included, bearish signals
will be noted with blue and bullish signals with yellow.
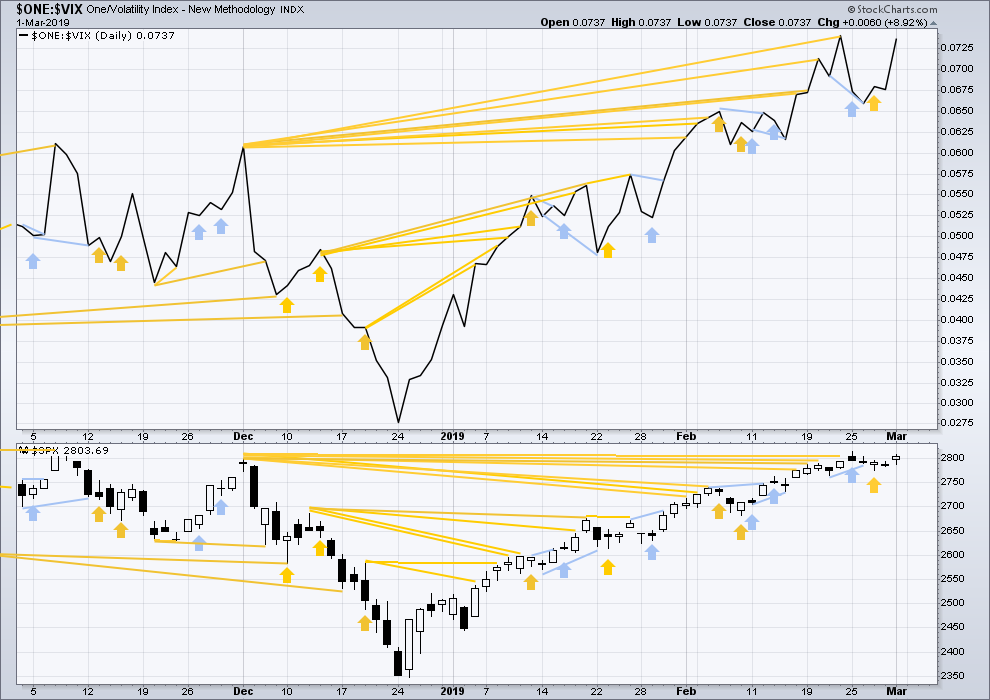
There is now a cluster of bullish signals from inverted VIX that support the Elliott wave count.
For Friday price moved higher, but inverted VIX moved lower. Upwards movement did not come with a normal corresponding decline in VIX; VIX has increased. This divergence is bearish for the short term.
DOW THEORY
Dow Theory confirms a bear market. This does not necessarily mean a bear market at Grand Super Cycle degree though; Dow Theory makes no comment on Elliott wave counts. On the 25th of August 2015 Dow Theory also confirmed a bear market. The Elliott wave count sees that as part of cycle wave II. After Dow Theory confirmation of a bear market in August 2015, price went on to make new all time highs and the bull market continued.
DJIA: 23,344.52 – a close on the 19th of December at 23,284.97 confirms a bear market.
DJT: 9,806.79 – price has closed below this point on the 13th of December.
S&P500: 2,532.69 – a close on the 19th of December at 2,506.96 provides support to a bear market conclusion.
Nasdaq: 6,630.67 – a close on the 19th of December at 6,618.86 provides support to a bear market conclusion.
With all the indices moving now higher, Dow Theory would confirm a bull market if the following highs are made:
DJIA: 26,951.81
DJT: 11,623.58
S&P500: 2,940.91
Nasdaq: 8,133.30.
GOLD
Downwards movement has continued exactly as the preferred Elliott wave count expected for the week.
Summary: The long term target is now calculated at 473. Confidence in this target may be had with a new low below 1,160.75.
For the short term, expect downwards movement to continue next week. It may exhibit increased momentum and strength.
Grand SuperCycle analysis is here.
Last historic analysis with monthly charts is here.
MAIN ELLIOTT WAVE COUNT
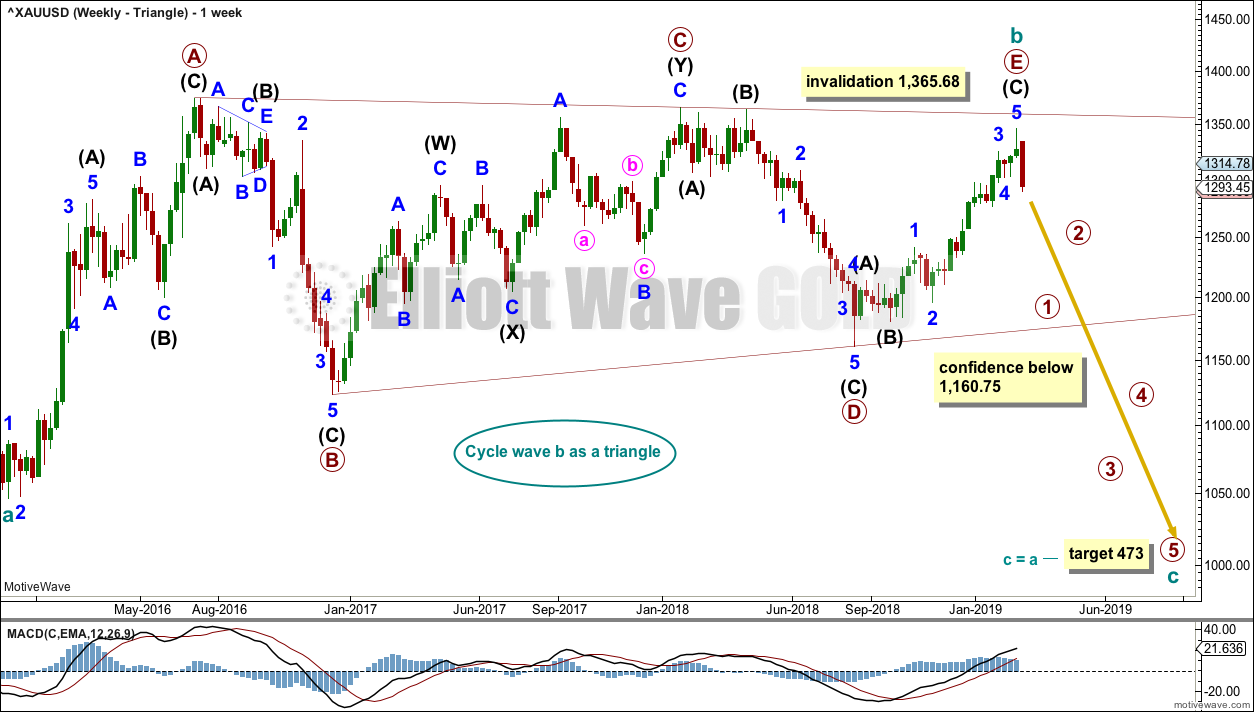
WEEKLY CHART – TRIANGLE
Click chart to enlarge.
This is the preferred wave count.
Cycle wave b may be a complete regular contracting triangle. If it continues further, then primary wave E may not move beyond the end of primary wave C above 1,365.68.
Four of the five sub-waves of a triangle must be zigzags, with only one sub-wave allowed to be a multiple zigzag. Wave C is the most common sub-wave to subdivide as a multiple, and this is how primary wave C for this example fits best.
There are no problems in terms of subdivisions or rare structures for this wave count. It has an excellent fit and so far a typical look.
This wave count would expect a cycle degree trend change has just occurred. Cycle wave c would most likely make new lows below the end of cycle wave a at 1,046.27 to avoid a truncation.
Primary wave E should exhibit reasonable weakness as it comes to an end. Triangles often end with declining ATR, weak momentum and weak volume.
If this weekly wave count is correct, then cycle wave c downwards should develop strength, ATR should show some increase, and MACD should exhibit an increase in downwards momentum.
A target is calculated for cycle wave c that expects to exhibit the most common Fibonacci ratio to cycle wave a.
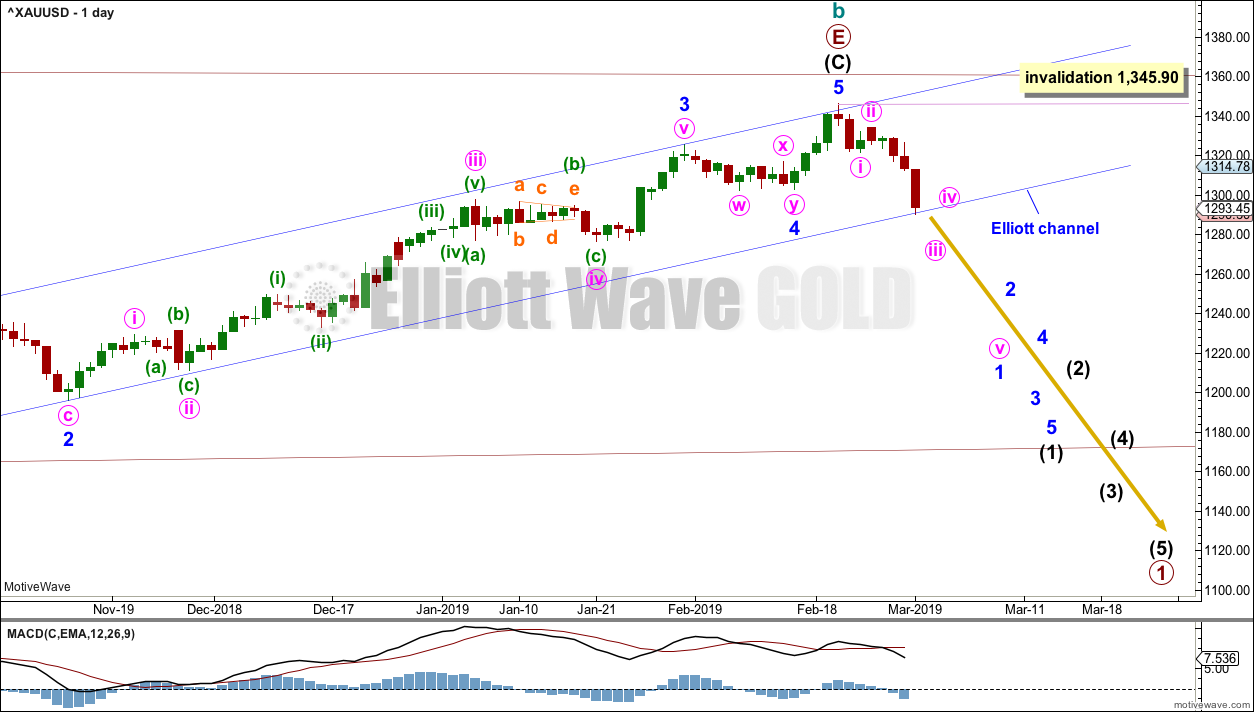
DAILY CHART – TRIANGLE
Click chart to enlarge.
The remaining two things are now required for confidence in this wave count:
1. A new low below support at 1,300 – this has occurred on Friday but only by the smallest of margins.
2. A breach of the blue Elliott channel.
Classic analysis at the end of this week offers good support to this wave count, so some confidence may be had in it.
Cycle wave c must subdivide as a five wave structure, either an impulse or an ending diagonal. An impulse is much more common and that shall be how it is labelled unless overlapping suggests a diagonal should be considered.
A new trend at cycle degree should begin with a five wave structure on the daily chart, which will be labelled minor wave 1. When minor wave 1 is complete, then minor wave 2 may not move beyond its start above 1,345.90.
A small bounce may develop at the lower edge of the blue channel. If price breaks below the blue channel, then another bounce may test resistance at the lower edge.
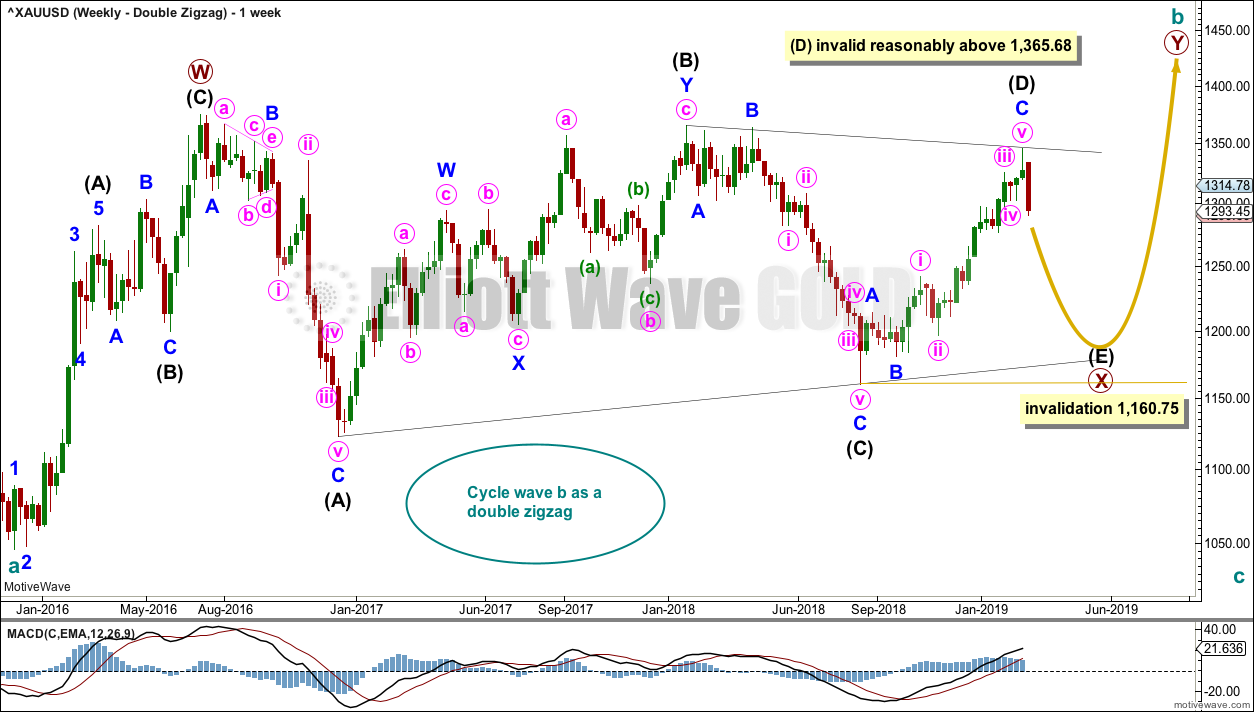
WEEKLY CHART – DOUBLE ZIGZAG
Click chart to enlarge.
It is possible that cycle wave b may be a double zigzag or a double combination.
The first zigzag in the double is labelled primary wave W. This has a good fit.
The double may be joined by a corrective structure in the opposite direction, a triangle labelled primary wave X. The triangle would be about four fifths complete.
Within multiples, X waves are almost always zigzags and rarely triangles. Within the possible triangle of primary wave X, it is intermediate wave (B) that is a multiple; this is acceptable, but note this is not the most common triangle sub-wave to subdivide as a multiple. These two points reduce the probability of this wave count.
Intermediate wave (D) may be complete. The (B)-(D) trend line is almost perfectly adhered to with the smallest overshoot within intermediate wave (C). This is acceptable.
Intermediate wave (E) should continue to exhibit weakness: ATR should continue to show a steady decline, and MACD may begin to hover about zero.
Intermediate wave (E) may not move beyond the end of intermediate wave (C) below 1,160.75.
This wave count may now expect downwards movement for several weeks.
Primary wave Y would most likely be a zigzag because primary wave X would be shallow; double zigzags normally have relatively shallow X waves.
Primary wave Y may also be a flat correction if cycle wave b is a double combination, but combinations normally have deep X waves. This would be less likely.
This wave count has good proportions and no problems in terms of subdivisions.
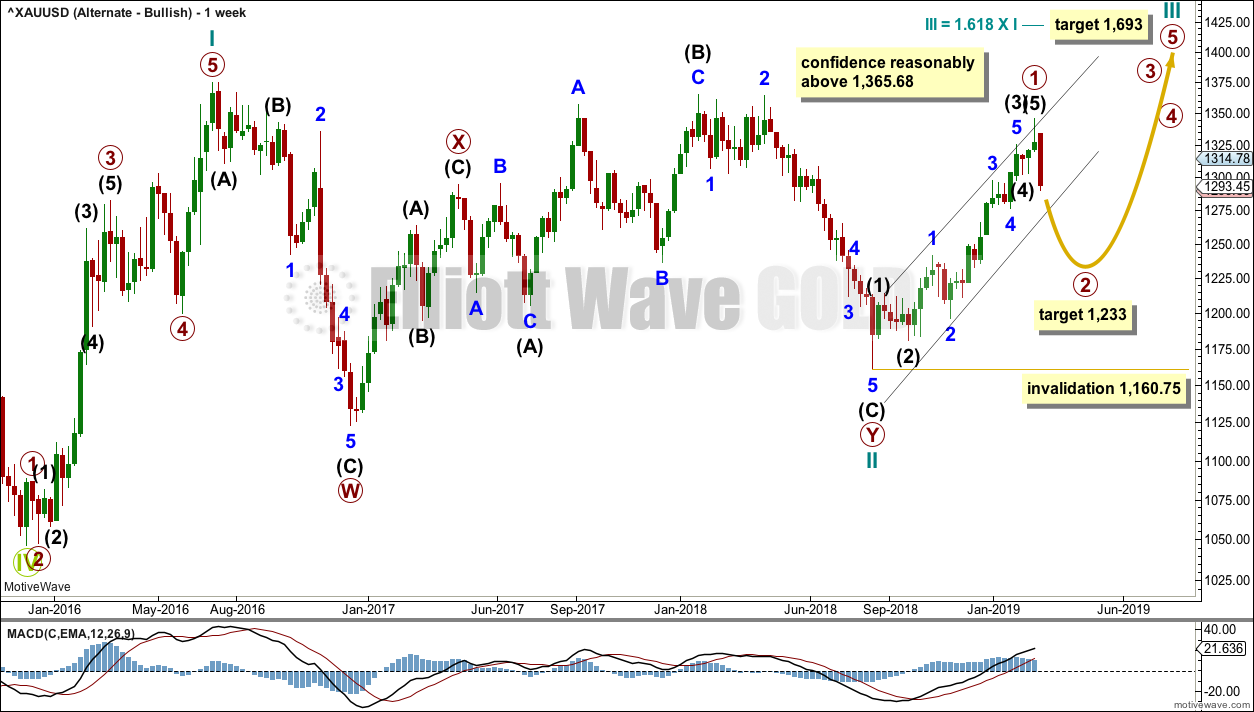
WEEKLY CHART – ALTERNATE BULLISH
Click chart to enlarge.
Because the preferred wave count is at a critical juncture in expecting a cycle degree trend change, it is time to consider an alternate which expects the continuation of the an upwards trend.
It is possible that the low in December 2015 was the end of a bear market and that Gold has been in a basing action for the past three years. Downwards movement to that low will subdivide as a double zigzag, a corrective structure.
If Gold is in a new bull market, then it should begin with a five wave structure upwards on the weekly chart. However, the biggest problem with this wave count is the structure labelled cycle wave I because this wave count must see it as a five wave structure, but it looks more like a three wave structure.
Commodities often exhibit swift strong fifth waves that force the fourth wave corrections coming just prior to be more brief and shallow than their counterpart second waves. It is unusual for a commodity to exhibit a quick second wave and a more time consuming fourth wave, and this is how cycle wave I is labelled. The probability of this wave count is low due to this problem.
Cycle wave II subdivides well as a double combination: zigzag – X – expanded flat.
Cycle wave III may have begun. Within cycle wave III, primary wave 1 may now be complete. The target for primary wave 2 is the 0.618 Fibonacci ratio of primary wave 1. Primary wave 2 may not move beyond the start of primary wave 1 below 1,160.75.
A black channel is drawn about primary wave 1. Primary wave 2 may breach the lower edge of this channel.
Cycle wave III so far for this wave count would have been underway now for 27 weeks. It should be beginning to exhibit some support from volume, increase in upwards momentum and increasing ATR. However, volume continues to decline, ATR continues to decline and is very low, and momentum is weak in comparison to cycle wave I. This wave count lacks support from classic technical analysis.
TECHNICAL ANALYSIS
WEEKLY CHART
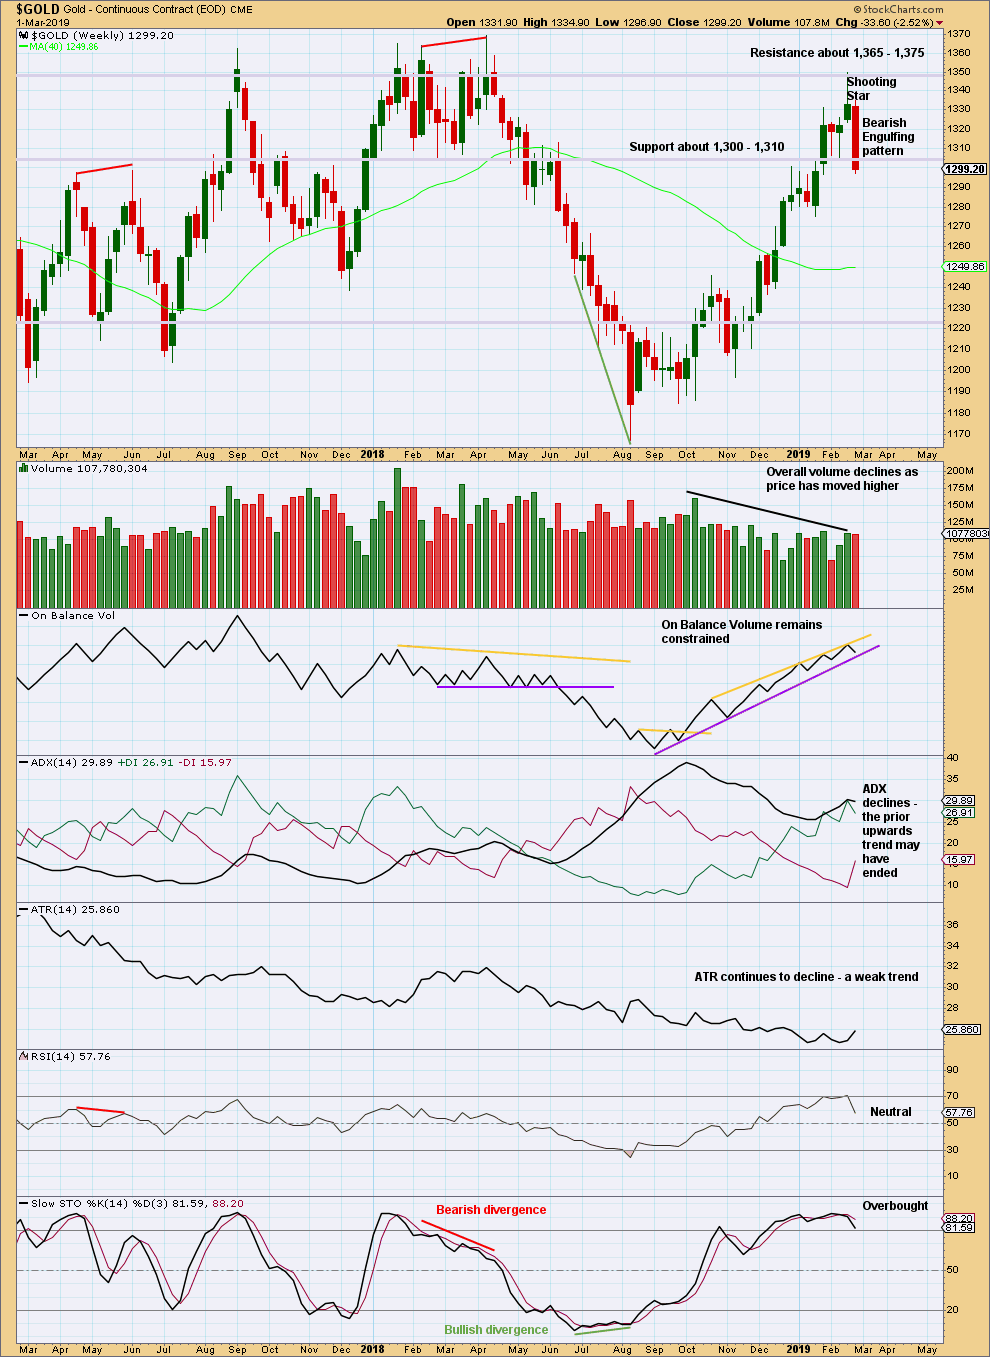
Click chart to enlarge. Chart courtesy of StockCharts.com.
There are now two bearish candlestick reversal patterns on the weekly chart: a Shooting Star and a Bearish Engulfing pattern. This supports the view that a high is in place.
DAILY CHART
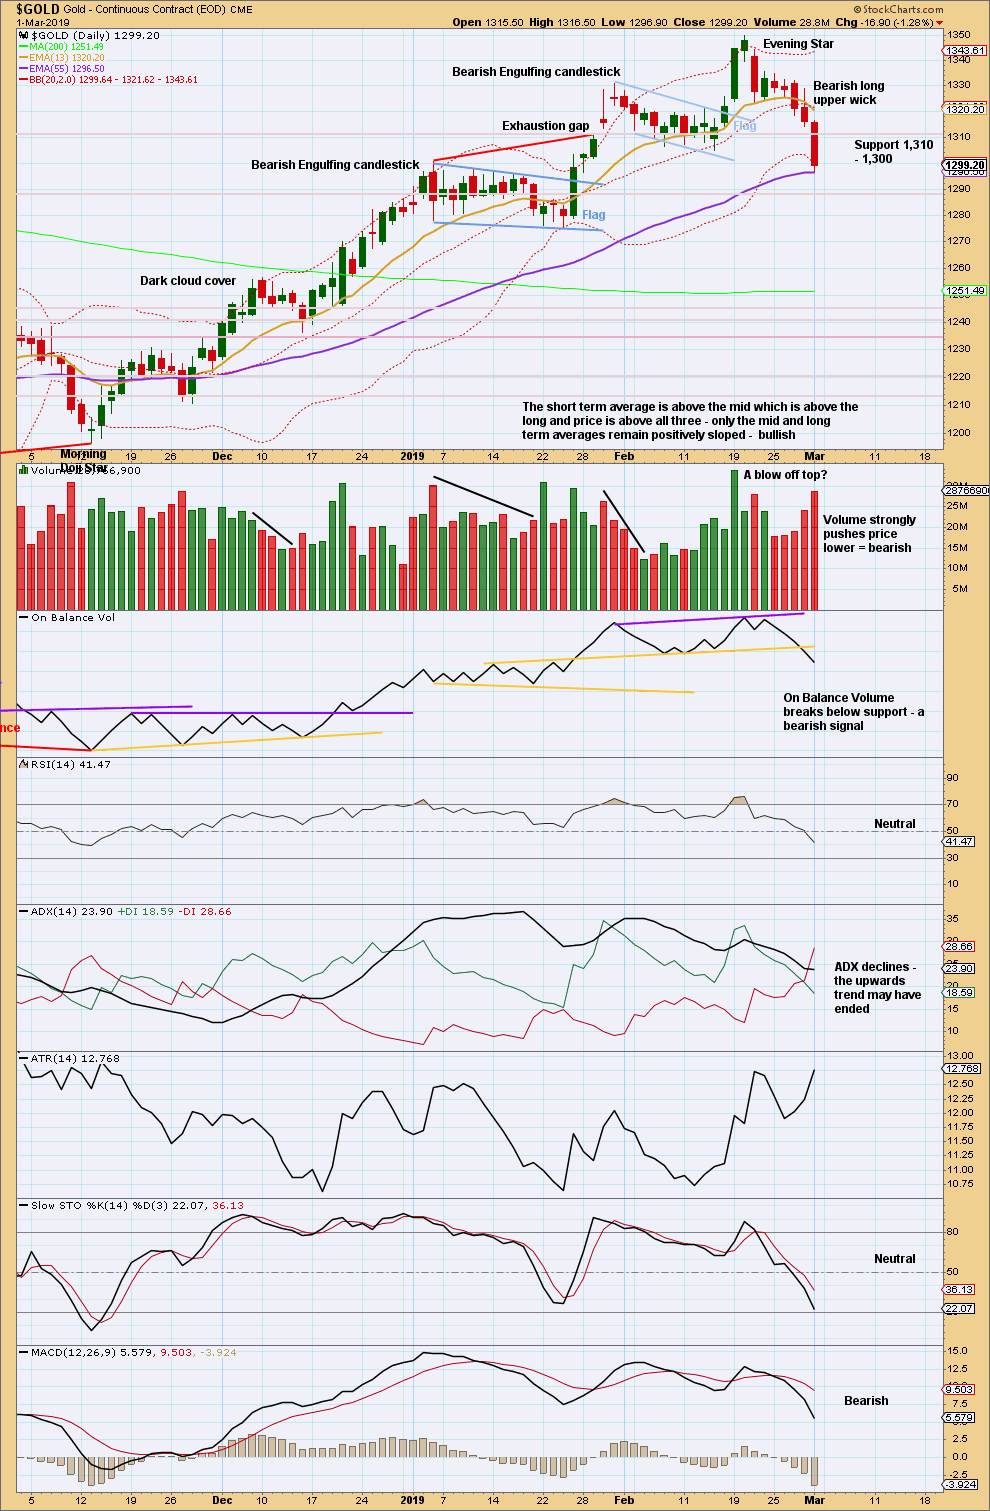
Click chart to enlarge. Chart courtesy of StockCharts.com.
The Evening Star reversal pattern indicates a trend change here to either down or sideways.
Price has closed below support at 1,300 but only just.
On Balance Volume has broken below support. This is a strong signal to offer support to the Elliott wave analysis.
After very strong volume on Friday, look for a small sideways movement about here before downwards movement resumes.
GDX WEEKLY CHART
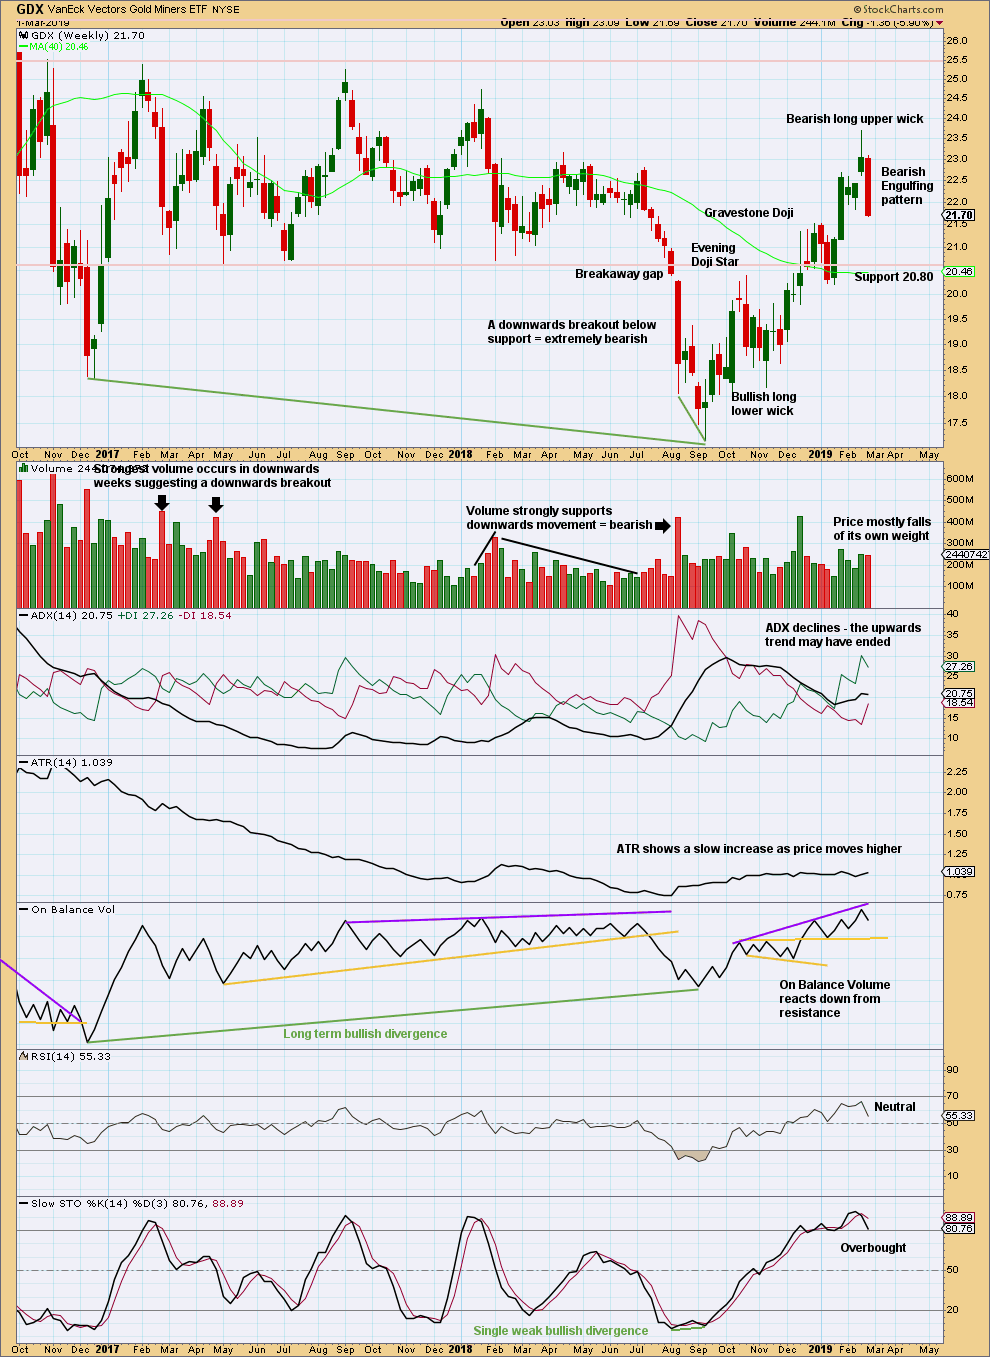
Click chart to enlarge. Chart courtesy of StockCharts.com.
The Bearish Engulfing pattern at the weekly chart level should be given weight in this analysis this week. It signals an end to the upwards trend and a new downwards or sideways trend.
GDX DAILY CHART
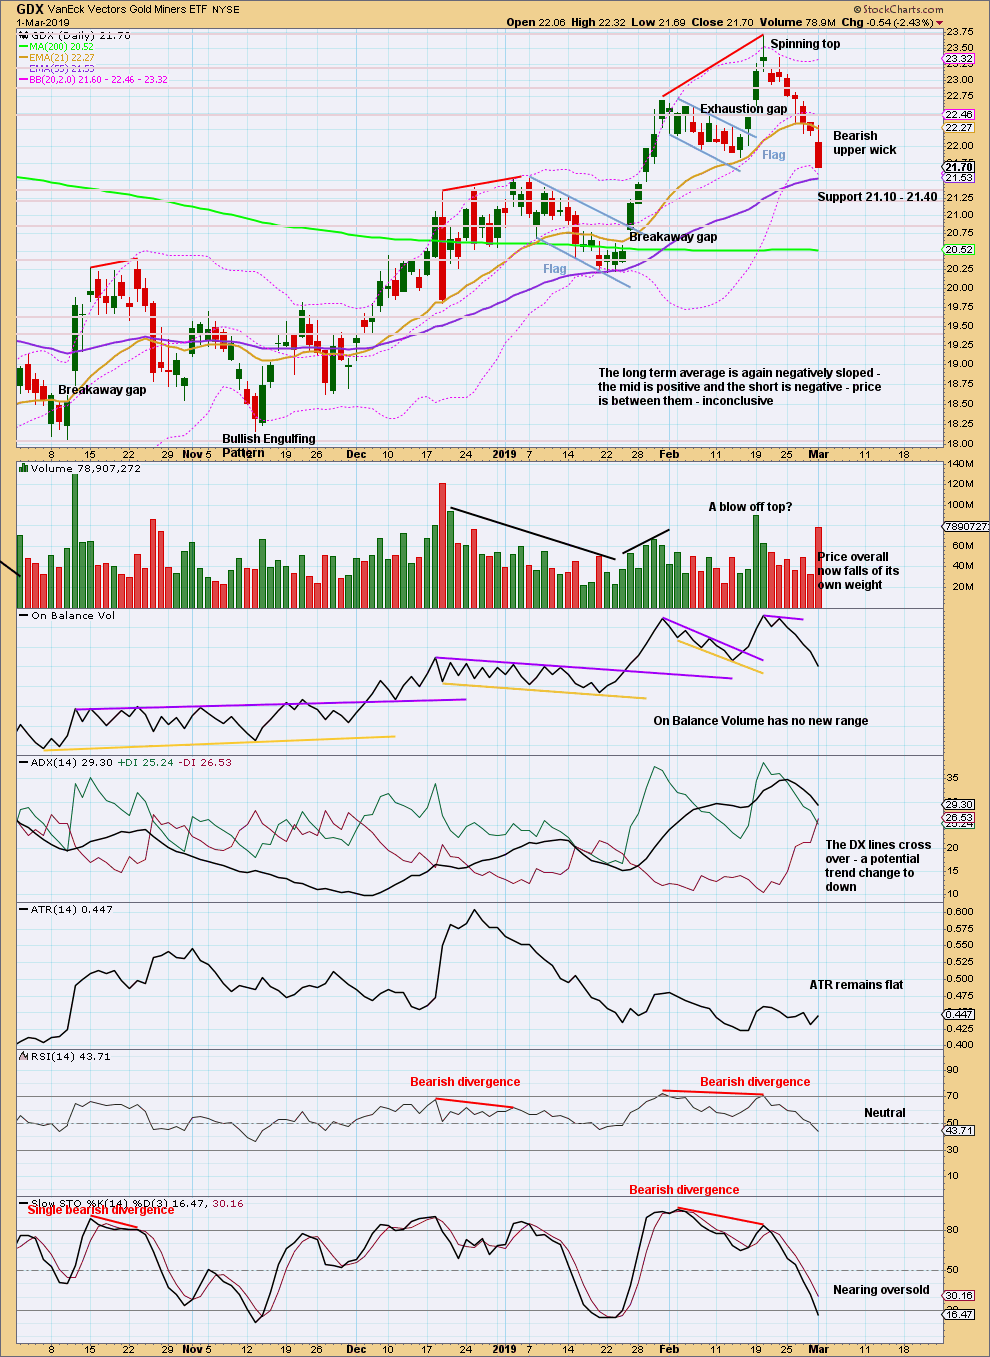
Click chart to enlarge. Chart courtesy of StockCharts.com.
A long upper wick and a close almost at the low for Friday’s session indicate more downwards movement may begin next week.
Look for next support about 21.40 to 21.10.
US OIL
Price remains within the channel on the daily chart.
Two daily Elliott wave counts are published for members this week.
Summary: While price remains within the channel, assume the trend may remain the same. The target remains at 63.19 to 63.71.
If the blue channel is breached, then expect a third wave down has begun that should make a reasonable new low below 42.37.
There is still weakness in upwards movement; it is possible a high may be in place. It may be best to wait for clarity before having confidence in the next direction of price from here.
The larger picture still sees Oil in a new downwards trend to end reasonably below 26.06.
MAIN ELLIOTT WAVE COUNT
MONTHLY CHART
Click chart to enlarge.
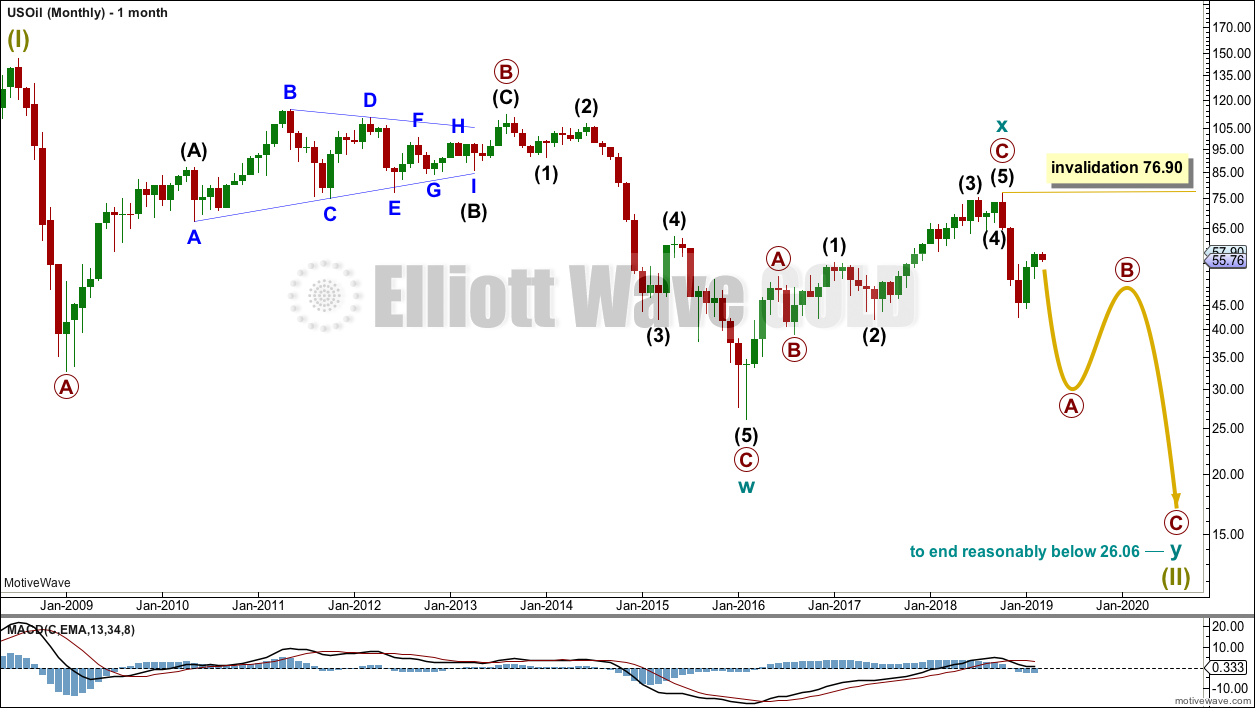
Classic technical analysis favours a bearish wave count for Oil at this time.
The large fall in price from the high in June 2008 to February 2016 is seen as a complete three wave structure. This large zigzag may have been only the first zigzag in a deeper double zigzag.
The first zigzag down is labelled cycle wave w. The double is joined by a now complete three in the opposite direction, a zigzag labelled cycle wave x.
The purpose of a second zigzag in a double is to deepen the correction when the first zigzag does not move price deep enough. Cycle wave y would be expected to move reasonably below the end of cycle wave w to deepen the correction. Were cycle wave y to reach equality with cycle wave w that takes Oil into negative price territory, which is not possible. Cycle wave y would reach 0.618 the length of cycle wave w at $2.33.
A better target calculation would be using the Fibonacci ratios between primary waves A and C within cycle wave y. This cannot be done until both primary waves A and B are complete.
Within cycle wave y, no second wave correction nor B wave may move beyond its start above 76.90.
WEEKLY CHART
Click chart to enlarge.
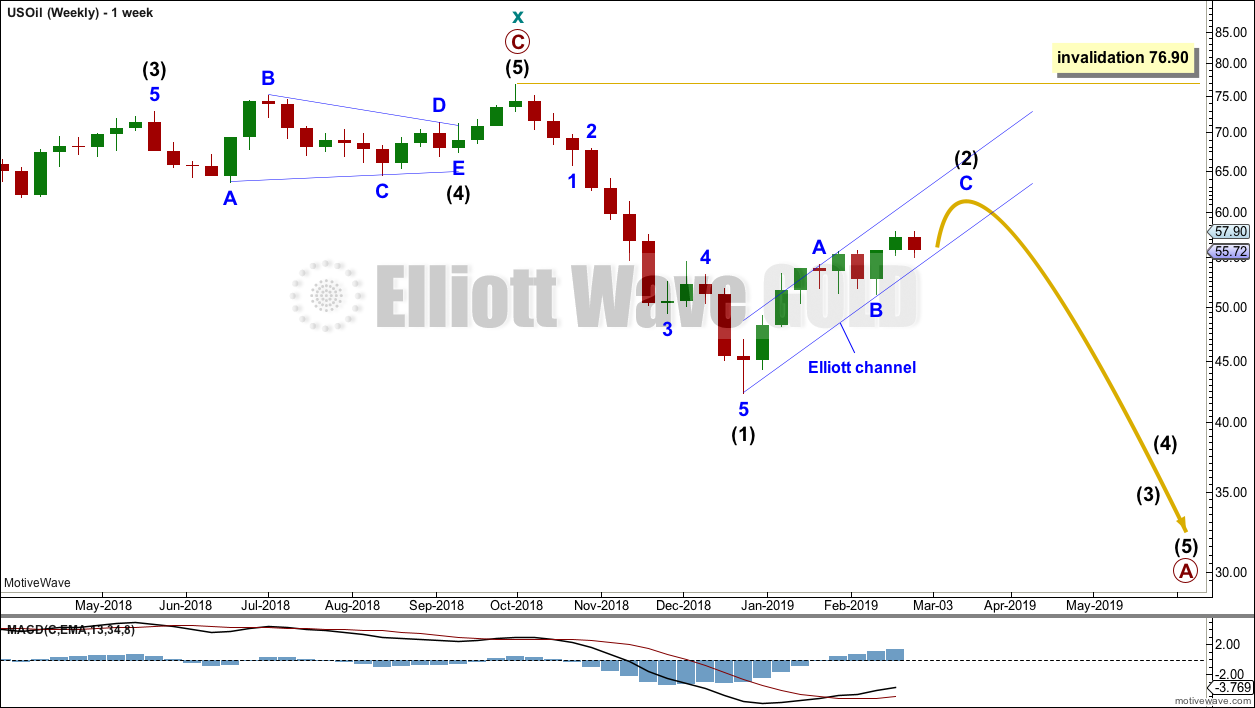
This weekly chart is focussed on the start of cycle wave y.
Cycle wave y is expected to subdivide as a zigzag. A zigzag subdivides 5-3-5. Primary wave A must subdivide as a five wave structure if this wave count is correct.
Within primary wave A, intermediate wave (1) may now be complete. Intermediate wave (2) so far looks like it is unfolding as a zigzag, which is the most common Elliott wave structure for a second wave, and so far it has lasted nine weeks. It is possible that it was complete at this week’s high. If it continues further, it may end in another four weeks to total a Fibonacci thirteen.
Intermediate wave (2) may not move beyond the start of intermediate wave (1) above 76.90.
DAILY CHART
Click chart to enlarge.
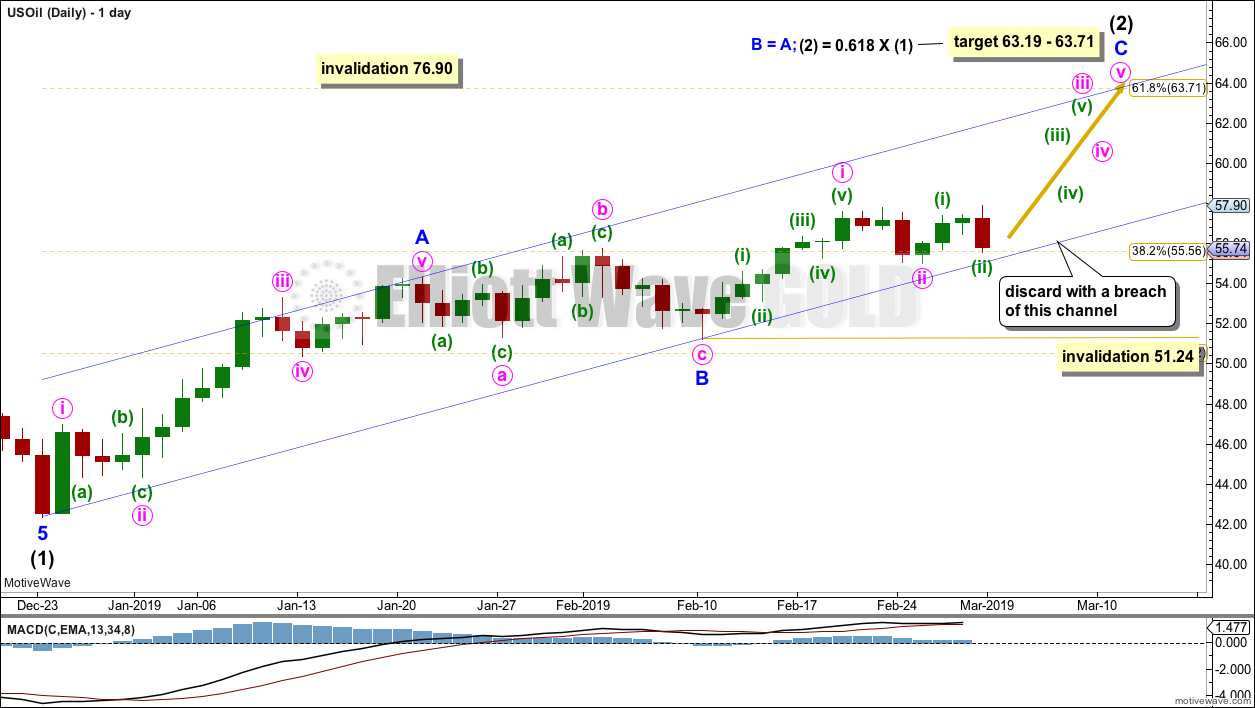
This is the main wave count, only because we should always assume the trend remains the same until proven otherwise. Assume that this main wave count may be correct while price remains within the blue Elliott channel.
If intermediate wave (2) is unfolding as a zigzag, then within it minor waves A and B may now both be complete.
Another five wave structure upwards for minor wave C may be expected to unfold. Within minor wave C, so far minute waves i and ii may be complete.
The target is now widened to a small zone calculated at two degrees.
The channel is drawn about intermediate wave (2) using Elliott’s technique for a correction. Any pullbacks along the way up within minor wave C may find support about the lower edge of this channel. Minor wave C may end either mid way within the channel or more likely about the upper edge.
A clear breach of the lower edge of the channel by downwards movement (not sideways) would now see this main daily wave count discarded in favour of the alternate below.
Within minor wave C, minute wave ii may not move beyond the start of minute wave i below 51.24.
Intermediate wave (2) may be very deep.
Intermediate wave (2) may not move beyond the start of intermediate wave (1) above 76.90.
ALTERNATE DAILY CHART
Click chart to enlarge.
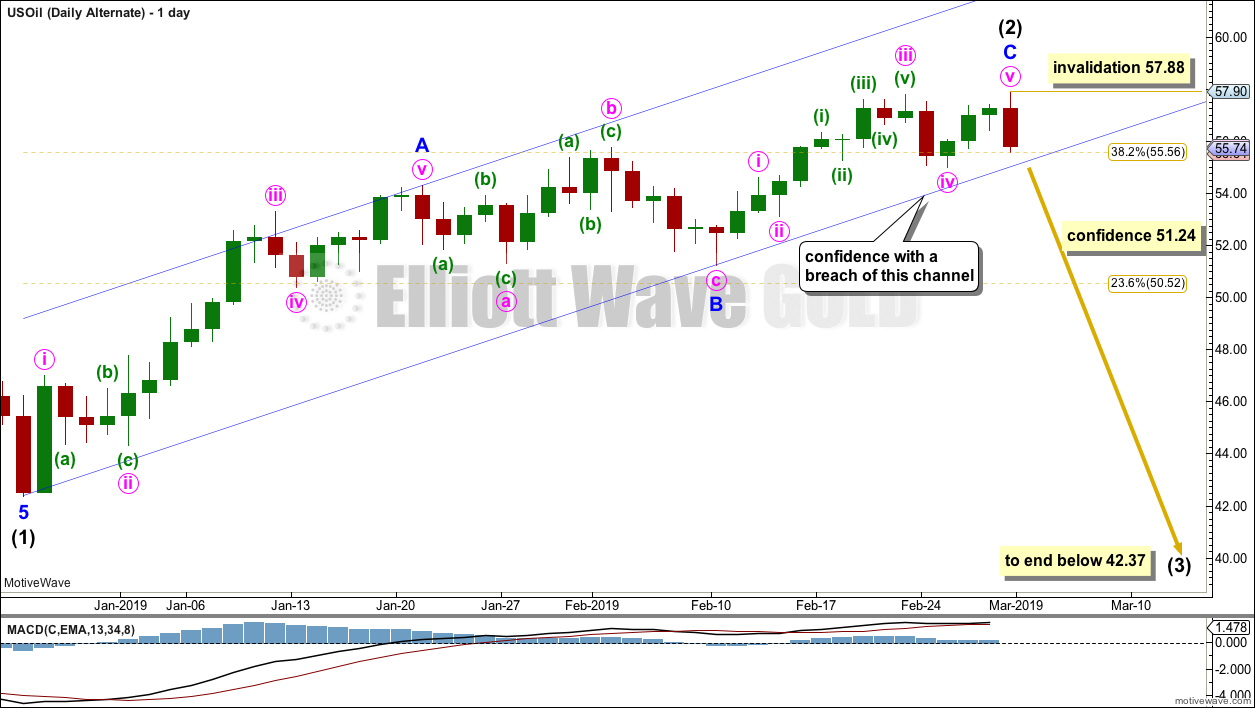
It is possible that intermediate wave (2) may be a complete zigzag, ending close to the 0.382 Fibonacci ratio of intermediate wave (1). Confidence in this wave count may be had with a breach of the blue Elliott channel.
Intermediate wave (3) must move beyond the end of intermediate wave (1). Intermediate wave (3) must move far enough below the end of intermediate wave (1) to allow room for intermediate wave (4) to unfold and remain below intermediate wave (1) price territory.
Within intermediate wave (3), no second wave correction may move beyond the start of its first wave above 57.88.
TECHNICAL ANALYSIS
MONTHLY CHART
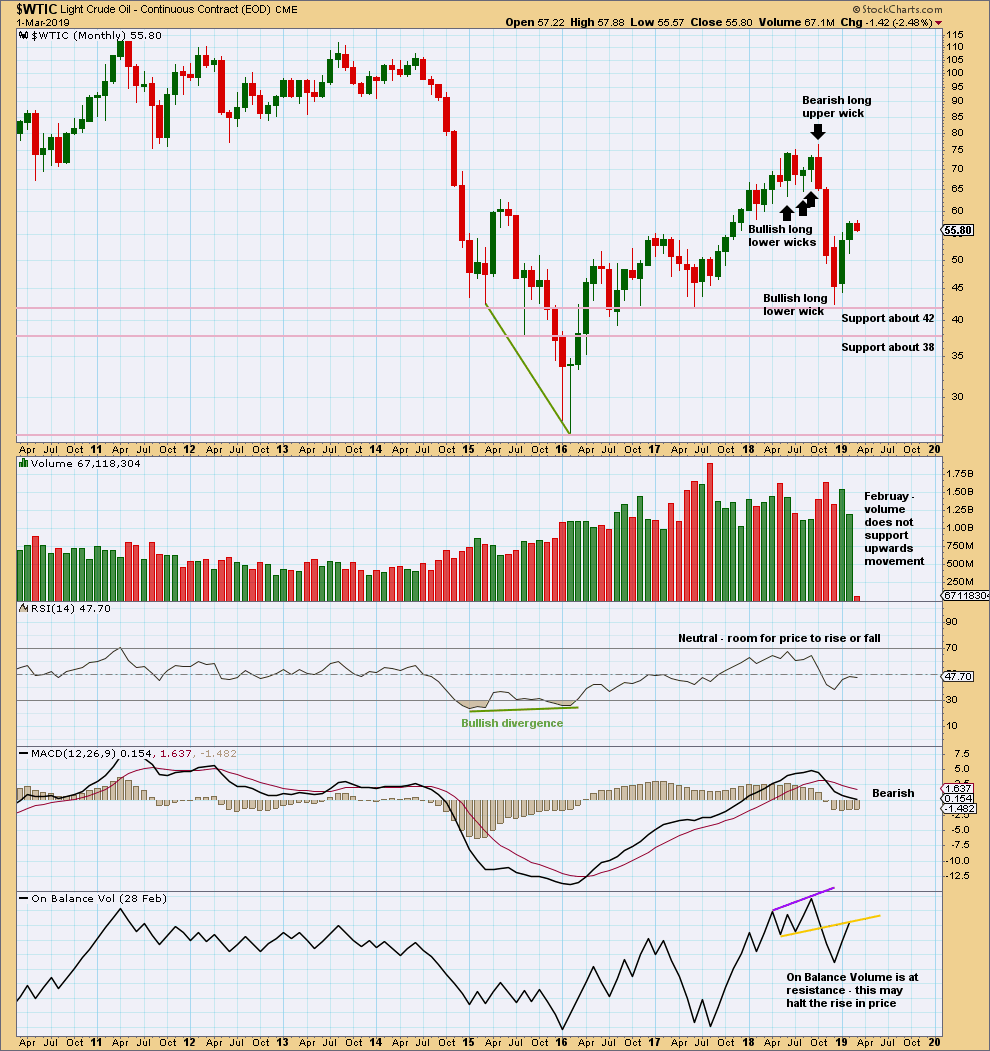
Click chart to enlarge. Chart courtesy of StockCharts.com.
Upwards movement for February lacks support from volume. This bounce may be ending here or very soon.
WEEKLY CHART
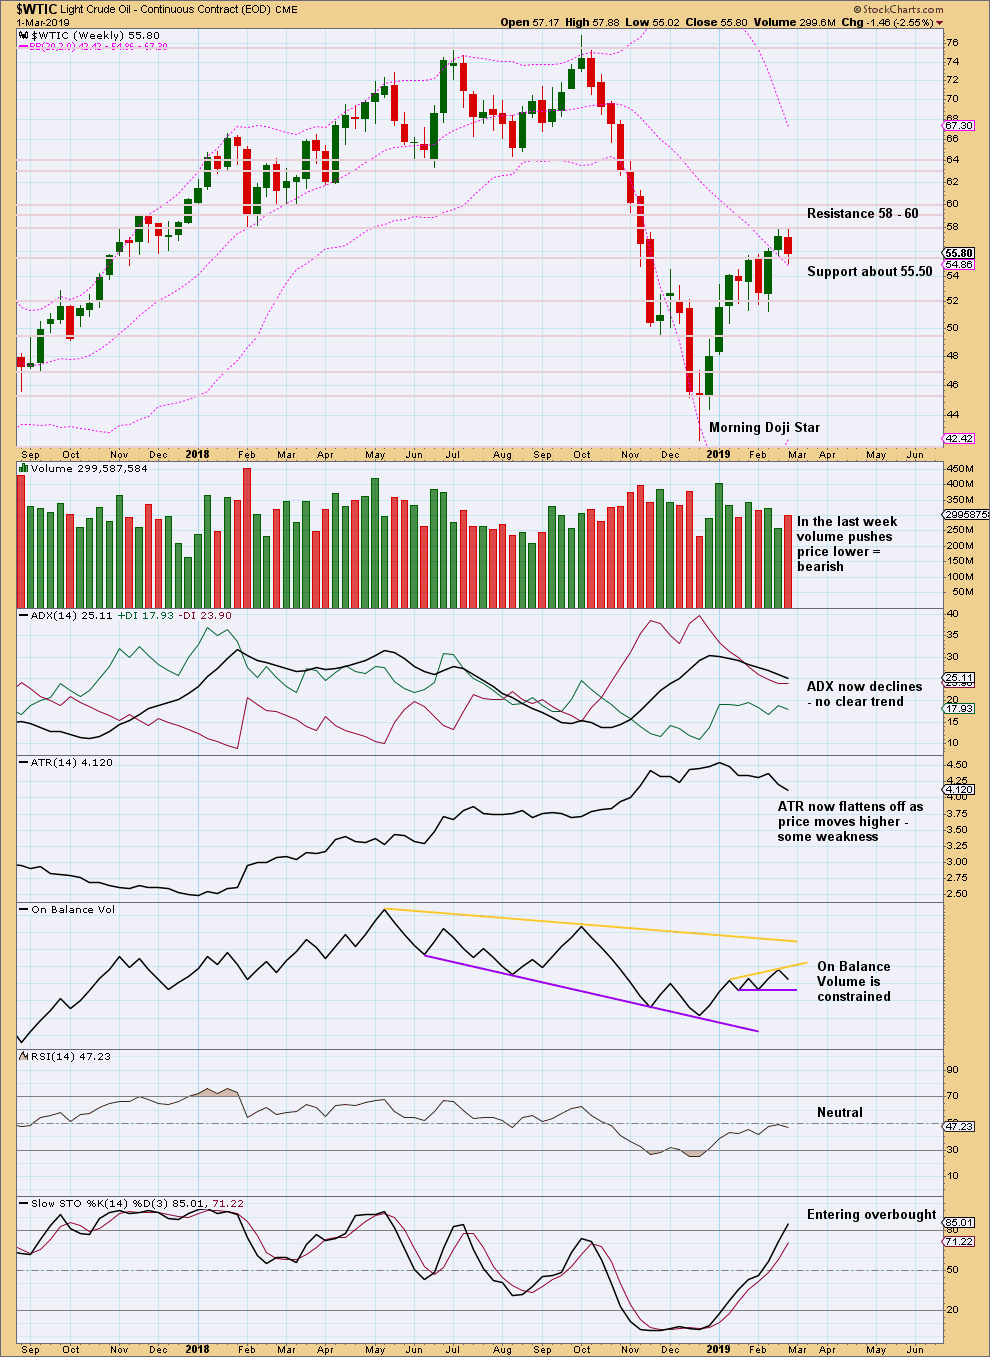
Click chart to enlarge. Chart courtesy of StockCharts.com.
At the weekly chart level, the volume profile is also bearish. This supports the alternate daily Elliott wave count.
The resistance line for On Balance Volume is redrawn.
DAILY CHART

Click chart to enlarge. Chart courtesy of StockCharts.com.
The short-term volume profile is also bearish while price is at resistance. This offers some support to the alternate daily Elliott wave count.
—
Always practice good risk management as the most important aspect of trading. Always trade with stops and invest only 1-5% of equity on any one trade. Failure to manage risk is the most common mistake new traders make.
Updated S&P500 daily chart:
The black channel is now very clearly breached. Primary wave 1 may now be labelled as over with some confidence.
Targets for a deeper pullback for primary wave 2 are the Fibonacci ratios of primary wave 1.
Primary wave 2 would most likely be a zigzag. It will have a B wave in the middle, a bounce or sideways consolidation.
Primary wave 1 lasted 45 sessions. Primary wave 2 may be expected to last a minimum of a Fibonacci 21 sessions, and more likely 34 or possibly even 55. It may also not exhibit a Fibonacci duration. But I’ll look out for it.
The focus now is on identifying the end of primary wave 2.
Hello Lara,
I wanted to add a comment on your SPX channel, I guess when Elliott did these by hand he was always using the same graph paper (I guess semi-log scale but I don’t know for sure). However, on a computer screen it depends on how much range you show on the Y axis, when I look at my screen on semi-log default the channel has been broken quite some time ago but when I match the approx. 2,200-3,350 Y axis scale you show I get the same result as you. The X axis is less important. I think this is a weakness of channeling, because I don’t think there’s a robust solution…but you may have a view on that! Best wishes and thanks for your diligent work as always. Chris
Whoops, I was trying to correct, the X axis is also important, here the less data I show, the closer I get to your channel. Chris
I’ve found also that when I try to replicate the channel on Stockcharts it shows up differently.
It’s really frustrating, because the channel is so important.
I think that a semi-log scale is correct for daily data and higher time frames, and that focussing the chart only on the data on which the channel is drawn yields most accurate results.
Update for Gold (not a chart, just a target)
Within minor 1 down which you can see on the daily chart I updated in comments below, you can see I was looking for the end of minute iv and the start of minute v.
Today I think that may now be done, and so now I can calculate a target for minor 1 to end using the Fibonacci ratios between minute waves v and i.
The target for minor 1 to end is now at 1,266.
Thanks Lara for the mid-week updates. I am glad to see that this forum seems to have increased use by members. Awesome.
Thanks to all who post here. Your questions are interesting and comments helpful. Keep it up.
Here’s a new idea for US Oil.
Current sideways movement looks like a small triangle may be forming. This may be wave X within a double zigzag. Double zigzags are fairly common corrective structures, particularly for second waves.
The problem now becomes with this idea that minor wave X may not remain contained within the channel that formed about minor wave W. In fact, it may very well breach the channel and that would be not only acceptable but somewhat expected.
Which means that the channel for this idea is not a bottom line.
I’ll be looking at strength within downwards movement if any occurs. If there is any strength then I’ll expect intermediate (2) is over. But if there is reasonable weakness then I’ll consider this idea.
The triangle may yet morph into a double combination. It’s important with Elliott wave triangles to be open to that idea.
Lara,
As always I want to thank you for your continual hard work to provide us with your Elliott wave counts. My question concerns your Main count for USOIL. Given that this week we are continuing to move sideways, what do you think about the possibility that Minute ii is not yet over? I am thinking that it might be developing as a flat, regular or expanded. Attached is a 4hr chart for USOIL which graphically explains my thoughts. The final movement down for Minute c could be brief enough so as to not breach the lower end of the blue channel on a daily time frame. Your thoughts on this are appreciated.
I’m looking at Oil now. I agree, something is up with this sideways movement.
I don’t like the idea of minute ii moving sideways though, the proportion just isn’t very good at all. But then… Oil doesn’t always have nice proportions (unlike Gold which is the best at that).
What I am considering is a double zigzag for intermediate wave (2) with a triangle currently forming for minor wave X within it. That looks pretty good, and double zigzags are pretty common structures.
I’ll chart that and post above.
The bottom line for Oil remains though that while it’s in the channel, assume the trend remains the same (short term): up.
Updated daily chart for the S&P500:
The black channel is not actually breached on the daily chart. A breach needs to be by a full daily candlestick below and not touching the lower trend line.
Also, downwards movement in the last completed session was weak. That was unconvincing as the start of a primary degree trend down.
What is looking more likely with the data in hand today is that it was just another small correction within an ongoing upwards trend.
Thanks Lara. I’m a bit thrown off because I’m using tradingview and I can’t draw the channel the way you have. There’s some data which is off it seems.
My data for the S&P500 comes from BarChart.
You may find slight differences with different data feeds. Theoretically they should be the same, it’s the same single market, but in practice they’re not.
I’m using a semi-log scale, maybe that’s the difference?
Updated daily chart for Gold:
Draw a small channel about minor wave 1 down as shown. Use this to indicate when minor 1 may be over and minor 2 may be underway.
In this instance I would accept a close above the upper edge of the channel as an indication of this trend change.
Then draw a Fibonacci retracement along the length of minor wave 1. Use the 0.382 and 0.618 Fibonacci ratios as targets, and if one of those intercepts the lower edge of the upwards sloping blue channel then that may be favoured as a test of resistance.
Hi Lara,
Do we have a sufficient break of the lower black trend line on s&p to start the wave down?
Also, could gold be on minute wave 4 now, with daily the channel as a ceiling?
I’ll answer with charts above.
XOP daily chart updated:
Price is range bound between resistance about 32 and support about 28.
A close above 32 would indicate an upwards trend, it needs support from volume for confidence.
A close below 28 would indicate a downwards trend, it doesn’t need support from volume for confidence.
A breakout is now needed to indicate the next trend direction. Until that happens expect price to swing from resistance to support and back again.
Thank you so much.
Lara,
You did a public post on XOP in October. Do you have any further thoughts on it? Is it in wave 4 with a target of app. 38?
Anu
I’ll take a look tomorrow and update it.