

S&P 500
Upwards movement continued as the main Elliott wave count expected. The target remains the same.
Summary: A close above resistance at 2,815 (November 2018 highs) on an upwards day with support from volume is a classic upwards breakout, and requires the Elliott wave count to be reconsidered.
A third wave up may now gather strength. A new mid term target is at 3,010. The final target remains the same at 3,045.
The biggest picture, Grand Super Cycle analysis, is here.
Last published monthly charts are here. Video is here.
ELLIOTT WAVE COUNTS
WEEKLY CHART
Click chart to enlarge.
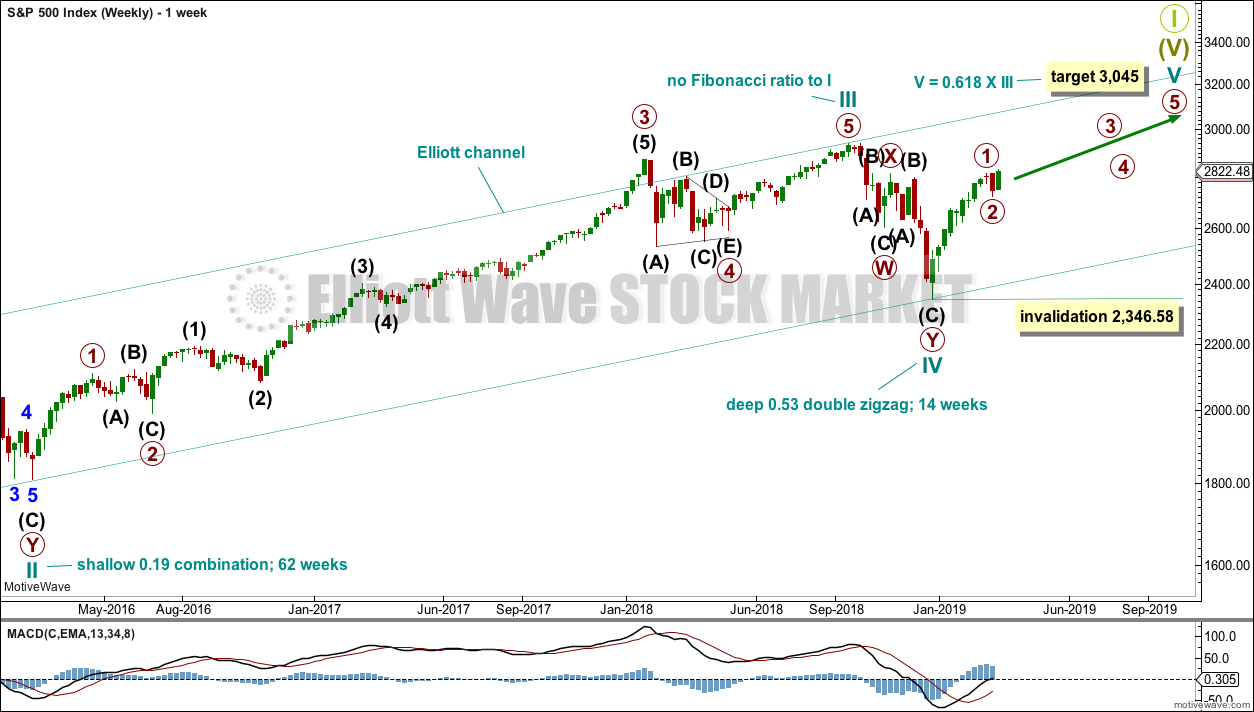
This weekly chart shows all of cycle waves III, IV and V so far.
Cycle wave II fits as a time consuming double combination: flat – X – zigzag. Combinations tend to be more time consuming corrective structures than zigzags. Cycle wave IV has completed as a multiple zigzag that should be expected to be more brief than cycle wave II.
Cycle wave IV may have ended at the lower edge of the Elliott channel.
Within cycle wave V, no second wave correction may move beyond the start of its first wave below 2,346.58.
Although both cycle waves II and IV are labelled W-X-Y, they are different corrective structures. There are two broad groups of Elliott wave corrective structures: the zigzag family, which are sharp corrections, and all the rest, which are sideways corrections. Multiple zigzags belong to the zigzag family and combinations belong to the sideways family. There is perfect alternation between the possible double zigzag of cycle wave IV and the combination of cycle wave II.
Although there is gross disproportion between the duration of cycle waves II and IV, the size of cycle wave IV in terms of price makes these two corrections look like they should be labelled at the same degree. Proportion is a function of either or both of price and time.
Draw the Elliott channel about Super Cycle wave (V) with the first trend line from the end of cycle wave I (at 2,079.46 on the week beginning 30th November 2014) to the high of cycle wave III, then place a parallel copy on the low of cycle wave II. Cycle wave V may find resistance about the upper edge.
It is possible that cycle wave V may end in October 2019. If it does not end there, or if the AD line makes new all time highs during or after June 2019, then the expectation for cycle wave V to end would be pushed out to March 2020 as the next possibility. Thereafter, the next possibility may be October 2020. March and October are considered as likely months for a bull market to end as in the past they have been popular. That does not mean though that this bull market may not end during any other month.
MAIN WAVE COUNT
DAILY CHART
Click chart to enlarge.
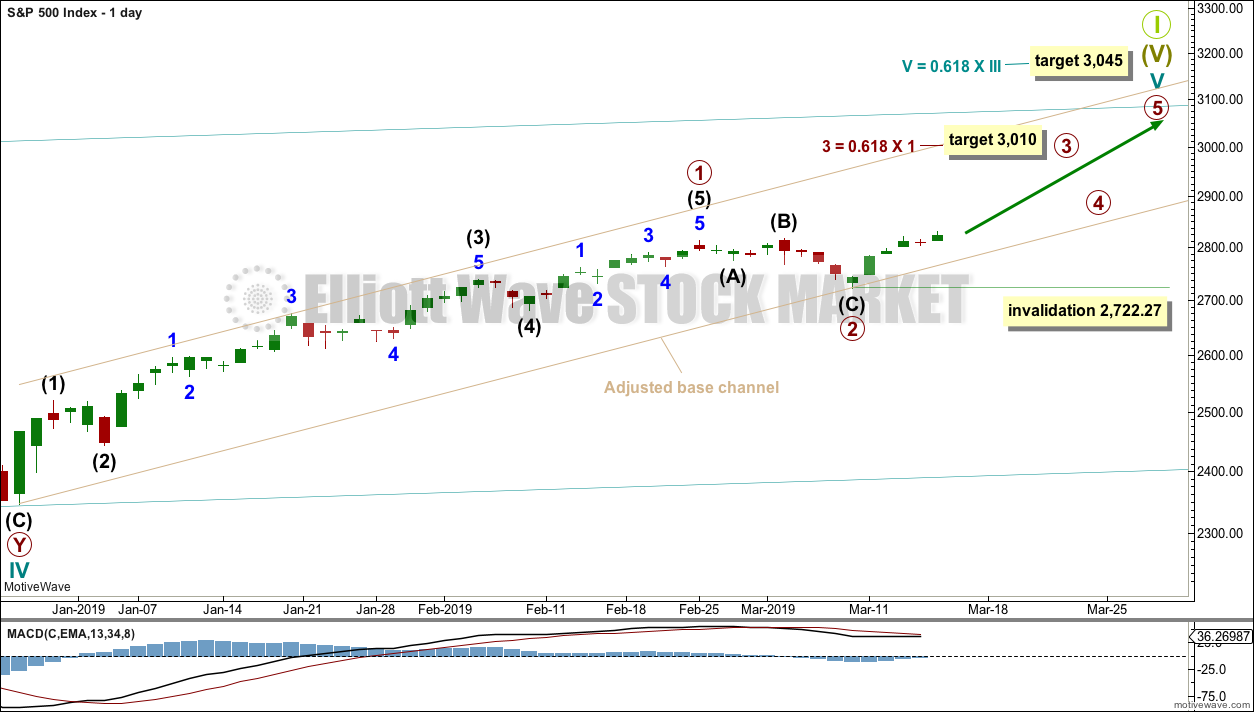
The daily chart will focus on the structure of cycle wave V.
Within Super Cycle wave (V), cycle wave III may not be the shortest actionary wave. Because cycle wave III is shorter than cycle wave I, this limits cycle wave V to no longer than equality in length with cycle wave III at 3,477.39. A target is calculated for cycle wave V to end prior to this point.
Cycle wave V must subdivide as a five wave motive structure, either an impulse or an ending diagonal. An impulse is much more common and that will be how it is labelled. A diagonal would be considered if overlapping suggests it.
At the end of this week, Friday has closed at 2,822.48 on an upwards day with support from volume. This close is above the recovery swing high within cycle wave IV on November 2018 at 2,815.15. This classic upwards breakout above resistance indicates underlying strength. This may be the early stage of a third wave. Primary waves 1 and 2 may both be over. Primary wave 2 may have been a very brief and shallow expanded flat correction.
Primary wave 3 may now exhibit an increase in upwards momentum. A target is calculated that fits with the higher target for cycle wave V to end.
Within primary wave 3, no second wave correction may move beyond the start of its first wave below 2,722.27.
The lower edge of the adjusted base channel is copied over from the daily chart. This may provide support for pullbacks along the way up.
ALTERNATE WAVE COUNT
DAILY CHART
Click chart to enlarge.
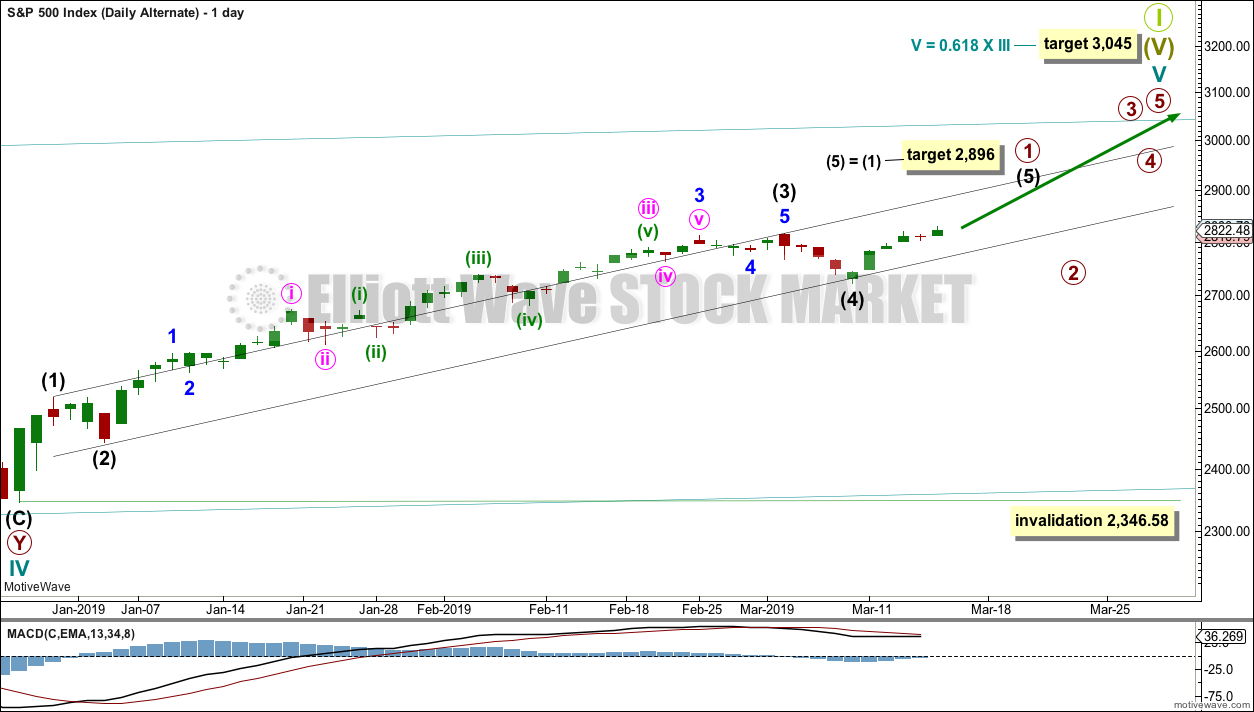
It remains possible that primary wave 2 has not yet arrived.
Primary wave 1 may be a very long extended impulse. Within primary wave 1, there is no adequate Fibonacci ratio between intermediate waves (1) and (3). Intermediate wave (5) would more likely exhibit a Fibonacci ratio to intermediate ave (1), and the most common ratio is equality.
A channel is drawn about primary wave 1 using Elliott’s first technique. If the lower edge of the channel is breached by a full daily candlestick below and not touching the lower edge, that may indicate primary wave 1 may be over and primary wave 2 may have begun.
Primary wave 2 may not move beyond the start of primary wave 1 below 2,346.58.
TECHNICAL ANALYSIS
WEEKLY CHART
Click chart to enlarge. Chart courtesy of StockCharts.com.
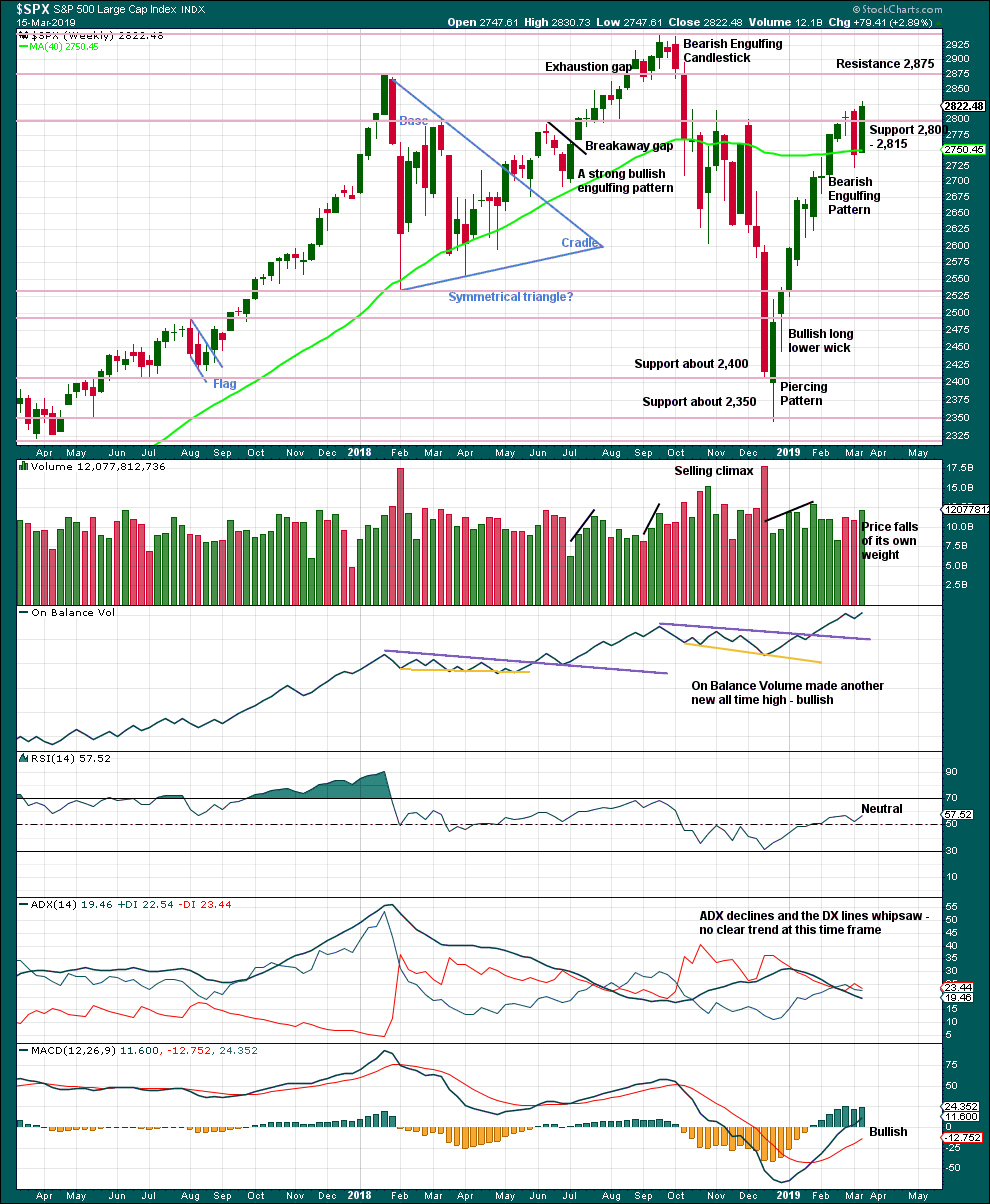
This week has seen a sharp reversal in price. A very strong bullish candlestick has support from volume, and closes above prior resistance at 2,815. This area may now offer support.
Next resistance is 2,875 and then at 2,940.
DAILY CHART
Click chart to enlarge. Chart courtesy of StockCharts.com.
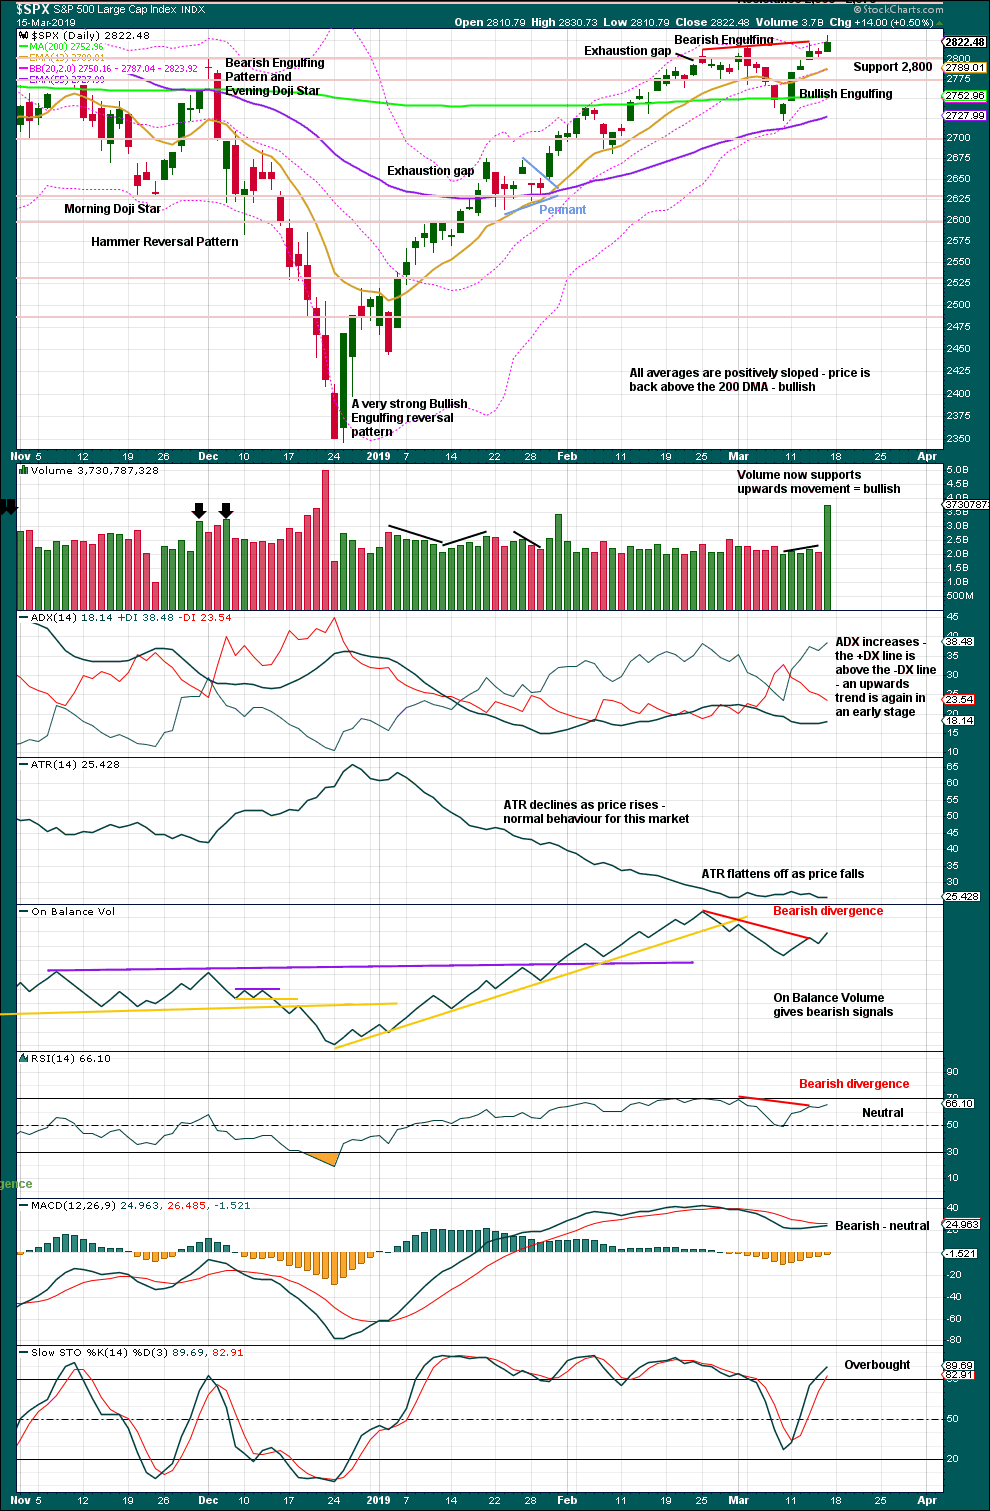
The December 2018 low is expected to remain intact. The two 90% upwards days on 26th December 2018 and 6th January 2019 indicate this upwards trend has internal strength.
A close above resistance at 2,815 on an upwards day, which has support from volume, is significant.
Bearish divergence between price and both of On Balance Volume and RSI remains. This may indicate the main Elliott wave count is wrong, or the divergence may just disappear.
Stochastics may remain extreme for long periods of time when markets trend strongly. Stochastics overbought here does not indicate upwards movement should end.
BREADTH – AD LINE
WEEKLY CHART
Click chart to enlarge. Chart courtesy of StockCharts.com. So that colour blind members are included, bearish signals
will be noted with blue and bullish signals with yellow.
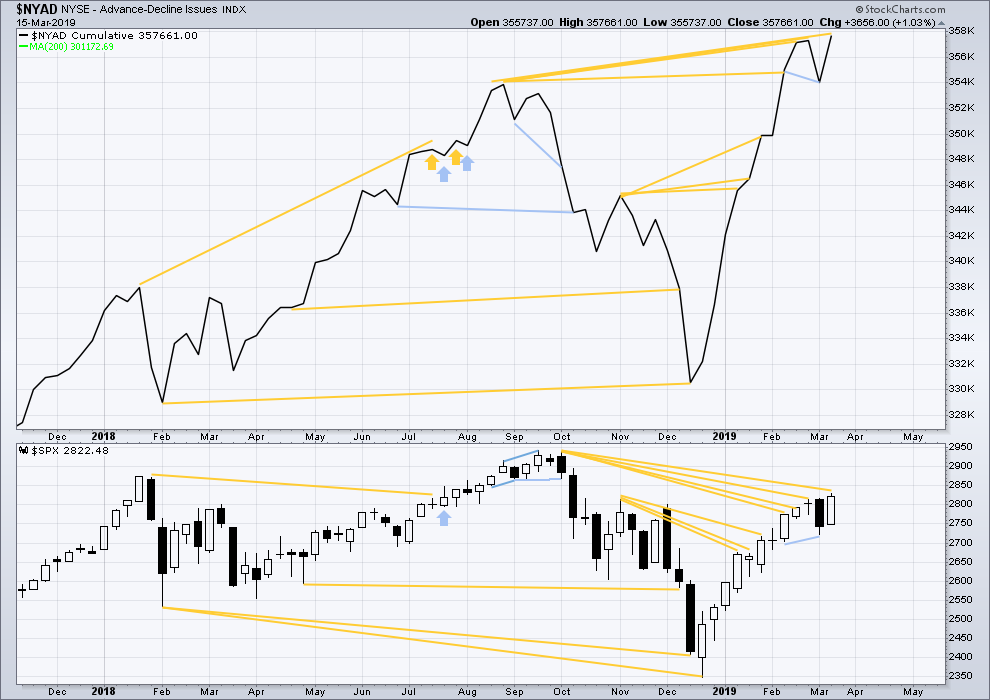
Every single bear market from the Great Depression and onwards has been preceded by a minimum of 4-6 months divergence between price and the AD line. With the AD line making a new all time high again last week, the end of this bull market and the start of a new bear market must be a minimum of 4 months away, which is mid to end June 2019 at this time.
The AD line makes a new all time high this week. Upwards movement has support from rising market breadth, and breath is rising faster than price. This is longer-term bullish divergence.
Only large caps have made new highs this week above the prior high of the 25th of February. Mid and small caps have not. This indicates some weakness in market breadth. The upwards rise may becoming selective. This would be normal towards the end of a bull market run.
DAILY CHART
Click chart to enlarge. Chart courtesy of StockCharts.com. So that colour blind members are included, bearish signals
will be noted with blue and bullish signals with yellow.
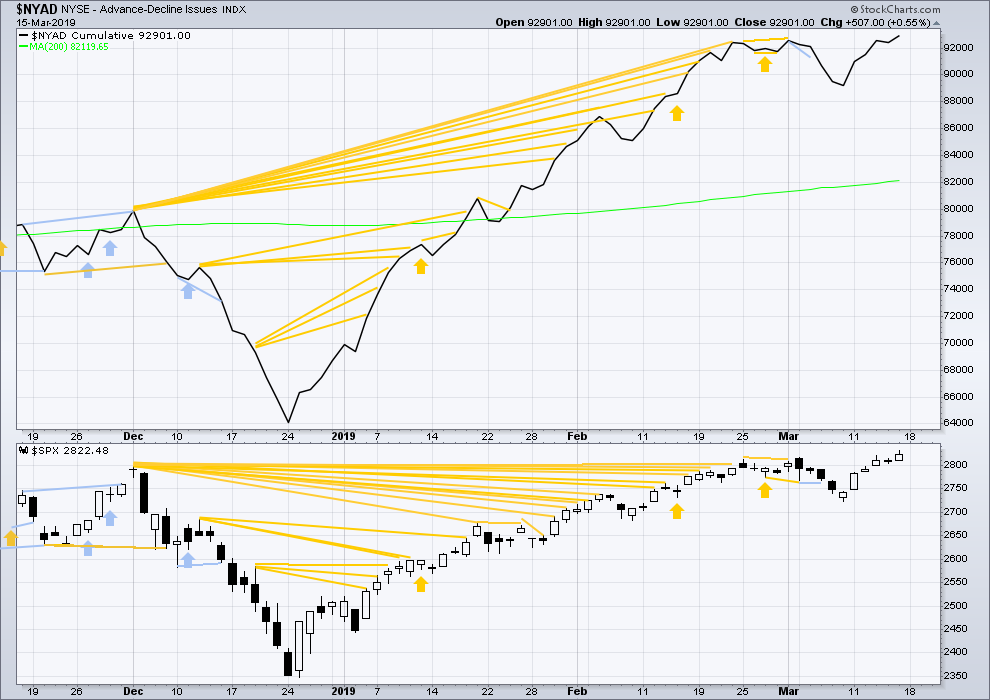
Breadth should be read as a leading indicator.
Both price and the AD line have made a new short-term high. Upwards movement on Friday has support from rising market breadth. There is no short-term divergence.
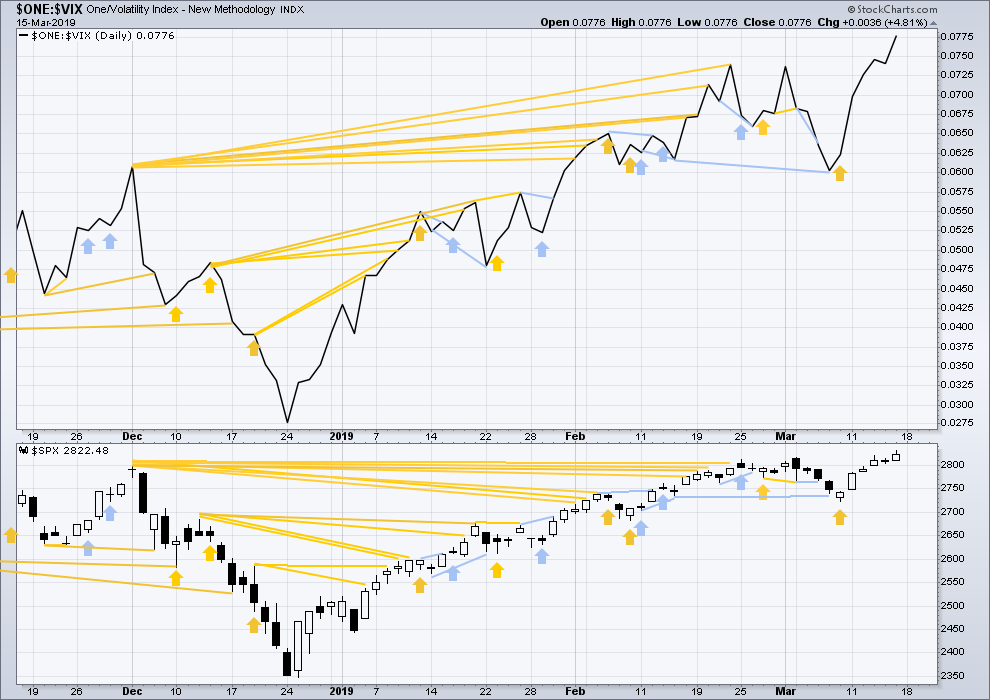
VOLATILITY – INVERTED VIX CHART
WEEKLY CHART
Click chart to enlarge. Chart courtesy of StockCharts.com. So that colour blind members are included, bearish signals
will be noted with blue and bullish signals with yellow.
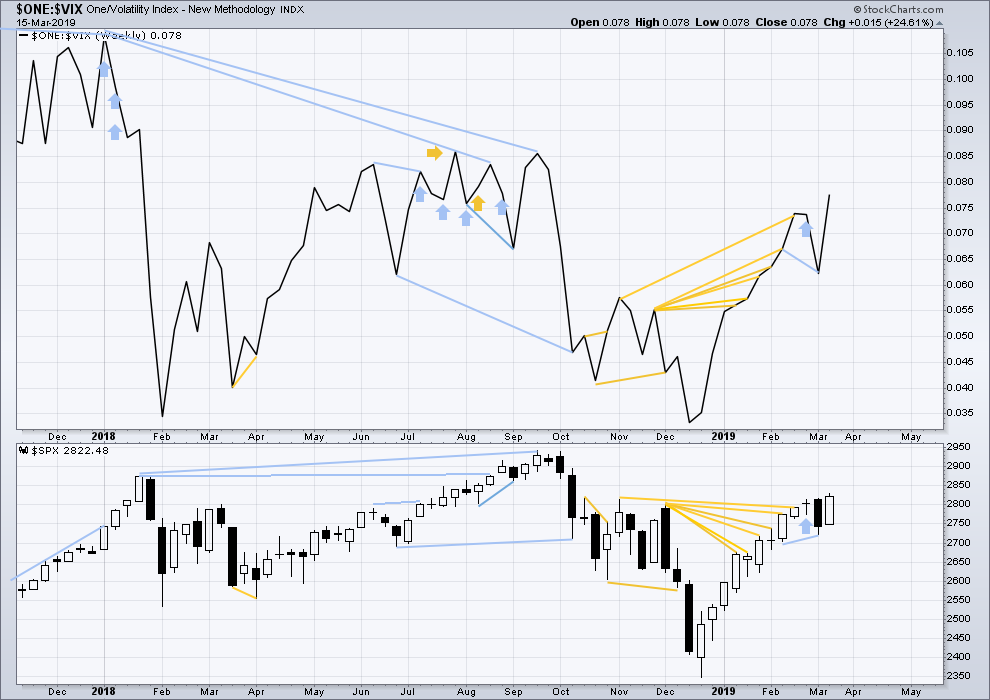
Inverted VIX has made a new short-term high and a mid-term high along with price. Upwards movement comes with a decline in VIX. There is no short nor mid-term divergence.
Longer-term divergence between price and inverted VIX at the last all time high in September 2018 remains.
DAILY CHART
Click chart to enlarge. Chart courtesy of StockCharts.com. So that colour blind members are included, bearish signals
will be noted with blue and bullish signals with yellow.
Both price and inverted VIX have made new short-term highs. There is no divergence. Upwards movement comes with a normal corresponding decline in VIX.
DOW THEORY
Dow Theory confirms a bear market. This does not necessarily mean a bear market at Grand Super Cycle degree though; Dow Theory makes no comment on Elliott wave counts. On the 25th of August 2015 Dow Theory also confirmed a bear market. The Elliott wave count sees that as part of cycle wave II. After Dow Theory confirmation of a bear market in August 2015, price went on to make new all time highs and the bull market continued.
DJIA: 23,344.52 – a close on the 19th of December at 23,284.97 confirms a bear market.
DJT: 9,806.79 – price has closed below this point on the 13th of December.
S&P500: 2,532.69 – a close on the 19th of December at 2,506.96 provides support to a bear market conclusion.
Nasdaq: 6,630.67 – a close on the 19th of December at 6,618.86 provides support to a bear market conclusion.
With all the indices moving now higher, Dow Theory would confirm a bull market if the following highs are made:
DJIA: 26,951.81
DJT: 11,623.58
S&P500: 2,940.91
Nasdaq: 8,133.30.
For the short term, only the S&P500 and Nasdaq have made new highs above the February 25th highs. DJIA and DJT remain lower. There is some divergence: the rise in price for the S&P500 is not mirrored across the indices.
GOLD
Price remains below the invalidation point and the channel on the daily chart. The Elliott wave count remains the same.
Summary: Three long-term targets are now calculated for cycle wave c to end. Confidence in a new downwards trend may be had with a new low below 1,160.75.
The mid-term target for a third wave down is at 1,207.
Grand SuperCycle analysis is here.
Last monthly charts are here. Video is here.
MAIN ELLIOTT WAVE COUNT
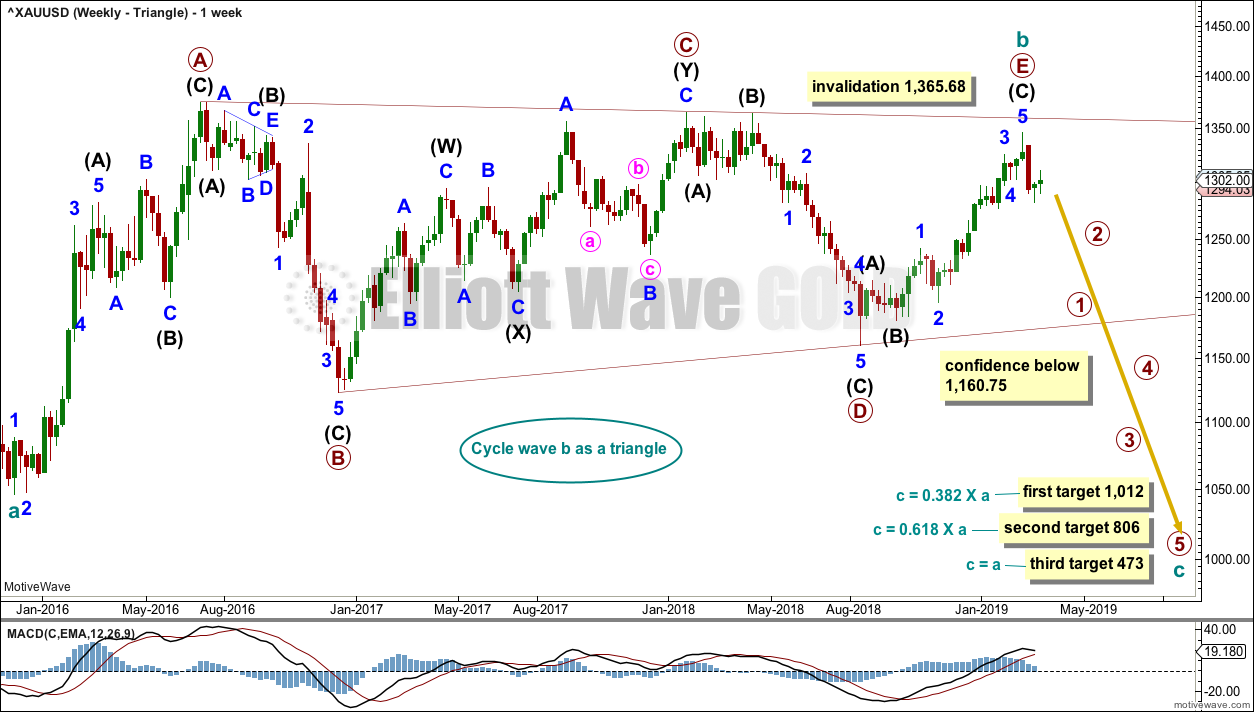
WEEKLY CHART – TRIANGLE
Click chart to enlarge.
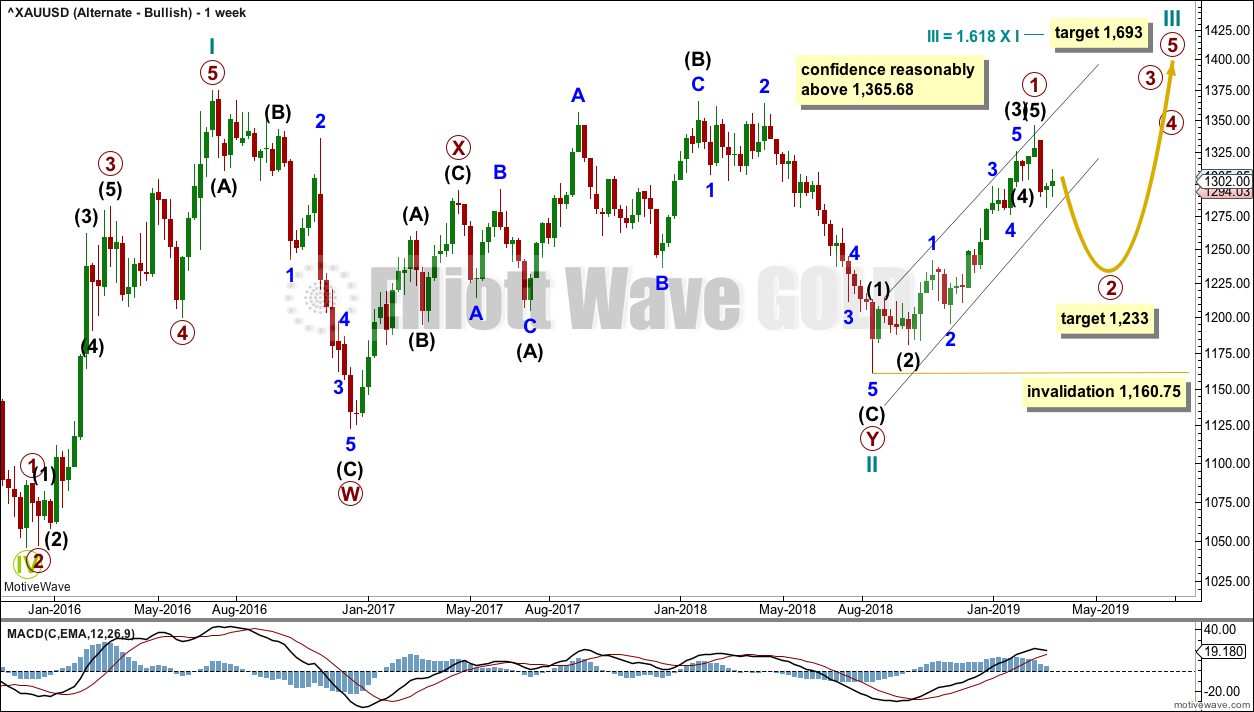
This is the preferred wave count.
Cycle wave b may be a complete regular contracting triangle. If it continues further, then primary wave E may not move beyond the end of primary wave C above 1,365.68.
Four of the five sub-waves of a triangle must be zigzags, with only one sub-wave allowed to be a multiple zigzag. Wave C is the most common sub-wave to subdivide as a multiple, and this is how primary wave C for this example fits best.
There are no problems in terms of subdivisions or rare structures for this wave count. It has an excellent fit and so far a typical look.
This wave count would expect a cycle degree trend change has recently occurred. Cycle wave c would most likely make new lows below the end of cycle wave a at 1,046.27 to avoid a truncation.
Primary wave E should exhibit reasonable weakness as it comes to an end. Triangles often end with declining ATR, weak momentum and weak volume.
If this weekly wave count is correct, then cycle wave c downwards should develop strength, ATR should show some increase, and MACD should exhibit an increase in downwards momentum.
Three targets are calculated for cycle wave c. Cycle wave a lasted 4.25 years. Cycle wave b may be over in 3.17 years. Cycle wave c may last a minimum of 2 years and possibly up to 5 years.
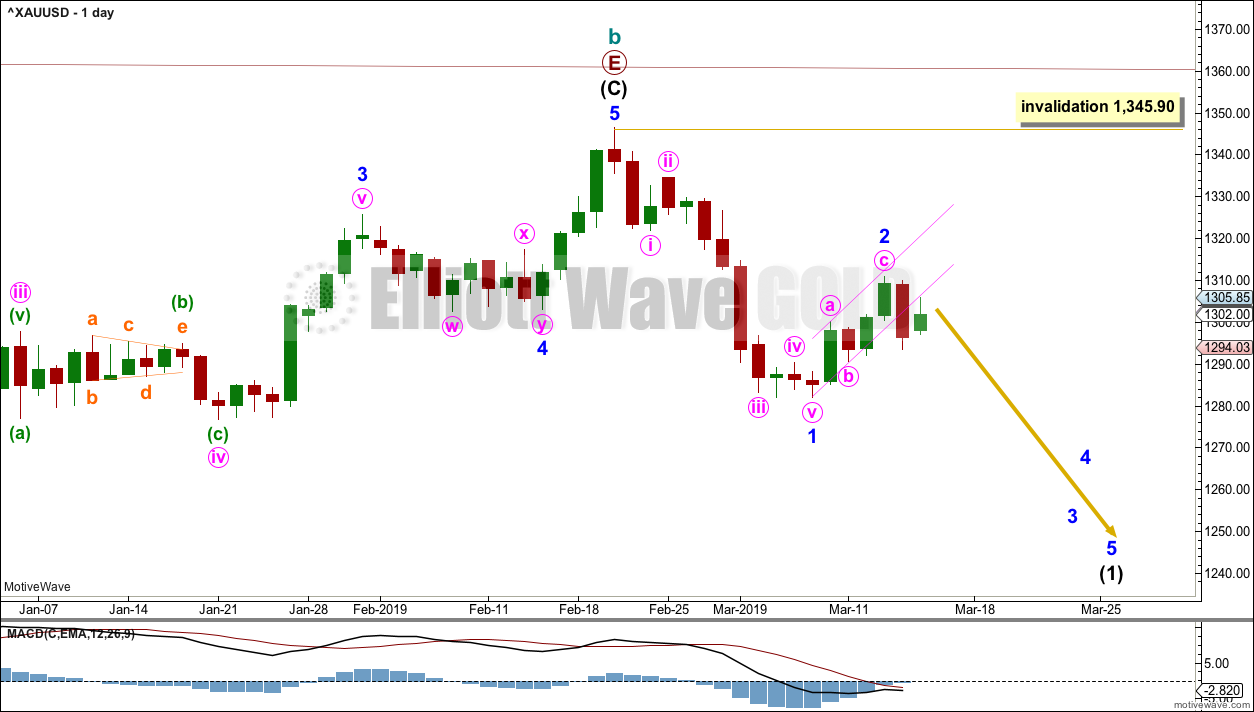
DAILY CHART – TRIANGLE
Click chart to enlarge.
Cycle wave c must subdivide as a five wave structure, either an impulse or an ending diagonal. An impulse is much more common and that shall be how it is labelled unless overlapping suggests a diagonal should be considered.
A new trend at cycle degree should begin with a five wave structure on the daily chart, which will be labelled minor wave 1. Minor wave 2 now looks like an obvious three wave structure on the daily chart. While it is still possible that minor wave 2 could continue higher, price is at very strong resistance here so that looks unlikely.
Minor wave 2 may not move beyond the start of minor wave 1 above 1,345.90.
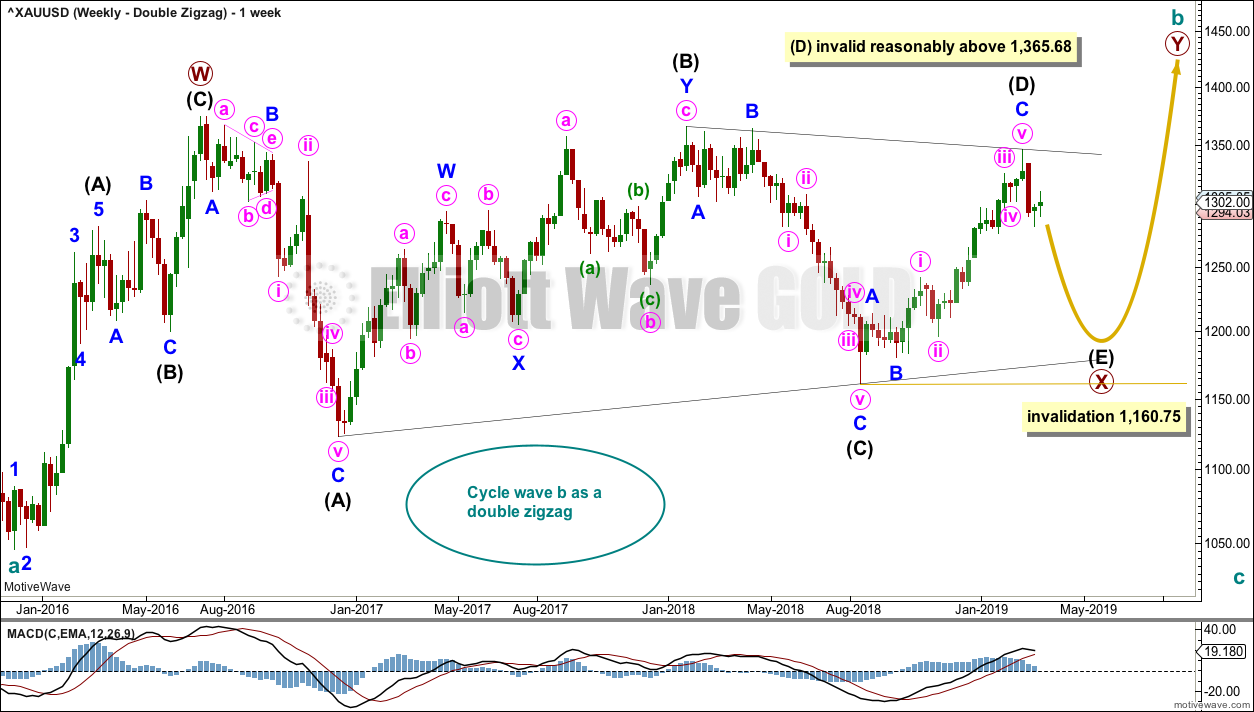
WEEKLY CHART – DOUBLE ZIGZAG
Click chart to enlarge.
It is possible that cycle wave b may be an incomplete double zigzag or a double combination.
The first zigzag in the double is labelled primary wave W. This has a good fit.
The double may be joined by a corrective structure in the opposite direction, a triangle labelled primary wave X. The triangle would be about four fifths complete.
Within multiples, X waves are almost always zigzags and rarely triangles. Within the possible triangle of primary wave X, it is intermediate wave (B) that is a multiple; this is acceptable, but note this is not the most common triangle sub-wave to subdivide as a multiple. These two points reduce the probability of this wave count.
Intermediate wave (D) may be complete. The (B)-(D) trend line is almost perfectly adhered to with the smallest overshoot within intermediate wave (C). This is acceptable.
Intermediate wave (E) should continue to exhibit weakness: ATR should continue to show a steady decline, and MACD may begin to hover about zero.
Intermediate wave (E) may not move beyond the end of intermediate wave (C) below 1,160.75.
This wave count may now expect downwards movement for several weeks.
Primary wave Y would most likely be a zigzag because primary wave X would be shallow; double zigzags normally have relatively shallow X waves.
Primary wave Y may also be a flat correction if cycle wave b is a double combination, but combinations normally have deep X waves. This would be less likely.
This wave count has good proportions and no problems in terms of subdivisions.
ALTERNATE ELLIOTT WAVE COUNT
WEEKLY CHART
Click chart to enlarge.
If Gold is in a new bull market, then it should begin with a five wave structure upwards on the weekly chart. However, the biggest problem with this wave count is the structure labelled cycle wave I because this wave count must see it as a five wave structure, but it looks more like a three wave structure.
Commodities often exhibit swift strong fifth waves that force the fourth wave corrections coming just prior to be more brief and shallow than their counterpart second waves. It is unusual for a commodity to exhibit a quick second wave and a more time consuming fourth wave, and this is how cycle wave I is labelled. The probability of this wave count is low due to this problem.
Cycle wave II subdivides well as a double combination: zigzag – X – expanded flat.
Cycle wave III may have begun. Within cycle wave III, primary wave 1 may now be complete. The target for primary wave 2 is the 0.618 Fibonacci ratio of primary wave 1. Primary wave 2 may not move beyond the start of primary wave 1 below 1,160.75.
A black channel is drawn about primary wave 1. Primary wave 2 may breach the lower edge of this channel.
Cycle wave III so far for this wave count would have been underway now for 27 weeks. It should be beginning to exhibit some support from volume, increase in upwards momentum and increasing ATR. However, volume continues to decline, ATR continues to decline and is very low, and momentum is weak in comparison to cycle wave I. This wave count lacks support from classic technical analysis.
TECHNICAL ANALYSIS
WEEKLY CHART
Click chart to enlarge. Chart courtesy of StockCharts.com.
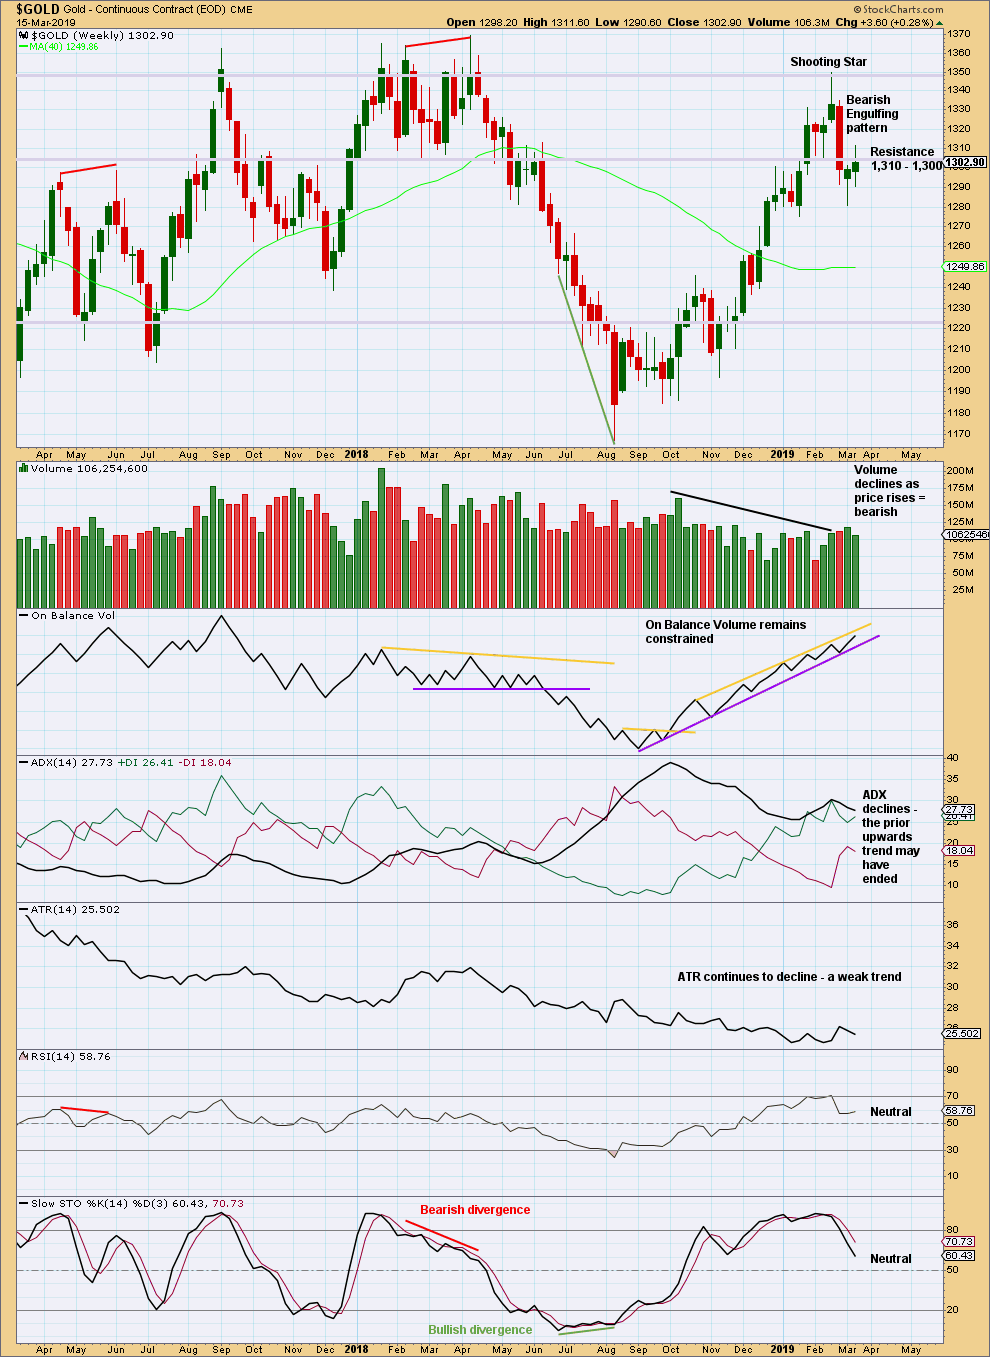
There are now two bearish candlestick reversal patterns on the weekly chart: a Shooting Star and a Bearish Engulfing pattern. This supports the view that a high is in place.
For the short term, price has not managed to close back above strong resistance at 1,310. This upwards bounce that began last week looks like a typical back test of resistance, which was prior support.
DAILY CHART
Click chart to enlarge. Chart courtesy of StockCharts.com.
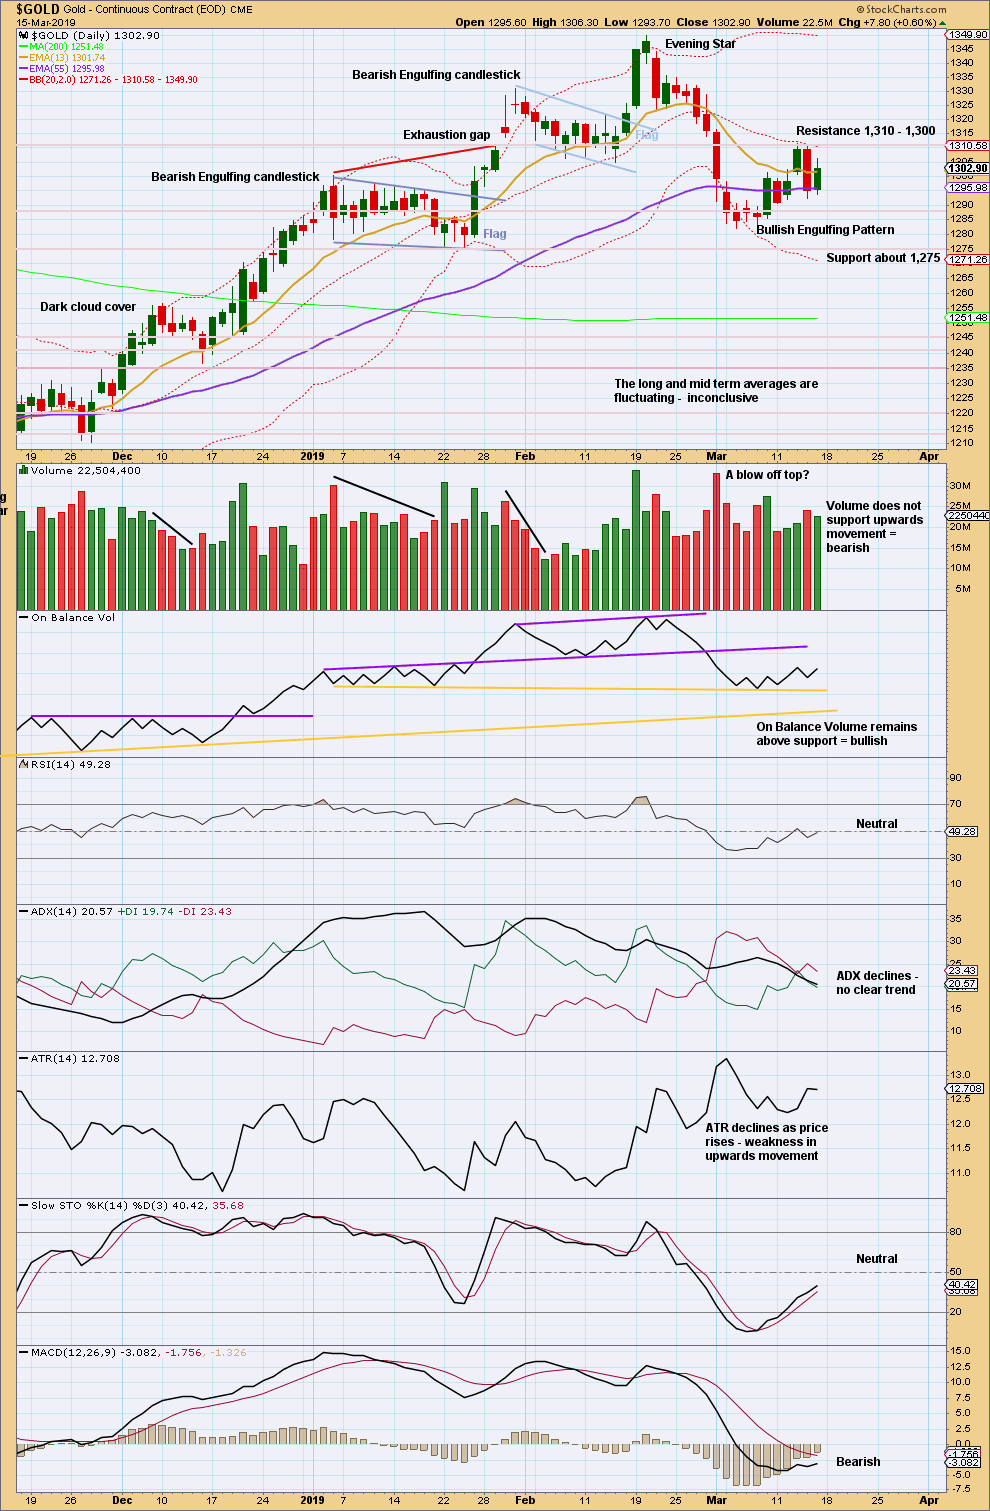
A strong downwards day with increased ATR and volume suggests a back test of resistance about 1,310 may now be complete. It would now be typical to see price move down and away from this area.
Friday’s upwards movement lacks range and support from volume. This supports the idea that a high may be in place on Thursday.
GDX WEEKLY CHART
Click chart to enlarge. Chart courtesy of StockCharts.com.
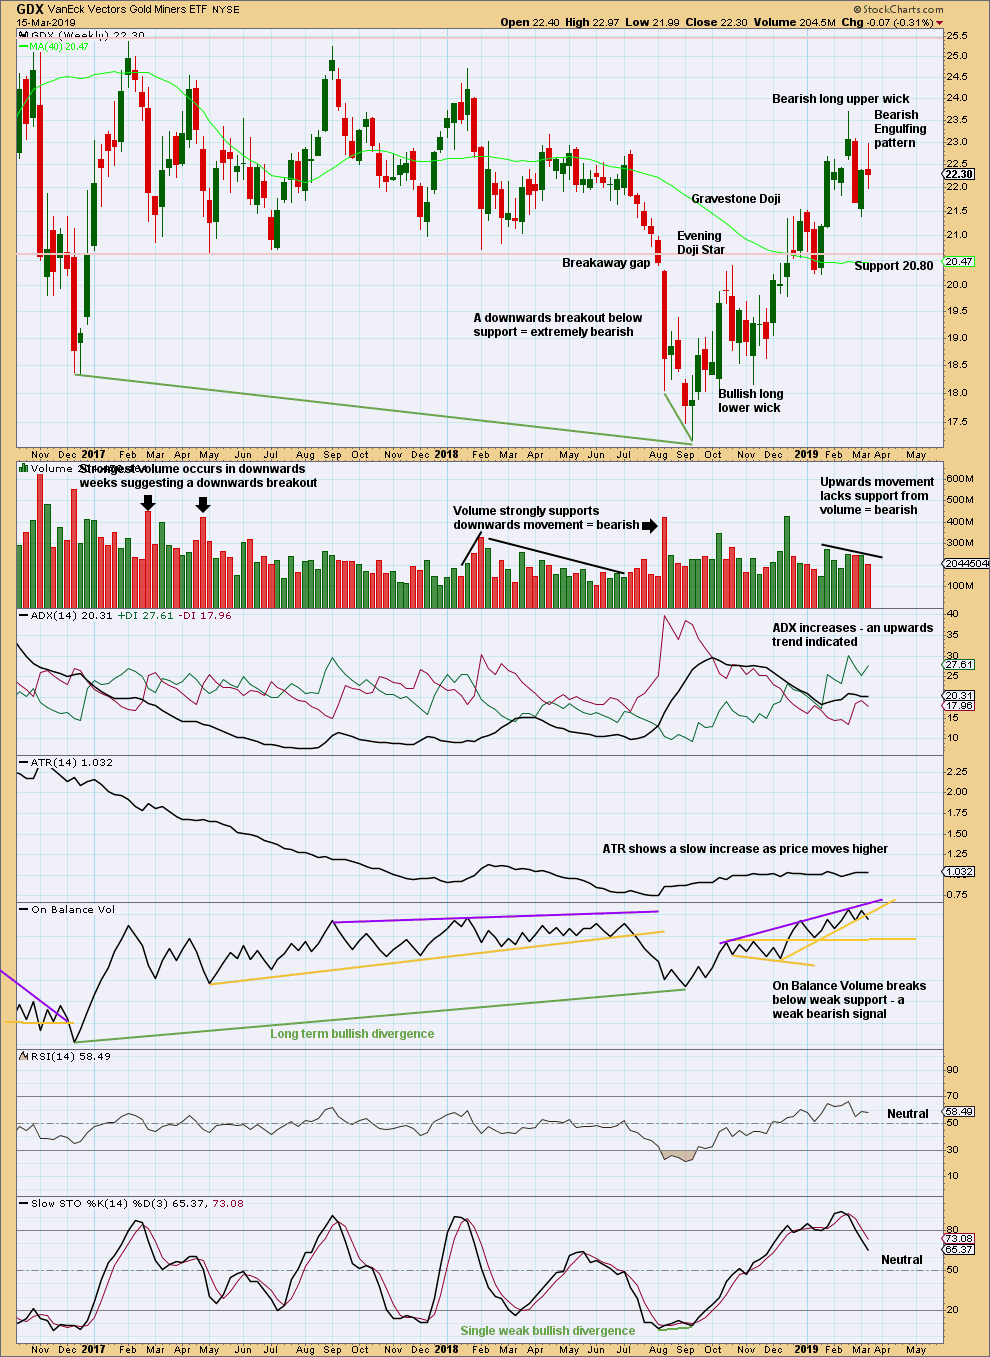
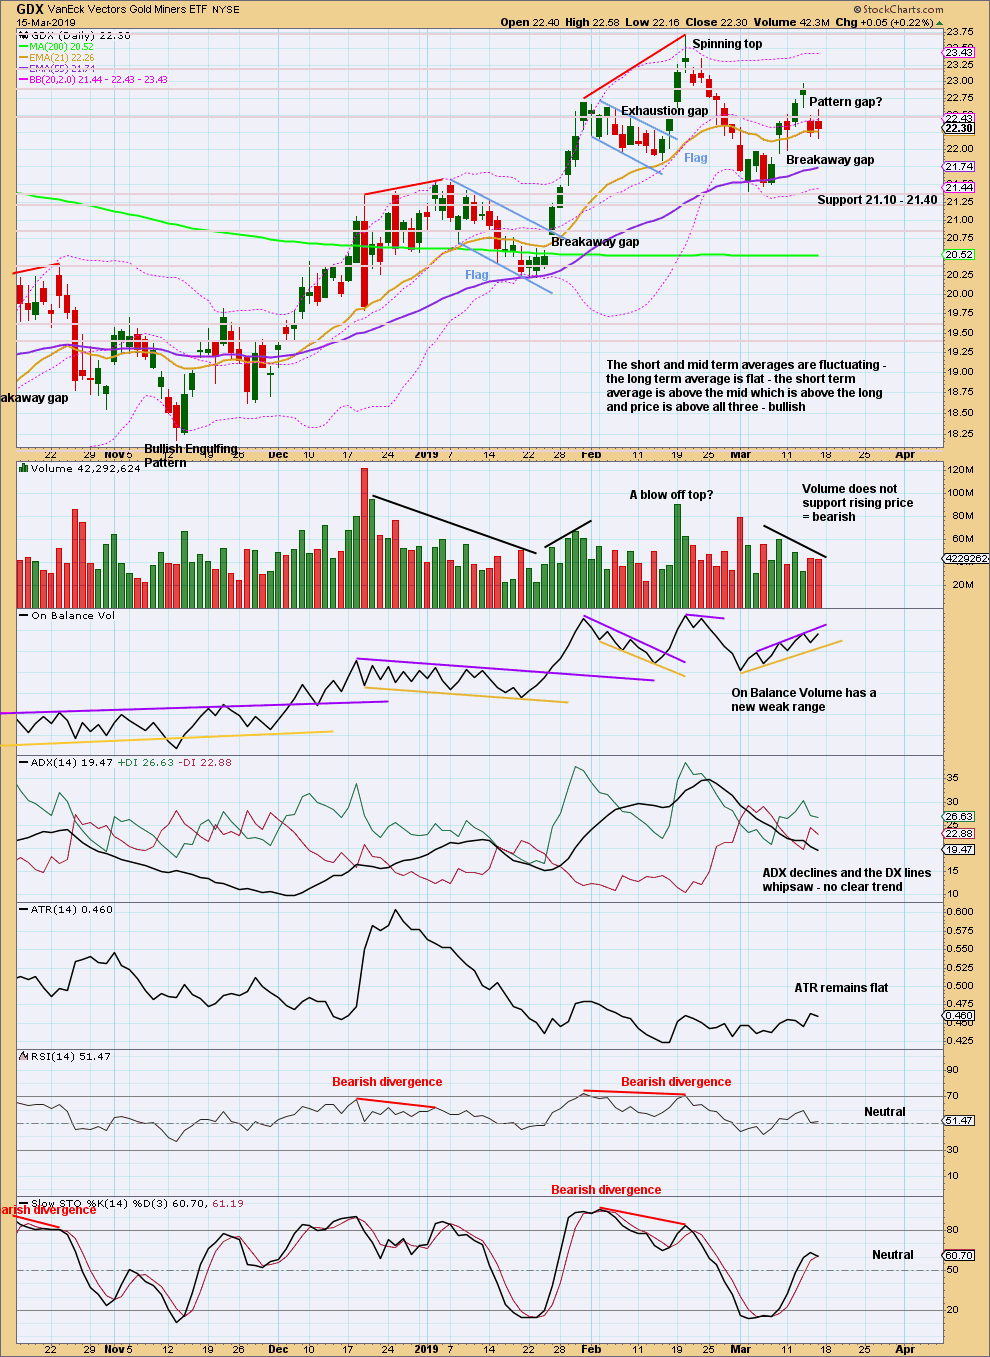
The Bearish Engulfing pattern at the weekly chart level should still be given weight in this analysis. It signals an end to the upwards trend and a new downwards or sideways trend.
This week completes an upwards week with the balance of volume down. The short-term volume profile should be judged on the daily chart. The mid-term profile is bearish. On Balance Volume is bearish.
Although ADX now indicates an upwards trend, this may be treated with some suspicion. A new swing low below the prior low of the week beginning 22nd January at 20.22 would confirm a trend change.
GDX DAILY CHART
Click chart to enlarge. Chart courtesy of StockCharts.com.
Friday saw an upwards breakout from a small consolidation that has support from volume and a breakaway gap. Look now for support at the breakaway gap at 21.89 and resistance above about 22.50 and then 22.90.
The short-term picture at the end of this week for GDX is inconclusive. A breakout is needed for clarity.
US OIL
A new high above 57.88 indicated the bounce was not over. The target remains the same.
Summary: The larger picture still sees Oil in a new downwards trend to end reasonably below 26.06.
While price remains within the channel on the daily chart, assume the bounce will continue. The target remains at 63.71.
If the target is wrong, it may be too high. There is now reasonable weakness in upwards movement. Price is within a strong zone of resistance. Stochastics is overbought. Look for this bounce to end soon.
If the channel is breached by a full daily candlestick below and not touching the lower edge, assume the bounce is over and a third wave down has begun.
MAIN ELLIOTT WAVE COUNT
MONTHLY CHART
Click chart to enlarge.
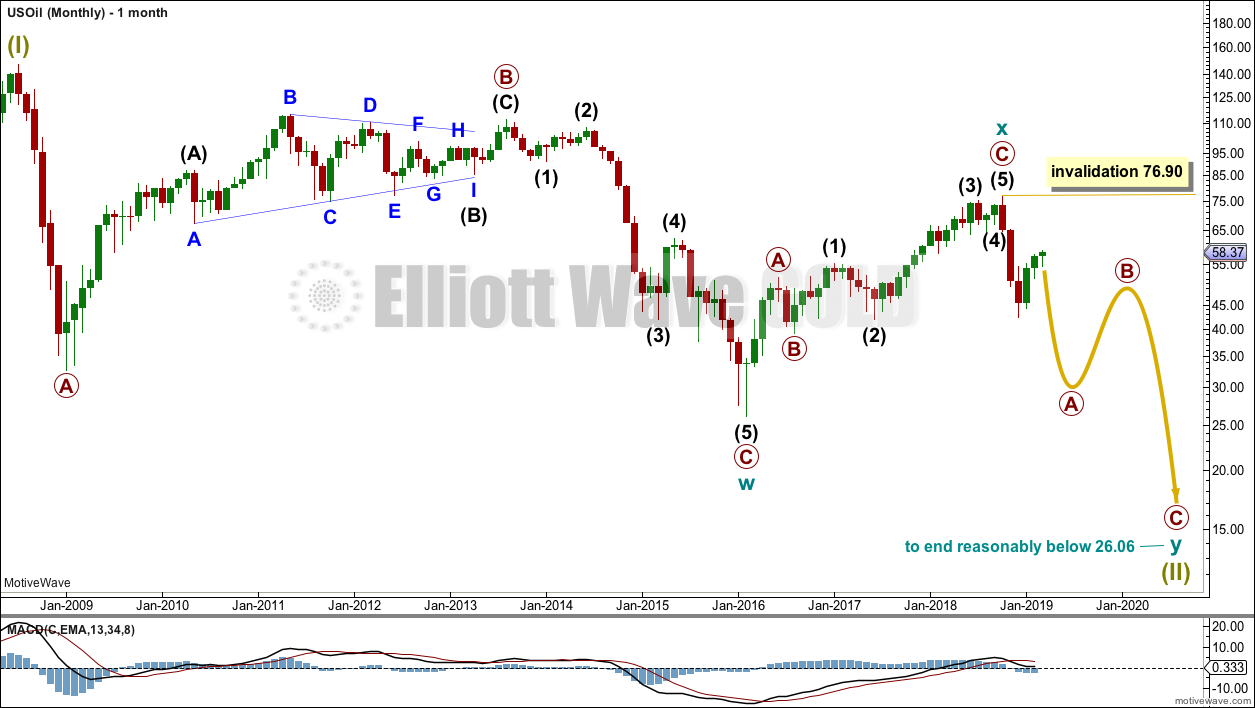
Classic technical analysis favours a bearish wave count for Oil at this time.
The large fall in price from the high in June 2008 to February 2016 is seen as a complete three wave structure. This large zigzag may have been only the first zigzag in a deeper double zigzag.
Upwards movement from February 2016 to October 2018 will not fit readily as a five wave structure but will fit very well as a three. With a three wave structure upwards, this indicates the bear market may not be over.
The first zigzag down is labelled cycle wave w. The double is joined by a now complete three in the opposite direction, a zigzag labelled cycle wave x.
The purpose of a second zigzag in a double is to deepen the correction when the first zigzag does not move price deep enough. Cycle wave y would be expected to move reasonably below the end of cycle wave w to deepen the correction. Were cycle wave y to reach equality with cycle wave w that takes Oil into negative price territory, which is not possible. Cycle wave y would reach 0.618 the length of cycle wave w at $2.33.
A better target calculation would be using the Fibonacci ratios between primary waves A and C within cycle wave y. This cannot be done until both primary waves A and B are complete.
Within cycle wave y, no second wave correction nor B wave may move beyond its start above 76.90.
WEEKLY CHART
Click chart to enlarge.
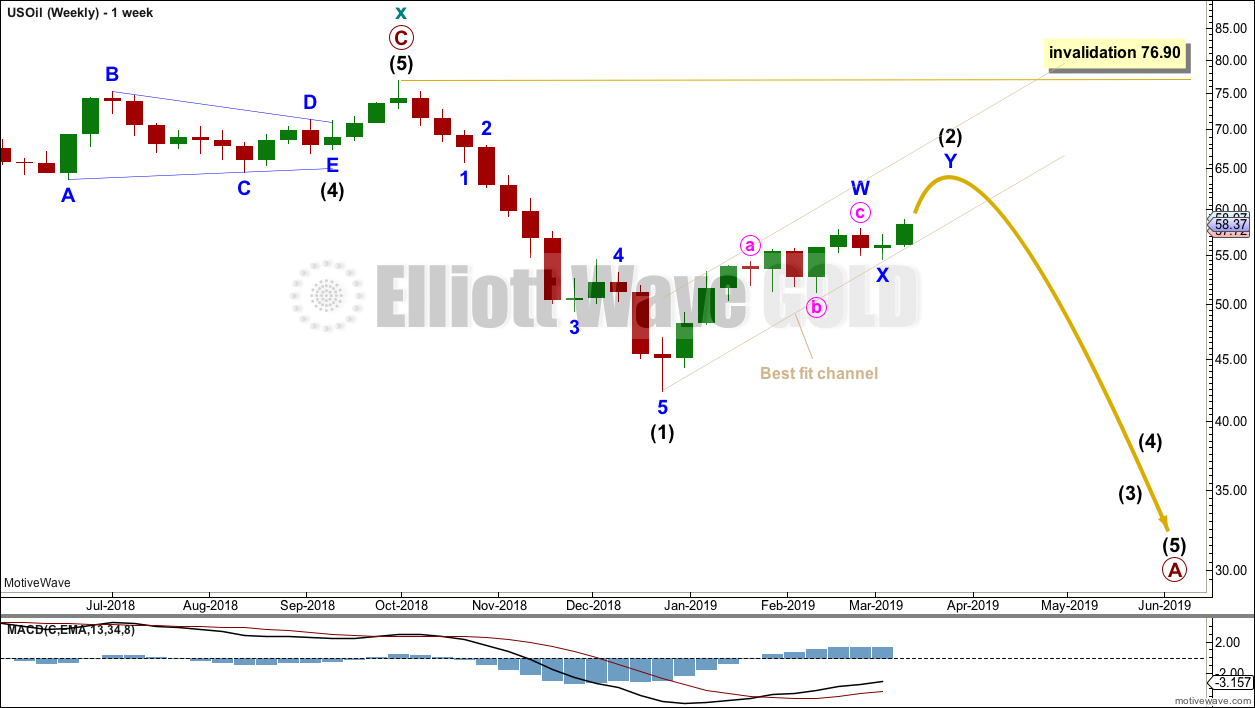
This weekly chart is focussed on the start of cycle wave y.
Cycle wave y is expected to subdivide as a zigzag. A zigzag subdivides 5-3-5. Primary wave A must subdivide as a five wave structure if this wave count is correct.
Within primary wave A, intermediate wave (1) may now be complete.
Intermediate wave (2) is a possibly incomplete double zigzag.
Intermediate wave (2) may not move beyond the start of intermediate wave (1) above 76.90.
DAILY CHART
Click chart to enlarge.
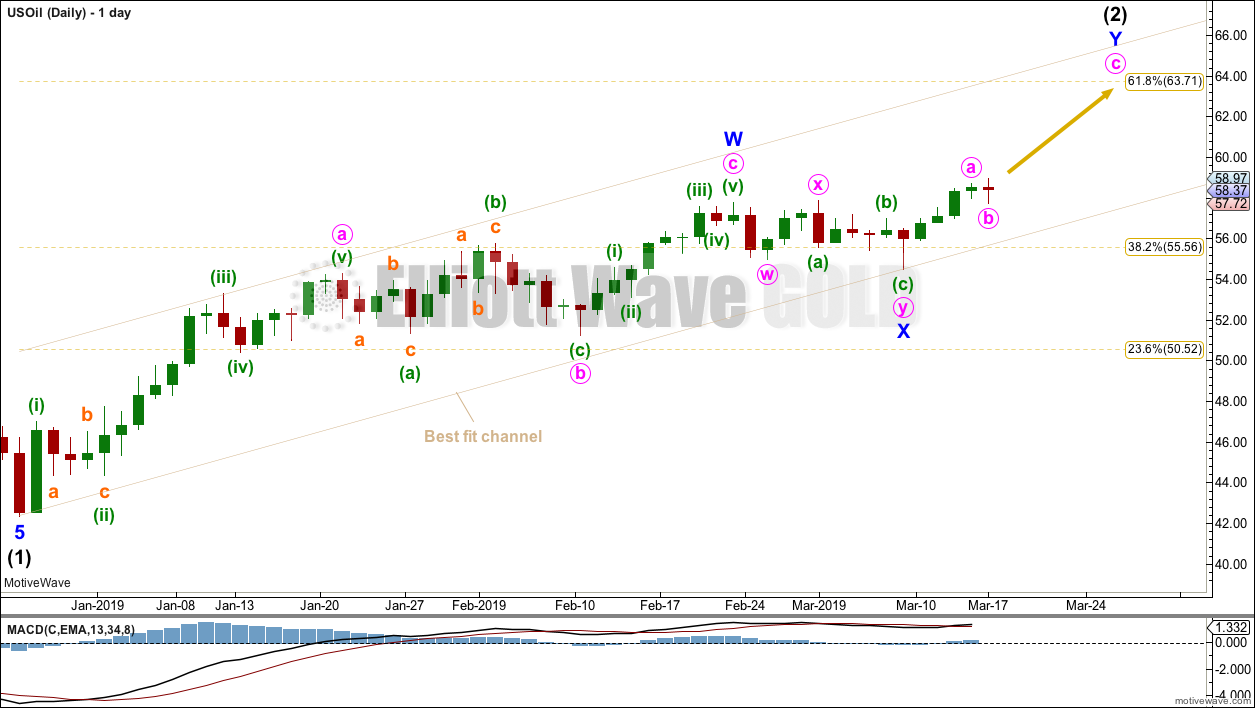
Always assume the trend remains the same until proven otherwise.
Intermediate wave (2) may be an incomplete double zigzag. The first zigzag may be complete, labelled minor wave W. The double may be joined by a three in the opposite direction, a double zigzag labelled minor wave X.
The maximum number of corrective structures in a multiple is three. Waves W, Y and Z may only subdivide as single corrective structures (they may not be multiples). But X waves may subdivide as any corrective structure including a multiple. However, X waves almost always subdivide as single zigzags, rarely do they subdivide as multiples. The structure of minor wave X for this wave count must be judged to reduce its probability. However, the alternate wave count in last week’s analysis is now invalidated. This main wave count is now the only wave count at this time frame.
The channel is drawn as a best fit. If this channel is breached by a full candlestick below and not touching it, that may indicate a trend change.
Minor wave Y may end about the 0.618 Fibonacci ratio at 63.71.
Intermediate wave (2) may not move beyond the start of intermediate wave (1) above 76.90.
TECHNICAL ANALYSIS
MONTHLY CHART
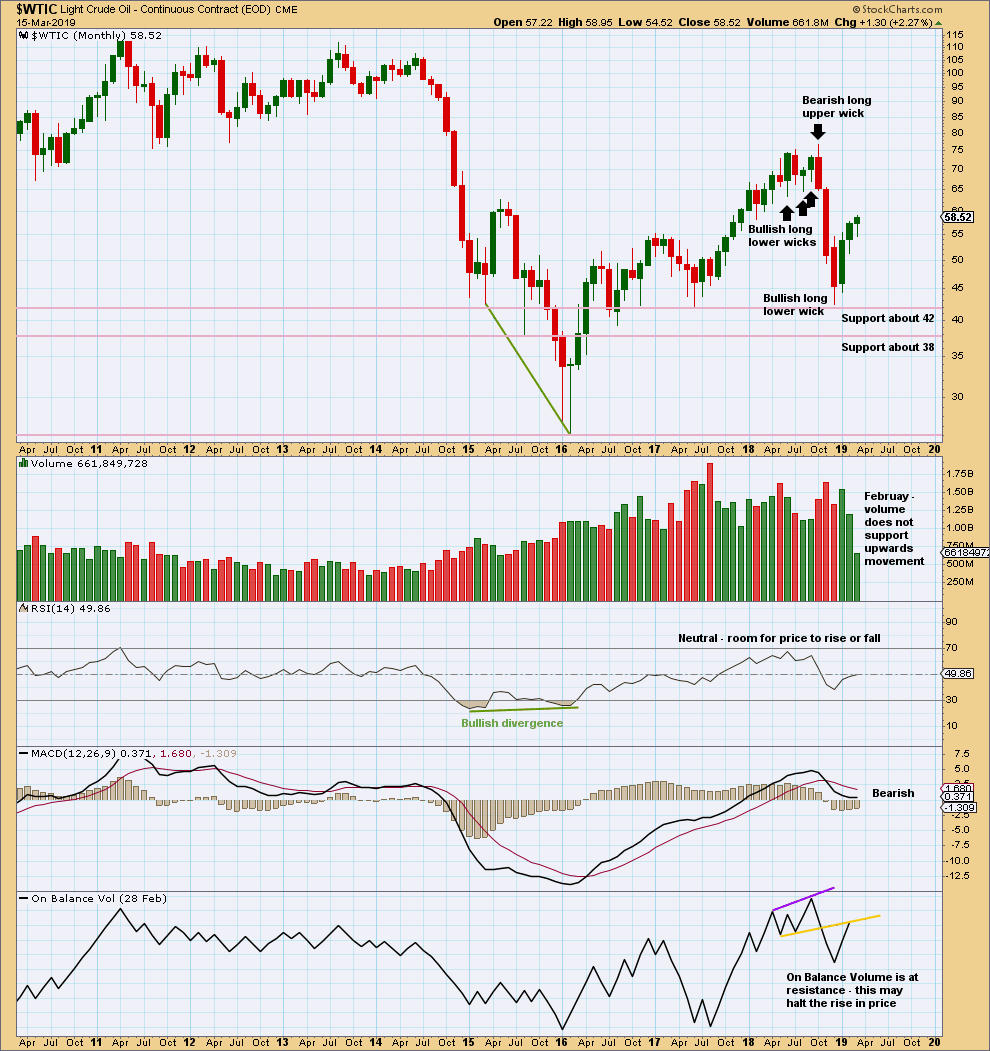
Click chart to enlarge. Chart courtesy of StockCharts.com.
Upwards movement for February lacks support from volume. This bounce may be ending here or very soon.
WEEKLY CHART
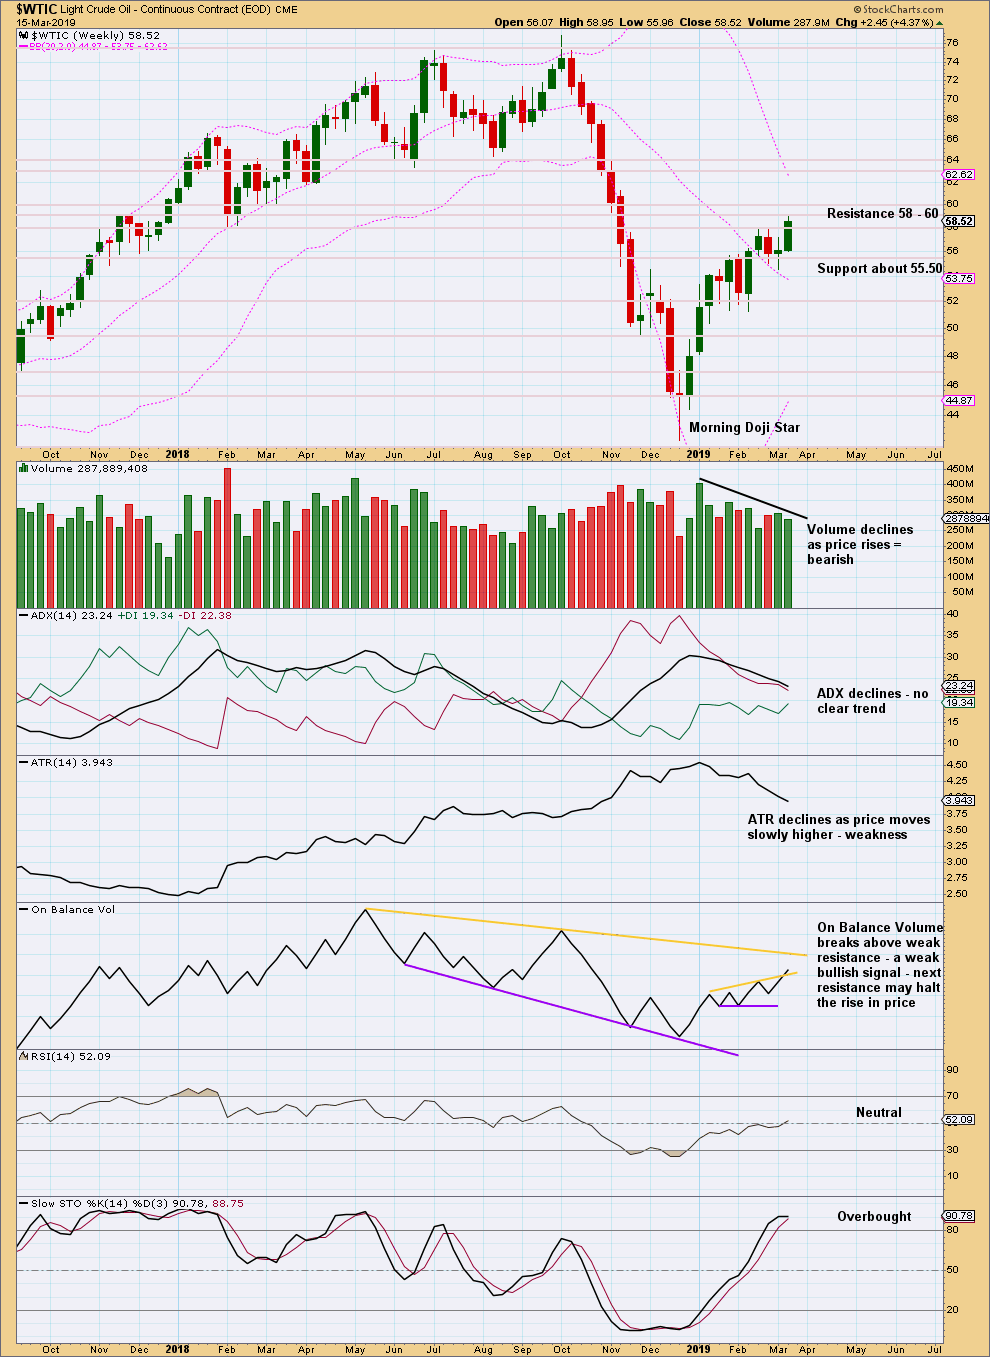
Click chart to enlarge. Chart courtesy of StockCharts.com.
Price is within a strong zone of resistance. Stochastics is overbought. It looks like this bounce may end here or very soon.
DAILY CHART
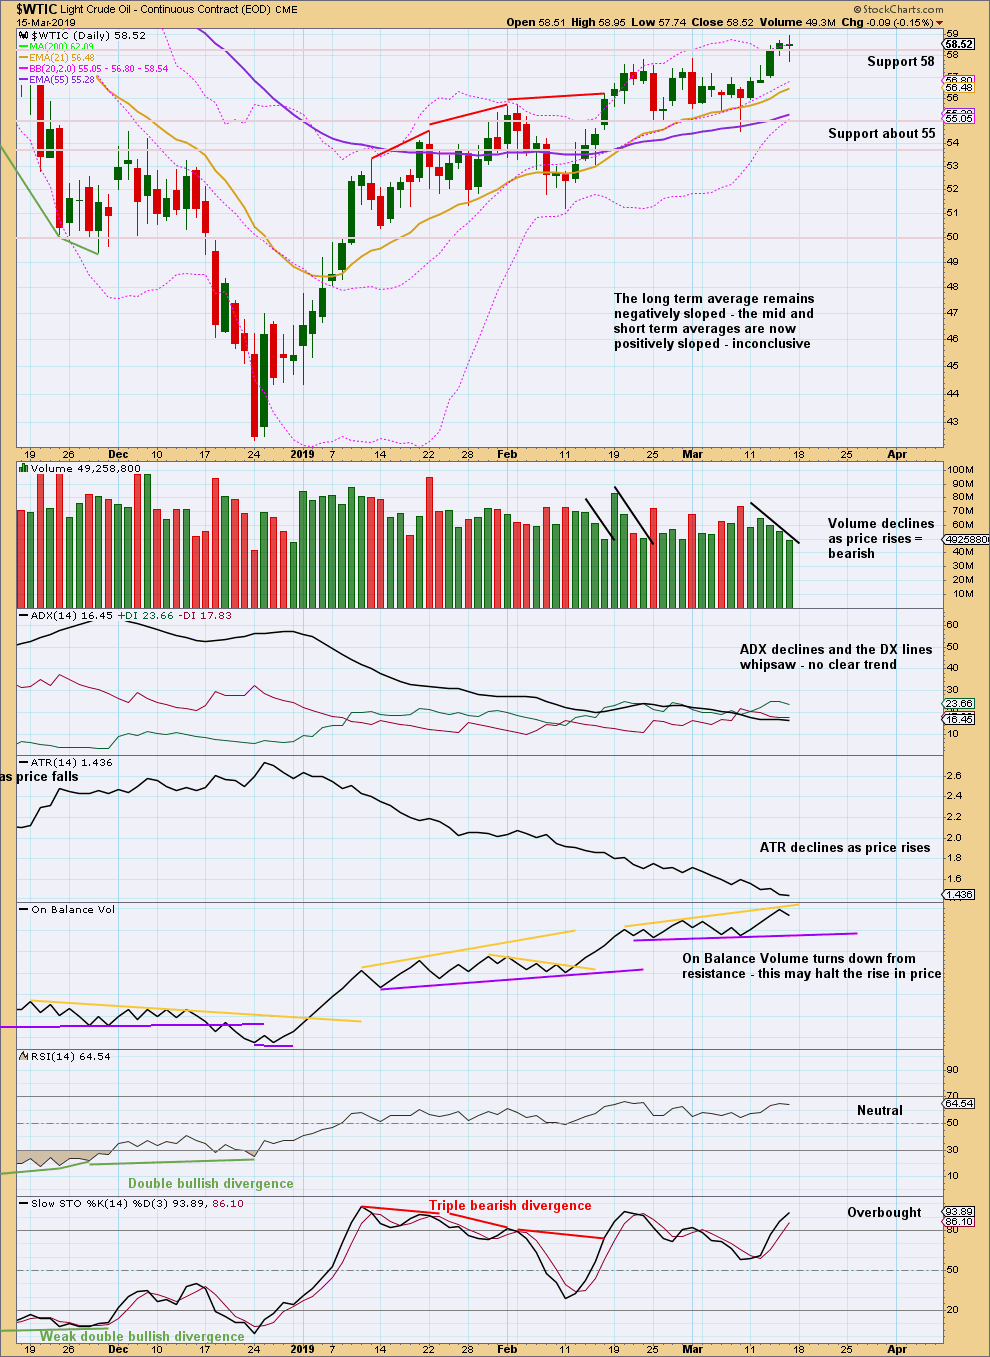
Click chart to enlarge. Chart courtesy of StockCharts.com.
Price has closed above resistance, which was about 58, but it lacks support from volume. No confidence may be had in this upwards breakout.
With no clear trend and Stochastics overbought and volume weak, it looks like this bounce may end here or very soon.
—
Always practice good risk management as the most important aspect of trading. Always trade with stops and invest only 1-5% of equity on any one trade. Failure to manage risk is the most common mistake new traders make.
A tremendous long term shorting opportunity on gold is just about to materialize. The risk reward ratio is very attractive. A short position can be entered around 1320 with a stop loss at 1346. The potential move short term is to 1250 and long term to around 1000. This kind of opportunity does not come along every day. I will be taking advantage of it sometime very soon. Just a little bit more upside to go.
Thanks Lara for all your great analysis and commentary. In the seven years I have been following you, your work on the precious metals has been outstanding. Quite impressive to me.
Thanks Rodney!
For Gold, even if my preferred count turns out to not be the right one and it turns out to be a more bullish count like the double zigzag, all counts are still expecting a fair bit of downwards movement here for the mid term anyway.
So with them all pointing in the same direction, that adds some confidence in the expectation.
Hi Laura, since the spike low, Gold has now made both a higher low followed by a higher high today. The USD also seems to be rolling over and heading lower. Any thoughts?
Here is a Gold (GLD) chart showing today’s price action. Right after the FMOC announcement, the USD tanked and Gold took out its previous high after the spike down low. It also looks like GLD is putting in a micro 5 up out of the early March low.
The bounce for Gold is almost done. This still looks like a counter trend movement, and from a classic TA POV it looks like a bear flag unfolding.
I expect it will be done very soon, my short term target now for Gold to turn is 1,318 – 1,322. That may be too high.
And…
My name is Lara.
Not Laura.
A common mistake. 🙂
Thanks Lara! I am not an EW expert but this looks like it could be the start of a 5th wave up in Gold & GDX.
I would have a really hard time seeing a third wave impulse in this move up from the low on 7th March.
The first and second wave, that’s okay. But the third wave beginning 11th March and ending 21st March? Way too much overlapping in there to count it as an impulse.
The key to this idea is does it fit on the hourly chart time frame? Taking some time on the hourly chart to have a look, that may answer your query.
Thanks, Laura for all your great work.
On the SPX count you are reviewing, another respected EW analyst thinks this is a b wave rally into a lower 4th wave before wave 5 starts (see chart). Any thoughts or comments?
IMO this has way too much internal strength for a B wave.
From a pure Elliott wave perspective such a count would be possible. But the two 90% upwards days after the low, and new highs from market breadth, indicate the probability is too low to take very seriously.
Thankyou Laura!
Its Lara !!