

S&P 500
While the short-term invalidation point was breached on Friday, the larger picture remains mostly the same and has support from classic technical analysis.
Summary: For the very short term, Monday may see a little more downwards movement. The short-term target is about 2,796. Thereafter, the upwards trend should resume. The mid-term target remains the same at 3,010.
The final target remains the same at 3,045.
Lowry’s data shows rising Buying Power and falling Selling Pressure. The latter is now just a few points of its low for the entire bull market (beginning March 2009). This situation is normally associated with a strong and healthy bull market. Pullbacks are normal and to be expected, and they are more likely to be short term.
The biggest picture, Grand Super Cycle analysis, is here.
Last published monthly charts are here. Video is here.
ELLIOTT WAVE COUNTS
WEEKLY CHART
Click chart to enlarge.
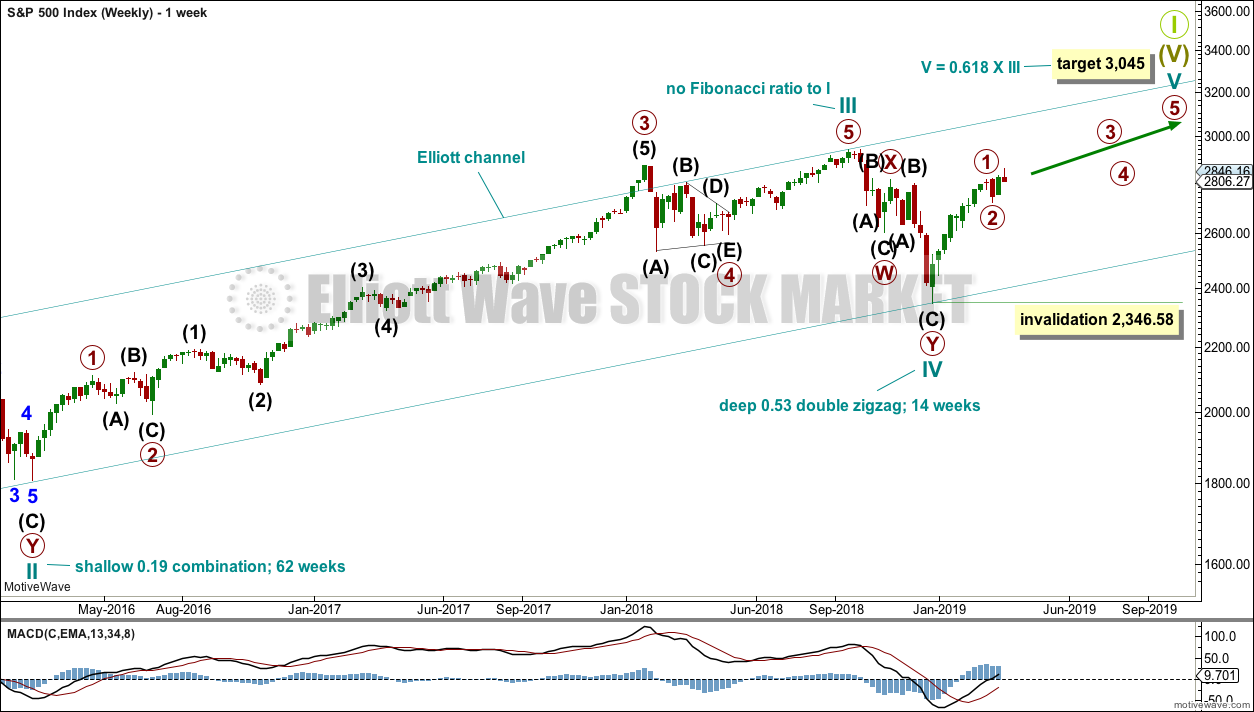
This weekly chart shows all of cycle waves III, IV and V so far.
Cycle wave II fits as a time consuming double combination: flat – X – zigzag. Combinations tend to be more time consuming corrective structures than zigzags. Cycle wave IV has completed as a multiple zigzag that should be expected to be more brief than cycle wave II.
Cycle wave IV may have ended at the lower edge of the Elliott channel.
Within cycle wave V, no second wave correction may move beyond the start of its first wave below 2,346.58.
Although both cycle waves II and IV are labelled W-X-Y, they are different corrective structures. There are two broad groups of Elliott wave corrective structures: the zigzag family, which are sharp corrections, and all the rest, which are sideways corrections. Multiple zigzags belong to the zigzag family and combinations belong to the sideways family. There is perfect alternation between the possible double zigzag of cycle wave IV and the combination of cycle wave II.
Although there is gross disproportion between the duration of cycle waves II and IV, the size of cycle wave IV in terms of price makes these two corrections look like they should be labelled at the same degree. Proportion is a function of either or both of price and time.
Draw the Elliott channel about Super Cycle wave (V) with the first trend line from the end of cycle wave I (at 2,079.46 on the week beginning 30th November 2014) to the high of cycle wave III, then place a parallel copy on the low of cycle wave II. Cycle wave V may find resistance about the upper edge.
It is possible that cycle wave V may end in October 2019. If it does not end there, or if the AD line makes new all time highs during or after June 2019, then the expectation for cycle wave V to end would be pushed out to March 2020 as the next possibility. Thereafter, the next possibility may be October 2020. March and October are considered as likely months for a bull market to end as in the past they have been popular. That does not mean though that this bull market may not end during any other month.
MAIN WAVE COUNT
DAILY CHART
Click chart to enlarge.
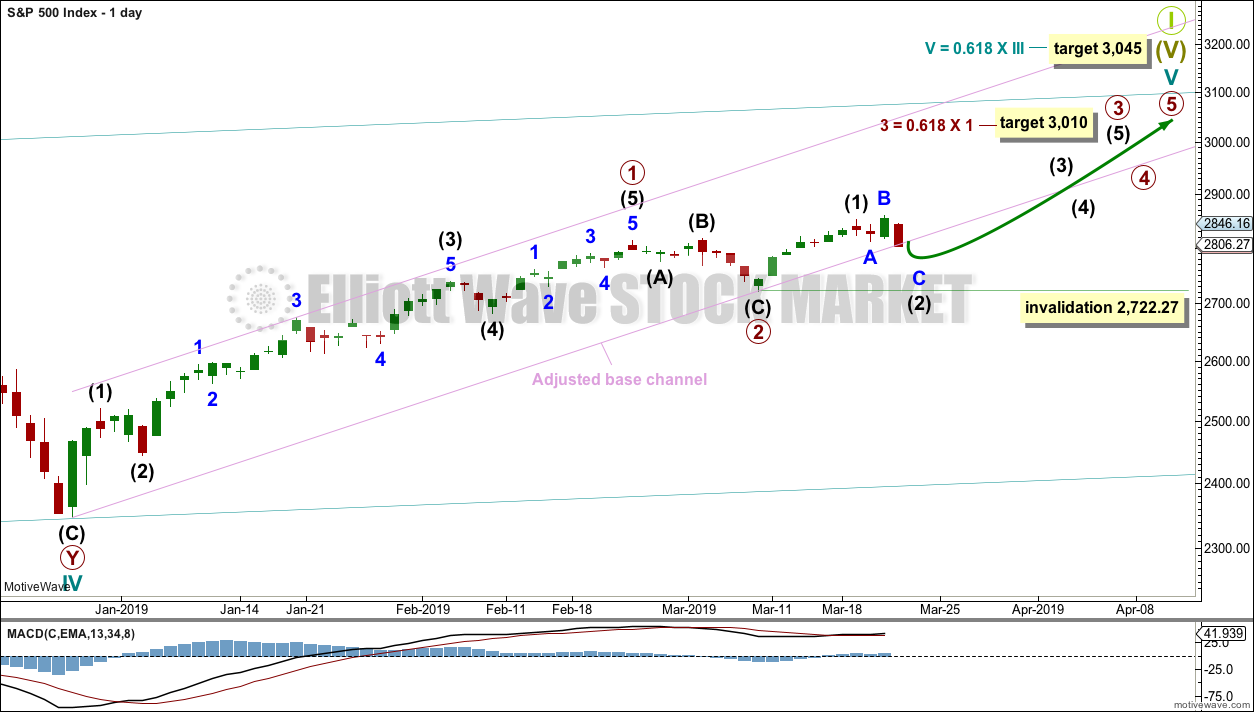
The daily chart will focus on the structure of cycle wave V.
Within Super Cycle wave (V), cycle wave III may not be the shortest actionary wave. Because cycle wave III is shorter than cycle wave I, this limits cycle wave V to no longer than equality in length with cycle wave III at 3,477.39. A target is calculated for cycle wave V to end prior to this point.
Cycle wave V must subdivide as a five wave motive structure, either an impulse or an ending diagonal. An impulse is much more common and that will be how it is labelled. A diagonal would be considered if overlapping suggests it.
Price has closed above resistance, which was about 2,815, on an upwards day with support from volume. This classic upwards breakout above resistance indicates underlying strength. This may be the early stage of a third wave. Primary waves 1 and 2 may both be over. Primary wave 2 may have been a very brief and shallow expanded flat correction.
Primary wave 3 may now exhibit an increase in upwards momentum. A target is calculated that fits with the higher target for cycle wave V to end.
Within primary wave 3, intermediate wave (2) may not move beyond the start of intermediate wave (1) below 2,722.27.
Intermediate wave (2) may be an almost complete expanded flat correction. Minor wave B within intermediate wave (2) is 1.2 times the length of minor wave A, which is within the most common range for B waves of flats from 1 to 1.38. At 2,796 minor wave C would reach 1.618 times the length of minor wave A. This may be about where intermediate wave (2) may end on Monday.
The lower edge of the adjusted base channel may provide support for pullbacks along the way up. Price has closed below the lower edge of this channel on Friday, but the channel is not properly breached. Price may find support about here. If this channel is breached by a full daily candlestick below and not touching the lower edge, then consider the alternate daily chart below.
ALTERNATE WAVE COUNT
DAILY CHART
Click chart to enlarge.
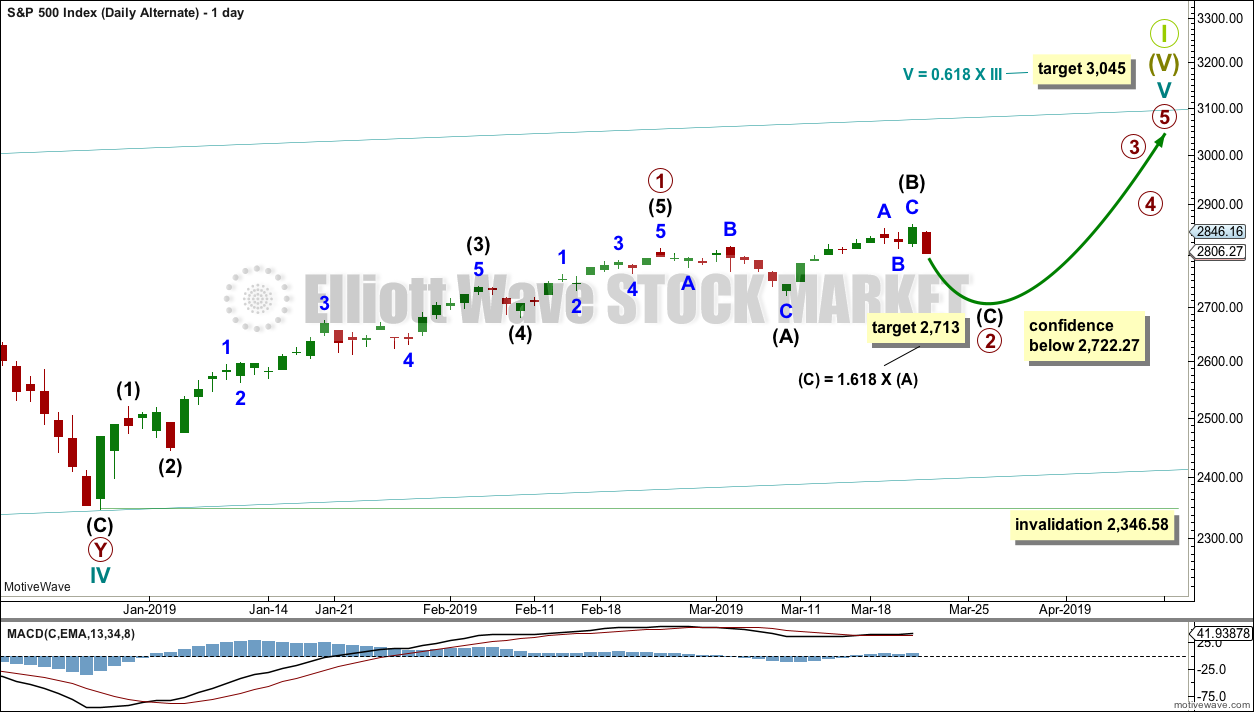
It is also possible that primary wave 2 may continue as an expanded flat correction.
Intermediate wave (B) is 1.51 times the length of intermediate wave (A). This is longer than the common range of 1 to 1.38 but within allowable limits of up to 2.
A target is calculated for intermediate wave (C); it expects to exhibit the most common Fibonacci ratio to intermediate wave (A).
Primary wave 2 may not move beyond the start of primary wave 1 below 2,346.58.
TECHNICAL ANALYSIS
WEEKLY CHART
Click chart to enlarge. Chart courtesy of StockCharts.com.
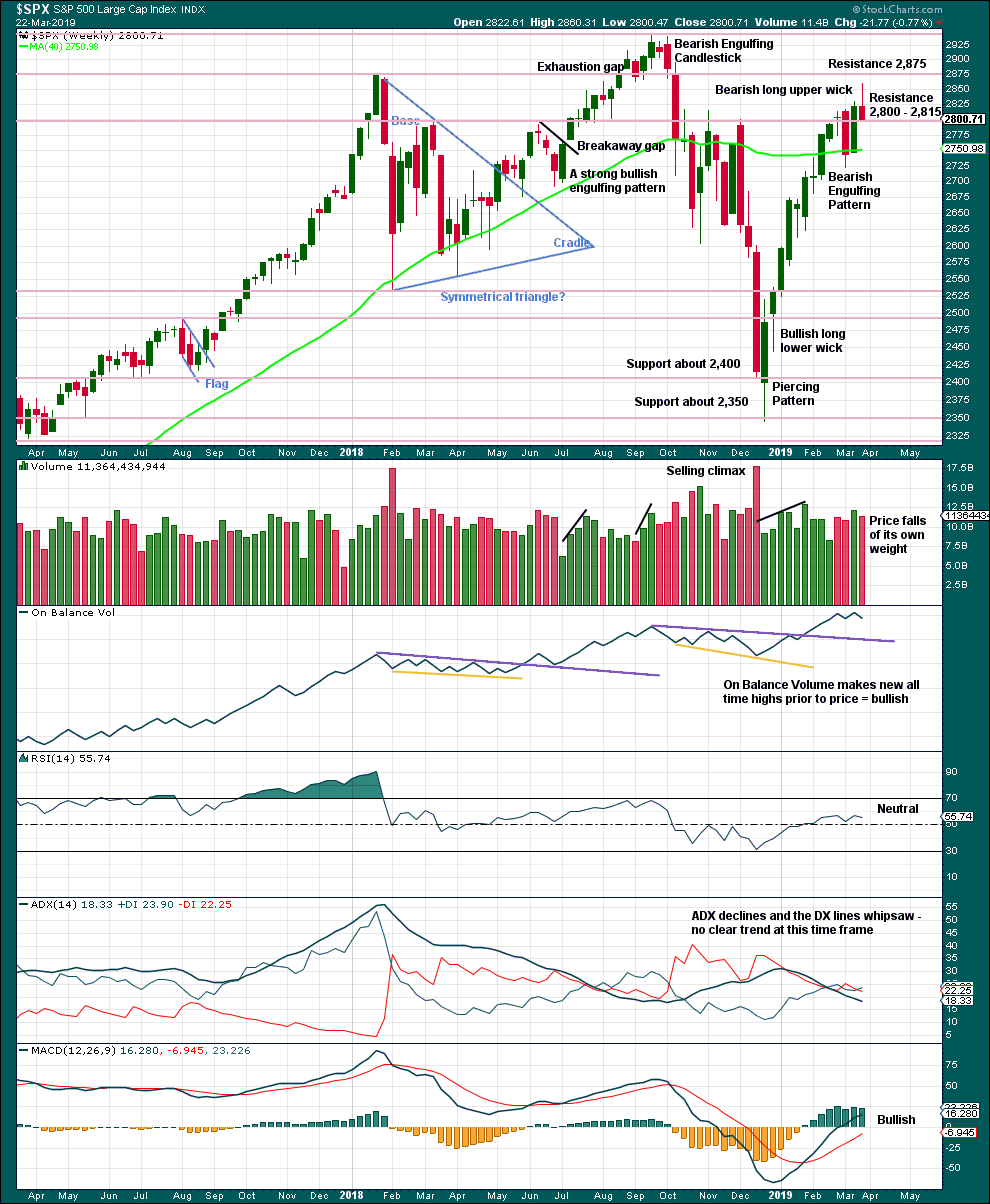
The long upper wick this week is bearish.
Support at 2,800 remains. Price has not closed below this point yet.
DAILY CHART
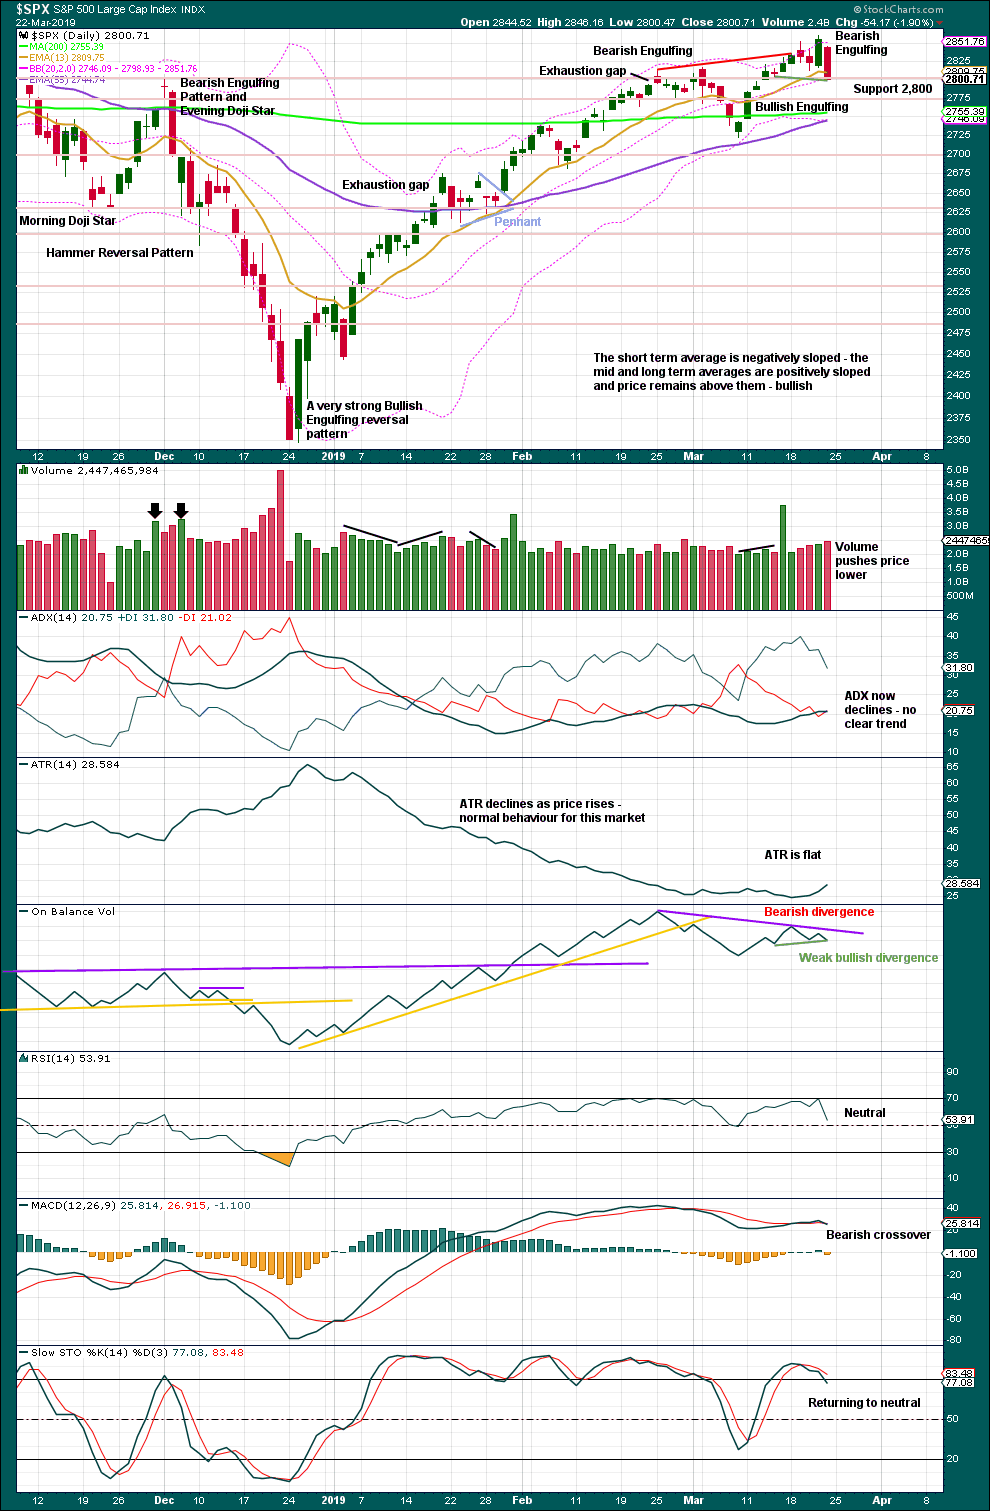
Click chart to enlarge. Chart courtesy of StockCharts.com.
The December 2018 low is expected to remain intact. The two 90% upwards days on 26th December 2018 and 6th January 2019 indicate this upwards trend has internal strength.
Friday’s candlestick engulfs several prior candlesticks. After a clear upwards trend, this is a bearish reversal signal. This supports the alternate Elliott wave count.
Volume is bearish for the short term. ADX no longer indicates an upwards trend.
However, On Balance Volume now exhibits some short-term bullish divergence (after exhibiting some bearish divergence). This pullback may be more shallow than the candlestick suggests.
Lowry’s data shows rising Buying Power and falling Selling Pressure. The latter is now just a few points of its low for the entire bull market (beginning March 2009). This situation is normally associated with a strong and healthy bull market. Pullbacks are normal and to be expected, and they are more likely to be short term.
BREADTH – AD LINE
WEEKLY CHART
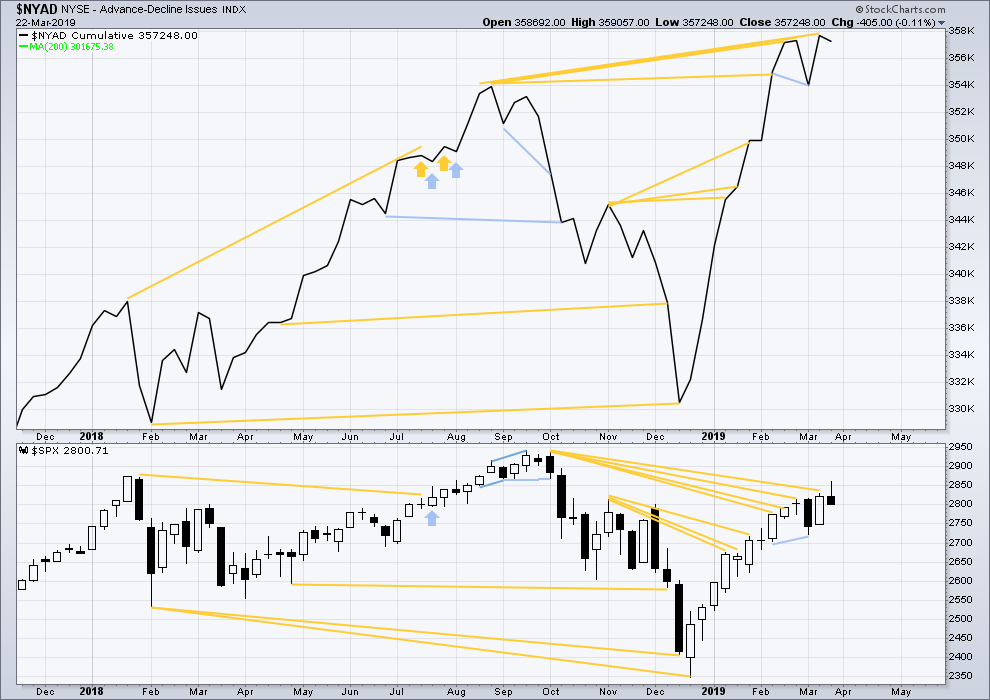
Click chart to enlarge. Chart courtesy of StockCharts.com. So that colour blind members are included, bearish signals
will be noted with blue and bullish signals with yellow.
Every single bear market from the Great Depression and onwards has been preceded by a minimum of 4 months divergence between price and the AD line. With the AD line making a new all time high again last week, the end of this bull market and the start of a new bear market must be a minimum of 4 months away, which is the end of July 2019 at this time.
This week both price and the AD line declined. The AD line is not declining any faster than price, there is no short term divergence.
This week mid and large caps have declined but have not made new swing lows below the prior swing low of the 8th of March. Small caps have made a new low below their 8th of March low. There is some weakness in this downwards movement. Large caps remain strongest and the decline is focussed mostly in small caps.
DAILY CHART
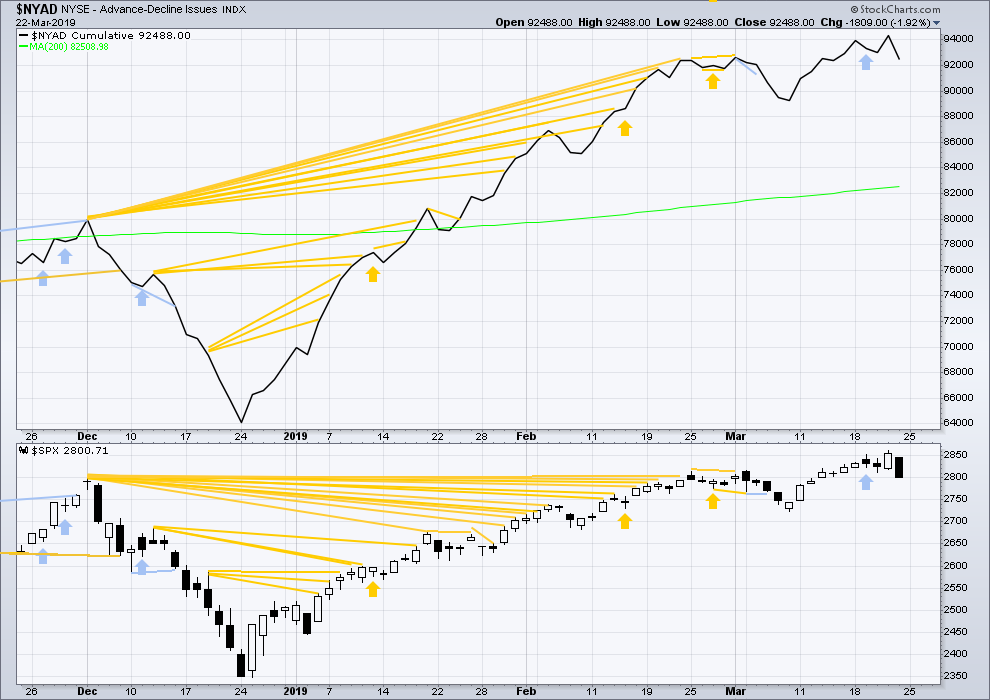
Click chart to enlarge. Chart courtesy of StockCharts.com. So that colour blind members are included, bearish signals
will be noted with blue and bullish signals with yellow.
Breadth should be read as a leading indicator.
Both price and the AD line moved lower on Friday. There is no short-term divergence.
VOLATILITY – INVERTED VIX CHART
WEEKLY CHART
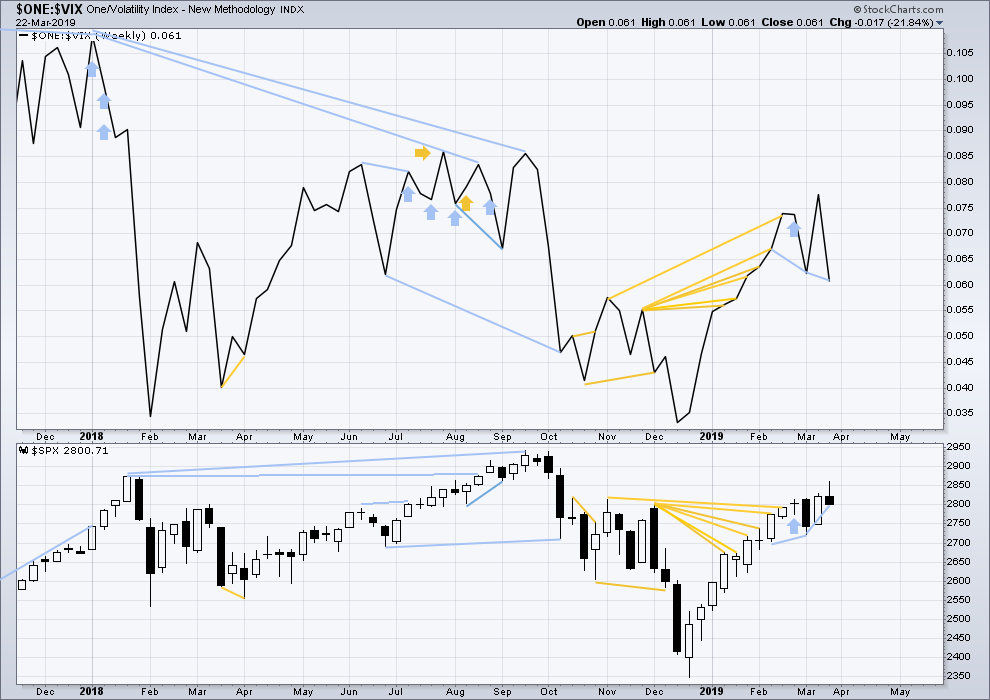
Click chart to enlarge. Chart courtesy of StockCharts.com. So that colour blind members are included, bearish signals
will be noted with blue and bullish signals with yellow.
Inverted VIX has made a new short-term high and a mid-term high along with price. Upwards movement comes with a decline in VIX. There is no short nor mid-term divergence.
Longer-term divergence between price and inverted VIX at the last all time high in September 2018 remains.
DAILY CHART
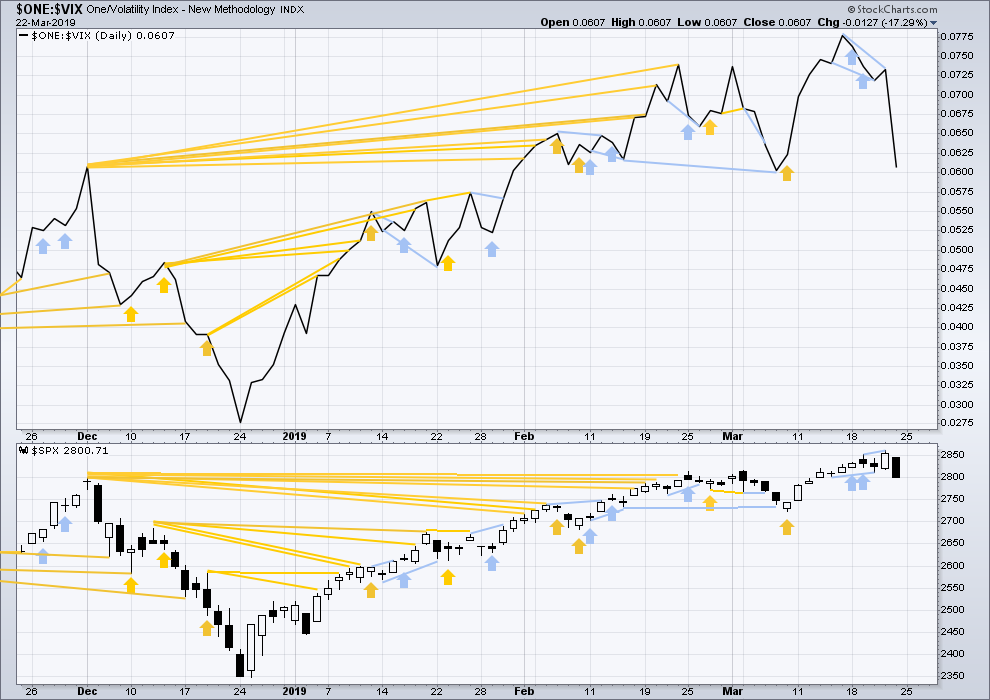
Click chart to enlarge. Chart courtesy of StockCharts.com. So that colour blind members are included, bearish signals
will be noted with blue and bullish signals with yellow.
Today price has made a new high above the high of the 15th of March, but inverted VIX has not. Upwards movement does not come with a normal corresponding decline in VIX. This divergence is bearish for the short term.
DOW THEORY
Dow Theory confirmed a bear market in December 2018. This does not necessarily mean a bear market at Grand Super Cycle degree though; Dow Theory makes no comment on Elliott wave counts. On the 25th of August 2015 Dow Theory also confirmed a bear market. The Elliott wave count sees that as part of cycle wave II. After Dow Theory confirmation of a bear market in August 2015, price went on to make new all time highs and the bull market continued.
DJIA: 23,344.52 – a close on the 19th of December at 23,284.97 confirms a bear market.
DJT: 9,806.79 – price has closed below this point on the 13th of December.
S&P500: 2,532.69 – a close on the 19th of December at 2,506.96 provides support to a bear market conclusion.
Nasdaq: 6,630.67 – a close on the 19th of December at 6,618.86 provides support to a bear market conclusion.
With all the indices moving now higher, Dow Theory would confirm a bull market if the following highs are made:
DJIA: 26,951.81
DJT: 11,623.58
S&P500: 2,940.91
Nasdaq: 8,133.30.
For the short term, all of the S&P500, DJIA, DJT and Nasdaq remain above the last swing low of the 8th of March. For the short term, all these markets have shown a series of higher highs and higher lows from the major low in December 2018. All remain currently in an upwards trend.
GOLD
A bounce on Friday remains below the short-term invalidation point. The mid and long-term targets remain the same.
Summary: Three long-term targets are now calculated for cycle wave c to end. Confidence in a new downwards trend may be had with a new low below 1,160.75.
The mid-term target for a third wave down is at 1,217. A target calculated using the flag is about 1,236.
For the short term, a breach of the best fit channel on the daily chart would add some confidence that the downwards trend has resumed.
Grand SuperCycle analysis is here.
Last monthly charts are here. Video is here.
MAIN ELLIOTT WAVE COUNT
WEEKLY CHART – TRIANGLE
Click chart to enlarge.
This is the preferred wave count.
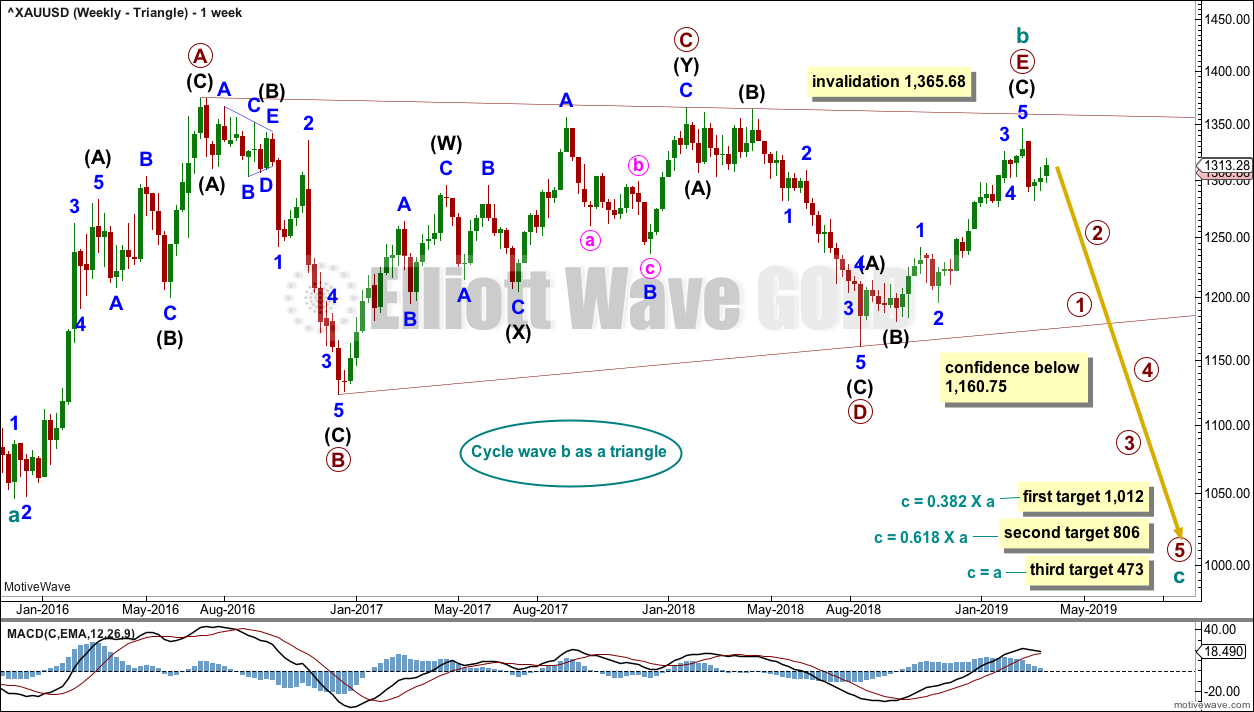
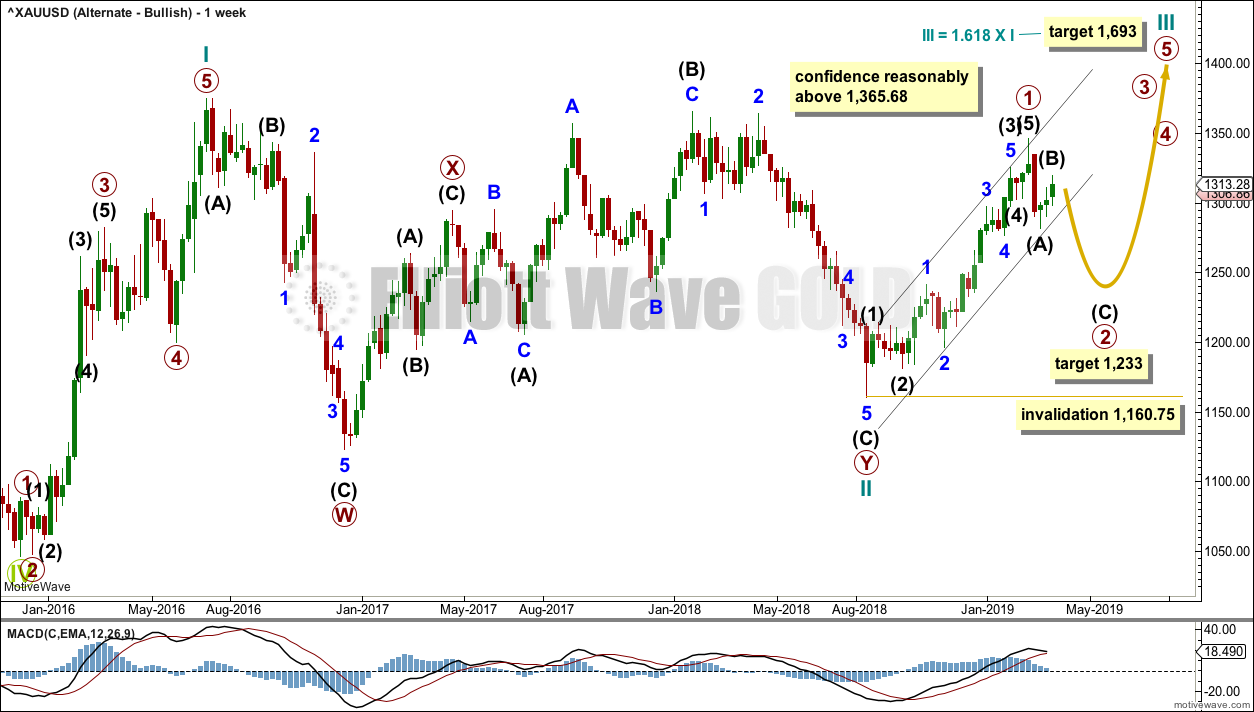
Cycle wave b may be a complete regular contracting triangle. If it continues further, then primary wave E may not move beyond the end of primary wave C above 1,365.68.
Four of the five sub-waves of a triangle must be zigzags, with only one sub-wave allowed to be a multiple zigzag. Wave C is the most common sub-wave to subdivide as a multiple, and this is how primary wave C for this example fits best.
There are no problems in terms of subdivisions or rare structures for this wave count. It has an excellent fit and so far a typical look.
This wave count would expect a cycle degree trend change has recently occurred. Cycle wave c would most likely make new lows below the end of cycle wave a at 1,046.27 to avoid a truncation.
Primary wave E should exhibit reasonable weakness as it comes to an end. Triangles often end with declining ATR, weak momentum and weak volume.
If this weekly wave count is correct, then cycle wave c downwards should develop strength, ATR should show some increase, and MACD should exhibit an increase in downwards momentum.
Three targets are calculated for cycle wave c. Cycle wave a lasted 4.25 years. Cycle wave b may be over in 3.17 years. Cycle wave c may last a minimum of 2 years and possibly up to 5 years.
DAILY CHART – TRIANGLE
Click chart to enlarge.
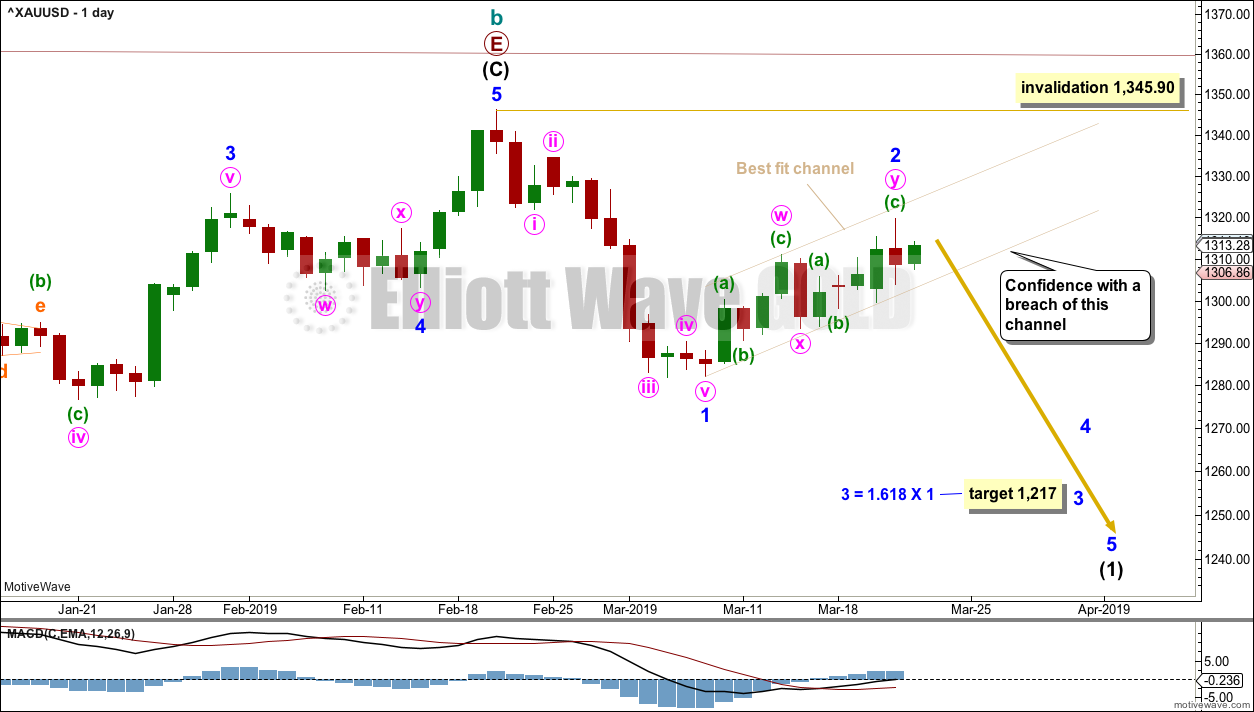
Cycle wave c must subdivide as a five wave structure, either an impulse or an ending diagonal. An impulse is much more common and that shall be how it is labelled unless overlapping suggests a diagonal should be considered.
A new trend at cycle degree should begin with a five wave structure on the daily chart, which will be labelled minor wave 1.
Minor wave 2 subdivides well as a double zigzag at lower time frames and now looks complete. A best fit channel is drawn about minor wave 2. When this channel is breached by a full daily candlestick below and not touching the lower edge, that would provide strong confidence that minor wave 2 should be over and minor wave 3 should be underway.
Minor wave 2 may not move beyond the start of minor wave 1 above 1,345.90. The invalidation point will remain the same while price remains within the channel. The risk that minor wave 2 may still continue higher remains.
WEEKLY CHART – DOUBLE ZIGZAG
Click chart to enlarge.
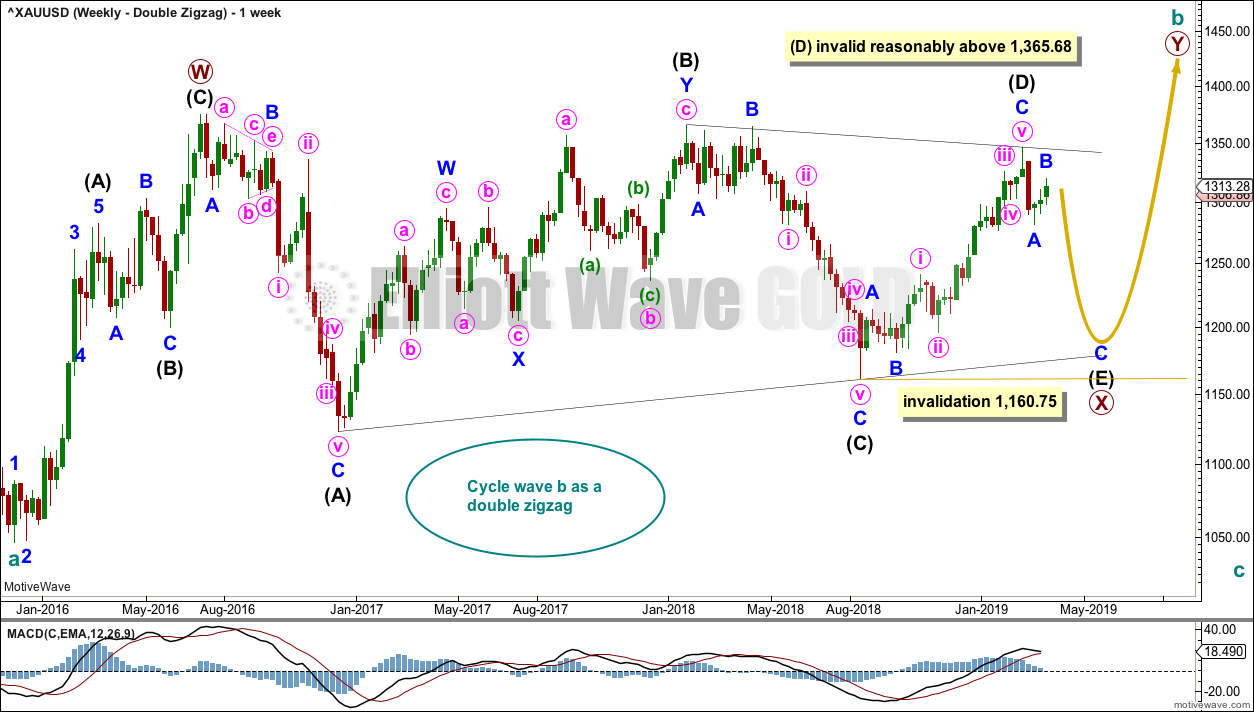
It is possible that cycle wave b may be an incomplete double zigzag or a double combination.
The first zigzag in the double is labelled primary wave W. This has a good fit.
The double may be joined by a corrective structure in the opposite direction, a triangle labelled primary wave X. The triangle would be about four fifths complete.
Within multiples, X waves are almost always zigzags and rarely triangles. Within the possible triangle of primary wave X, it is intermediate wave (B) that is a multiple; this is acceptable, but note this is not the most common triangle sub-wave to subdivide as a multiple. These two points reduce the probability of this wave count.
Intermediate wave (D) may be complete. The (B)-(D) trend line is almost perfectly adhered to with the smallest overshoot within intermediate wave (C). This is acceptable.
Intermediate wave (E) should continue to exhibit weakness: ATR should continue to show a steady decline, and MACD may begin to hover about zero.
Intermediate wave (E) may not move beyond the end of intermediate wave (C) below 1,160.75.
This wave count may now expect downwards movement for several weeks.
Primary wave Y would most likely be a zigzag because primary wave X would be shallow; double zigzags normally have relatively shallow X waves.
Primary wave Y may also be a flat correction if cycle wave b is a double combination, but combinations normally have deep X waves. This would be less likely.
This wave count has good proportions and no problems in terms of subdivisions.
Intermediate wave (E) should subdivide as a zigzag labelled minor waves A-B-C. Zigzags subdivide 5-3-5, exactly the same the start of an impulse.
The preferred wave count labels downwards movement minor waves 1-2-3, and this wave count labels downwards movement minor waves A-B-C. At the daily level, the subdivisions for both wave counts are seen in the same way.
ALTERNATE ELLIOTT WAVE COUNT
WEEKLY CHART
Click chart to enlarge.
If Gold is in a new bull market, then it should begin with a five wave structure upwards on the weekly chart. However, the biggest problem with this wave count is the structure labelled cycle wave I because this wave count must see it as a five wave structure, but it looks more like a three wave structure.
Commodities often exhibit swift strong fifth waves that force the fourth wave corrections coming just prior to be more brief and shallow than their counterpart second waves. It is unusual for a commodity to exhibit a quick second wave and a more time consuming fourth wave, and this is how cycle wave I is labelled. The probability of this wave count is low due to this problem.
Cycle wave II subdivides well as a double combination: zigzag – X – expanded flat.
Cycle wave III may have begun. Within cycle wave III, primary wave 1 may now be complete. The target for primary wave 2 is the 0.618 Fibonacci ratio of primary wave 1. Primary wave 2 may not move beyond the start of primary wave 1 below 1,160.75.
A black channel is drawn about primary wave 1. Primary wave 2 may breach the lower edge of this channel.
Cycle wave III so far for this wave count would have been underway now for 27 weeks. It should be beginning to exhibit some support from volume, increase in upwards momentum and increasing ATR. However, volume continues to decline, ATR continues to decline and is very low, and momentum is weak in comparison to cycle wave I. This wave count lacks support from classic technical analysis.
TECHNICAL ANALYSIS
WEEKLY CHART
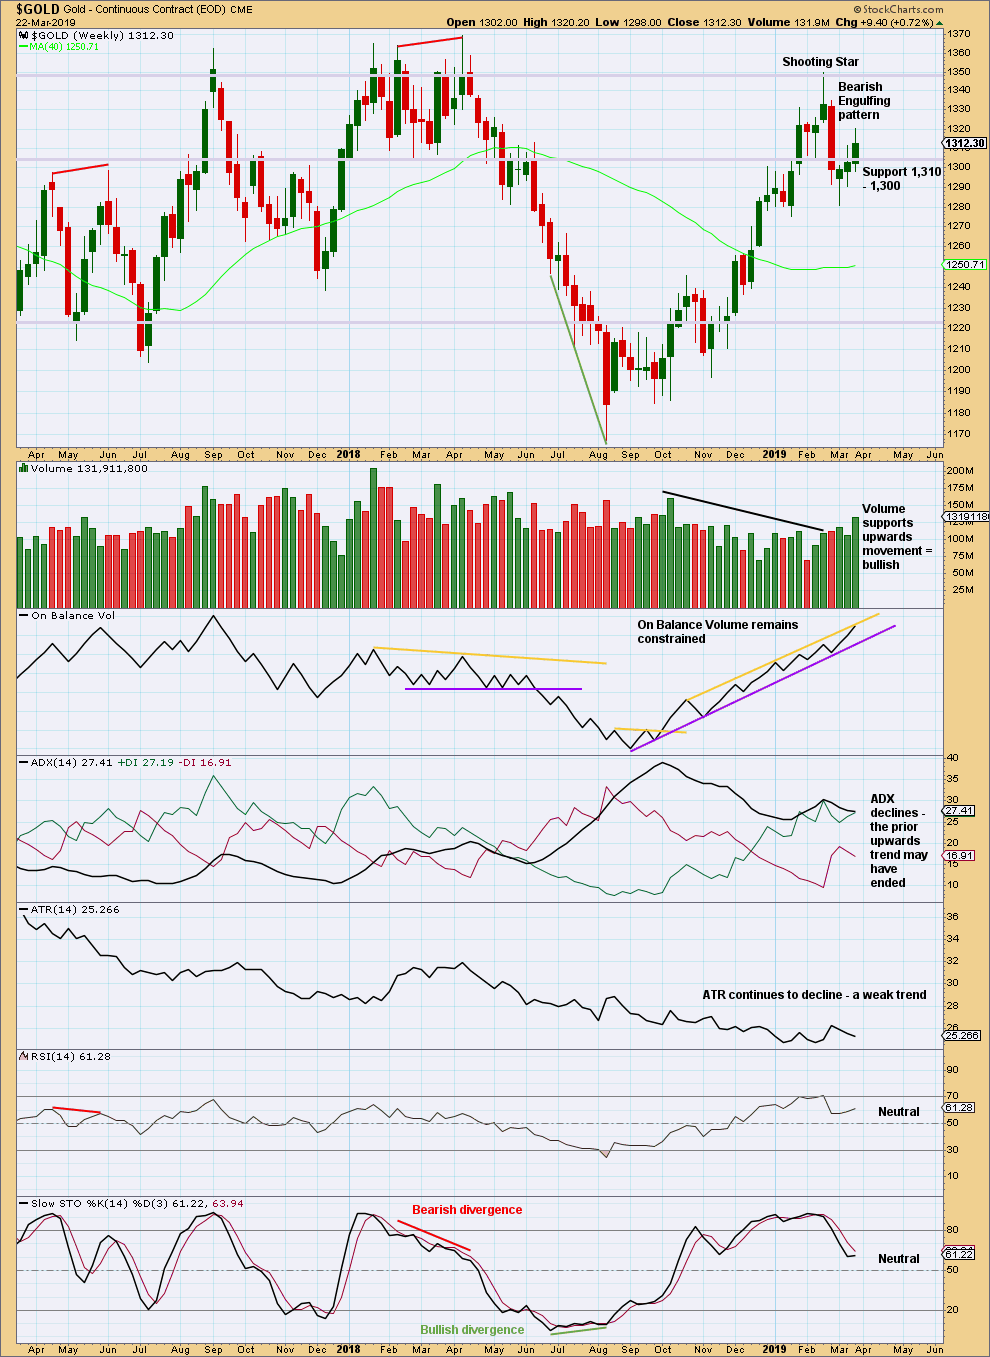
Click chart to enlarge. Chart courtesy of StockCharts.com.
Support from volume for upwards movement suggests more upwards movement next week.
Support about 1,310 – 1,300 was breached by downwards movement, and resistance there has now been breached by upwards movement. This area of prior strong support and resistance has by now been weakened.
DAILY CHART
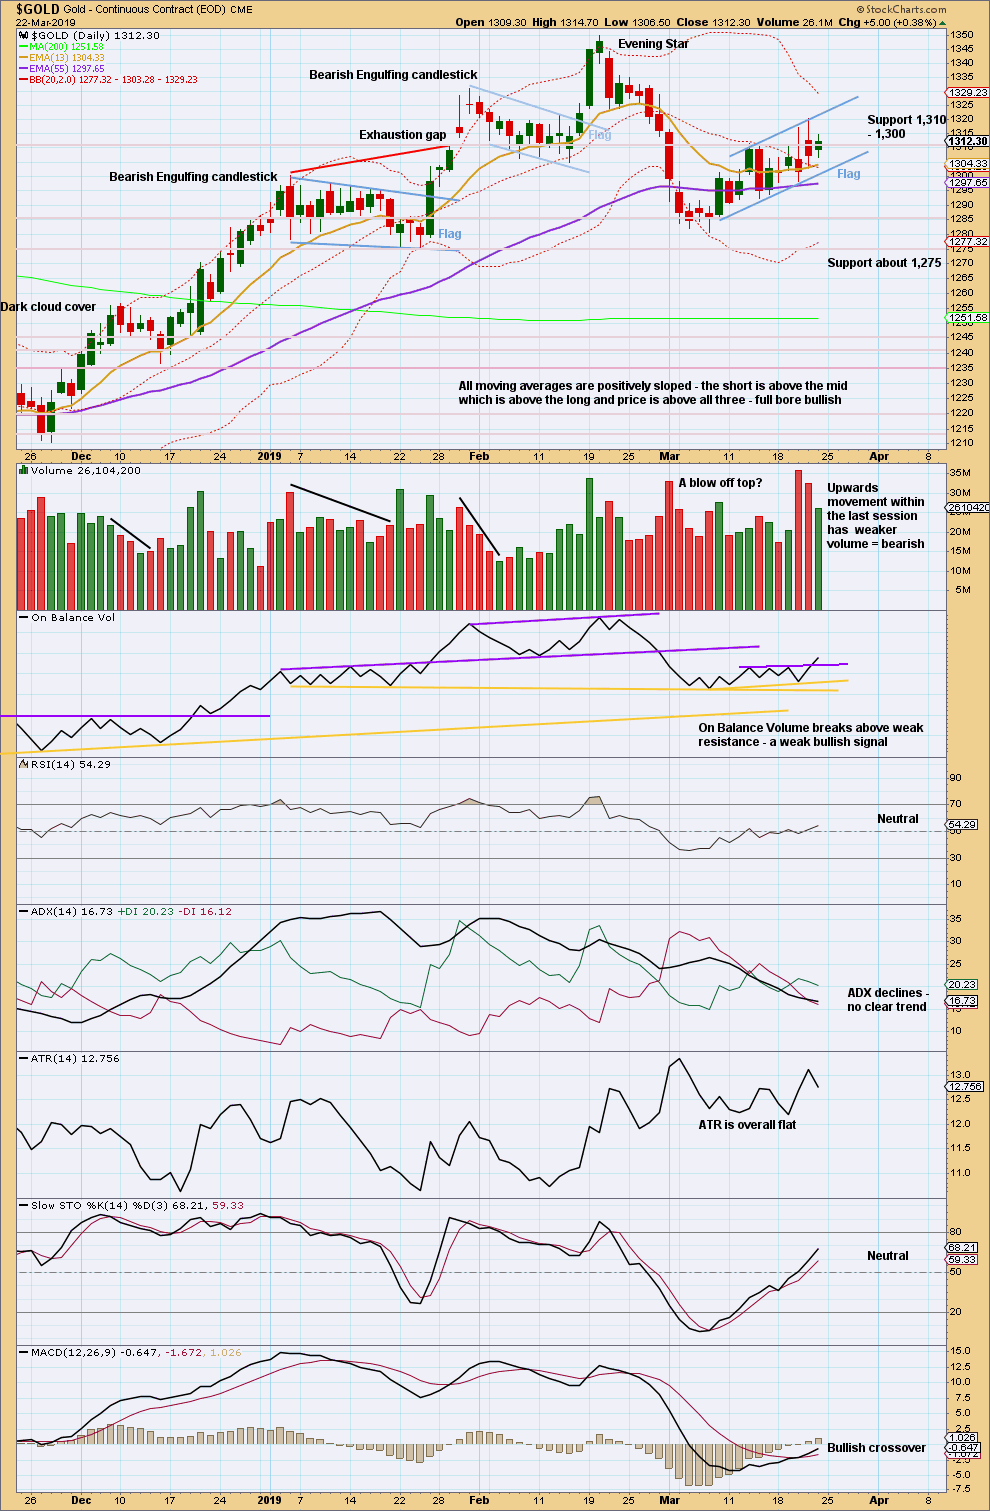
Click chart to enlarge. Chart courtesy of StockCharts.com.
The short-term volume profile is unclear. Overall, it looks slightly bearish (but not clear enough for confidence).
The bullish signal from On Balance Volume today is not strong; the trend line breached has not been long held.
The flag pattern remains valid. The best performing flags and pennants complete within 14 sessions. So far this one has lasted 11 sessions. Flags are reliable continuation patterns. A downwards breakout would be expected. The target calculated using the flag pole is about 1,236.
GDX WEEKLY CHART
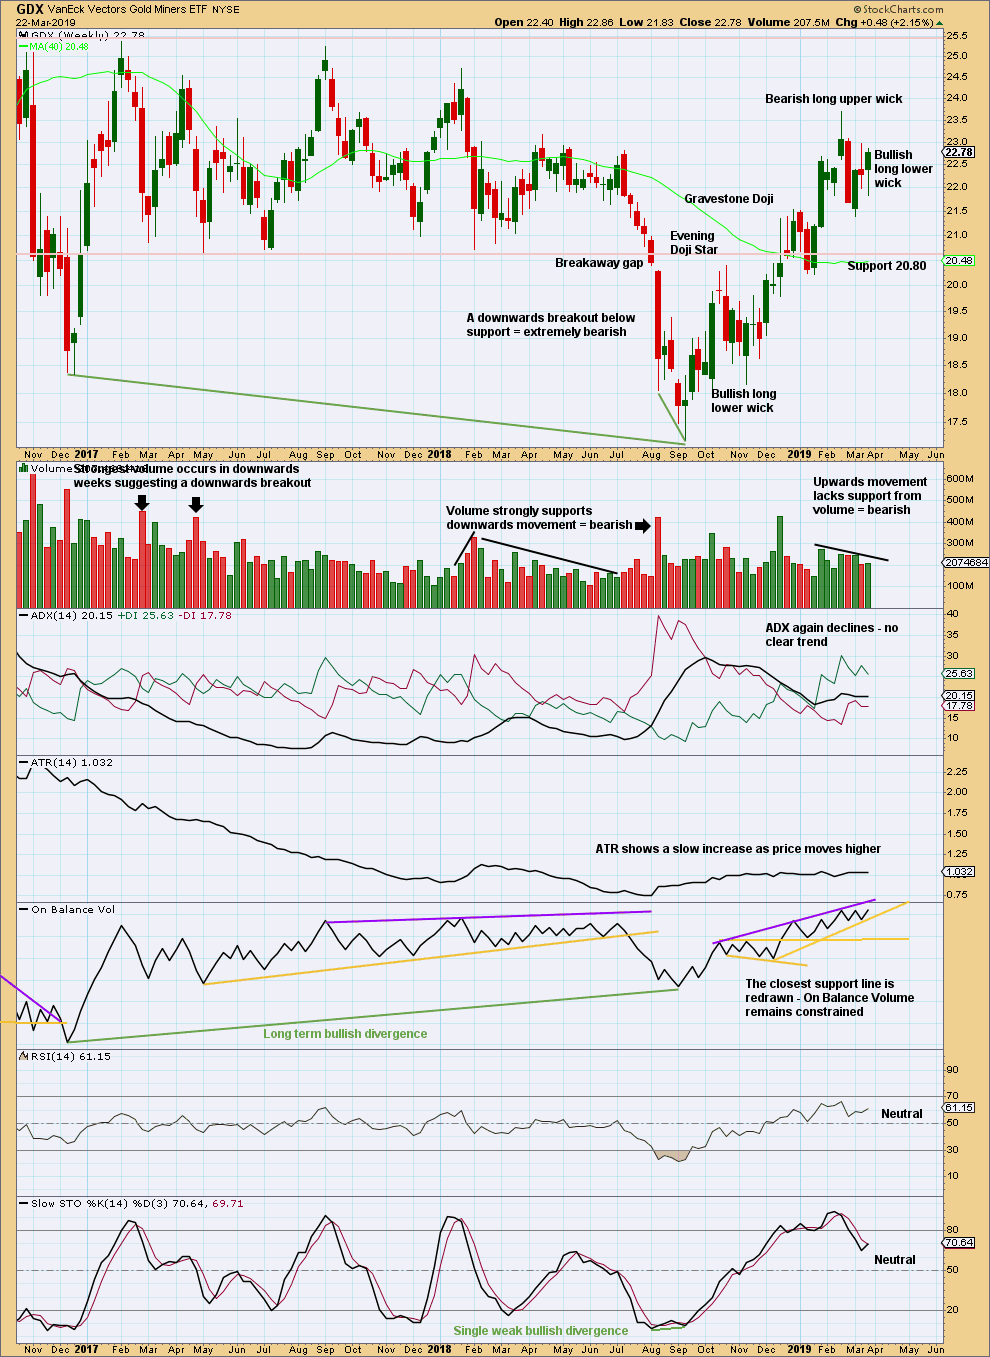
Click chart to enlarge. Chart courtesy of StockCharts.com.
A new swing low below the prior low of the week beginning 22nd January at 20.22 would confirm a trend change. For now GDX may be assumed to remain in an upwards trend. There is a series of higher highs and higher lows from the low in September 2018.
For the short term, a bullish long lower wick and price closing near the high for the week suggest more upwards movement next week.
GDX DAILY CHART
Click chart to enlarge. Chart courtesy of StockCharts.com.
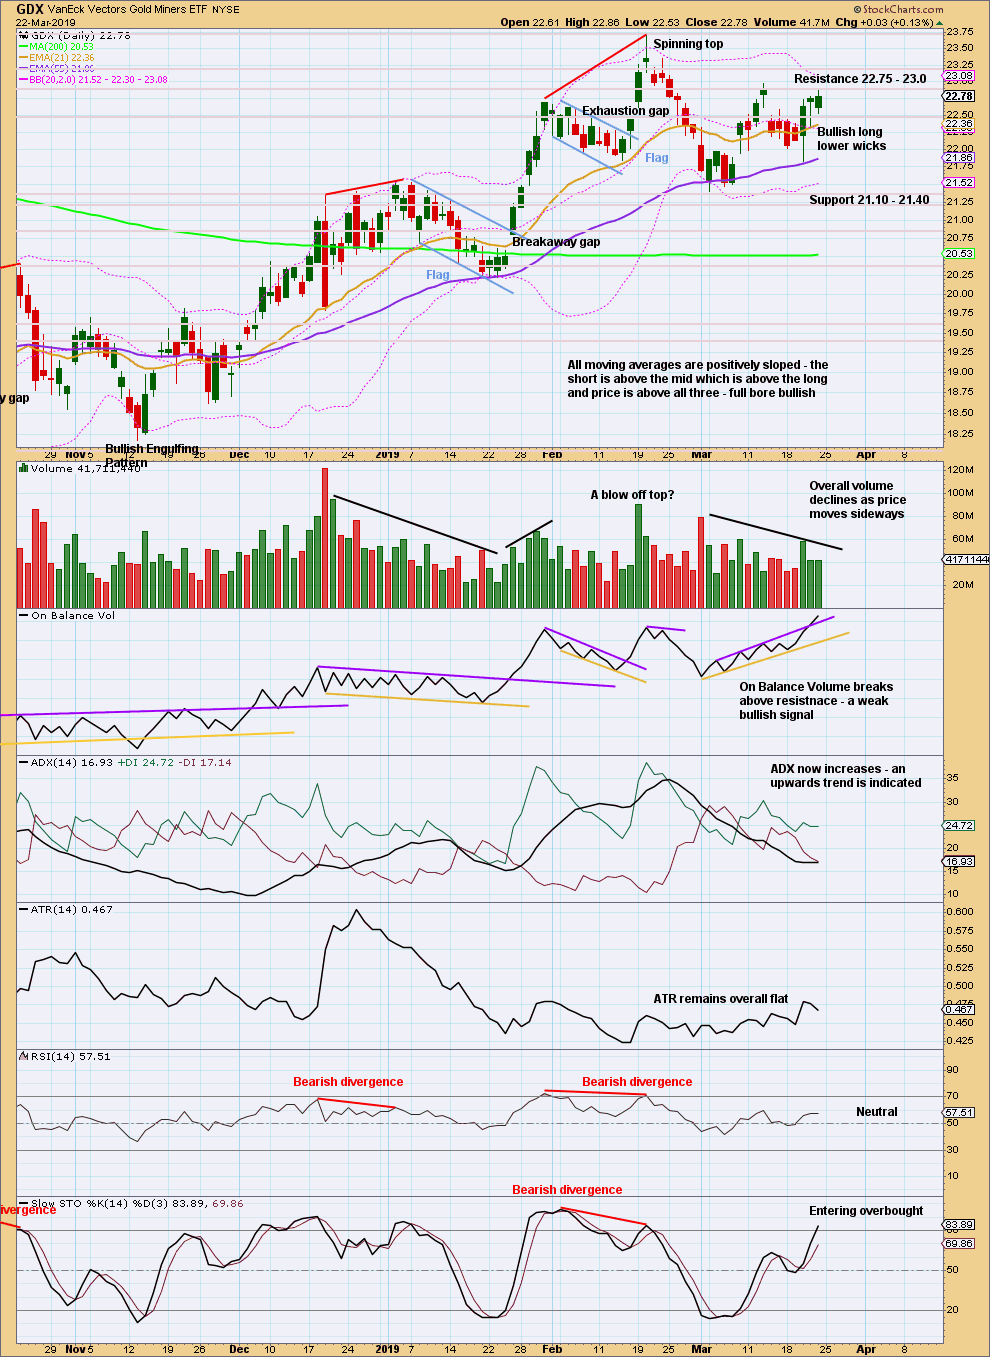
Price is now range bound with resistance about 22.75 – 23 and support about 21.40. A breakout is required to indicate the next direction. An upwards breakout requires support from volume for confidence, a downwards breakout does not.
On Balance Volume is making highs prior to price. This favours an upwards breakout.
US OIL
The bounce continues towards the target as expected.
Summary: The larger picture still sees Oil in a new downwards trend to end reasonably below 26.06.
While price remains within the channel on the daily chart, assume the bounce will continue. The target remains at 63.71.
If the target is wrong, it may be too high. There is now reasonable weakness in upwards movement. Price is within a strong zone of resistance. Stochastics is overbought. Look for this bounce to end soon.
If the channel is breached by a full daily candlestick below and not touching the lower edge, assume the bounce is over and a third wave down has begun.
MAIN ELLIOTT WAVE COUNT
MONTHLY CHART
Click chart to enlarge.
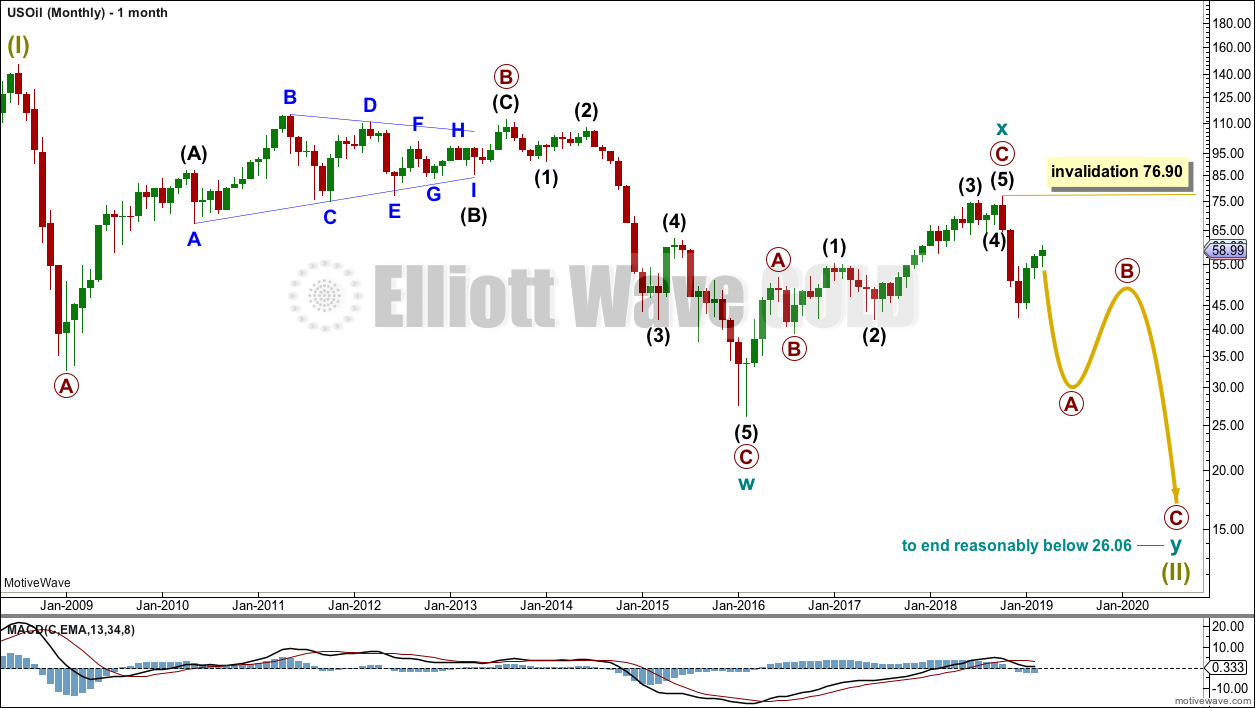
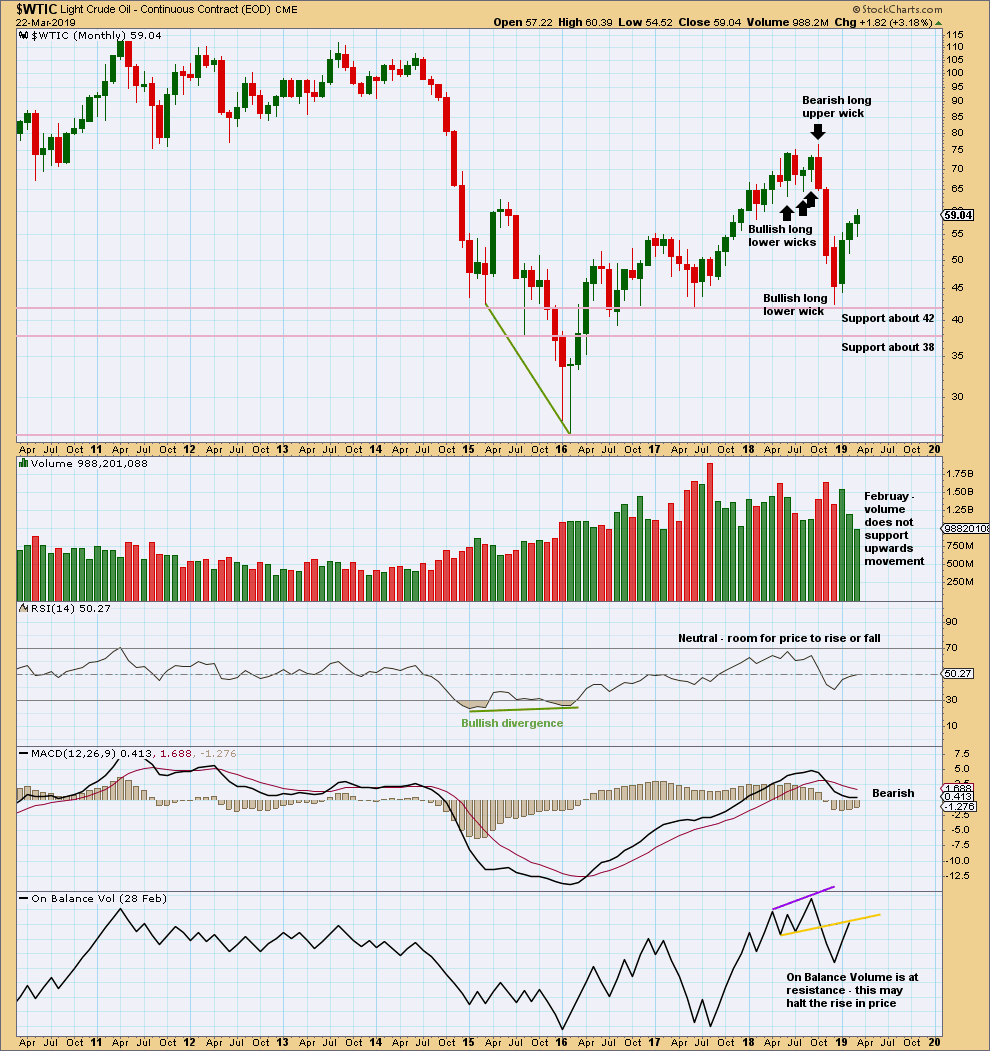
Classic technical analysis favours a bearish wave count for Oil at this time.
The large fall in price from the high in June 2008 to February 2016 is seen as a complete three wave structure. This large zigzag may have been only the first zigzag in a deeper double zigzag.
Upwards movement from February 2016 to October 2018 will not fit readily as a five wave structure but will fit very well as a three. With a three wave structure upwards, this indicates the bear market may not be over.
The first zigzag down is labelled cycle wave w. The double is joined by a now complete three in the opposite direction, a zigzag labelled cycle wave x.
The purpose of a second zigzag in a double is to deepen the correction when the first zigzag does not move price deep enough. Cycle wave y would be expected to move reasonably below the end of cycle wave w to deepen the correction. Were cycle wave y to reach equality with cycle wave w that takes Oil into negative price territory, which is not possible. Cycle wave y would reach 0.618 the length of cycle wave w at $2.33.
A better target calculation would be using the Fibonacci ratios between primary waves A and C within cycle wave y. This cannot be done until both primary waves A and B are complete.
Within cycle wave y, no second wave correction nor B wave may move beyond its start above 76.90.
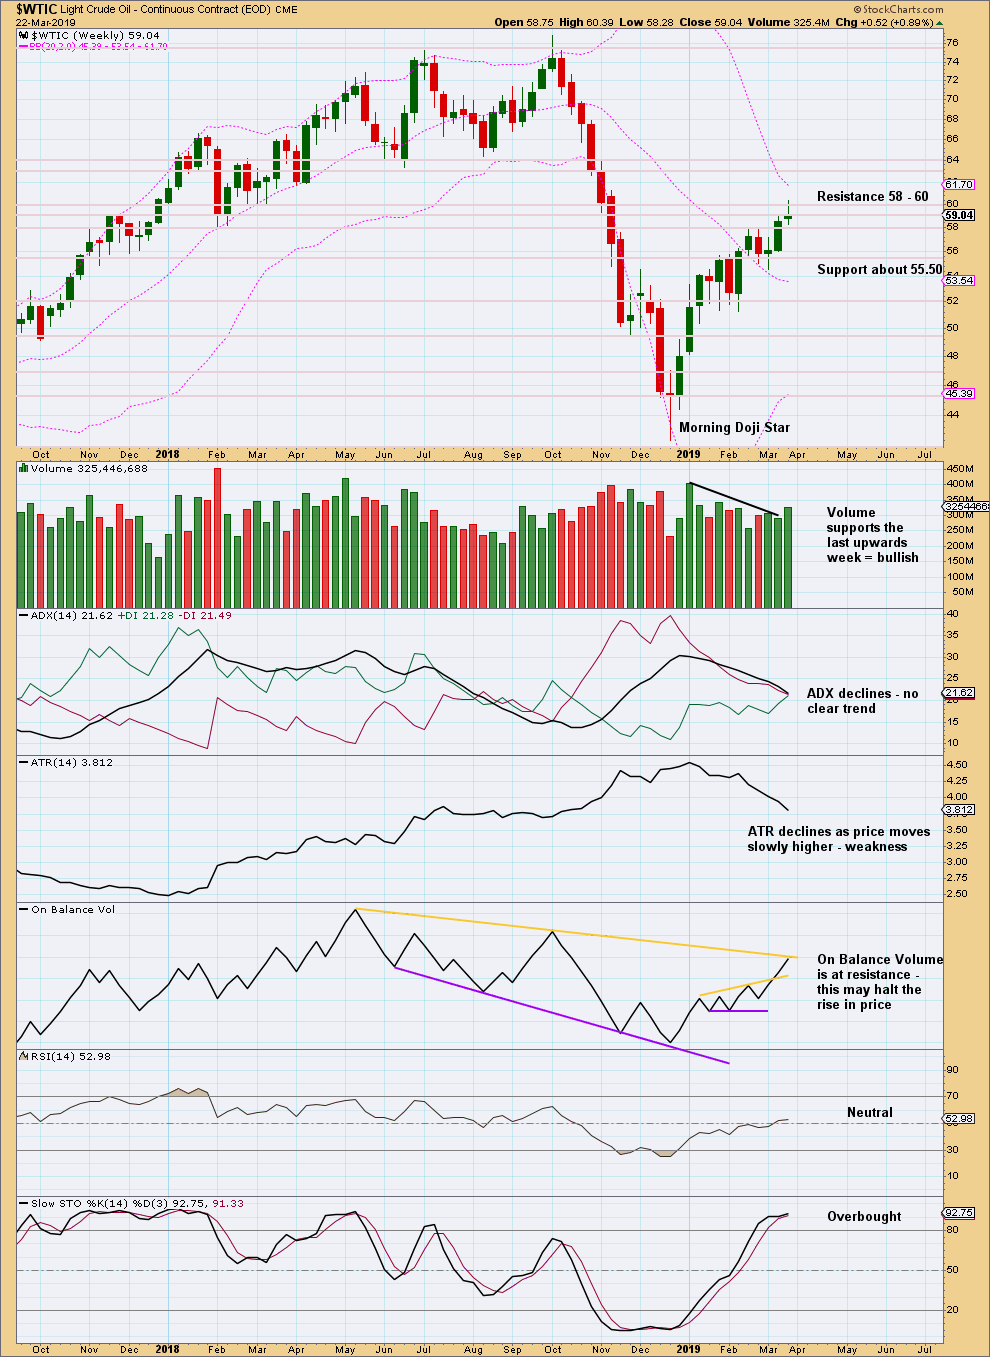
WEEKLY CHART
Click chart to enlarge.
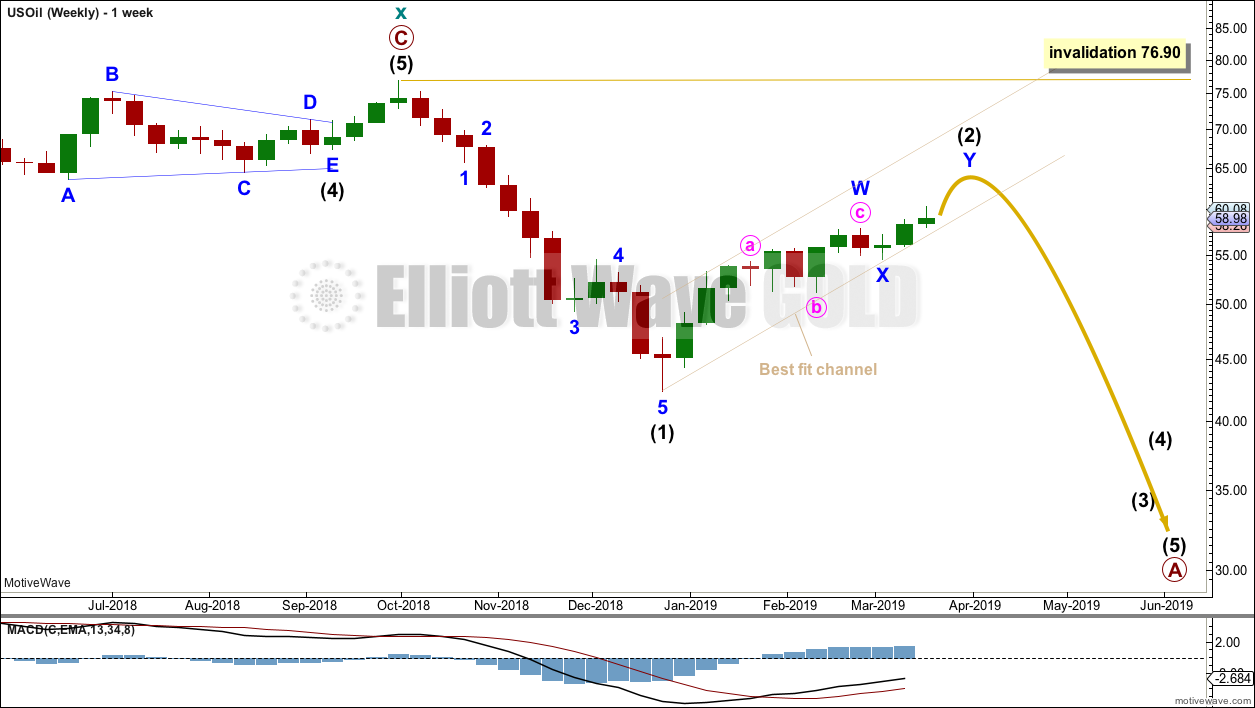
This weekly chart is focussed on the start of cycle wave y.
Cycle wave y is expected to subdivide as a zigzag. A zigzag subdivides 5-3-5. Primary wave A must subdivide as a five wave structure if this wave count is correct.
Within primary wave A, intermediate wave (1) may now be complete.
Intermediate wave (2) is a possibly incomplete double zigzag.
Intermediate wave (2) may not move beyond the start of intermediate wave (1) above 76.90.
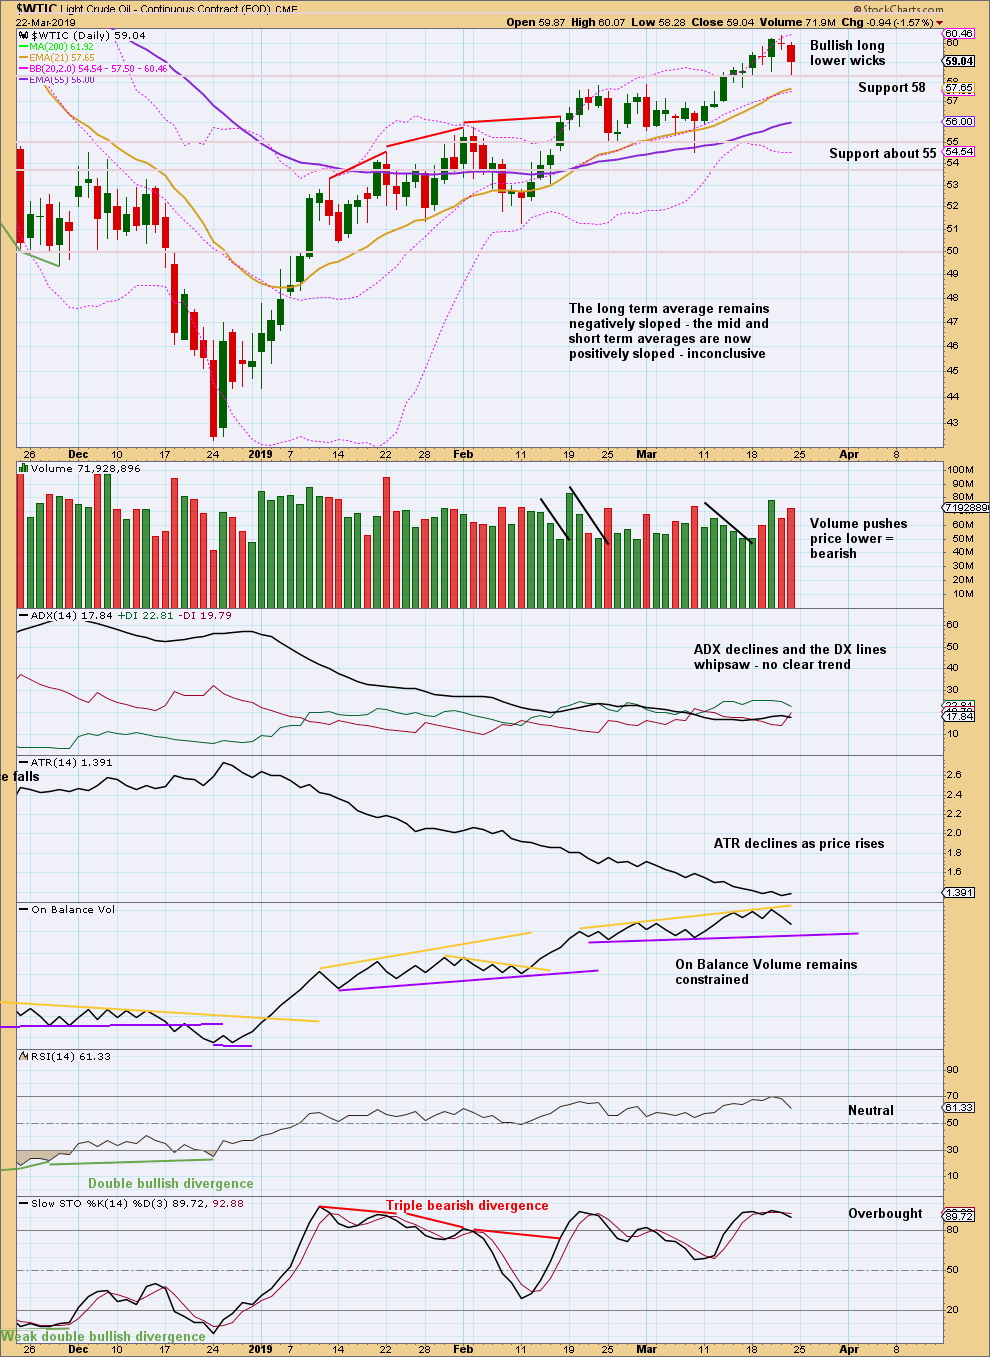
DAILY CHART
Click chart to enlarge.
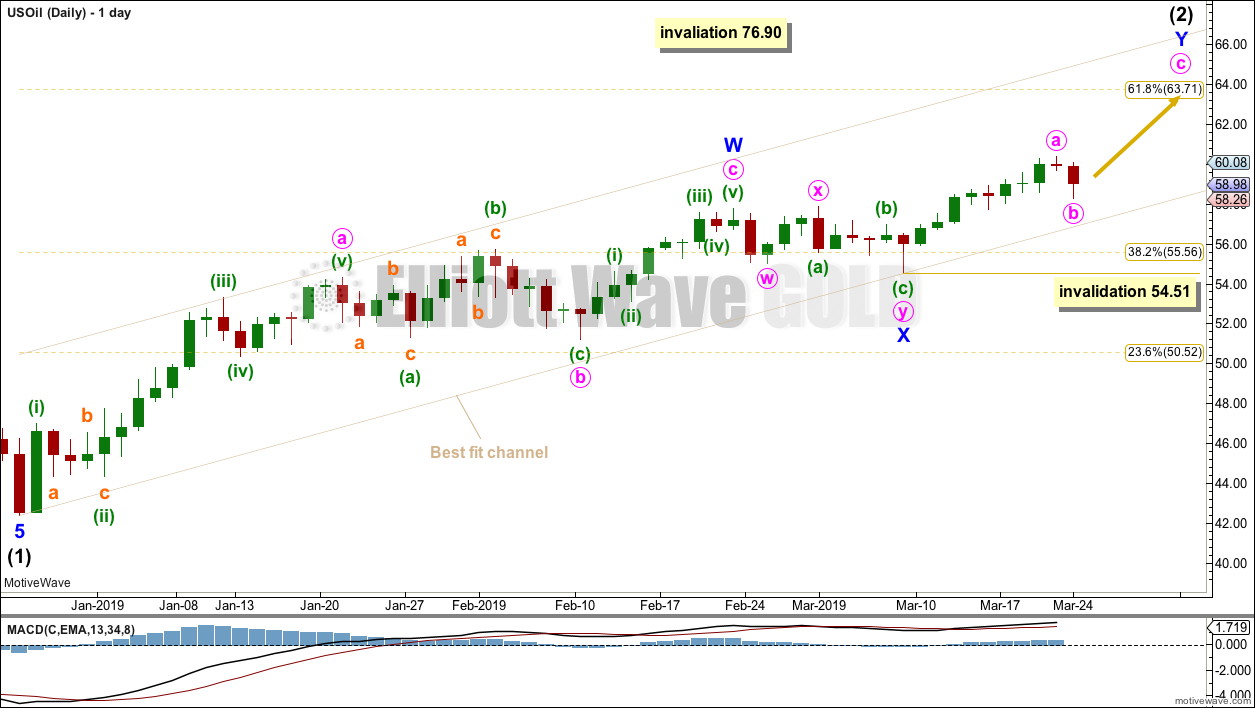
Always assume the trend remains the same until proven otherwise.
Intermediate wave (2) may be an incomplete double zigzag. The first zigzag may be complete, labelled minor wave W. The double may be joined by a three in the opposite direction, a double zigzag labelled minor wave X.
The maximum number of corrective structures in a multiple is three. Waves W, Y and Z may only subdivide as single corrective structures (they may not be multiples). But X waves may subdivide as any corrective structure including a multiple. However, X waves almost always subdivide as single zigzags, rarely do they subdivide as multiples. However, the alternate wave count is invalidated. This main wave count is now the only wave count at this time frame.
The channel is drawn as a best fit. If this channel is breached by a full candlestick below and not touching it, that may indicate a trend change.
If minute wave b moves a little lower early next week, then look for it to find support about the lower edge of the channel.
Minor wave Y may end about the 0.618 Fibonacci ratio at 63.71.
Intermediate wave (2) may not move beyond the start of intermediate wave (1) above 76.90.
TECHNICAL ANALYSIS
MONTHLY CHART
Click chart to enlarge. Chart courtesy of StockCharts.com.
Upwards movement for February lacks support from volume. This bounce may be ending here or very soon.
WEEKLY CHART
Click chart to enlarge. Chart courtesy of StockCharts.com.
This week completes a doji candlestick. This puts the trend for the short term from up into neutral. Doji on their own are not reversal signals, but they are a warning of possible weakness.
On Balance Volume may halt this bounce here. But the yellow resistance line does not have strong technical significance, so a breach of resistance would be a weak bullish signal.
DAILY CHART
Click chart to enlarge. Chart courtesy of StockCharts.com.
Support about 58 so far is holding.
Volume suggests more downwards movement to begin next week, but it may be limited by support for On Balance Volume.
—
Always practice good risk management as the most important aspect of trading. Always trade with stops and invest only 1-5% of equity on any one trade. Failure to manage risk is the most common mistake new traders make.
Hi Lara,
Oil was bouncing off of the lower support quite a bit in early trading, then with fair amount of volume went up to close in the green. Does this show some short term strength to oil, or would you still expect an imminent drip through the lower channel support?
Cheers,
Jiten
“would you still expect an imminent drip through the lower channel support?”
That’s not what I’ve been expecting. For the short term my Oil analysis is expecting price to find support at the lower edge of the channel and continue higher to 63.71.
Today price remains within the channel and so that view is unchanged.
Only if the channel is breached by a full daily candlestick below and not touching it would I then expect a high is again in place for Oil.
Gold is today printing a strong candlestick below and not touching the lower edge of the trend channel which fits around minor wave 2. This gives strong confidence that minor wave 2 is finally over, and minor wave 3 is finally underway.
When minor wave 3 is done then minor wave 4 may not move back up into minor wave 1 price territory. Which means that any short position entered prior to minor wave 3 moving below the end of minor wave 1 may be held for a longer term, throughout minor wave 4, until intermediate wave (1) is over and intermediate wave (2) arrives. If that time frame suits your trading style.
Hi Lara, your midweek comments are very welcome and appreciated! Thank you! Corey
Ditto Corey’s comment. These mid week updates demonstrate Lara’s dedication to her subscribers. By the way, I took my first position in DUST at this morning’s low opening. Got in around $17.60 per share.
Hi Lara
I’m surprised no one is asking about the recent action on the S&P so I will. It appears more and more that your alternative wave count is more likely.
Can you comment on that with two trading days to go this week?
Thanks
Rich
I don’t think that the last three sessions fit the alternate better at all actually.
There is still underlying strength in this sideways movement. The main count now sees it as a series of small first and second waves, to have an upwards breakout next week (or even possibly tomorrow).
The alternate would see it as a series of first and second waves to the downside, to have a downwards breakout next week to complete a third wave down within intermediate wave (C).
Classic technical analysis at this time still favours the main Elliott wave count.
After this session is over and I have volume data and Lowry’s report I’ll come into comments here and make another short comment on it.
The S&P today closed green and the AD line has made a new all time high. This is very bullish and supports the main Elliott wave count for the S&P
Hi Lara, Any additional thought on Gold & GDX here as both appear to be having upside breakouts and are above the resistance levels you had cited? Also, the daily OBV on GDX is looking quite strong.
For Gold, this is the updated daily chart. I have a new target for this bounce to end.
With the data in hand today volume isn’t supporting upwards movement. So far this still looks like a possible bear flag pattern.
I had not considered a triple zigzag because they are fairly rare. But I have seen a few, they’re not as rare as running flats for example.
That’s the problem with rare structures. They’ll never be what you expected was most likely to happen.
I’ve never seen a triple zig-zag that I recall at least. If a double zig-zag’s purpose is to deepen the correction, I suspect the same it true of a triple zig-zag, deepen the correction more. Is this accurate?
Still waiting patiently to short GDX with a leveraged ETF. It has the potential to be the best trade of the year. Thanks Lara.
Rodney I agree. With 17:1 average debt to equity in gold stocks, if gold has a nasty C wave down, then I can see multiple insolvencies. The leveraged ETF funds could skyrocket if the gold indices plummet. I think ABX could be at risk, but if not then definitely many of the mid to smaller names.
https://katusaresearch.com/the-golden-trap/
I’m doing some additional research for the best way to play this potential debt meltdown for the miners.
I have never considered the debt situation with miners. If this downward move does have time to it, this could be a huge.
Dust? Would you use Dust?
DUST and JDST (juniors) are good candidates. You must be very diligent to trim profits and then reestablish positions after gold stocks bounce (during declines). The bounces can be rip your face off rallies. The main problem with these funds is that literally every day they add leverage (like maxing out on margin every day even after oversold/overbought). Another way to play it would be going long leap puts on gdx or gdxj. Now is a great time to make a bet, but as Lara has mentioned a move below the 1160 confidence target would be ideal.
Hi Lara,
EWT summary says “Wave B always retraces at least 90 percent of wave A”.
Question: Will a 87% move satisfy this rule? Or does it have to be 90% or above? What has been your experience, please?
Thank you kindly.
The rule is black and white. If it’s less than 90% it doesn’t meet the minimum requirement for a flat.
In that case a combination may be considered.
Thank you Lara.
I have a Word doc of all your Elliot wave important points and this goes into it. Valuable.