

S&P 500
An outside day for Friday closes green as the S&P500 ends with a little strength into the close. This is what the main Elliott wave count has expected, and it now has support from classic technical analysis this week.
Summary: The upwards trend should resume. The mid-term target remains the same at 3,010. Today this view has support from a new all time high from the AD line and a cross of the 50 day moving average above the 200 day moving average.
The final target remains the same at 3,045.
Only a new low below 2,722.27 would indicate a deeper and more sustained pullback would be underway.
The biggest picture, Grand Super Cycle analysis, is here.
Last published monthly charts are here. Video is here.
ELLIOTT WAVE COUNTS
WEEKLY CHART
Click chart to enlarge.
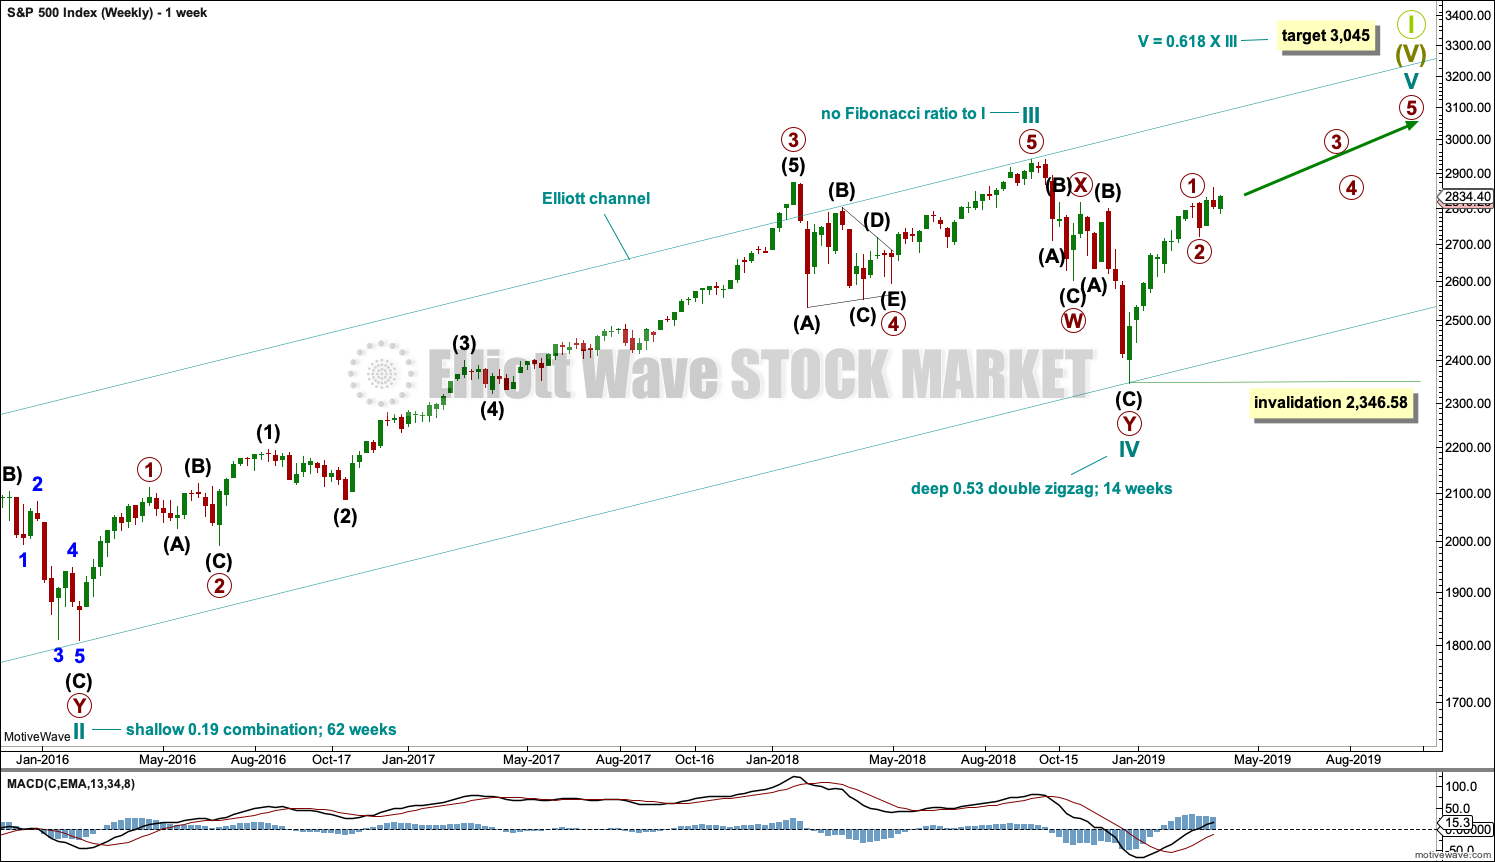
This weekly chart shows all of cycle waves III, IV and V so far.
Cycle wave II fits as a time consuming double combination: flat – X – zigzag. Combinations tend to be more time consuming corrective structures than zigzags. Cycle wave IV has completed as a multiple zigzag that should be expected to be more brief than cycle wave II.
Cycle wave IV may have ended at the lower edge of the Elliott channel.
Within cycle wave V, no second wave correction may move beyond the start of its first wave below 2,346.58.
Although both cycle waves II and IV are labelled W-X-Y, they are different corrective structures. There are two broad groups of Elliott wave corrective structures: the zigzag family, which are sharp corrections, and all the rest, which are sideways corrections. Multiple zigzags belong to the zigzag family and combinations belong to the sideways family. There is perfect alternation between the possible double zigzag of cycle wave IV and the combination of cycle wave II.
Although there is gross disproportion between the duration of cycle waves II and IV, the size of cycle wave IV in terms of price makes these two corrections look like they should be labelled at the same degree. Proportion is a function of either or both of price and time.
Draw the Elliott channel about Super Cycle wave (V) with the first trend line from the end of cycle wave I (at 2,079.46 on the week beginning 30th November 2014) to the high of cycle wave III, then place a parallel copy on the low of cycle wave II. Cycle wave V may find resistance about the upper edge.
It is possible that cycle wave V may end in October 2019. If it does not end there, or if the AD line makes new all time highs during or after June 2019, then the expectation for cycle wave V to end would be pushed out to March 2020 as the next possibility. Thereafter, the next possibility may be October 2020. March and October are considered as likely months for a bull market to end as in the past they have been popular. That does not mean though that this bull market may not end during any other month.
MAIN WAVE COUNT
DAILY CHART
Click chart to enlarge.
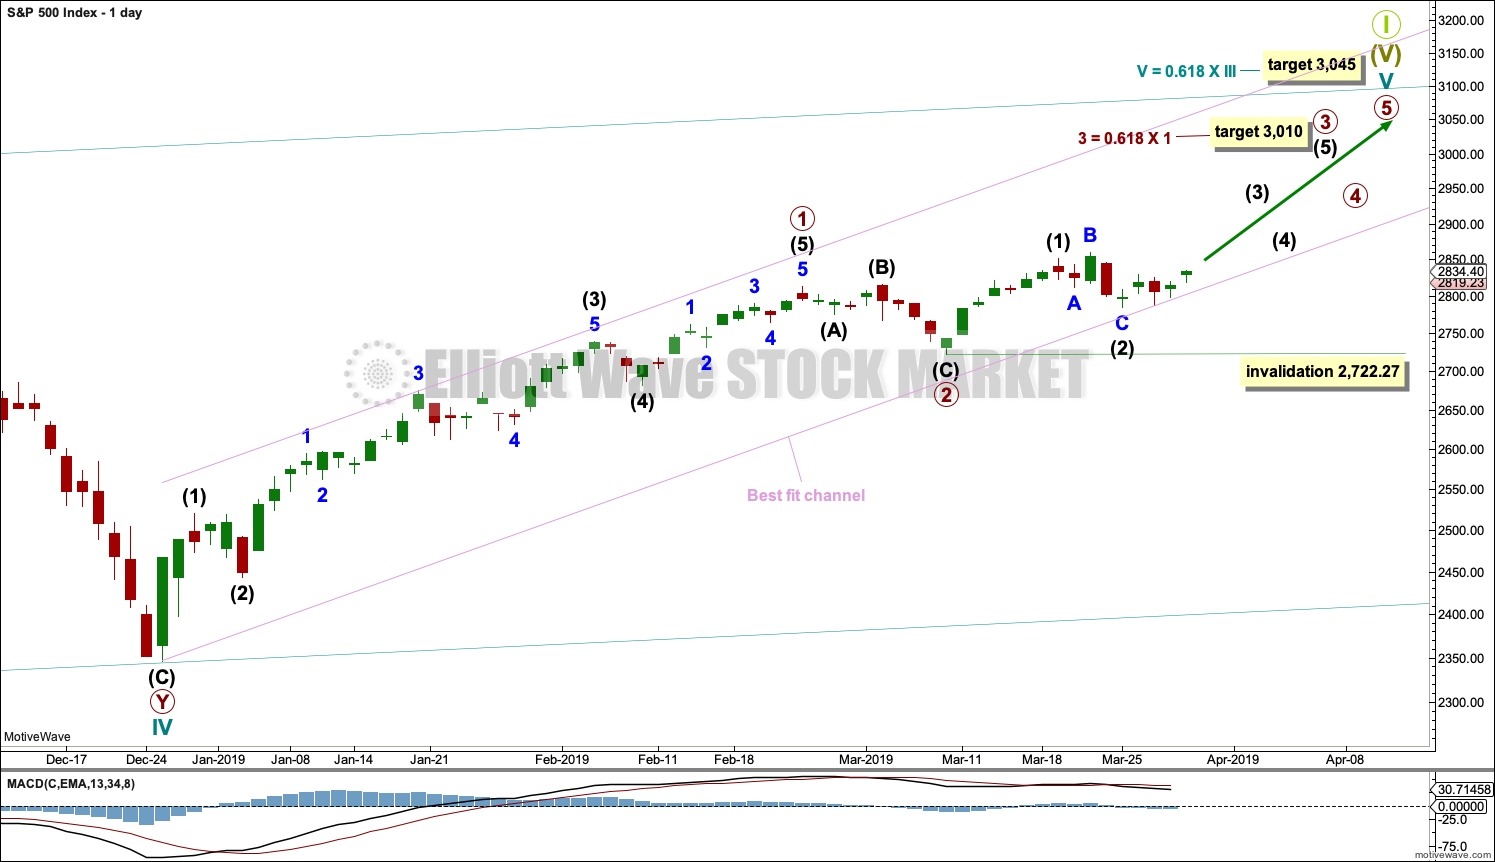
The daily chart will focus on the structure of cycle wave V.
Within Super Cycle wave (V), cycle wave III may not be the shortest actionary wave. Because cycle wave III is shorter than cycle wave I, this limits cycle wave V to no longer than equality in length with cycle wave III at 3,477.39. A target is calculated for cycle wave V to end prior to this point.
Cycle wave V must subdivide as a five wave motive structure, either an impulse or an ending diagonal. An impulse is much more common and that will be how it is labelled. A diagonal would be considered if overlapping suggests it.
Primary wave 2 may have been a very brief and shallow expanded flat correction.
Primary wave 3 may now exhibit an increase in upwards momentum. A target is calculated that fits with the higher target for cycle wave V to end.
Within primary wave 3, intermediate wave (2) may not move beyond the start of intermediate wave (1) below 2,722.27.
Intermediate wave (2) may be a complete expanded flat correction. Minor wave B within intermediate wave (2) is 1.2 times the length of minor wave A, which is within the most common range for B waves of flats from 1 to 1.38. Minor wave C may now be complete. It exhibits no Fibonacci ratio to minor wave A.
The channel is adjusted to better show where current small pullbacks are finding support.
ALTERNATE WAVE COUNT
DAILY CHART
Click chart to enlarge.
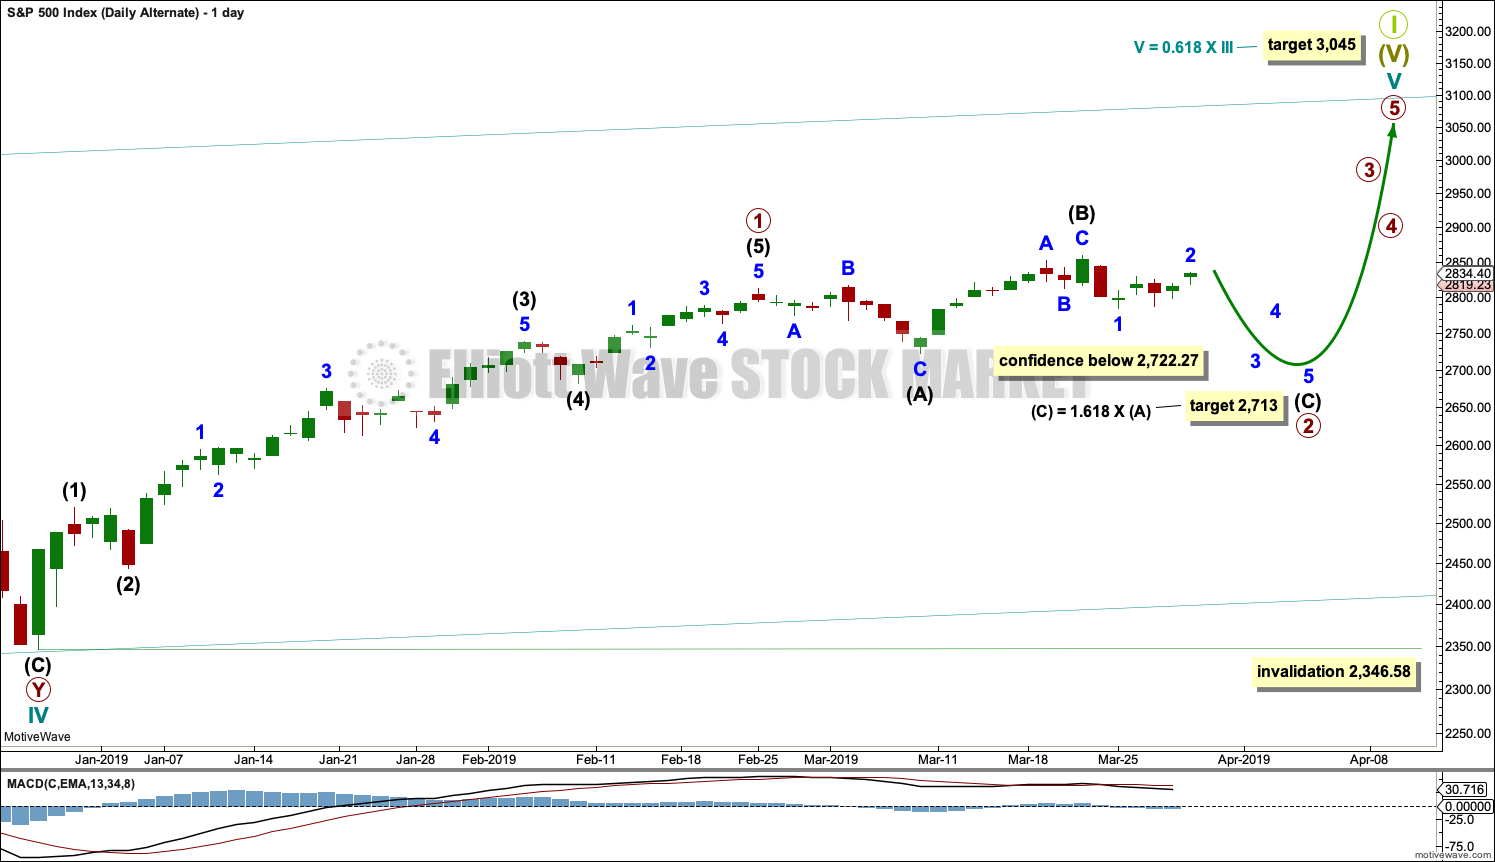
It is also possible that primary wave 2 may continue as an expanded flat correction.
Intermediate wave (B) is 1.51 times the length of intermediate wave (A). This is longer than the common range of 1 to 1.38 but within allowable limits of up to 2.
A target is calculated for intermediate wave (C); it expects to exhibit the most common Fibonacci ratio to intermediate wave (A).
Intermediate wave (C) must subdivide as a five wave motive structure. Within intermediate wave (C), minor wave 2 may not move beyond the start of minor wave 1 above 2,860.31. This wave count would be discarded with a new high.
Primary wave 2 may not move beyond the start of primary wave 1 below 2,346.58.
The breach of the channel on the main daily Elliott wave chart indicates this alternate should now be more seriously considered.
TECHNICAL ANALYSIS
WEEKLY CHART
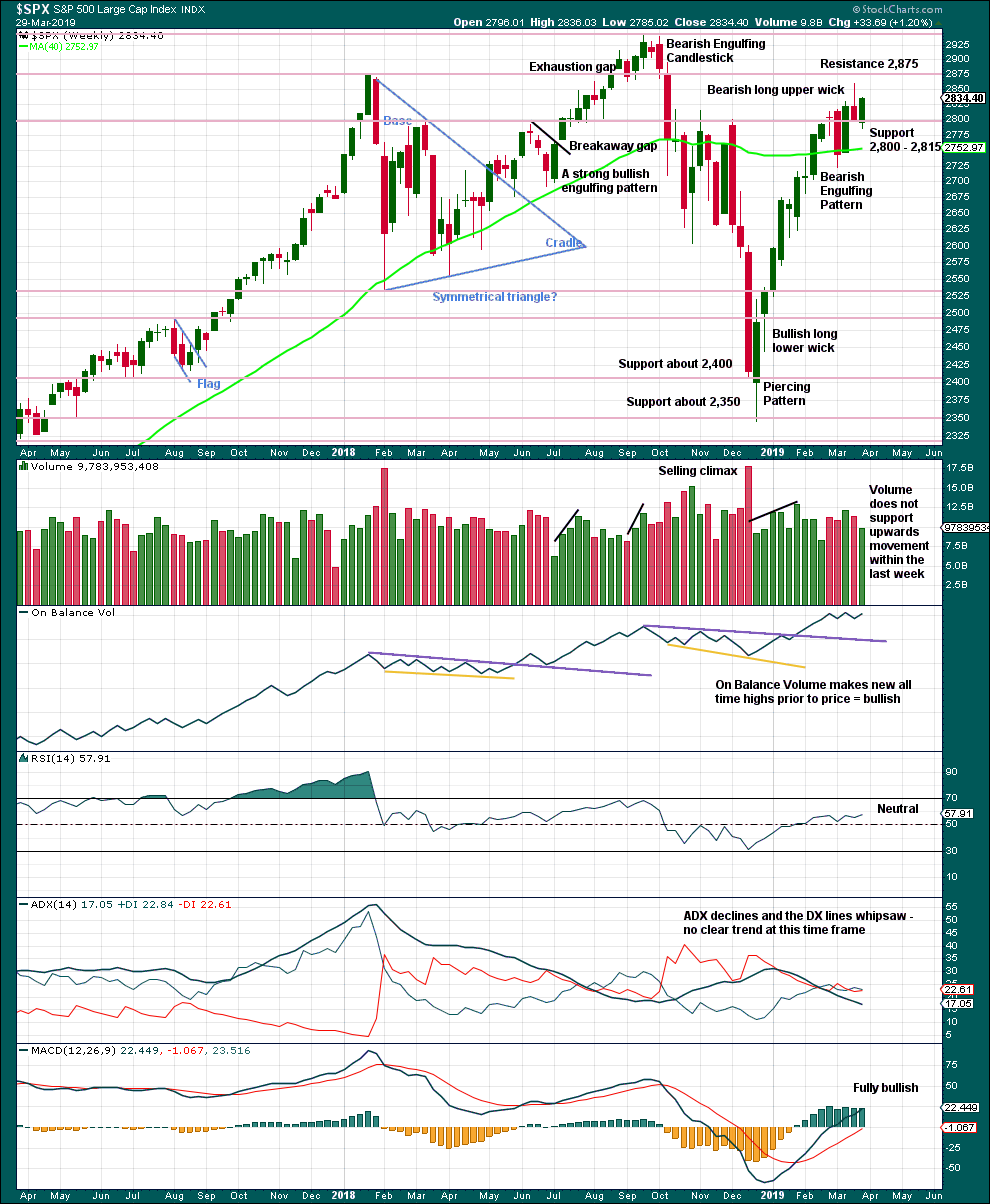
Click chart to enlarge. Chart courtesy of StockCharts.com.
The last completed week is an outside week that closes green with the balance of volume upwards. Volume within the week does not appear to support upwards movement, but a clearer picture may be obtained by looking inside the week at daily volume bars.
The close for the week is near highs, suggesting more upwards movement to follow.
DAILY CHART
Click chart to enlarge. Chart courtesy of StockCharts.com.
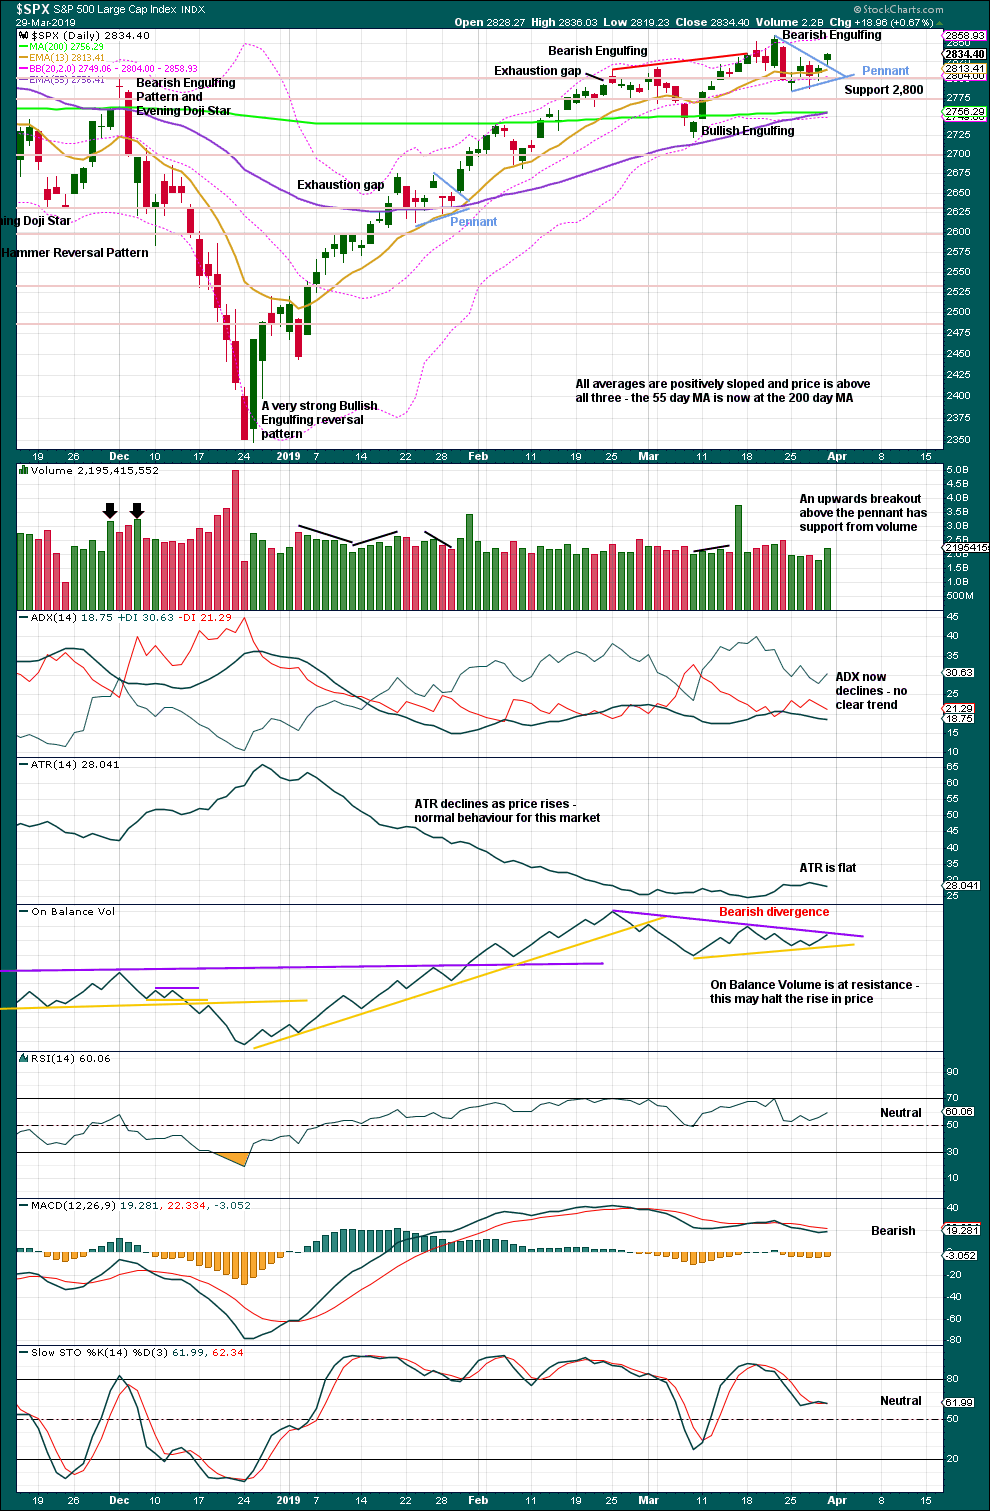
The December 2018 low is expected to remain intact. The two 90% upwards days on 26th December 2018 and 6th January 2019 indicate this upwards trend has internal strength.
Lowry’s data shows rising Buying Power and falling Selling Pressure. This situation is normally associated with a strong and healthy bull market. Pullbacks are normal and to be expected, and they are more likely to be short term.
While the last swing low of the 8th of March remains intact, there exists a series of higher highs and higher lows from the major low in December 2018. It would be safest to assume the upwards trend remains intact despite a decline in ADX.
The pennant pattern is a reliable short-term continuation pattern. Friday may have seen an upwards breakout that has the necessary support from volume for confidence. A target calculated using the flag pole is about 2,956.
BREADTH – AD LINE
WEEKLY CHART
Click chart to enlarge. Chart courtesy of StockCharts.com. So that colour blind members are included, bearish signals
will be noted with blue and bullish signals with yellow.
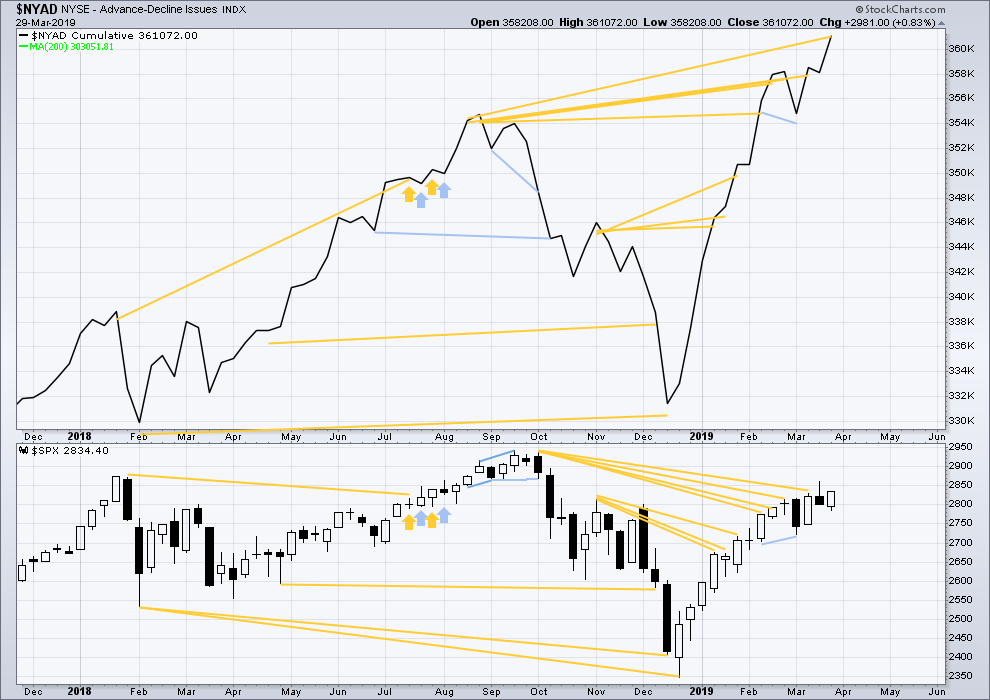
Every single bear market from the Great Depression and onwards has been preceded by a minimum of 4 months divergence between price and the AD line. With the AD line making a new all time high again this week, the end of this bull market and the start of a new bear market must be a minimum of 4 months away, which is the end of July 2019 at this time.
This week the AD line makes another new all time high. Bullish mid-term divergence continues.
DAILY CHART
Click chart to enlarge. Chart courtesy of StockCharts.com. So that colour blind members are included, bearish signals
will be noted with blue and bullish signals with yellow.
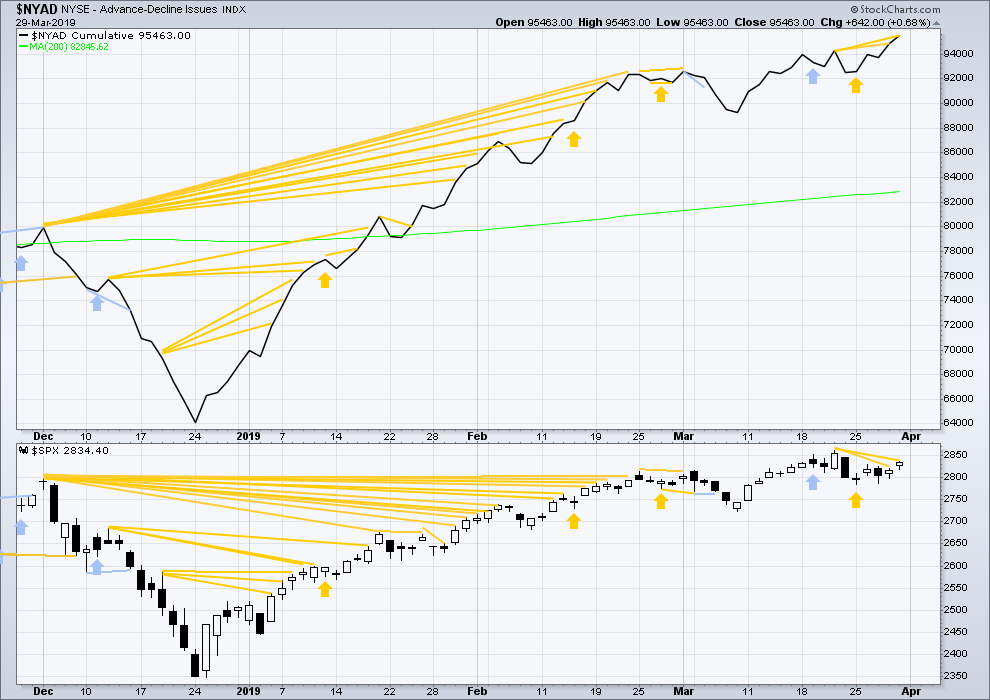
Breadth should be read as a leading indicator.
Bullish divergence noted in last analysis has been followed by upwards movement. For Friday the AD line has made another short-term high as well as longer-term highs. This divergence continues to be bullish.
VOLATILITY – INVERTED VIX CHART
WEEKLY CHART

Click chart to enlarge. Chart courtesy of StockCharts.com. So that colour blind members are included, bearish signals
will be noted with blue and bullish signals with yellow.
This week price moved lower with a lower low and a lower high, but inverted VIX moved higher. This divergence is bullish for the short term.
DAILY CHART
Click chart to enlarge. Chart courtesy of StockCharts.com. So that colour blind members are included, bearish signals
will be noted with blue and bullish signals with yellow.
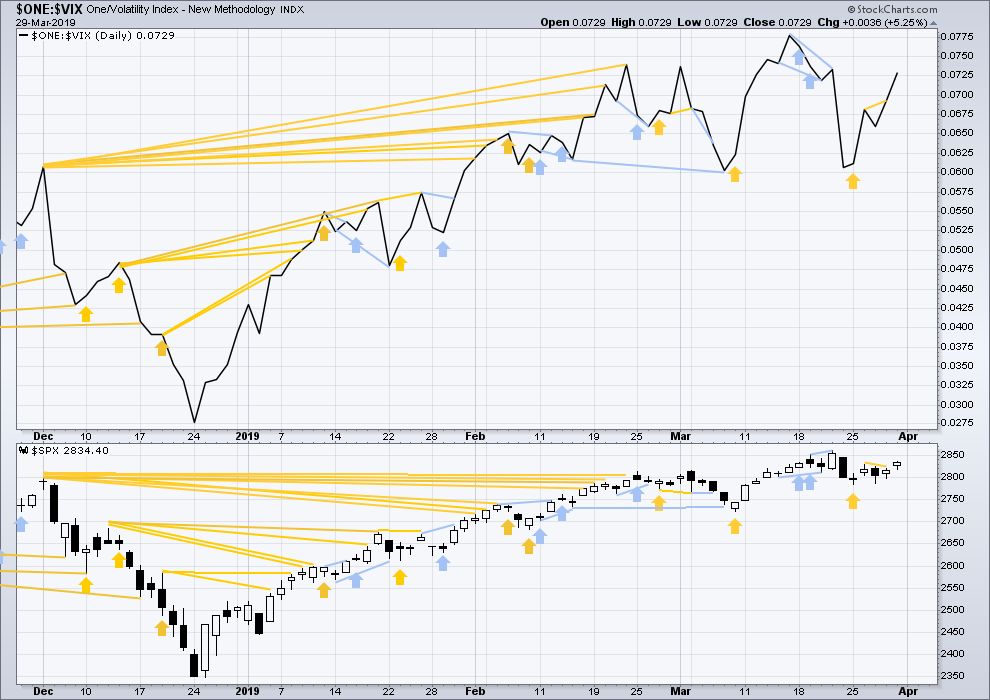
Price and inverted VIX have both moved higher during the last two sessions. There is no short-term divergence.
DOW THEORY
Dow Theory confirmed a bear market in December 2018. This does not necessarily mean a bear market at Grand Super Cycle degree though; Dow Theory makes no comment on Elliott wave counts. On the 25th of August 2015 Dow Theory also confirmed a bear market. The Elliott wave count sees that as part of cycle wave II. After Dow Theory confirmation of a bear market in August 2015, price went on to make new all time highs and the bull market continued.
DJIA: 23,344.52 – a close on the 19th of December at 23,284.97 confirms a bear market.
DJT: 9,806.79 – price has closed below this point on the 13th of December.
S&P500: 2,532.69 – a close on the 19th of December at 2,506.96 provides support to a bear market conclusion.
Nasdaq: 6,630.67 – a close on the 19th of December at 6,618.86 provides support to a bear market conclusion.
With all the indices moving now higher, Dow Theory would confirm a bull market if the following highs are made:
DJIA: 26,951.81
DJT: 11,623.58
S&P500: 2,940.91
Nasdaq: 8,133.30.
For the short term, now DJT has made a very slight new low below the prior swing low of the 8th of March. All of the S&P500, DJIA and Nasdaq remain above their prior swing lows of the 8th of March.
GOLD
Another downwards day with a lower low and a lower high was expected.
Summary: For the very short term, a small counter trend bounce may end about either 1,301 or 1,310. Thereafter, the downwards trend should resume.
The Elliott wave target is at 1,220. A target calculated using the flag is about 1,238.
Three long-term targets are now calculated for cycle wave c to end. Confidence in a new downwards trend may be had with a new low below 1,160.75.
Grand SuperCycle analysis is here.
Last monthly charts are here. Video is here.
MAIN ELLIOTT WAVE COUNT
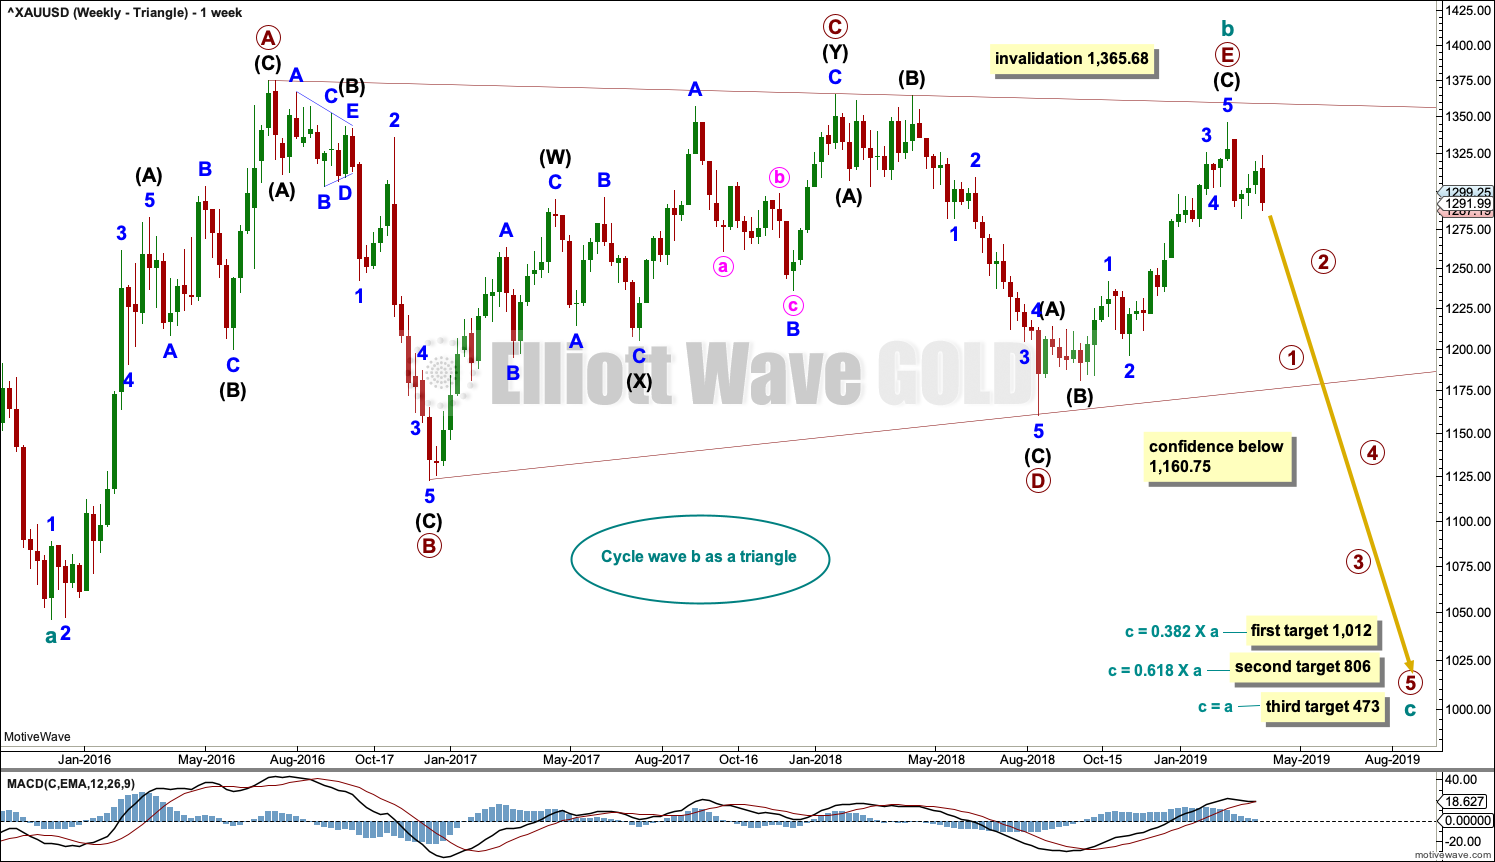
WEEKLY CHART – TRIANGLE
Click chart to enlarge.
This is the preferred wave count.
Cycle wave b may be a complete regular contracting triangle. If it continues further, then primary wave E may not move beyond the end of primary wave C above 1,365.68.
Four of the five sub-waves of a triangle must be zigzags, with only one sub-wave allowed to be a multiple zigzag. Wave C is the most common sub-wave to subdivide as a multiple, and this is how primary wave C for this example fits best.
There are no problems in terms of subdivisions or rare structures for this wave count. It has an excellent fit and so far a typical look.
This wave count would expect a cycle degree trend change has recently occurred. Cycle wave c would most likely make new lows below the end of cycle wave a at 1,046.27 to avoid a truncation.
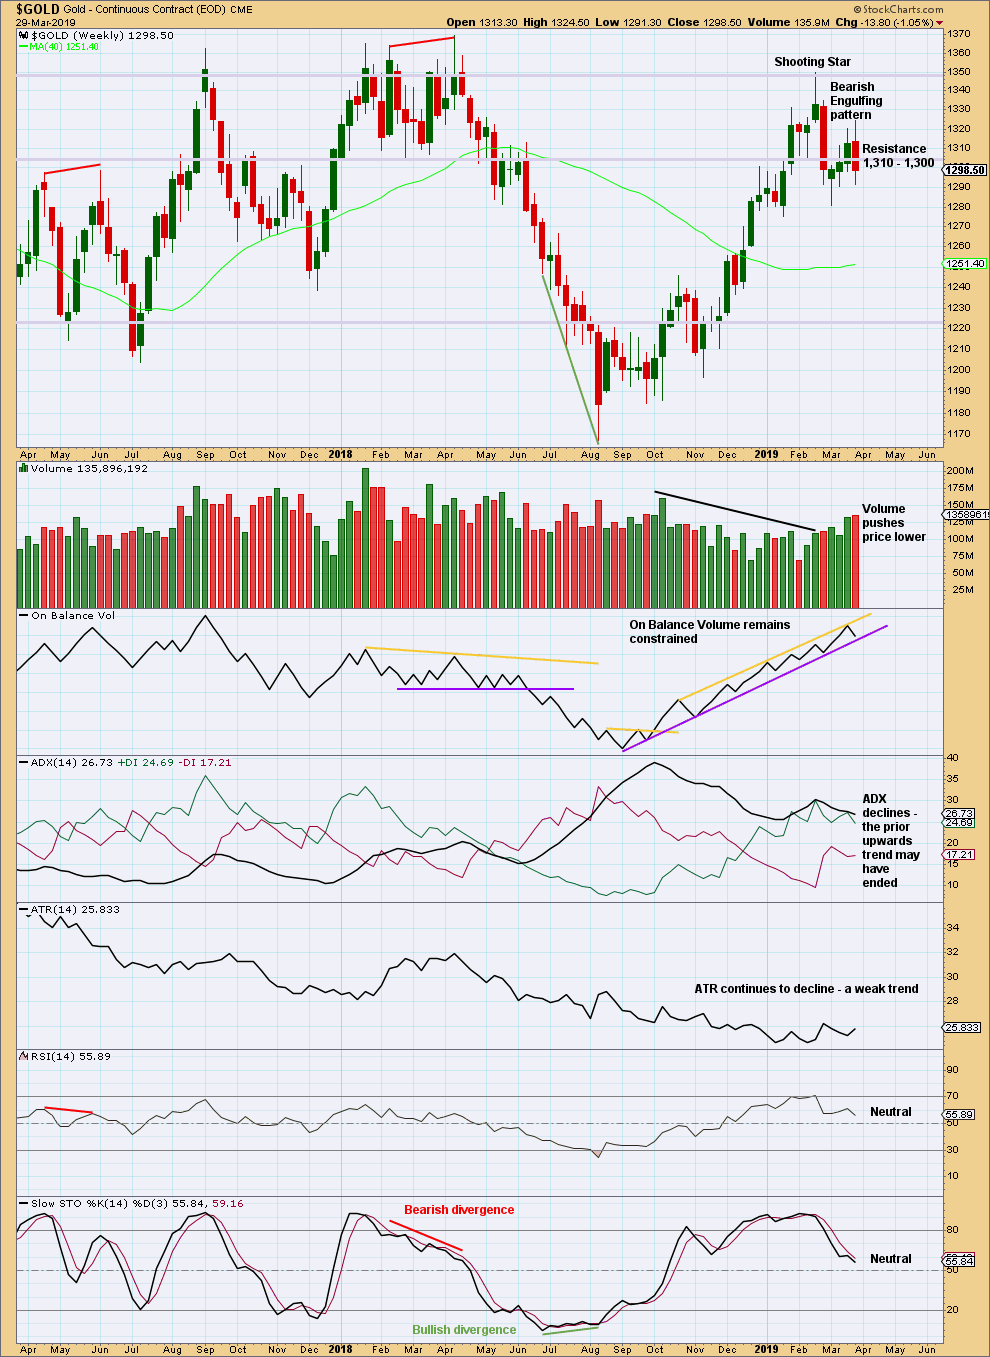
Primary wave E should exhibit reasonable weakness as it comes to an end. Triangles often end with declining ATR, weak momentum and weak volume.
If this weekly wave count is correct, then cycle wave c downwards should develop strength, ATR should show some increase, and MACD should exhibit an increase in downwards momentum.
Three targets are calculated for cycle wave c. Cycle wave a lasted 4.25 years. Cycle wave b may be over in 3.17 years. Cycle wave c may last a minimum of 2 years and possibly up to 5 years.
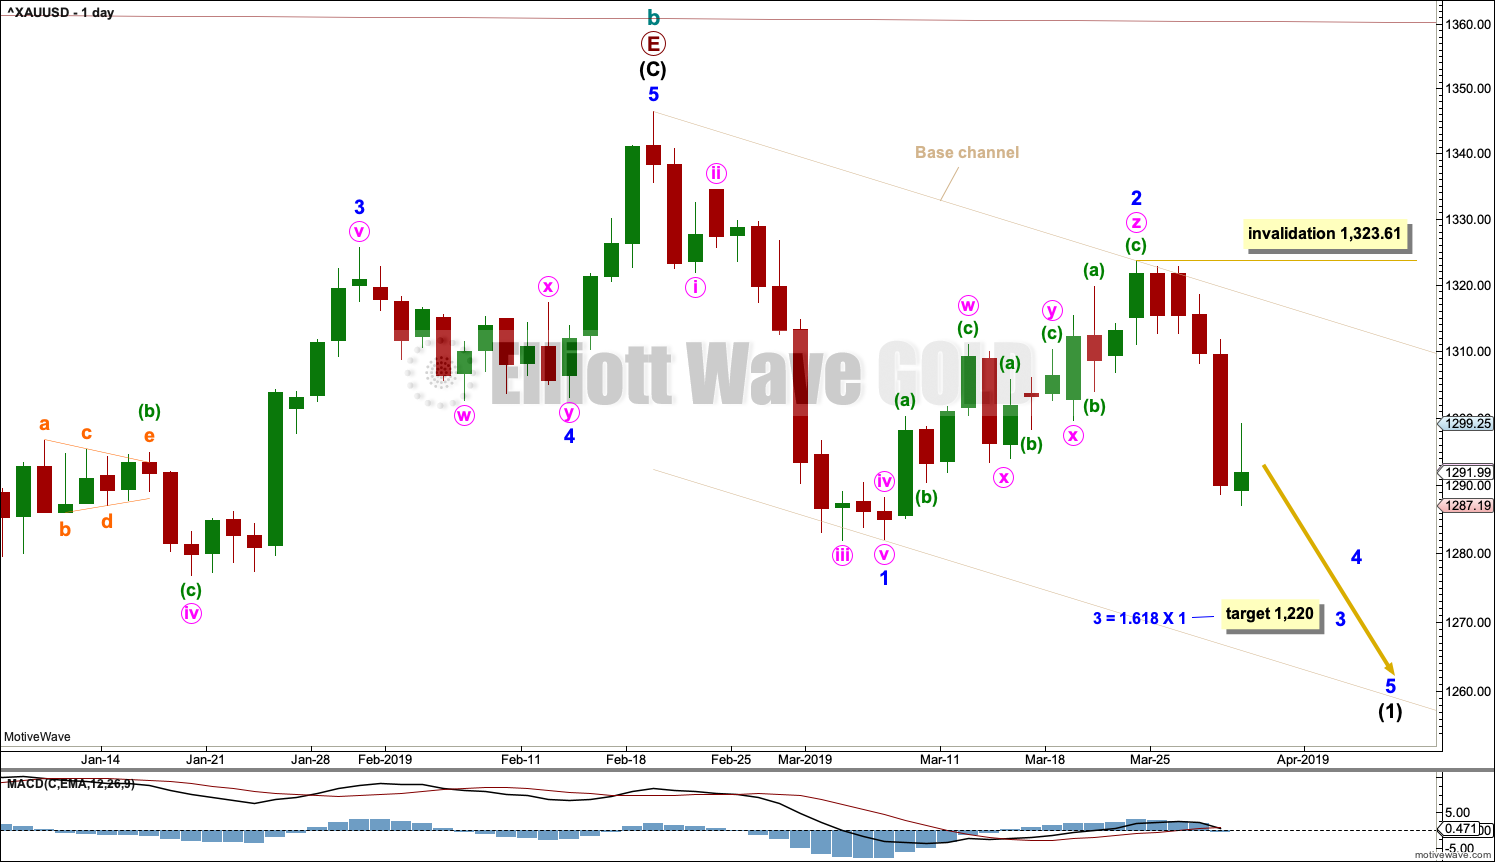
DAILY CHART – TRIANGLE
Click chart to enlarge.
Cycle wave c must subdivide as a five wave structure, either an impulse or an ending diagonal. An impulse is much more common and that shall be how it is labelled unless overlapping suggests a diagonal should be considered.
A new trend at cycle degree should begin with a five wave structure on the daily chart, which will be labelled minor wave 1.
Minor wave 2 is now labelled as a complete triple zigzag.
A base channel is now drawn about minor waves 1 and 2. There will be bounces and consolidations on the way down. Bounces may find resistance at the upper edge of the base channel. Towards its middle or end the power of a third wave may be able to break below support at the lower edge of the base channel.
Within minor wave 3, no second wave correction may move beyond the start of its first wave above 1,323.61.
It is possible that minor wave 3 may end with a selling climax; it may exhibit a swift and strong fifth wave to end the impulse. This behaviour is typical of commodities, and this tendency is especially prevalent for third wave impulses.
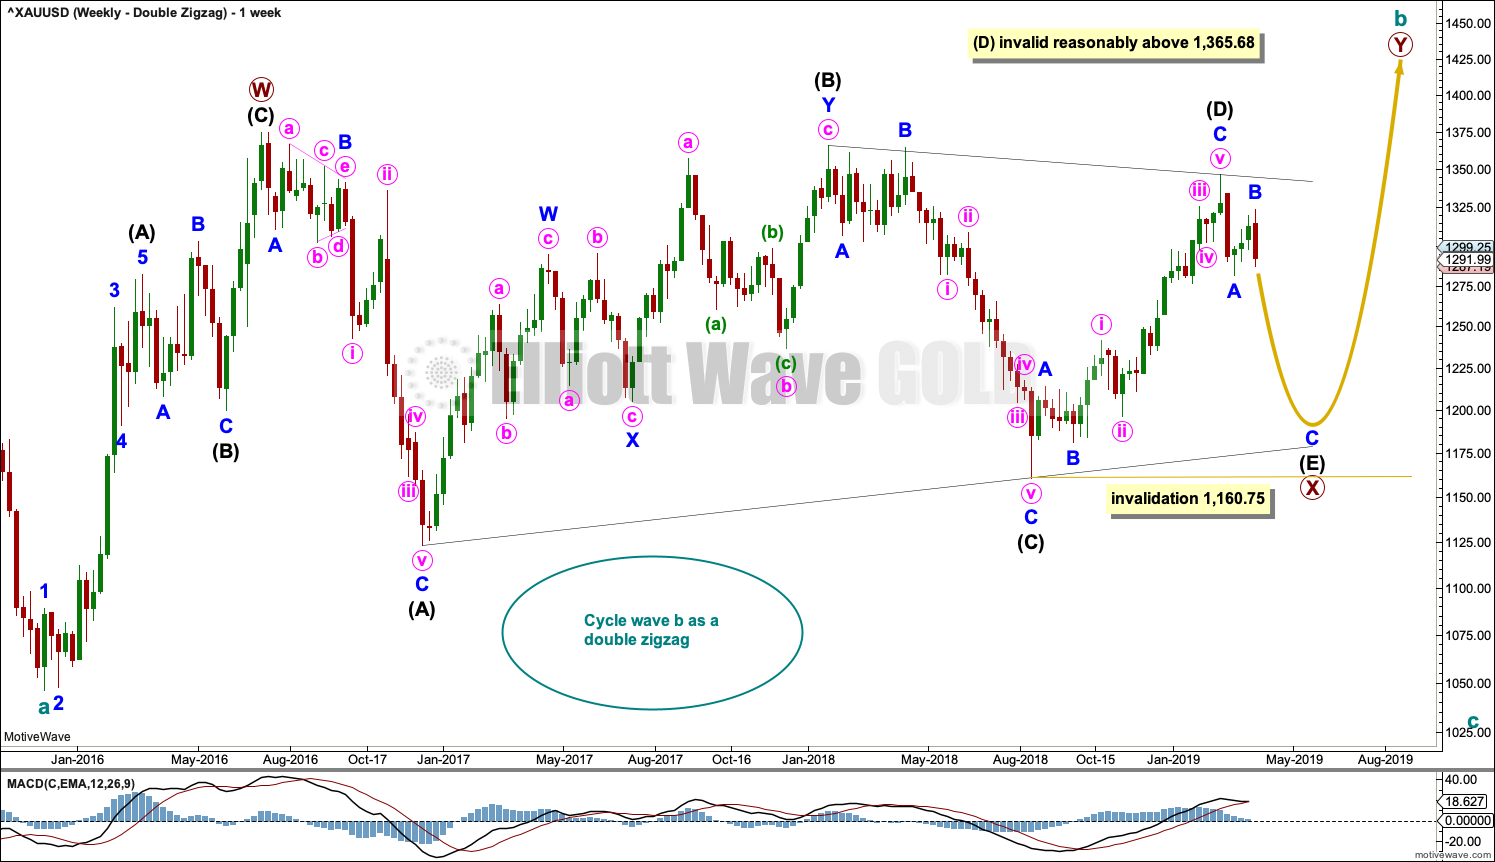
WEEKLY CHART – DOUBLE ZIGZAG
Click chart to enlarge.
It is possible that cycle wave b may be an incomplete double zigzag or a double combination.
The first zigzag in the double is labelled primary wave W. This has a good fit.
The double may be joined by a corrective structure in the opposite direction, a triangle labelled primary wave X. The triangle would be about four fifths complete.
Within multiples, X waves are almost always zigzags and rarely triangles. Within the possible triangle of primary wave X, it is intermediate wave (B) that is a multiple; this is acceptable, but note this is not the most common triangle sub-wave to subdivide as a multiple. These two points reduce the probability of this wave count.
Intermediate wave (D) may be complete. The (B)-(D) trend line is almost perfectly adhered to with the smallest overshoot within intermediate wave (C). This is acceptable.
Intermediate wave (E) should continue to exhibit weakness: ATR should continue to show a steady decline, and MACD may begin to hover about zero.
Intermediate wave (E) may not move beyond the end of intermediate wave (C) below 1,160.75.
This wave count may now expect downwards movement for several weeks.
Primary wave Y would most likely be a zigzag because primary wave X would be shallow; double zigzags normally have relatively shallow X waves.
Primary wave Y may also be a flat correction if cycle wave b is a double combination, but combinations normally have deep X waves. This would be less likely.
This wave count has good proportions and no problems in terms of subdivisions.
Intermediate wave (E) should subdivide as a zigzag labelled minor waves A-B-C. Zigzags subdivide 5-3-5, exactly the same the start of an impulse.
The preferred wave count labels downwards movement minor waves 1-2-3, and this wave count labels downwards movement minor waves A-B-C. At the daily chart level, the subdivisions for both wave counts are seen in the same way.
ALTERNATE ELLIOTT WAVE COUNT
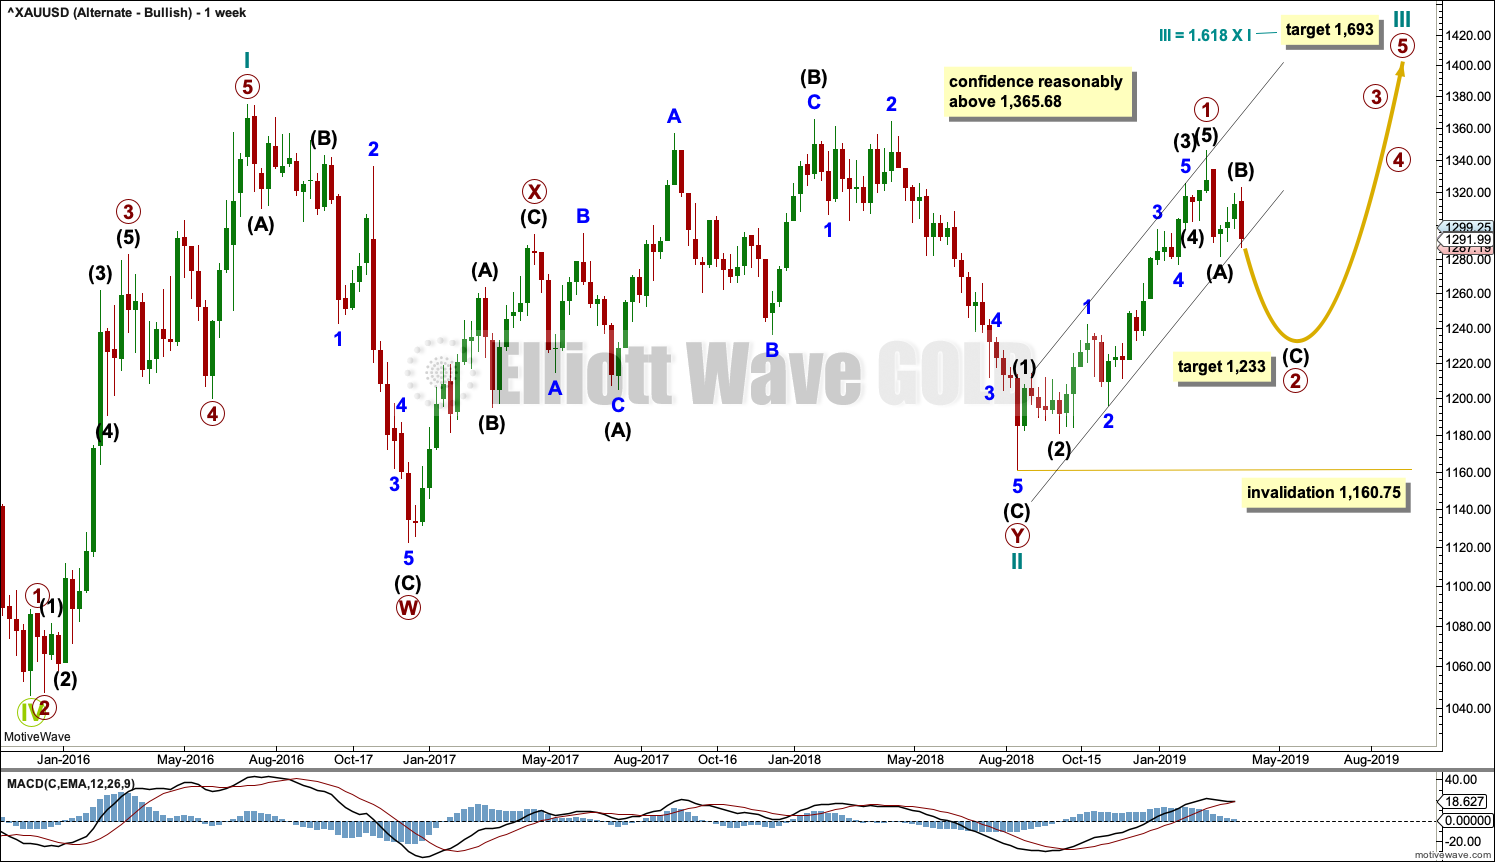
WEEKLY CHART
Click chart to enlarge.
If Gold is in a new bull market, then it should begin with a five wave structure upwards on the weekly chart. However, the biggest problem with this wave count is the structure labelled cycle wave I because this wave count must see it as a five wave structure, but it looks more like a three wave structure.
Commodities often exhibit swift strong fifth waves that force the fourth wave corrections coming just prior to be more brief and shallow than their counterpart second waves. It is unusual for a commodity to exhibit a quick second wave and a more time consuming fourth wave, and this is how cycle wave I is labelled. The probability of this wave count is low due to this problem.
Cycle wave II subdivides well as a double combination: zigzag – X – expanded flat.
Cycle wave III may have begun. Within cycle wave III, primary wave 1 may now be complete. The target for primary wave 2 is the 0.618 Fibonacci ratio of primary wave 1. Primary wave 2 may not move beyond the start of primary wave 1 below 1,160.75.
A black channel is drawn about primary wave 1. Primary wave 2 may breach the lower edge of this channel.
Cycle wave III so far for this wave count would have been underway now for 27 weeks. It should be beginning to exhibit some support from volume, increase in upwards momentum and increasing ATR. However, volume continues to decline, ATR continues to decline and is very low, and momentum is weak in comparison to cycle wave I. This wave count lacks support from classic technical analysis.
TECHNICAL ANALYSIS
WEEKLY CHART
Click chart to enlarge. Chart courtesy of StockCharts.com.
Support and resistance about 1,310 – 1,300 has now been breached in both directions multiple times. This area of prior strong support and resistance has by now been weakened.
With volume pushing price lower, it looks like more downwards movement may continue here at least for the short term.
DAILY CHART
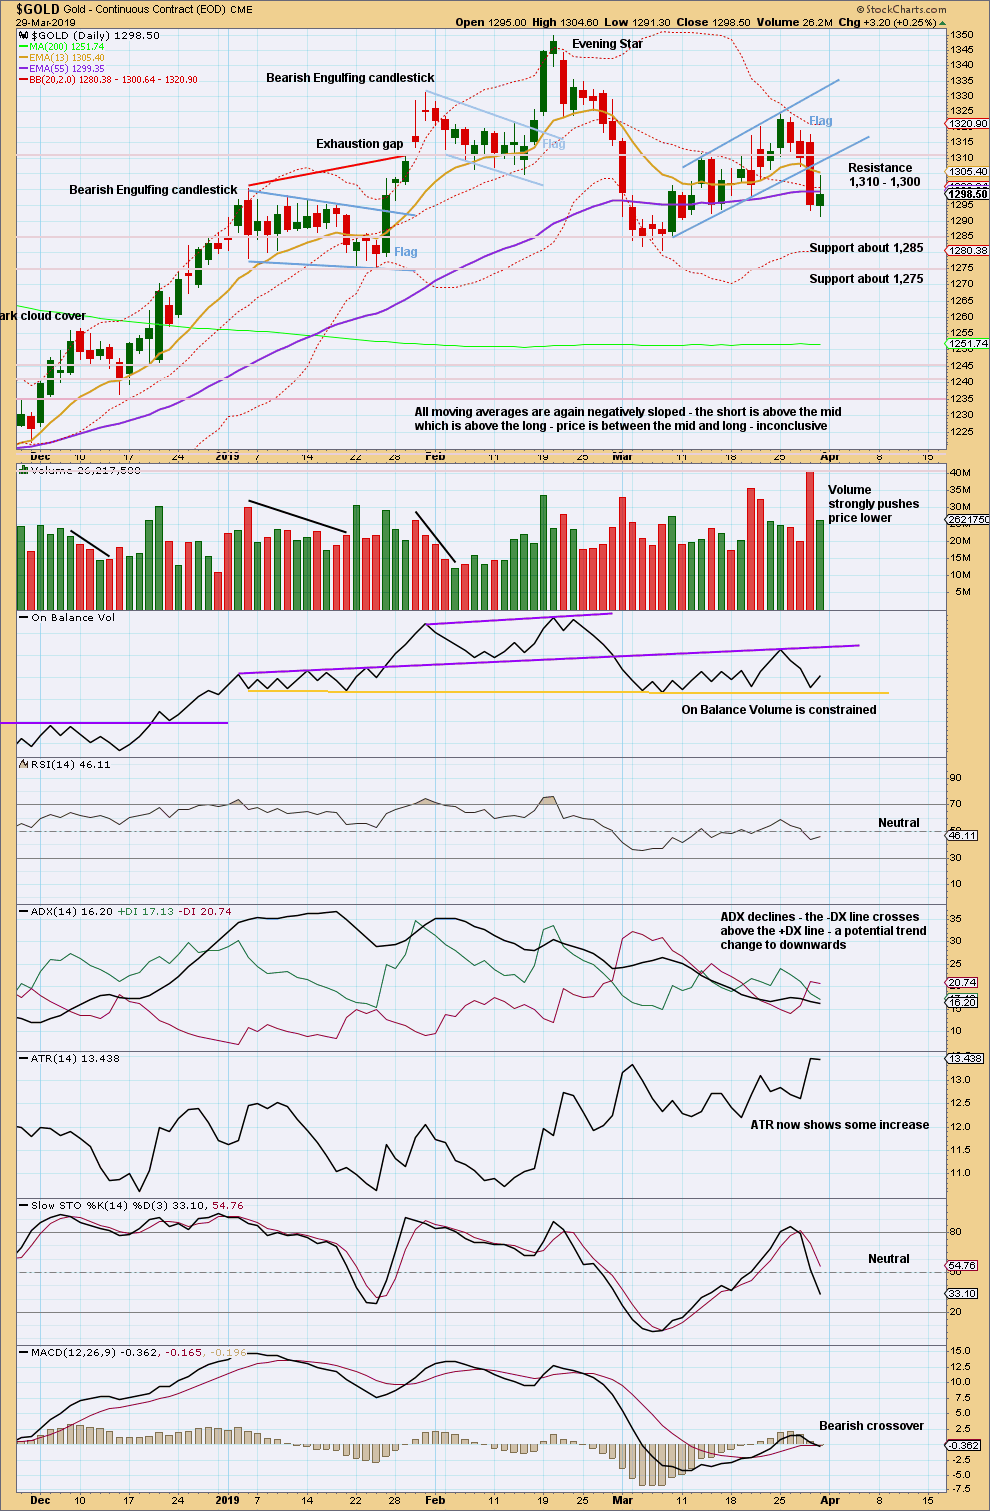
Click chart to enlarge. Chart courtesy of StockCharts.com.
Thursday completes a downwards breakout below the flag pattern, which has support from volume. Support from volume is not required for confidence in downwards breakouts, but when it occurs greater confidence may be had.
The target using the flag pole is recalculated at 1,238, now that the breakout point is more accurately known.
On Balance Volume trend lines are simplified.
Overall, this chart is neutral to bearish. It offers some support to the preferred Elliott wave count.
GDX WEEKLY CHART
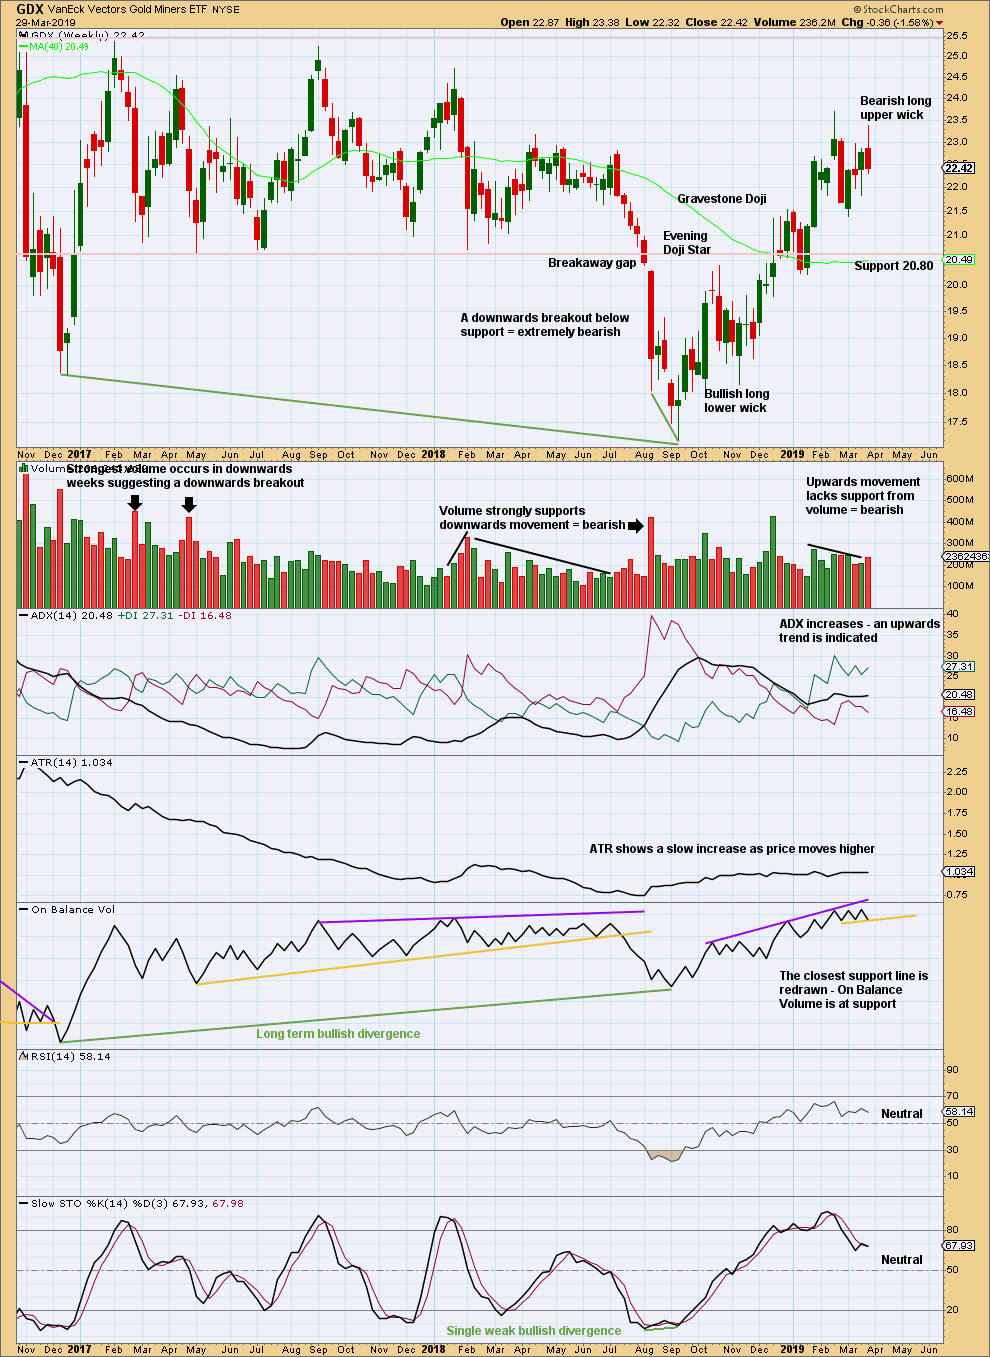
Click chart to enlarge. Chart courtesy of StockCharts.com.
A new swing low below the prior low of the week beginning 22nd January at 20.22 would confirm a trend change. For now GDX may be assumed to remain in an upwards trend. There is a series of higher highs and higher lows from the low in September 2018.
For the short term, a bearish long upper wick and volume pushing price lower for the last week suggest more downwards movement next week.
GDX DAILY CHART
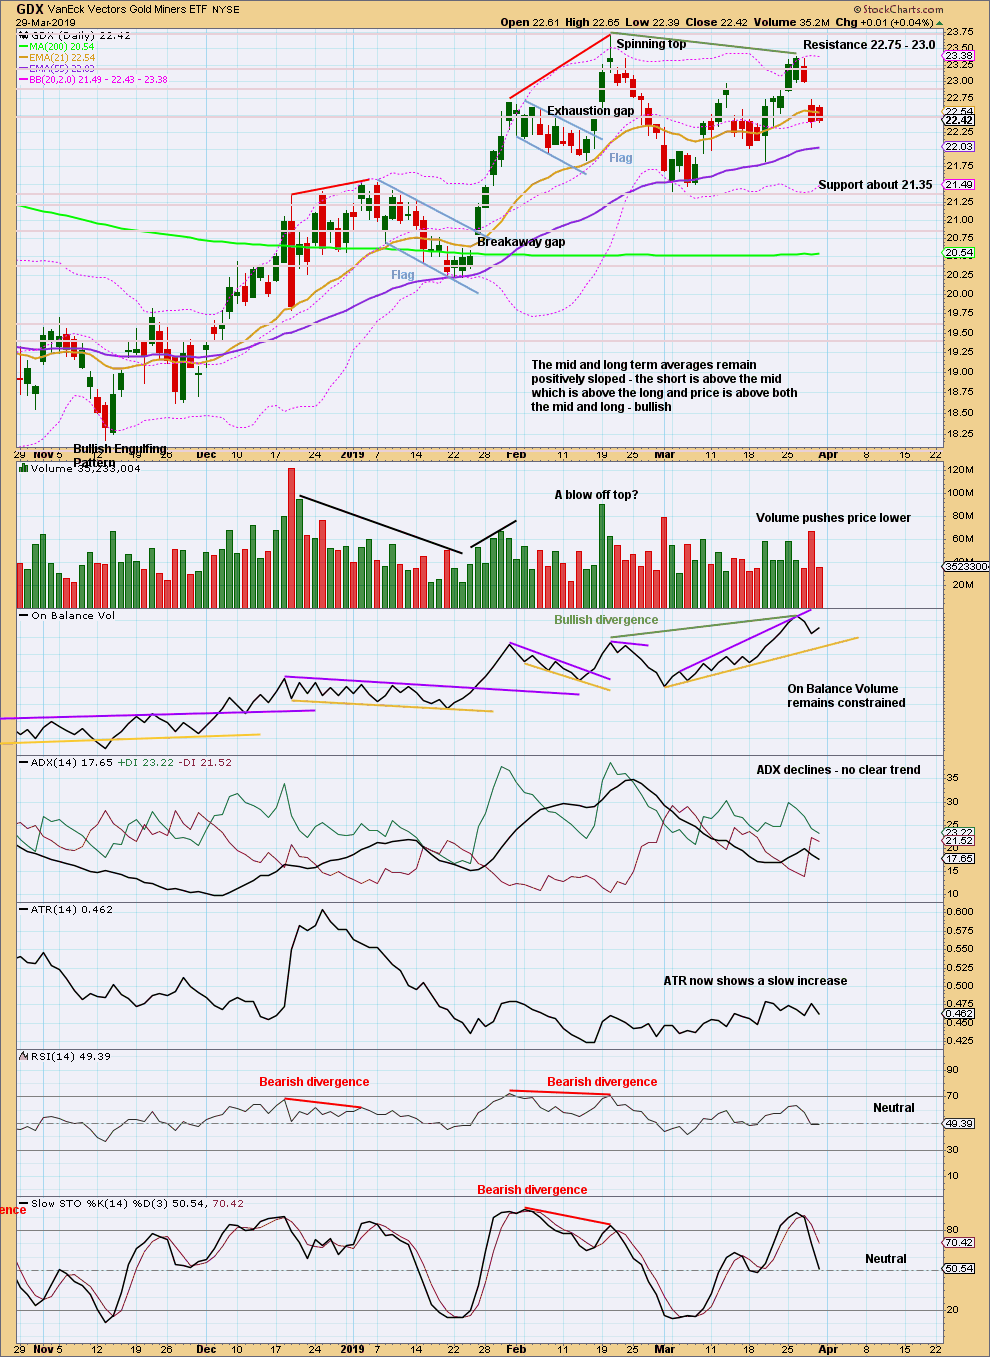
Click chart to enlarge. Chart courtesy of StockCharts.com.
At the daily chart level, the view of an upwards trend may be in doubt with a new swing low on the 1st of March 2019 that moved below the prior swing low of the 14th of February 2019. At that stage, the series of higher highs and higher lows was no longer intact and a trend change was possible.
Since then price has not made another higher high. For the short term, price remains range bound. Currently, price may be within a downwards swing to support. If price reaches support about 21.35 and Stochastics is oversold at the same time, the downwards swing may end there.
US OIL
Last week’s analysis expected a bounce to continue for US Oil. An outside week closes green and price remains within the channel on the daily chart.
Summary: While price remains within the channel on the daily chart, assume the bounce will continue. The target remains at 63.71.
If the channel is breached by a full daily candlestick below and not touching the lower edge, assume the bounce is over and a third wave down has begun.
The larger picture still sees Oil in a new downwards trend to end reasonably below 26.06.
MAIN ELLIOTT WAVE COUNT
MONTHLY CHART
Click chart to enlarge.
Classic technical analysis favours a bearish wave count for Oil at this time.
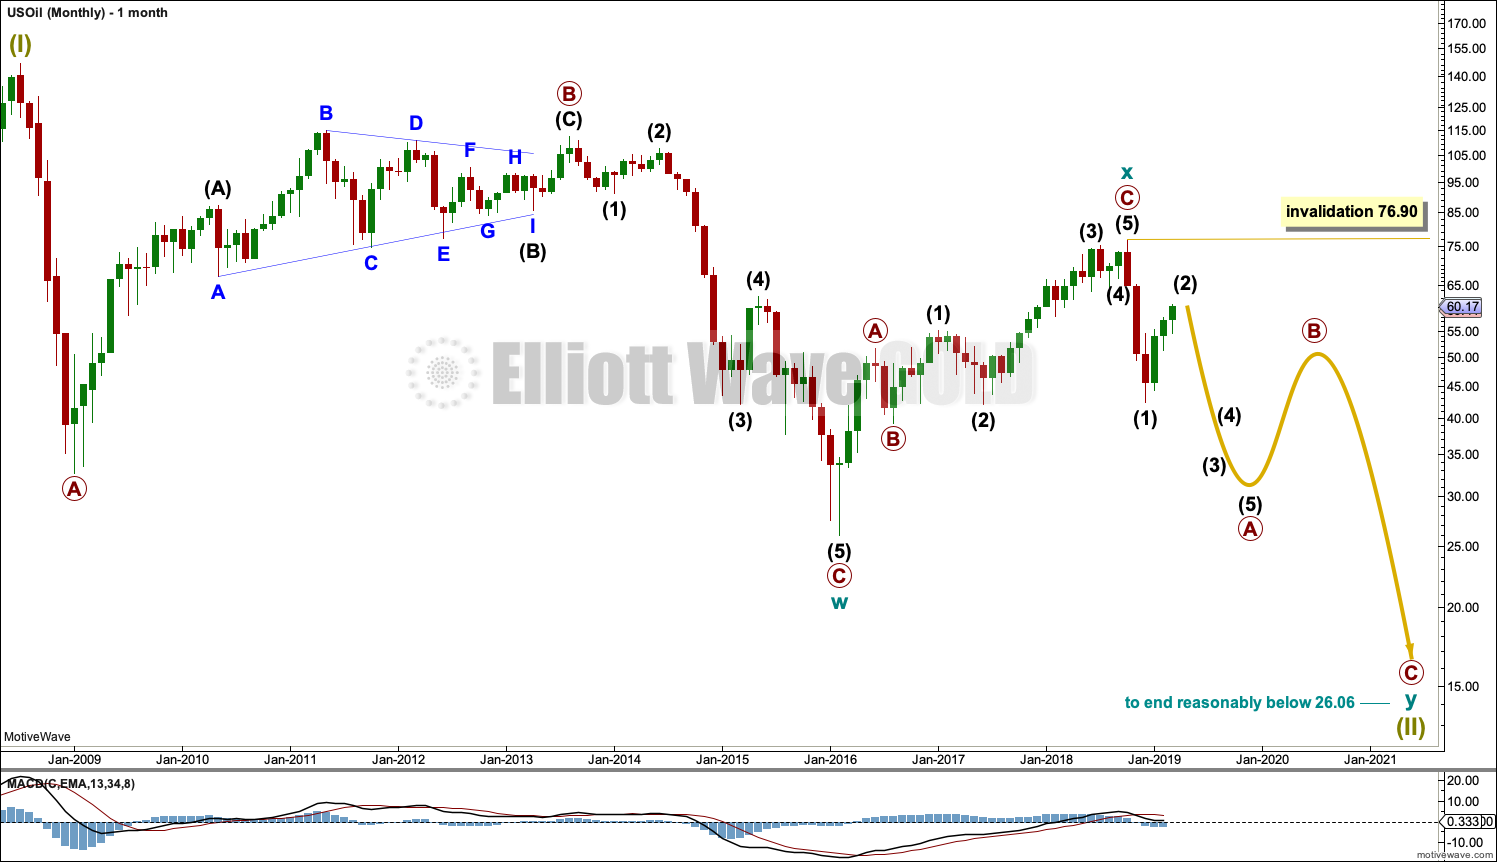
The large fall in price from the high in June 2008 to February 2016 is seen as a complete three wave structure. This large zigzag may have been only the first zigzag in a deeper double zigzag.
Upwards movement from February 2016 to October 2018 will not fit readily as a five wave structure but will fit very well as a three. With a three wave structure upwards, this indicates the bear market may not be over.
The first zigzag down is labelled cycle wave w. The double is joined by a now complete three in the opposite direction, a zigzag labelled cycle wave x.
The purpose of a second zigzag in a double is to deepen the correction when the first zigzag does not move price deep enough. Cycle wave y would be expected to move reasonably below the end of cycle wave w to deepen the correction. Were cycle wave y to reach equality with cycle wave w that takes Oil into negative price territory, which is not possible. Cycle wave y would reach 0.618 the length of cycle wave w at $2.33.
A better target calculation would be using the Fibonacci ratios between primary waves A and C within cycle wave y. This cannot be done until both primary waves A and B are complete.
Within cycle wave y, no second wave correction nor B wave may move beyond its start above 76.90.
WEEKLY CHART
Click chart to enlarge.
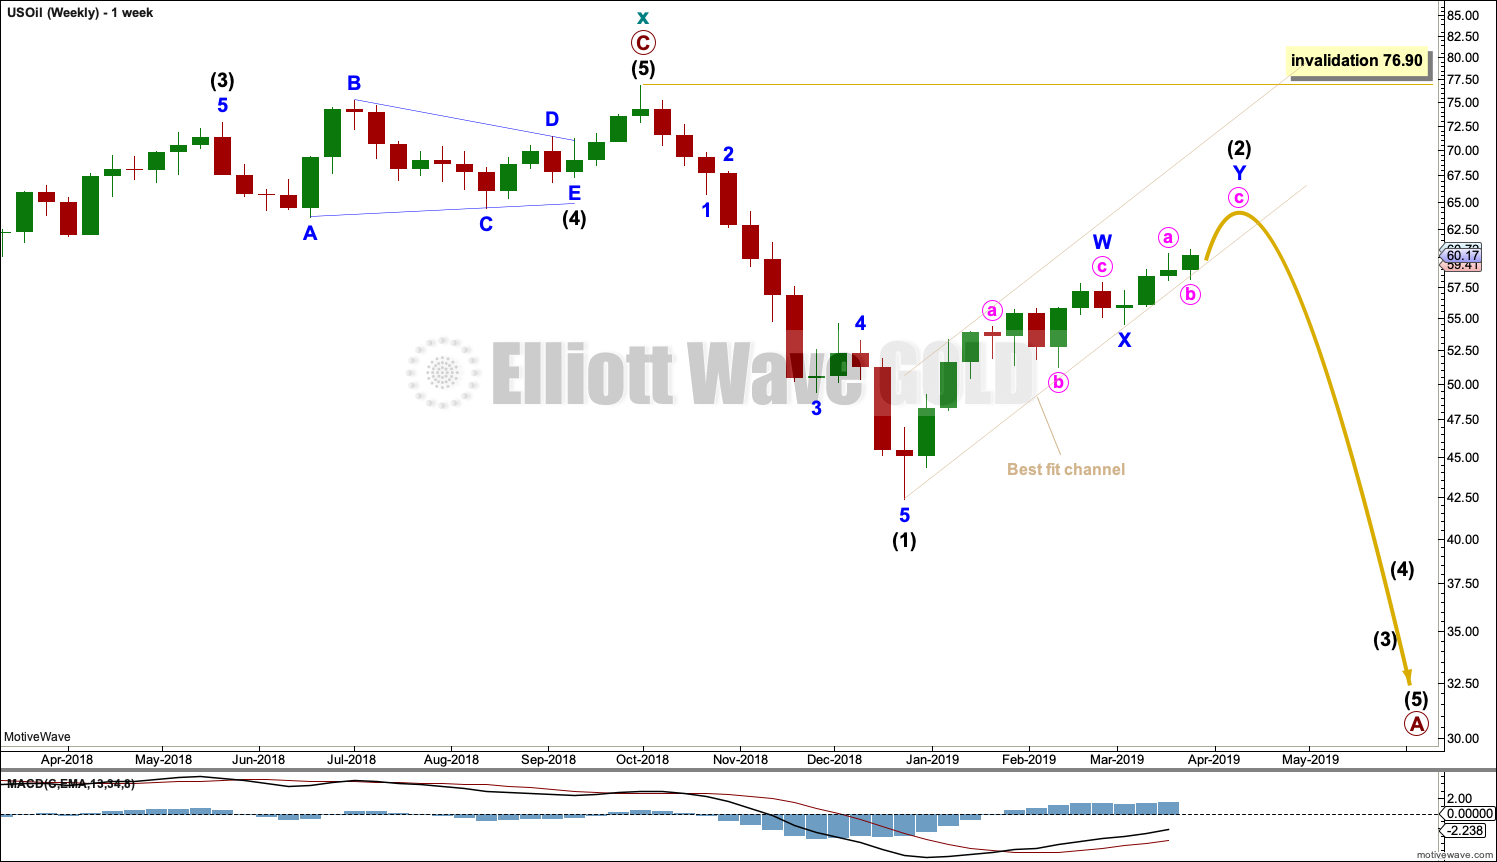
This weekly chart is focussed on the start of cycle wave y.
Cycle wave y is expected to subdivide as a zigzag. A zigzag subdivides 5-3-5. Primary wave A must subdivide as a five wave structure if this wave count is correct.
Within primary wave A, intermediate wave (1) may now be complete.
Intermediate wave (2) is a possibly incomplete double zigzag.
Intermediate wave (2) may not move beyond the start of intermediate wave (1) above 76.90.
DAILY CHART
Click chart to enlarge.
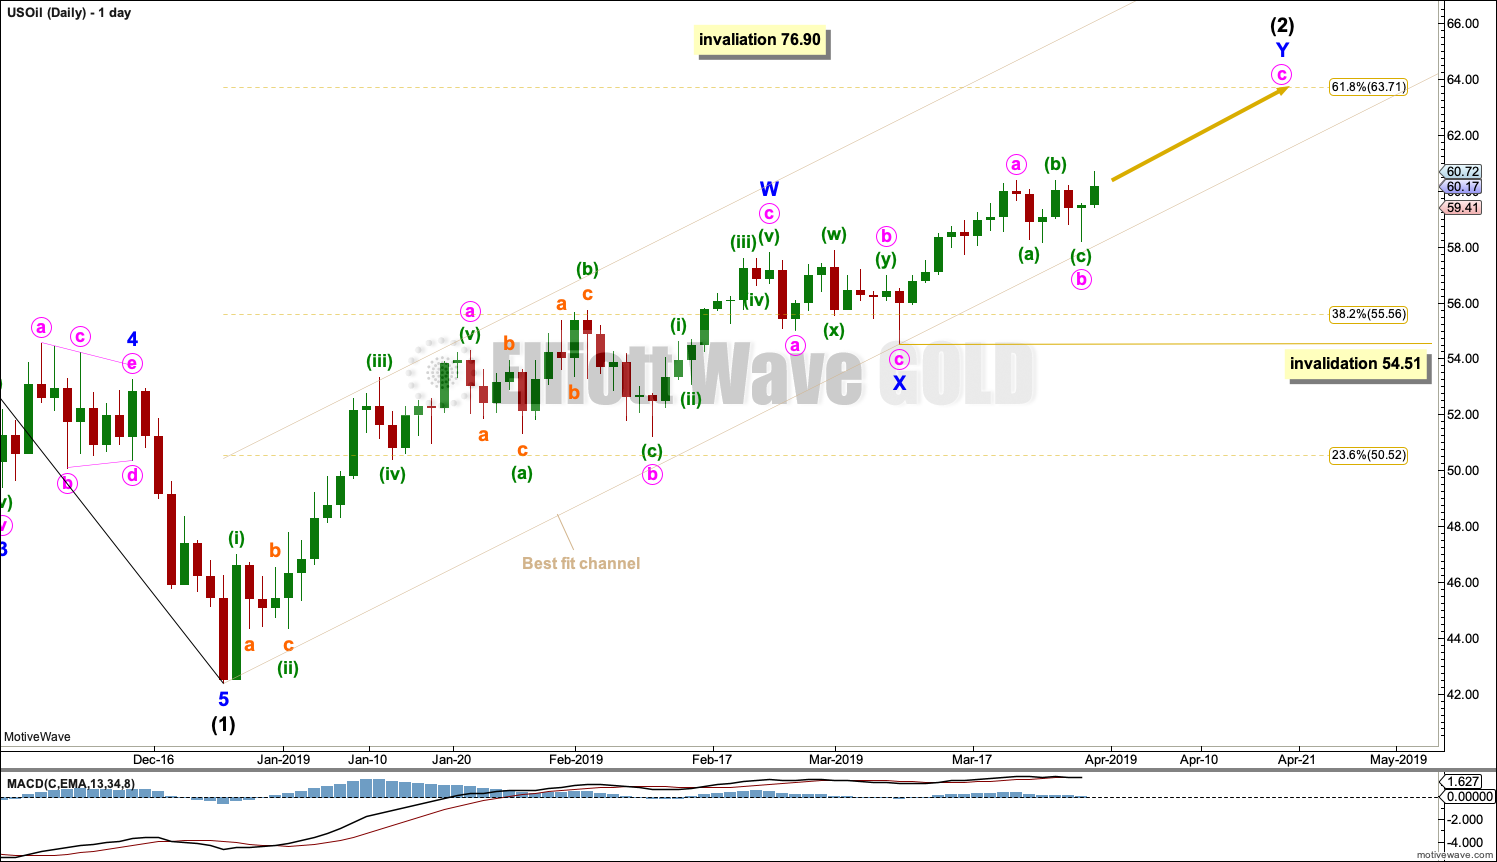
Always assume the trend remains the same until proven otherwise.
Intermediate wave (2) may be an incomplete double zigzag. The first zigzag may be complete, labelled minor wave W. The double may be joined by a three in the opposite direction, a double zigzag labelled minor wave X.
This week the structure of minor wave X is relabelled. This has a good fit and resolves the problem of seeing minor wave X as a multiple.
The channel is drawn as a best fit. If this channel is breached by a full candlestick below and not touching it, that may indicate a trend change.
If minute wave b moves a little lower, then look for it to find support about the lower edge of the channel.
Minor wave Y may end about the 0.618 Fibonacci ratio at 63.71.
Intermediate wave (2) may not move beyond the start of intermediate wave (1) above 76.90.
TECHNICAL ANALYSIS
MONTHLY CHART
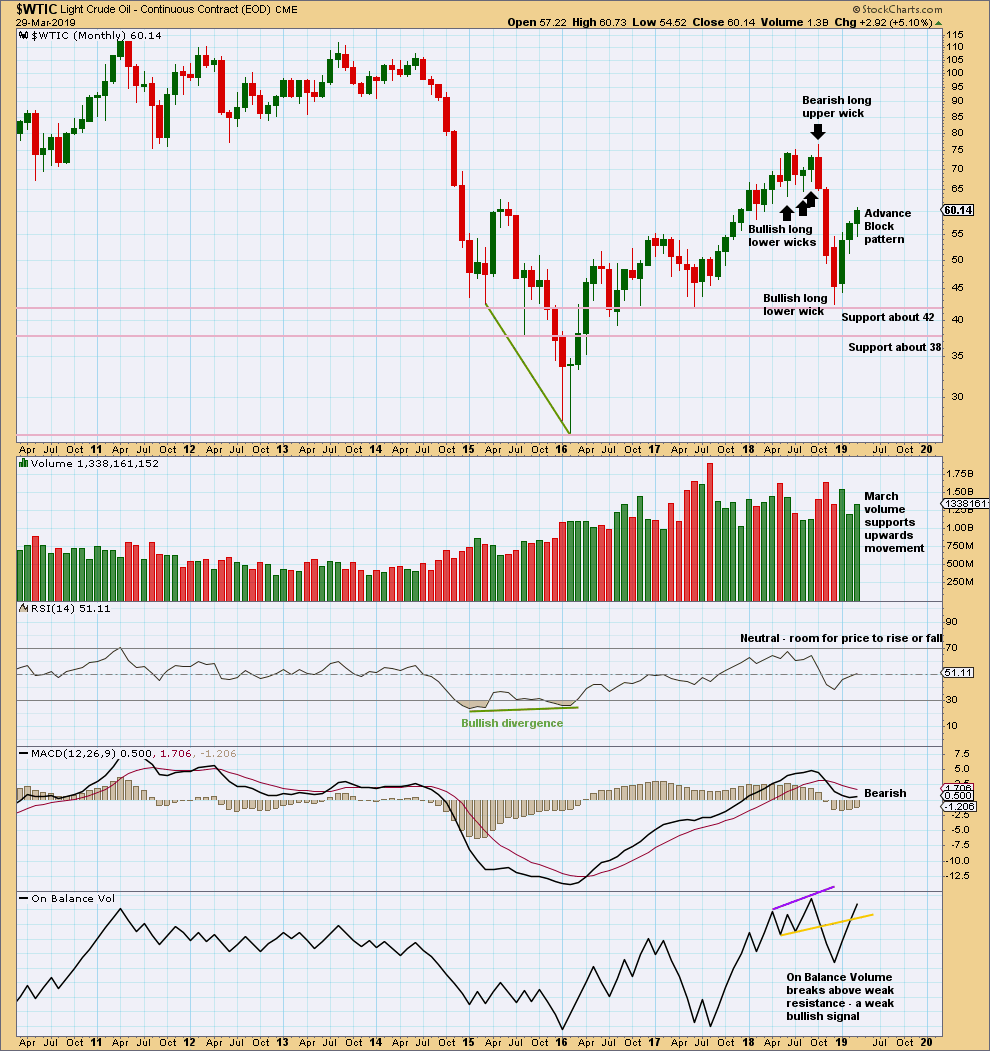
Click chart to enlarge. Chart courtesy of StockCharts.com.
The Advance Block pattern signals developing weakness. But the long lower wicks of the last two monthly candlesticks and some support from volume for March suggest more upwards movement for April.
This upwards bounce may be tiring.
WEEKLY CHART
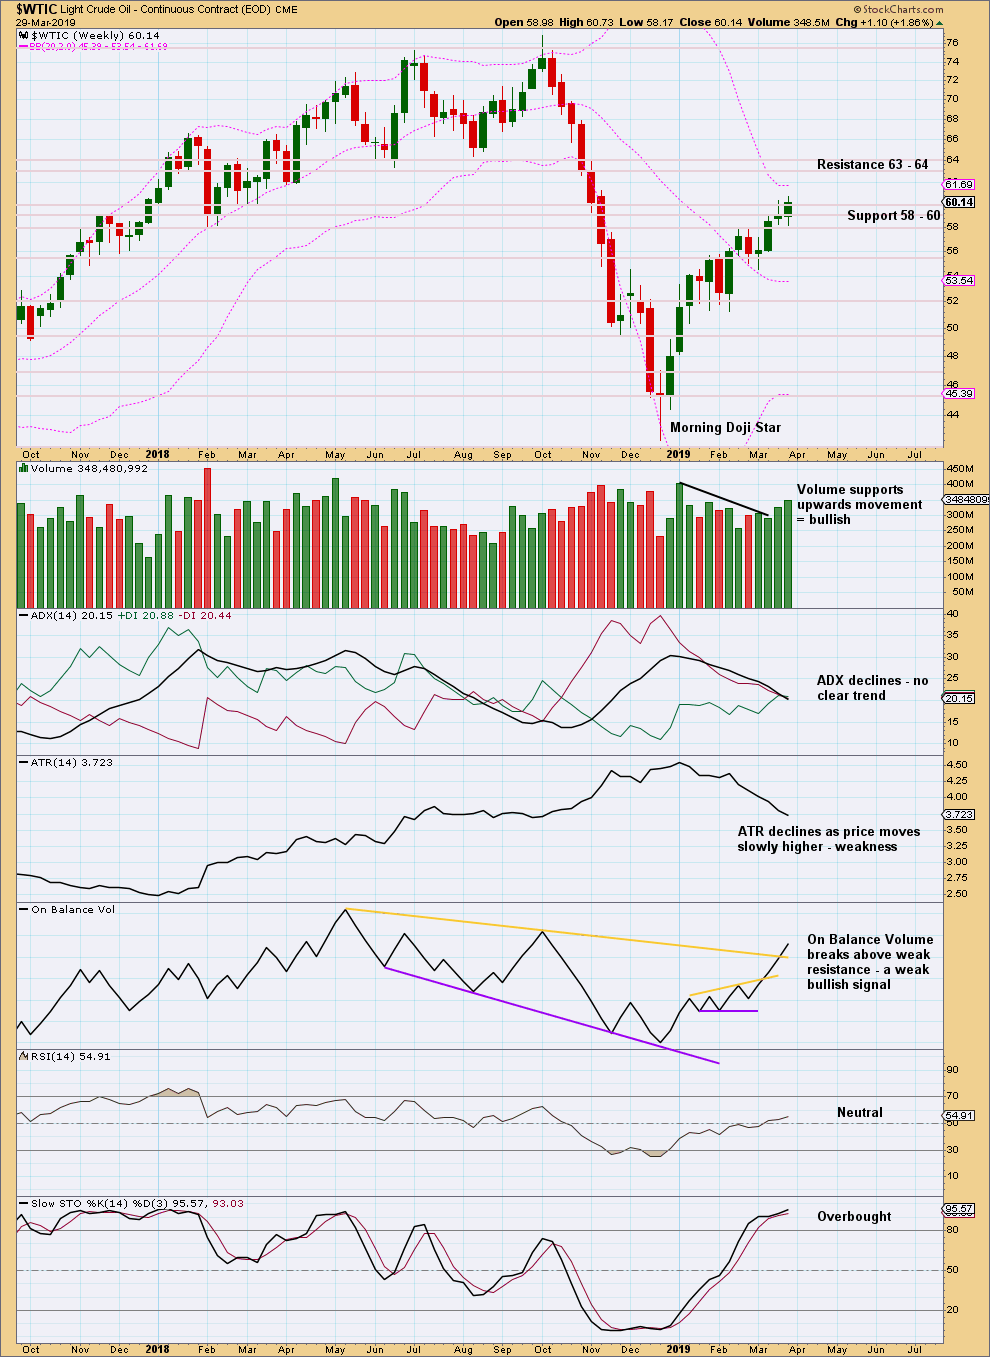
Click chart to enlarge. Chart courtesy of StockCharts.com.
Volume and On Balance Volume suggest more upwards movement next week. Stochastics is overbought but may remain so for a while before price finds a high.
DAILY CHART
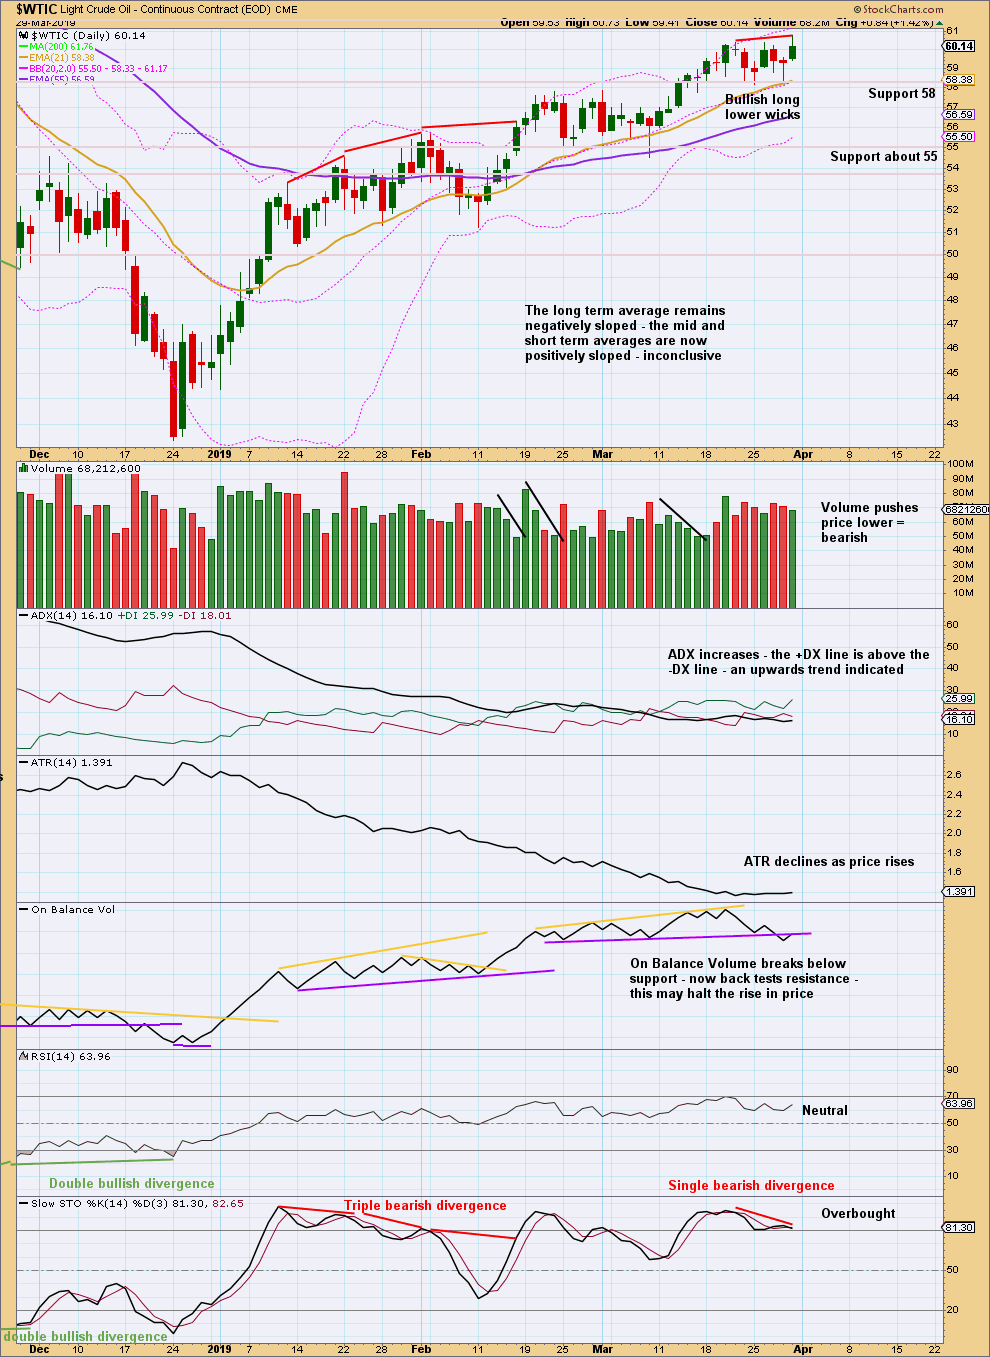
Click chart to enlarge. Chart courtesy of StockCharts.com.
The short-term volume profile does not support upwards movement and price has not closed above resistance.
For the very short term, On Balance Volume is bearish.
However, there is no evidence yet of an end to this bounce. Since the 24th of December 2018 there has been a series of higher highs and higher lows, the basic definition of an upwards trend. Assume this will continue until proven it has ended. A lower low below the low of the 8th of March 2019 would provide evidence the bounce is over.
Stochastics may continue to remain overbought and may exhibit further divergence before the bounce ends.
—
Always practice good risk management as the most important aspect of trading. Always trade with stops and invest only 1-5% of equity on any one trade. Failure to manage risk is the most common mistake new traders make.
Hi Lara, Bitcoin seems to have broken resistance at 4200 and sure looks like it has started an impulse move higher supported by volume. Any additional thoughts?
It’s well past due for me to update something for public analysis. I’ll take a look at Bitcoin on Sunday (my time).
Thank you! 🙂
Hi Lara. I note your comment about wave I being longer than wave III, which affects your target for wave V. Is there any way that wave II could have ended in October 2011 rather than Jan 2016. This would clear the way for wave V to head substantially higher than your target of 3045.
I’m assuming you’re talking about the S&P500 here:
Yes, that might work. I’ve just charted it and it has problems in terms of proportion, but it fits okay with MACD.
I do also have a very bullish alternate count for the S&P which is published in last monthly analysis.
Hi Lara any insight on the short-term squiggles would be great this is a difficult pattern to look at and analyze it seems as if we’re not done with the corrective wave but I’m curious as to what the upper target might be… Also going into the jobs report tomorrow there might be some good volatility to trade and or enter new positions.
You’ll have to state which market you’re referring to. I don’t like guessing.
So sorry! Gold!
I’m going to now label minute i within minor 3 over at the last low. Now expecting a bounce to continue for a very few days (2 or 3?) to 1,297 (more likely) or 1,307 (less likely).
Here is my updated count on GLD. The question remains, Is today’s drop the completion of the initial impulse of Minor 3 to be followed by a corrective move up, or is it the start of an acceleration of Minor 3 which will take us much lower? I am guessing it is the former and we will see a corrective move up starting today or tomorrow lasting a couple or few days.
Is there a small chance we’re still in a b wave in minor ii?
A double zigzag perhaps?
Jit
I’m still expecting minute ii has not completed yet. The middle portion of minor 3 is still yet to arrive.
Here is my chart / count on GLD for the hourly time frame. Please note it is not for gold spot of future prices. It is for the derivative GLD.
I will be looking for a retracement to the .382 (122.86) or .618 (123.73) levels at which time I will add to my DUST positions. I have a full position on now and will add another 50% position.
Hi Lara,
For Oil, minor Y, with minute a lasting ~ 9 days, and minute b finishing in minimum 5, could we estimate the number of days minute c would last?
Thanks in advance,
Maybe 9 days? That would be about even in duration with minute wave a.