

S&P 500
A consolidation was expected to continue. A small downwards day closes as a Doji, which fits expectations.
Summary: The upwards trend remains intact and there is underlying strength in this market still. A consolidation may unfold here that may be shallow and short lived.
The final target remains the same at 3,045. Alternate monthly wave counts allow for a target as high as 4,119.
The biggest picture, Grand Super Cycle analysis, is here.
Monthly charts were last published here. Video is here.
ELLIOTT WAVE COUNTS
MAIN WAVE COUNT
WEEKLY CHART
Click chart to enlarge.
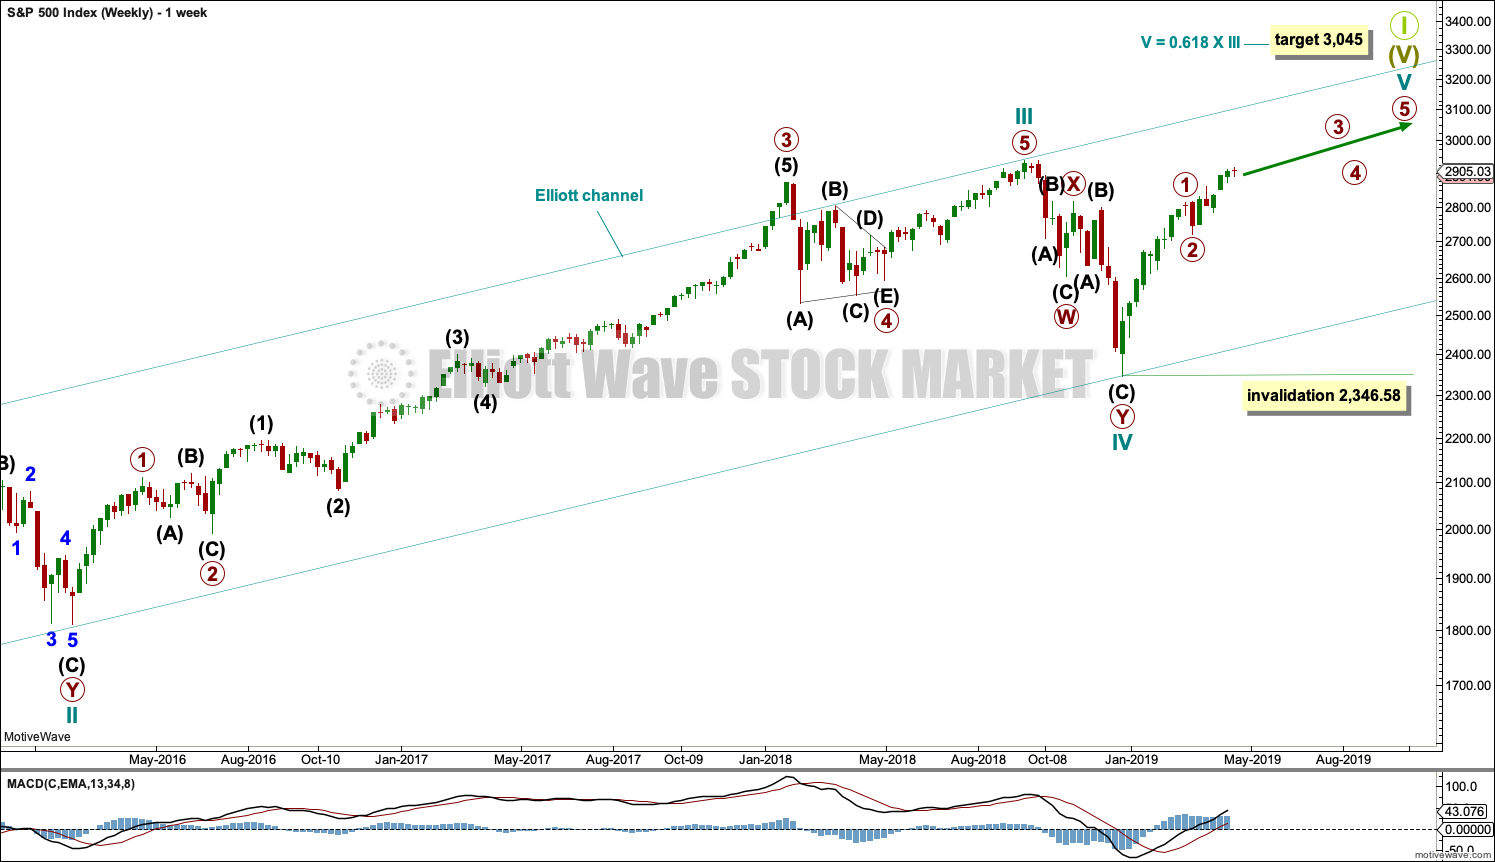
This weekly chart shows all of cycle waves III, IV and V so far.
Cycle wave II fits as a time consuming double combination: flat – X – zigzag. Combinations tend to be more time consuming corrective structures than zigzags. Cycle wave IV has completed as a multiple zigzag that should be expected to be more brief than cycle wave II.
Cycle wave IV may have ended at the lower edge of the Elliott channel.
Within cycle wave V, no second wave correction may move beyond the start of its first wave below 2,346.58.
Although both cycle waves II and IV are labelled W-X-Y, they are different corrective structures. There are two broad groups of Elliott wave corrective structures: the zigzag family, which are sharp corrections, and all the rest, which are sideways corrections. Multiple zigzags belong to the zigzag family and combinations belong to the sideways family. There is perfect alternation between the possible double zigzag of cycle wave IV and the combination of cycle wave II.
Although there is gross disproportion between the duration of cycle waves II and IV, the size of cycle wave IV in terms of price makes these two corrections look like they should be labelled at the same degree. Proportion is a function of either or both of price and time.
Draw the Elliott channel about Super Cycle wave (V) with the first trend line from the end of cycle wave I (at 2,079.46 on the week beginning 30th November 2014) to the high of cycle wave III, then place a parallel copy on the low of cycle wave II. Cycle wave V may find resistance about the upper edge.
It is possible that cycle wave V may end in October 2019. If it does not end there, or if the AD line makes new all time highs during or after June 2019, then the expectation for cycle wave V to end would be pushed out to March 2020 as the next possibility. Thereafter, the next possibility may be October 2020. March and October are considered as likely months for a bull market to end as in the past they have been popular. That does not mean though that this bull market may not end during any other month.
DAILY CHART

Click chart to enlarge.
The daily chart will focus on the structure of cycle wave V.
Cycle wave V must subdivide as a five wave motive structure, either an impulse or an ending diagonal. An impulse is much more common and that will be how it is labelled. A diagonal would be considered if overlapping suggests it.
Primary wave 2 may have been a very brief and shallow expanded flat correction.
Within primary wave 3, intermediate waves (1) and (2) may be complete. It is possible that intermediate wave (3) may be complete. It is also possible that minor wave 5 within it may extend higher.
Intermediate wave (4) may not move into intermediate wave (1) price territory below 2,852.42.
The best fit channel is no longer showing where pullbacks are finding support, so it is removed. A channel is drawn using Elliott’s first technique about the impulse of primary wave 3. Intermediate wave (4) may find support about the lower edge of the channel.
TECHNICAL ANALYSIS
WEEKLY CHART
Click chart to enlarge. Chart courtesy of StockCharts.com.
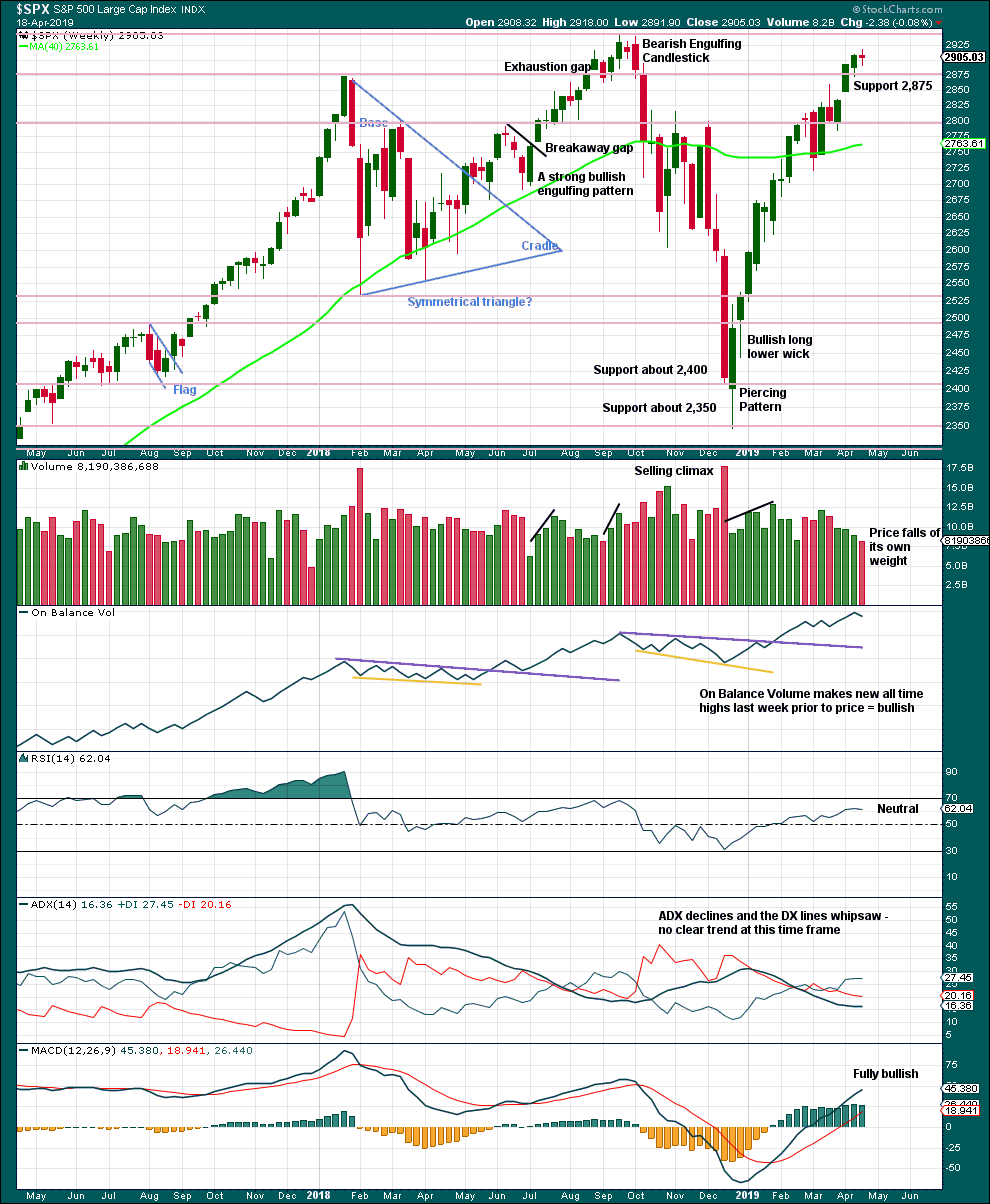
Resistance about 2,880 has been overcome. Next resistance is about the prior all time high about 2,940.
On Balance Volume makes another new all time high last week strongly supporting the Elliott wave count.
A decline in volume while price moves higher is not of concern given current market conditions. This has been a feature of this market for a long time and yet price continues higher.
This week moved price higher, but the candlestick closed red and the balance of volume was downwards. With a short trading week, it would be best to look inside the week at daily volume bars to judge the short-term volume profile. Overall, this chart remains bullish and supports the Elliott wave count.
DAILY CHART
Click chart to enlarge. Chart courtesy of StockCharts.com.
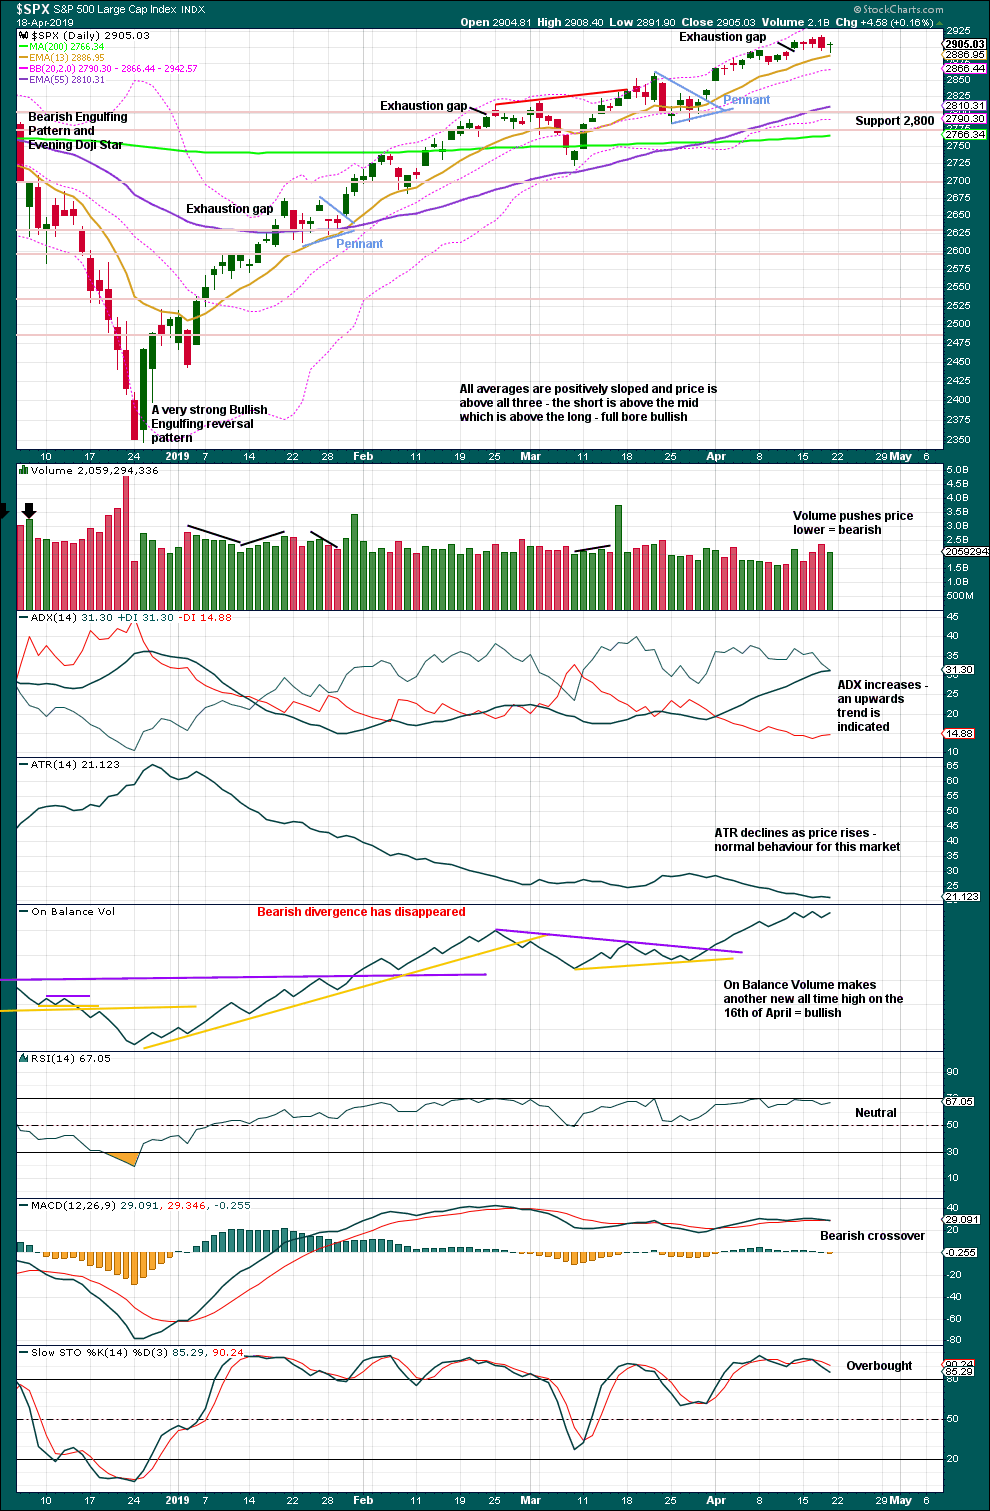
The December 2018 low is expected to remain intact. The two 90% upwards days on 26th December 2018 and 6th January 2019 indicate this upwards trend has internal strength.
Lowry’s data shows that on the 8th of April Selling Pressure has reached another new low for this bull market, and Buying Power has reached a new high for this rally. This indicates an expansion in demand and a contraction in supply, which has historically been associated with strong phases of bull markets. This strongly supports the Elliott wave count, which expects new all time highs to come this year.
While the last swing low of the 25th of March remains intact, there exists a series of higher highs and higher lows from the major low in December 2018. It would be safest to assume the upwards trend remains intact. ADX agrees.
The last gap is now closed and is relabelled as an exhaustion gap. The risk of a near-term pullback or consolidation is heightened. This fits the Elliott wave count expectation. The target calculated from the pennant pattern may not be reached in the short term.
BREADTH – AD LINE
WEEKLY CHART
Click chart to enlarge. Chart courtesy of StockCharts.com. So that colour blind members are included, bearish signals
will be noted with blue and bullish signals with yellow.
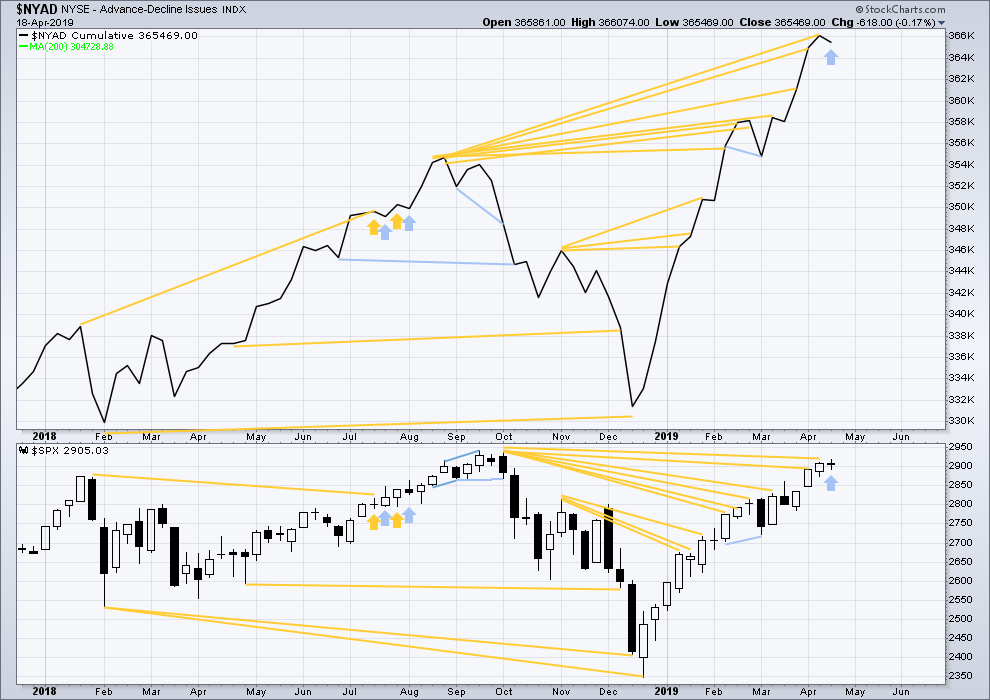
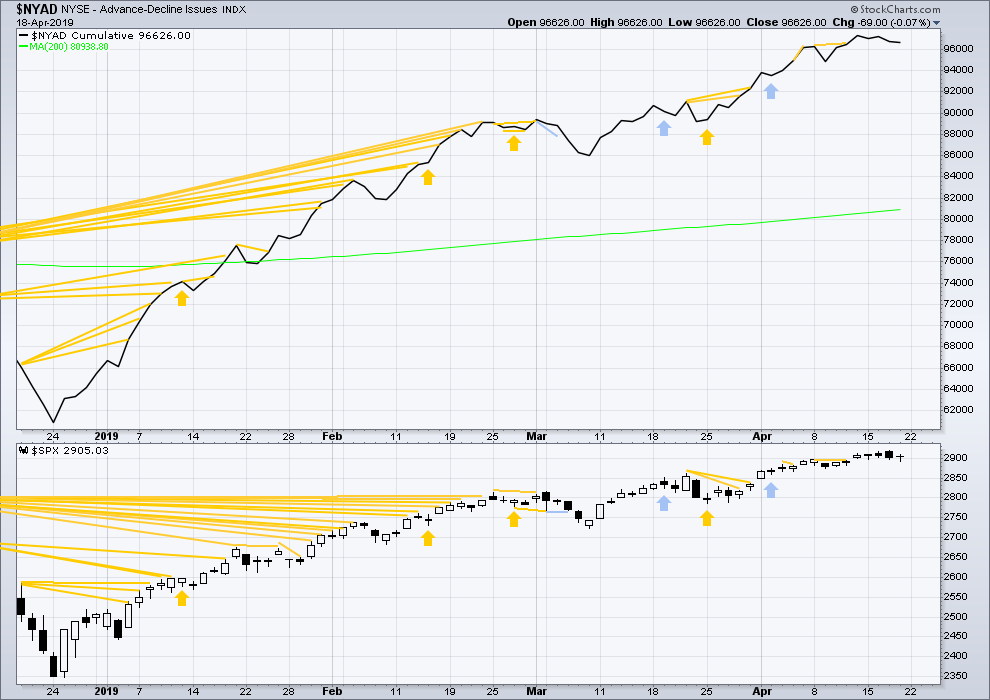
Every single bear market from the Great Depression and onwards has been preceded by a minimum of 4 months divergence between price and the AD line. With the AD line making a new all time high again last week, the end of this bull market and the start of a new bear market must be a minimum of 4 months away, which is the end of July 2019 at this time.
Last week the AD line makes another new all time high. Bullish mid-term divergence continues.
This week the AD line moves lower while price moves higher. This divergence is bearish for the short term.
Mid and large caps have both made new highs above the swing high of the 25th of February, but small caps have not. However, small caps AD line has made a new all time high on the 12th of April indicating broad strength underlying this market.
DAILY CHART
Click chart to enlarge. Chart courtesy of StockCharts.com. So that colour blind members are included, bearish signals
will be noted with blue and bullish signals with yellow.
Breadth should be read as a leading indicator.
On Friday both price and the AD line moved slightly lower. Downwards movement has support from falling market breadth. There is no new short-term divergence.
VOLATILITY – INVERTED VIX CHART
WEEKLY CHART
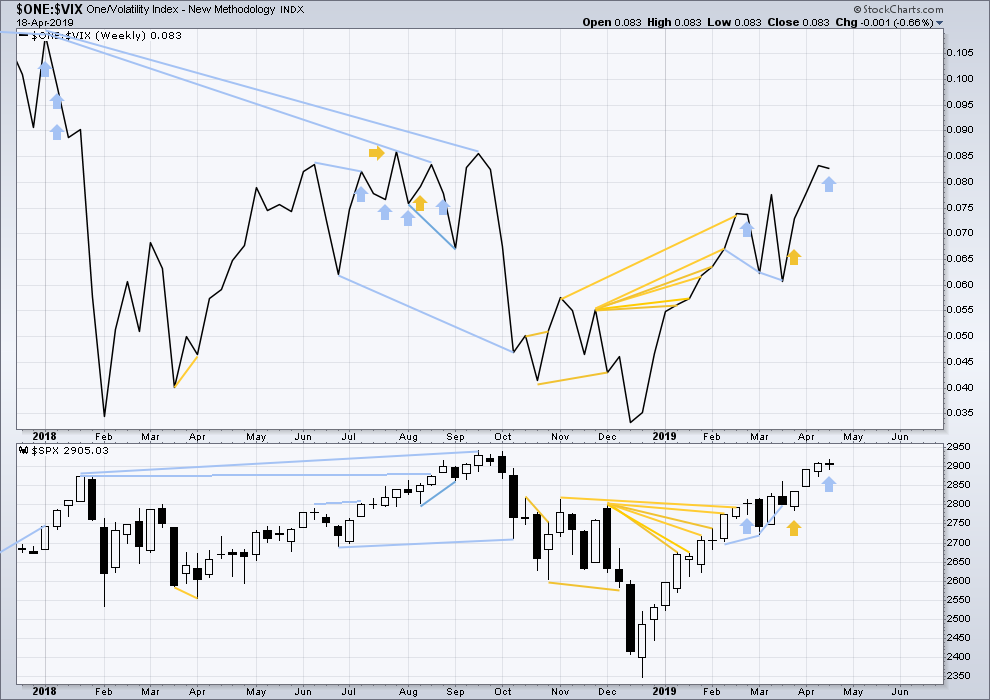
Click chart to enlarge. Chart courtesy of StockCharts.com. So that colour blind members are included, bearish signals
will be noted with blue and bullish signals with yellow.
This week price moved higher, but inverted VIX moved lower. Upwards movement did not come with a normal corresponding decline in VIX. With VIX increasing this week, this divergence is bearish.
DAILY CHART
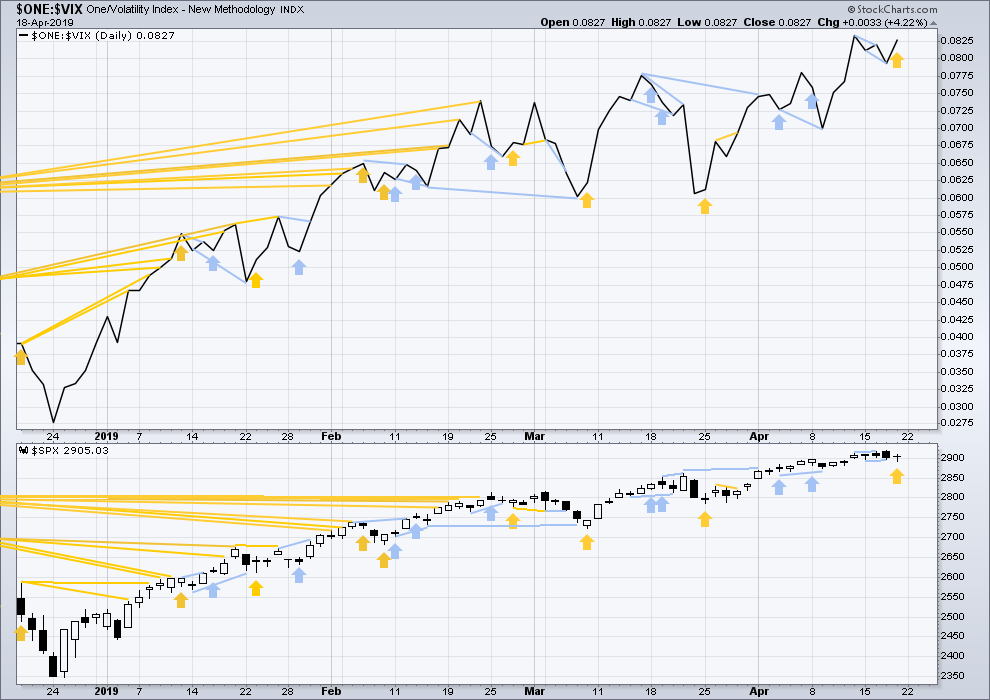
Click chart to enlarge. Chart courtesy of StockCharts.com. So that colour blind members are included, bearish signals
will be noted with blue and bullish signals with yellow.
On Thursday inverted VIX moved higher while price moved lower. Downwards movement did not come with a normal corresponding increase in VIX. With a short term decline in VIX, this divergence is bullish for the short term.
DOW THEORY
Dow Theory confirmed a bear market in December 2018. This does not necessarily mean a bear market at Grand Super Cycle degree though; Dow Theory makes no comment on Elliott wave counts. On the 25th of August 2015 Dow Theory also confirmed a bear market. The Elliott wave count sees that as part of cycle wave II. After Dow Theory confirmation of a bear market in August 2015, price went on to make new all time highs and the bull market continued.
DJIA: 23,344.52 – a close on the 19th of December at 23,284.97 confirms a bear market.
DJT: 9,806.79 – price has closed below this point on the 13th of December.
S&P500: 2,532.69 – a close on the 19th of December at 2,506.96 provides support to a bear market conclusion.
Nasdaq: 6,630.67 – a close on the 19th of December at 6,618.86 provides support to a bear market conclusion.
With all the indices moving now higher, Dow Theory would confirm a bull market if the following highs are made:
DJIA: 26,951.81
DJT: 11,623.58
S&P500: 2,940.91
Nasdaq: 8,133.30.
GOLD
With New York Stock Exchange closed for Good Friday, there is no new data to analyse for Friday’s session. But the weekly technical analysis is updated in this analysis.
Strong signals from On Balance Volume support the Elliott wave count.
Summary: The downwards trend has resumed. There will be bounces and consolidations along the way down. Downwards momentum may now show some increase, and corrections may become more brief and shallow.
The Elliott wave target is at 1,220. Risk is just above the upper edge of the base channel on the daily chart.
Three long-term targets are now calculated for cycle wave c to end. Confidence in a new downwards trend may be had with a new low below 1,160.75.
Grand SuperCycle analysis is here.
Last monthly charts are here. Video is here.
MAIN ELLIOTT WAVE COUNT
WEEKLY CHART – TRIANGLE
Click chart to enlarge.
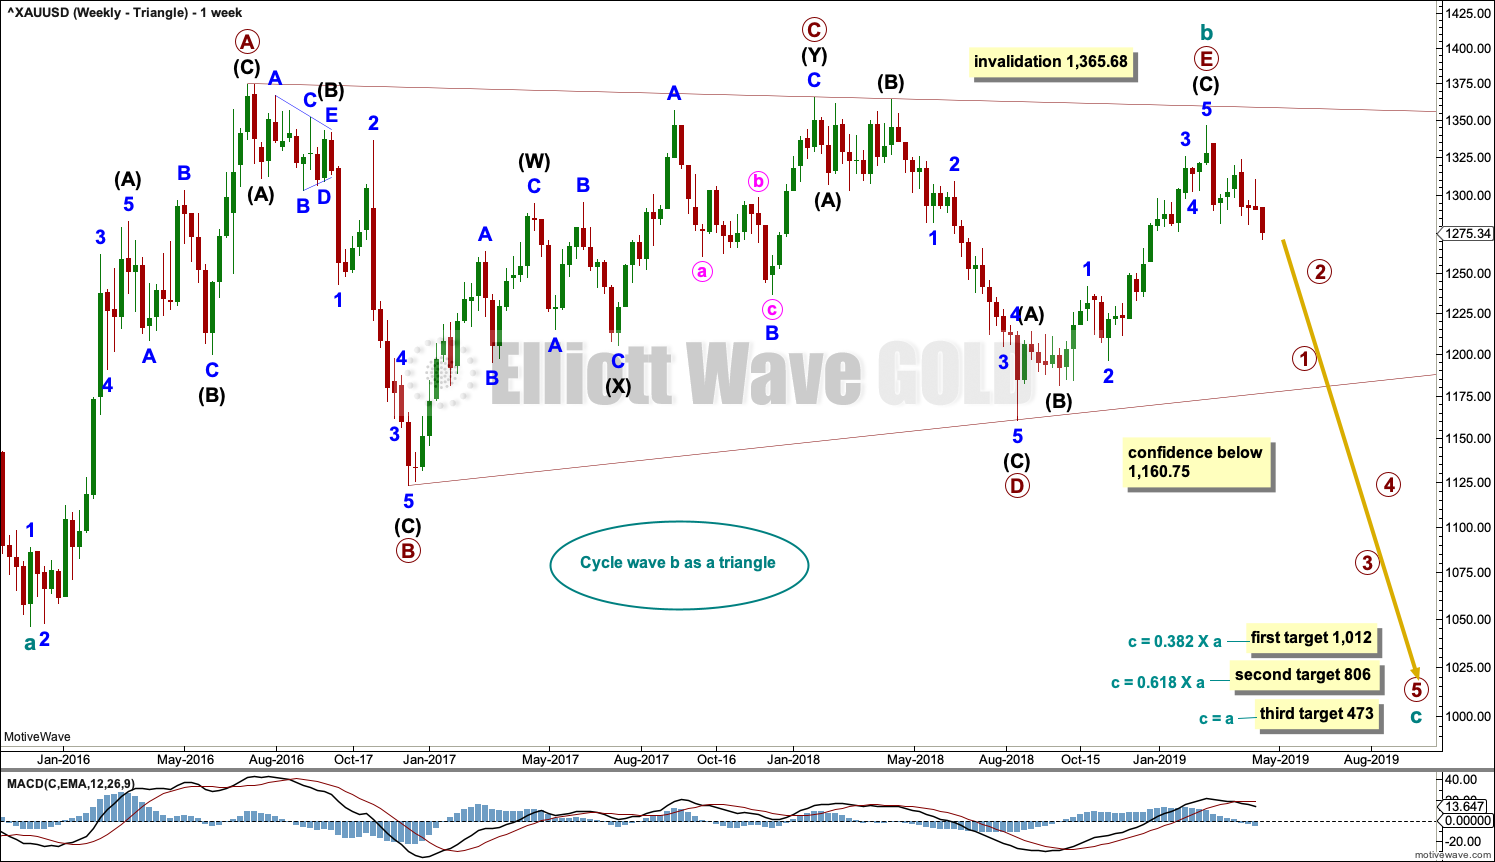
This is the preferred wave count.
Cycle wave b may be a complete regular contracting triangle. If it continues further, then primary wave E may not move beyond the end of primary wave C above 1,365.68.
Four of the five sub-waves of a triangle must be zigzags, with only one sub-wave allowed to be a multiple zigzag. Wave C is the most common sub-wave to subdivide as a multiple, and this is how primary wave C for this example fits best.
There are no problems in terms of subdivisions or rare structures for this wave count. It has an excellent fit and so far a typical look.
This wave count would expect a cycle degree trend change has recently occurred. Cycle wave c would most likely make new lows below the end of cycle wave a at 1,046.27 to avoid a truncation.
Primary wave E has exhibited reasonable weakness as it came to an end. Triangles often end with declining ATR, weak momentum and weak volume.
If this weekly wave count is correct, then cycle wave c downwards should develop strength, ATR should show some increase, and MACD should exhibit an increase in downwards momentum.
Three targets are calculated for cycle wave c. Cycle wave a lasted 4.25 years. Cycle wave b may be over in 3.17 years. Cycle wave c may last a minimum of 2 years and possibly up to 5 years.
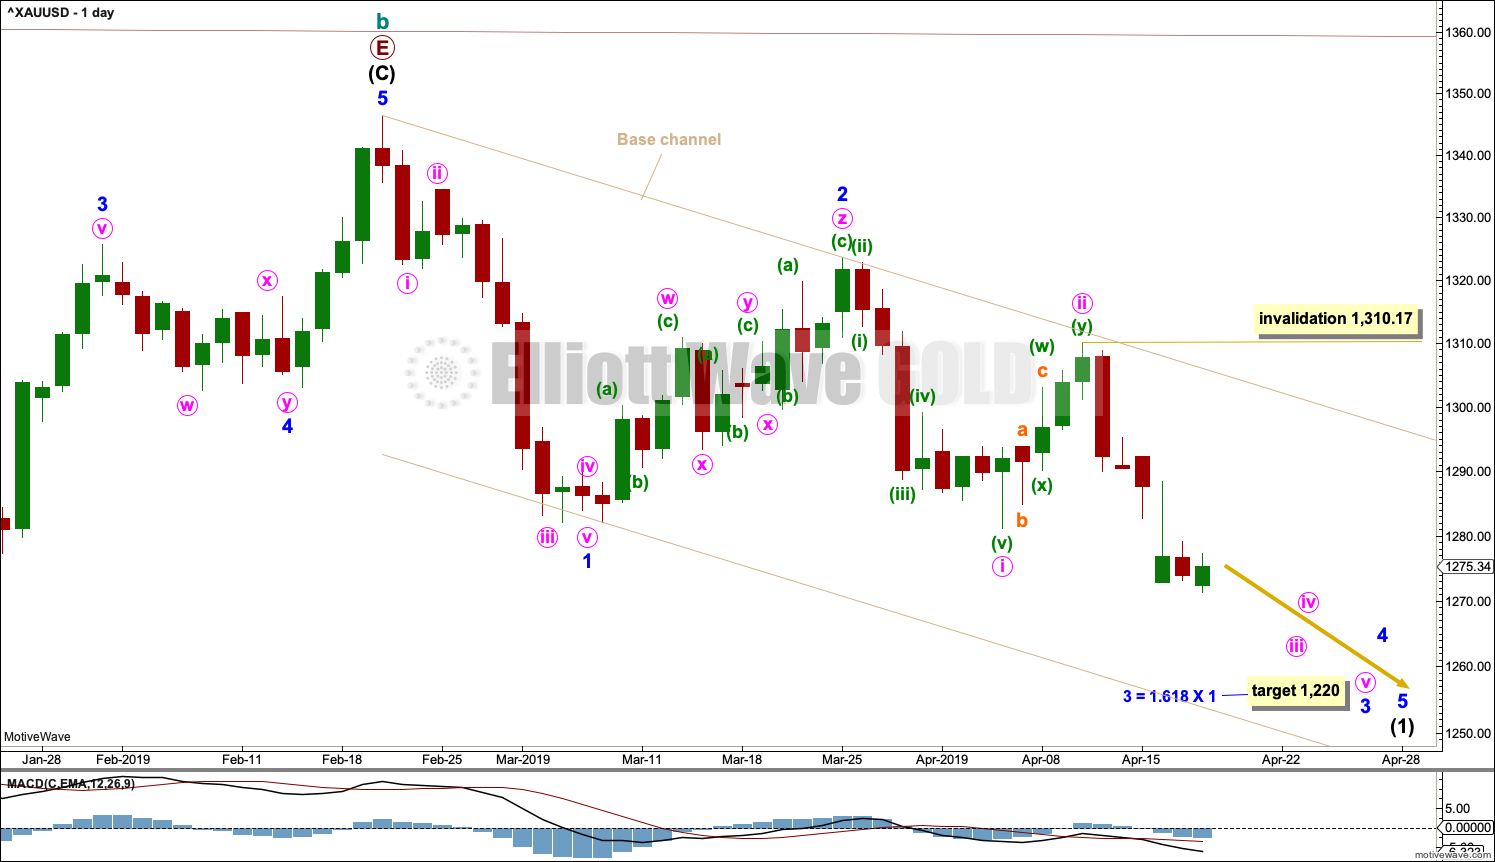
DAILY CHART – TRIANGLE
Click chart to enlarge.
Cycle wave c must subdivide as a five wave structure, either an impulse or an ending diagonal. An impulse is much more common and that shall be how it is labelled unless overlapping suggests a diagonal should be considered.
A new trend at cycle degree should begin with a five wave structure on the daily chart, which will be labelled minor wave 1.
Minor wave 2 is now labelled as a complete triple zigzag.
A base channel is drawn about minor waves 1 and 2. There will be bounces and consolidations on the way down. The last bounce has found resistance at the upper edge of the base channel. Towards its middle or end the power of a third wave may be able to break below support at the lower edge of the base channel. The upper edge of the base channel may be used to calculate a trailing stop for short positions.
Minor wave 3 may only subdivide as an impulse. Within the impulse, minute waves i and ii may now be complete and minute wave iii may only subdivide as an impulse. Within minute wave iii, no second wave correction may move beyond its start above 1,310.17.
Minute wave iii has moved below the end of minute wave i meeting a core Elliott wave rule.
It is possible that minute wave iii and / or minor wave 3 may end with a selling climax; either or both may exhibit a swift and strong fifth wave to end the impulse. This behaviour is typical of commodities, and this tendency is especially prevalent for third wave impulses.
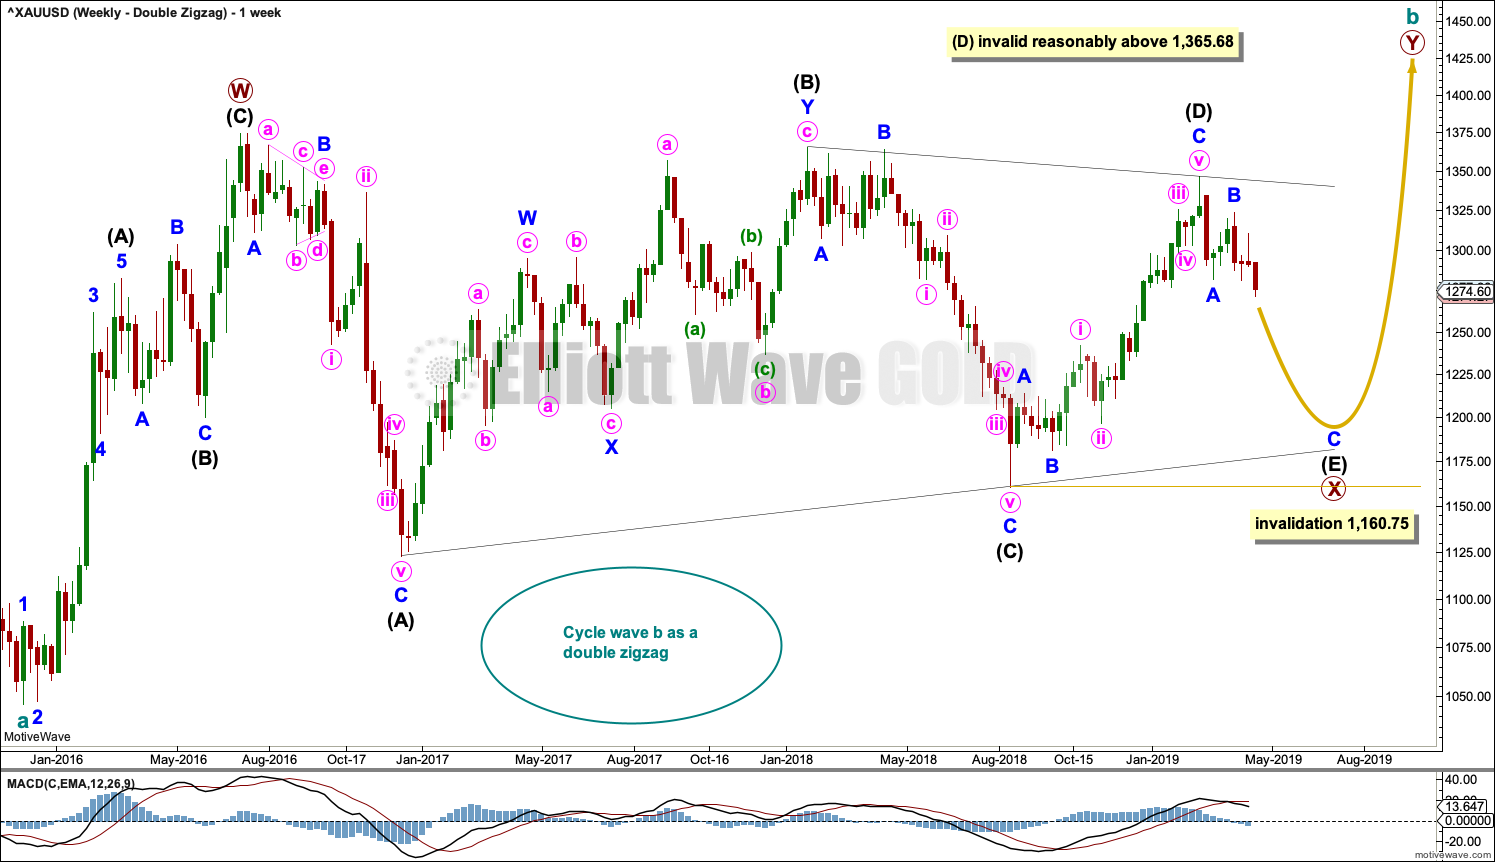
WEEKLY CHART – DOUBLE ZIGZAG
Click chart to enlarge.
It is possible that cycle wave b may be an incomplete double zigzag or a double combination.
The first zigzag in the double is labelled primary wave W. This has a good fit.
The double may be joined by a corrective structure in the opposite direction, a triangle labelled primary wave X. The triangle would be about four fifths complete.
Within multiples, X waves are almost always zigzags and rarely triangles. Within the possible triangle of primary wave X, it is intermediate wave (B) that is a multiple; this is acceptable, but note this is not the most common triangle sub-wave to subdivide as a multiple. These two points reduce the probability of this wave count.
Intermediate wave (D) may be complete. The (B)-(D) trend line is almost perfectly adhered to with the smallest overshoot within intermediate wave (C). This is acceptable.
Intermediate wave (E) should continue to exhibit weakness: ATR should continue to show a steady decline, and MACD may begin to hover about zero.
Intermediate wave (E) may not move beyond the end of intermediate wave (C) below 1,160.75.
This wave count may now expect downwards movement for several weeks.
Primary wave Y would most likely be a zigzag because primary wave X would be shallow; double zigzags normally have relatively shallow X waves.
Primary wave Y may also be a flat correction if cycle wave b is a double combination, but combinations normally have deep X waves. This would be less likely.
This wave count has good proportions and no problems in terms of subdivisions.
Intermediate wave (E) should subdivide as a zigzag labelled minor waves A-B-C. Zigzags subdivide 5-3-5, exactly the same the start of an impulse.
The preferred wave count labels downwards movement minor waves 1-2-3, and this wave count labels downwards movement minor waves A-B-C. At the daily chart level, the subdivisions for both wave counts are seen in the same way.
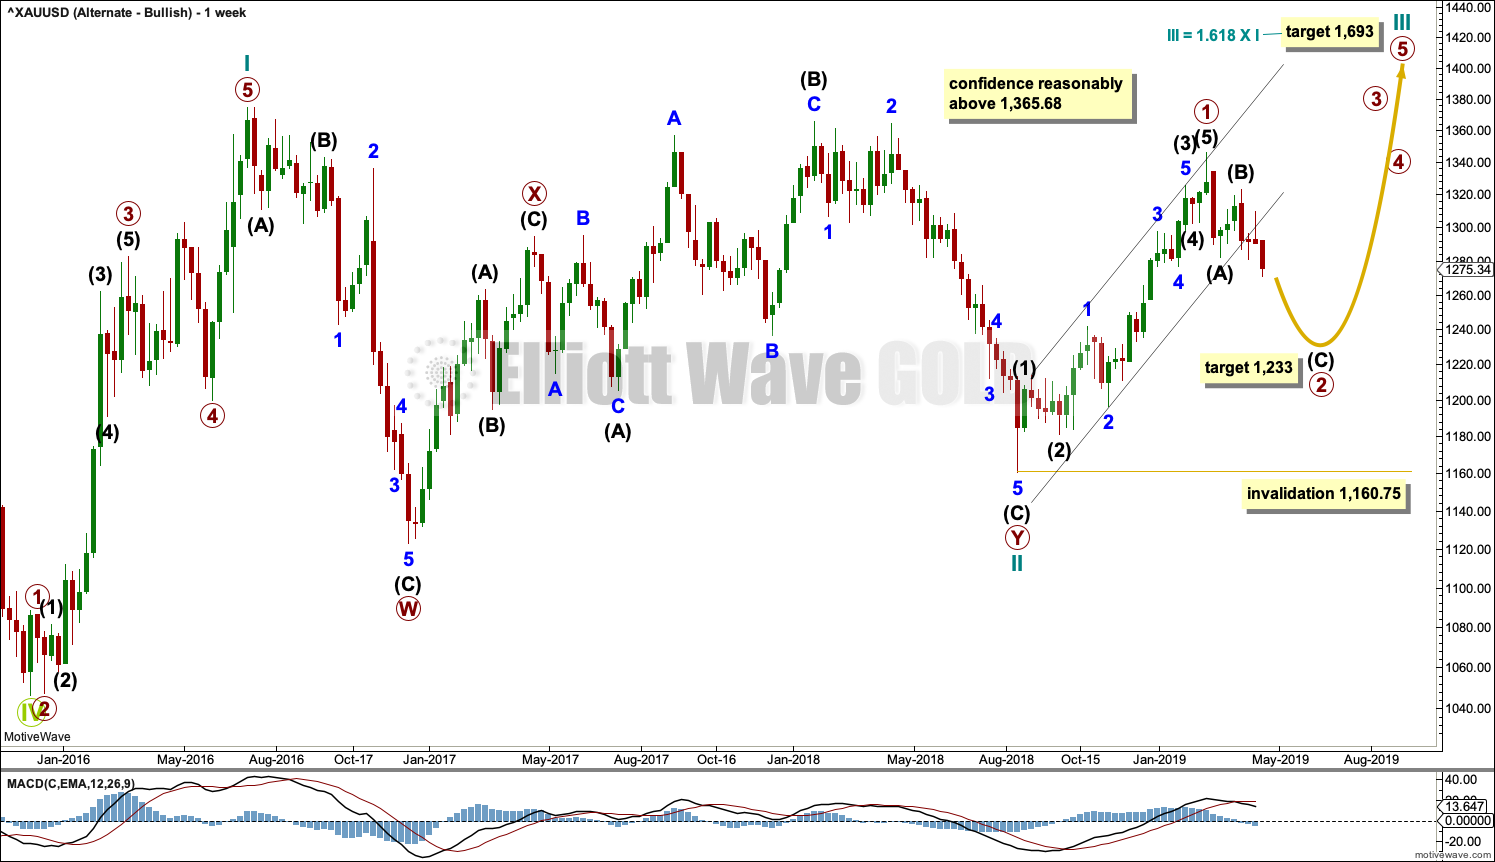
ALTERNATE ELLIOTT WAVE COUNT
WEEKLY CHART
Click chart to enlarge.
If Gold is in a new bull market, then it should begin with a five wave structure upwards on the weekly chart. However, the biggest problem with this wave count is the structure labelled cycle wave I because this wave count must see it as a five wave structure, but it looks more like a three wave structure.
Commodities often exhibit swift strong fifth waves that force the fourth wave corrections coming just prior to be more brief and shallow than their counterpart second waves. It is unusual for a commodity to exhibit a quick second wave and a more time consuming fourth wave, and this is how cycle wave I is labelled. The probability of this wave count is low due to this problem.
Cycle wave II subdivides well as a double combination: zigzag – X – expanded flat.
Cycle wave III may have begun. Within cycle wave III, primary wave 1 may now be complete. The target for primary wave 2 is the 0.618 Fibonacci ratio of primary wave 1. Primary wave 2 may not move beyond the start of primary wave 1 below 1,160.75.
A black channel is drawn about primary wave 1. Primary wave 2 may breach the lower edge of this channel.
Cycle wave III so far for this wave count would have been underway now for 34 weeks. It should be beginning to exhibit some support from volume, increase in upwards momentum and increasing ATR. However, ATR continues to decline and is very low, and momentum is weak in comparison to cycle wave I. This wave count lacks support from classic technical analysis.
TECHNICAL ANALYSIS
WEEKLY CHART
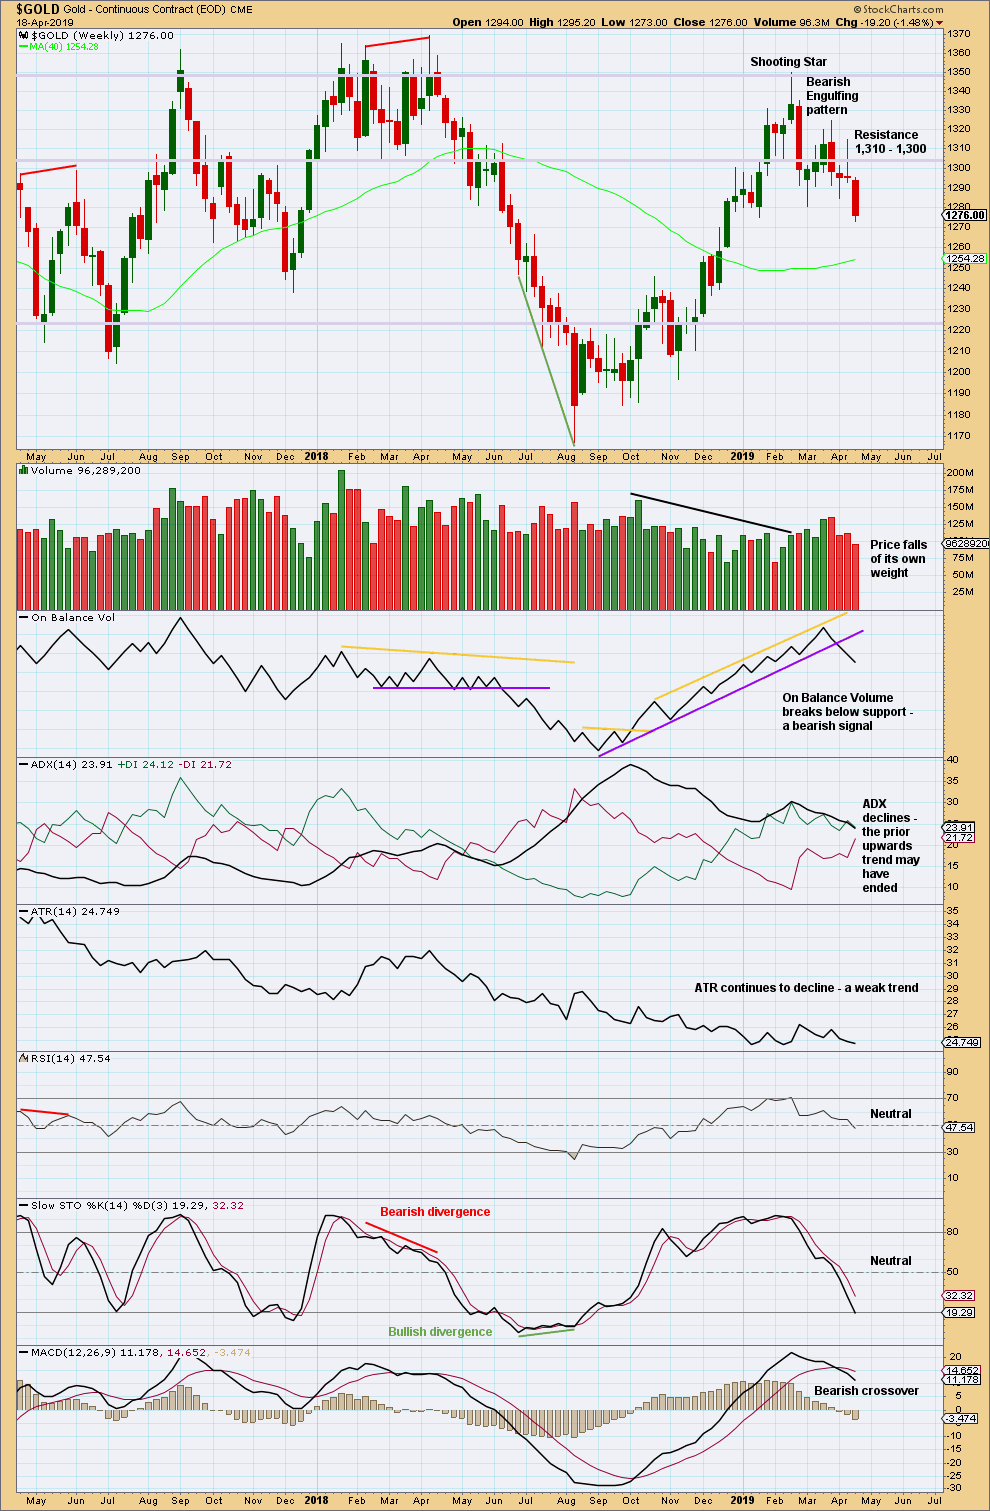
Click chart to enlarge. Chart courtesy of StockCharts.com.
Downwards movement has unfolded as expected this week. With this week a short-trading week, no conclusion may be drawn from lighter volume.
DAILY CHART
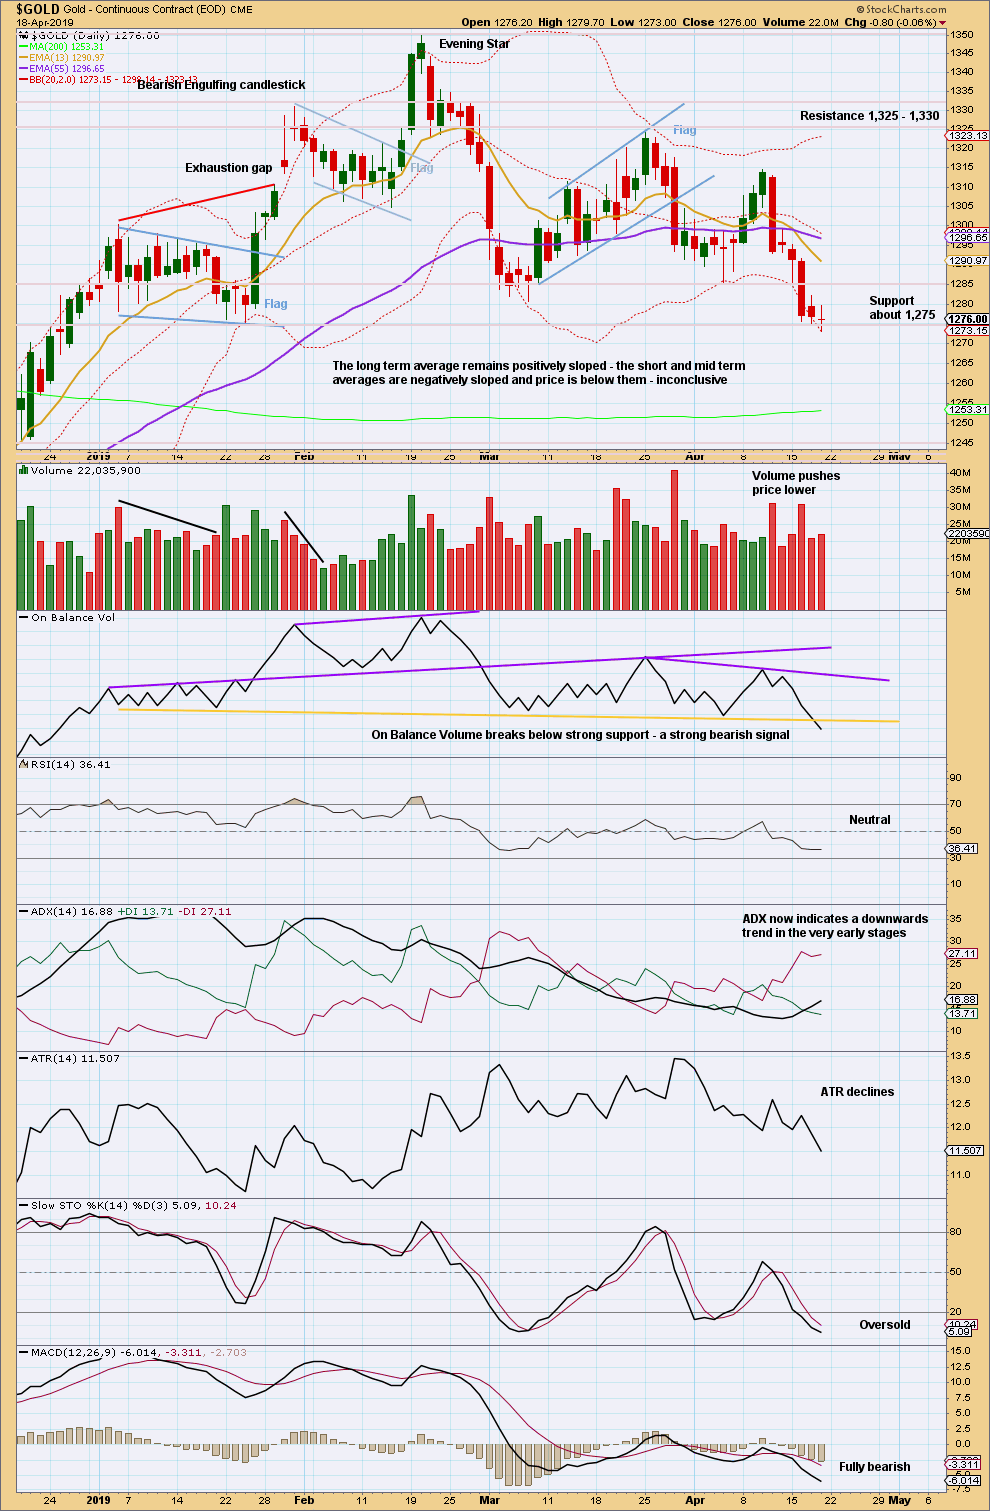
Click chart to enlarge. Chart courtesy of StockCharts.com.
From August 2018 Gold moved higher with a series of higher highs and higher lows. This series remained intact until the 1st of March 2019 when a lower low was made. At that stage, it was possible that Gold had seen a trend change.
There is now a new series of two lower swing highs and two lower swing lows. This supports the idea that there has been a trend change and Gold is in a new downwards trend. ADX now agrees.
The trend line breached by On Balance Volume was long held, tested multiple times, and near horizontal. This trend line holds strong technical significance and a breach of support there is a strong bearish signal. This supports the Elliott wave count.
GDX WEEKLY CHART
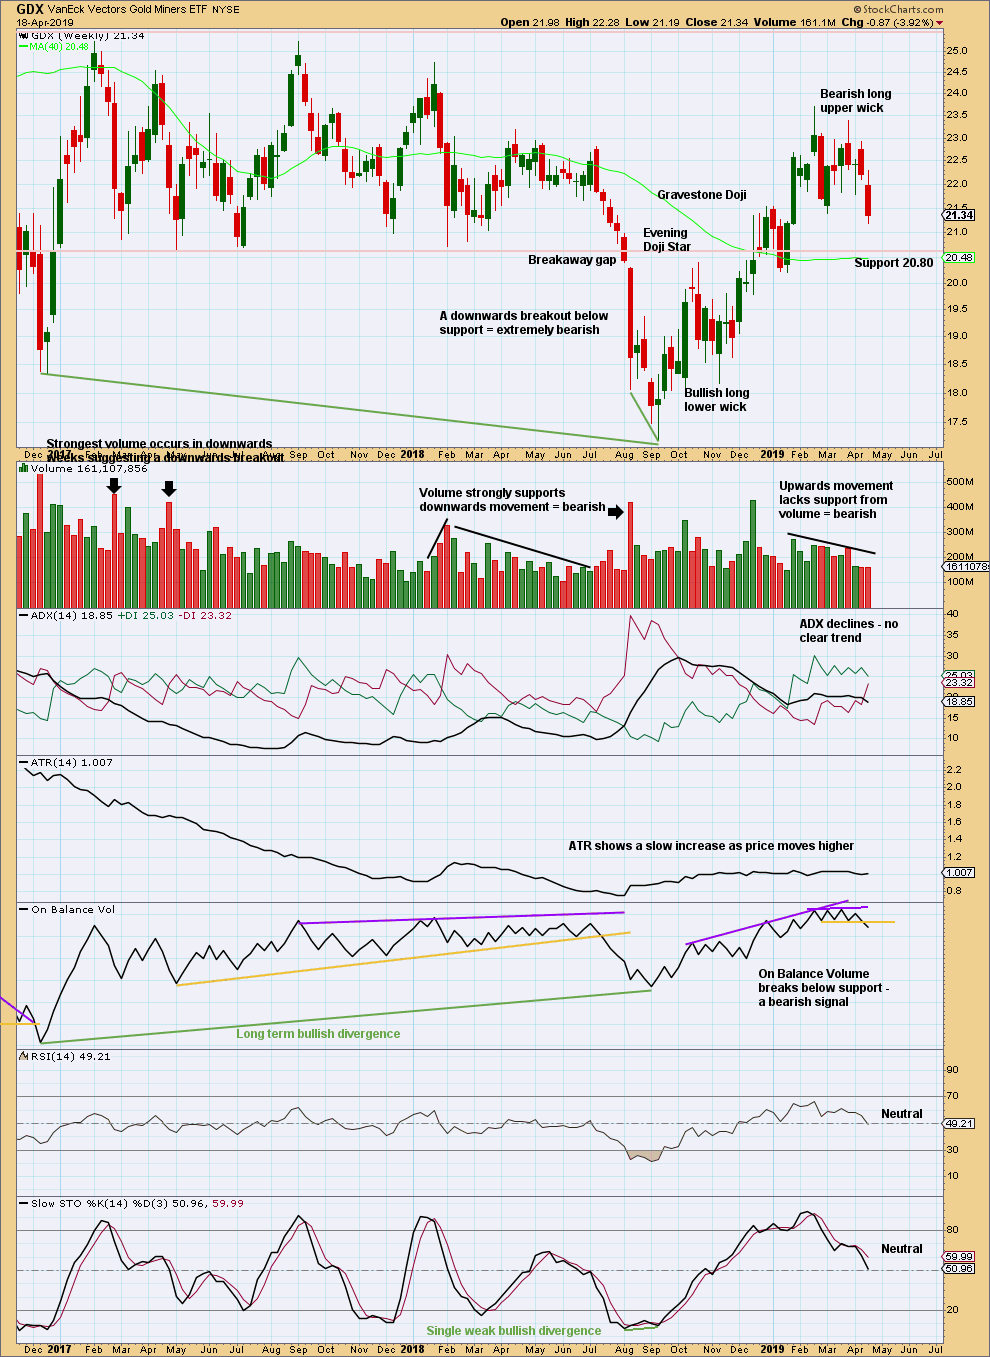
Click chart to enlarge. Chart courtesy of StockCharts.com.
There is now a series of two lower highs and lower lows at the weekly chart level. GDX may have seen a trend change to downwards, but ADX does not yet agree. The bearish signal from On Balance Volume supports this view.
GDX DAILY CHART
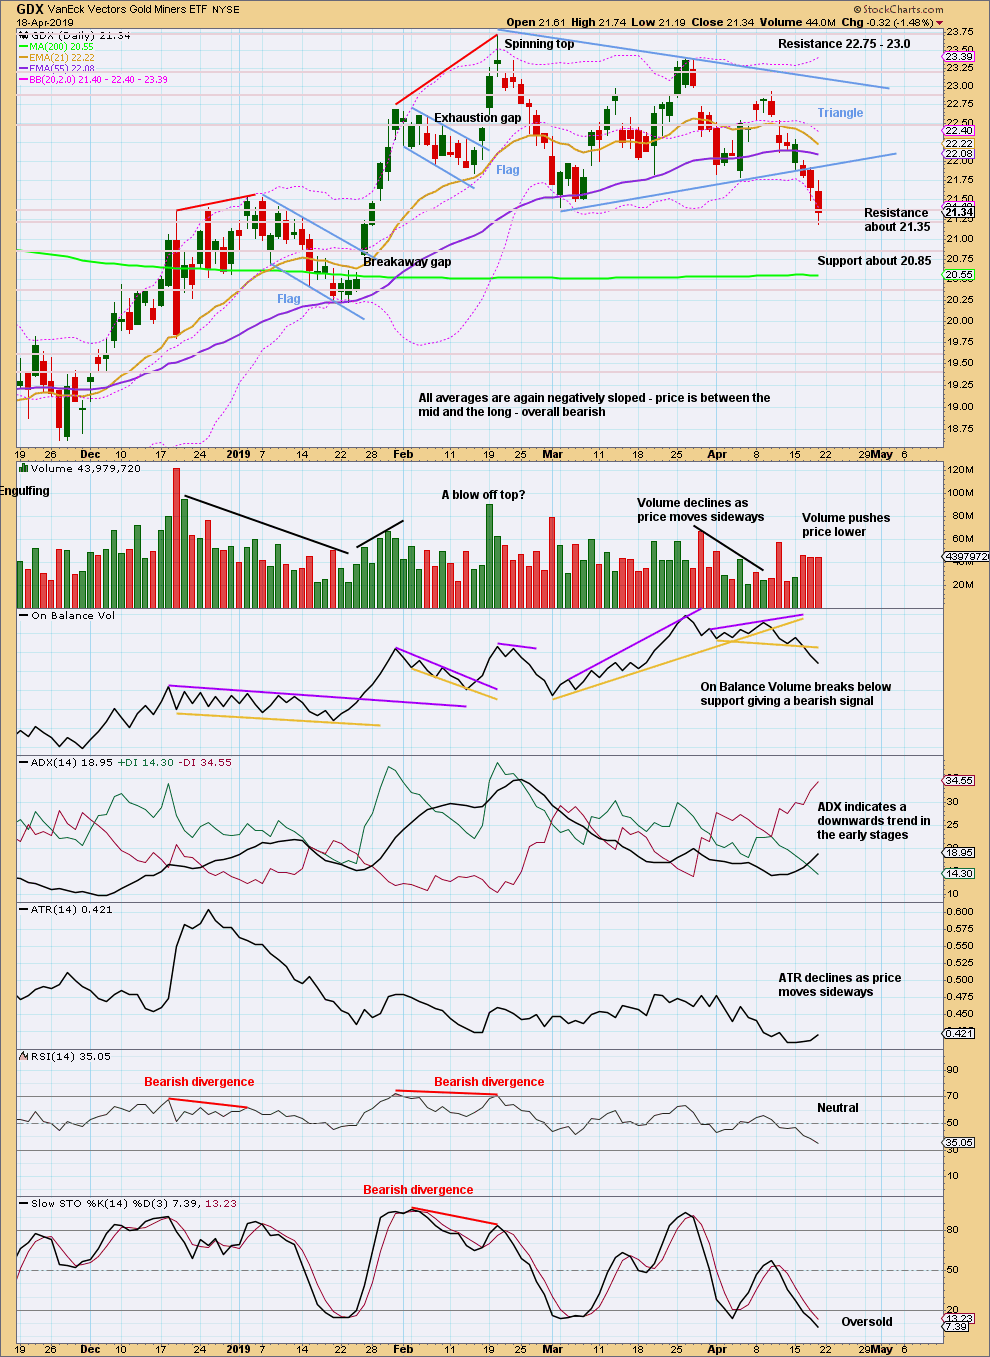
Click chart to enlarge. Chart courtesy of StockCharts.com.
At the daily chart level, the view of an upwards trend may be in doubt with a new swing low on the 1st of March 2019 that moved below the prior swing low of the 14th of February 2019. At that stage, the series of higher highs and higher lows was no longer intact and a trend change was possible.
Since then price has not made another higher high.
Price closed below the lower triangle trend line on a downwards day that has support from volume. Volume is not required for a downwards breakout, but more confidence in the breakout may be had when volume does support downwards movement.
A target calculated from the triangle width is now at 19.58.
US OIL
A very small range week moves price mostly sideways. The Elliott wave count remains the same.
Summary: While price remains within the channel on the daily chart, assume the bounce will continue.
If the channel is breached by a full daily candlestick below and not touching the lower edge, assume the bounce is over and a third wave down has begun.
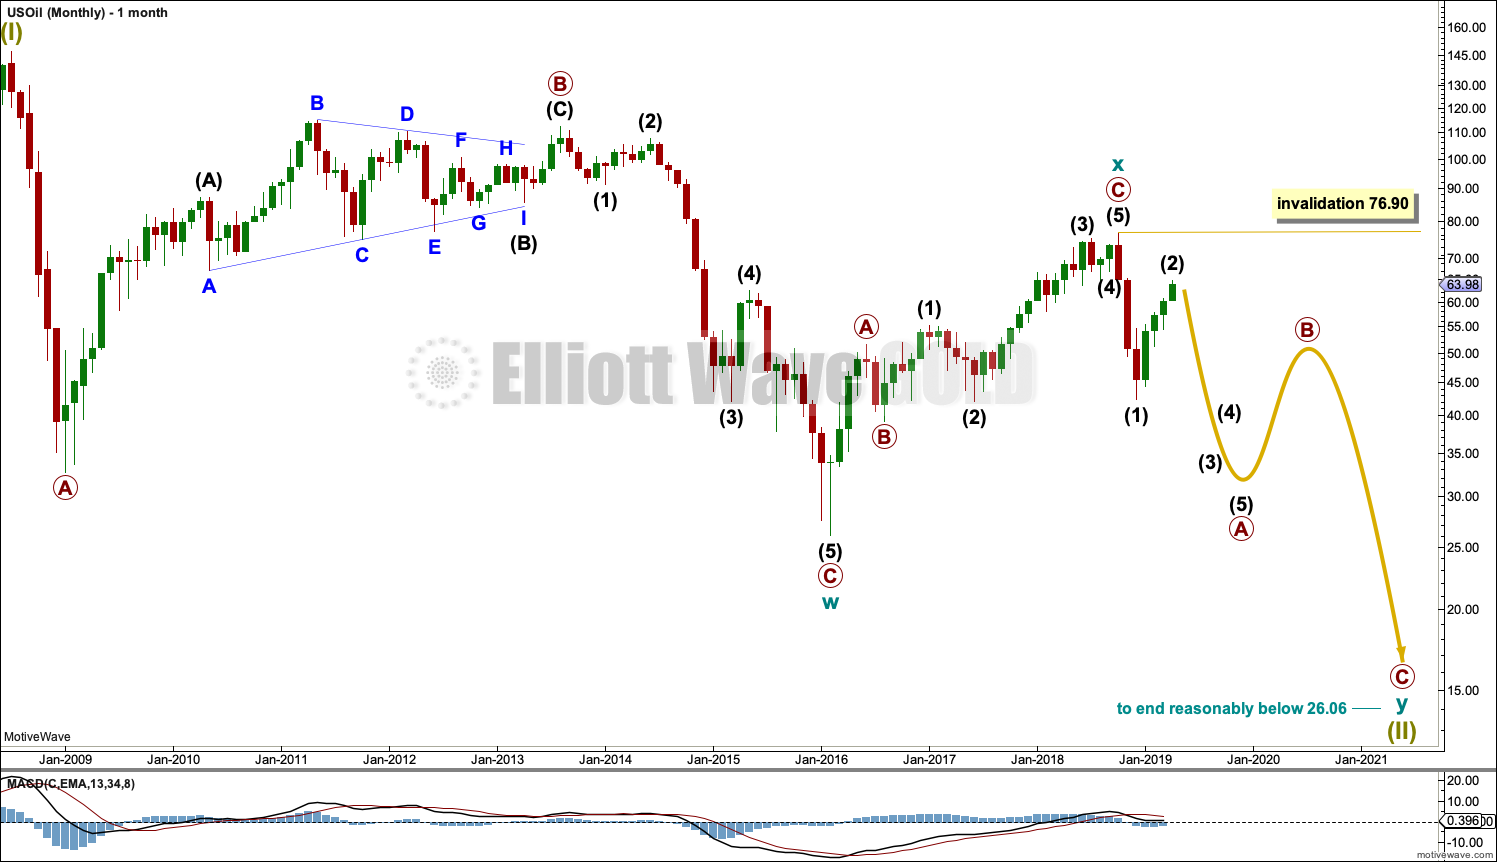
The larger picture still sees Oil in a new downwards trend to end reasonably below 26.06.
MAIN ELLIOTT WAVE COUNT
MONTHLY CHART
Click chart to enlarge.
Classic technical analysis favours a bearish wave count for Oil at this time.
The large fall in price from the high in June 2008 to February 2016 is seen as a complete three wave structure. This large zigzag may have been only the first zigzag in a deeper double zigzag.
Upwards movement from February 2016 to October 2018 will not fit readily as a five wave structure but will fit very well as a three. With a three wave structure upwards, this indicates the bear market may not be over.
The first zigzag down is labelled cycle wave w. The double is joined by a now complete three in the opposite direction, a zigzag labelled cycle wave x.
The purpose of a second zigzag in a double is to deepen the correction when the first zigzag does not move price deep enough. Cycle wave y would be expected to move reasonably below the end of cycle wave w to deepen the correction. Were cycle wave y to reach equality with cycle wave w that takes Oil into negative price territory, which is not possible. Cycle wave y would reach 0.618 the length of cycle wave w at $2.33.
A better target calculation would be using the Fibonacci ratios between primary waves A and C within cycle wave y. This cannot be done until both primary waves A and B are complete.
Within cycle wave y, no second wave correction nor B wave may move beyond its start above 76.90.
WEEKLY CHART
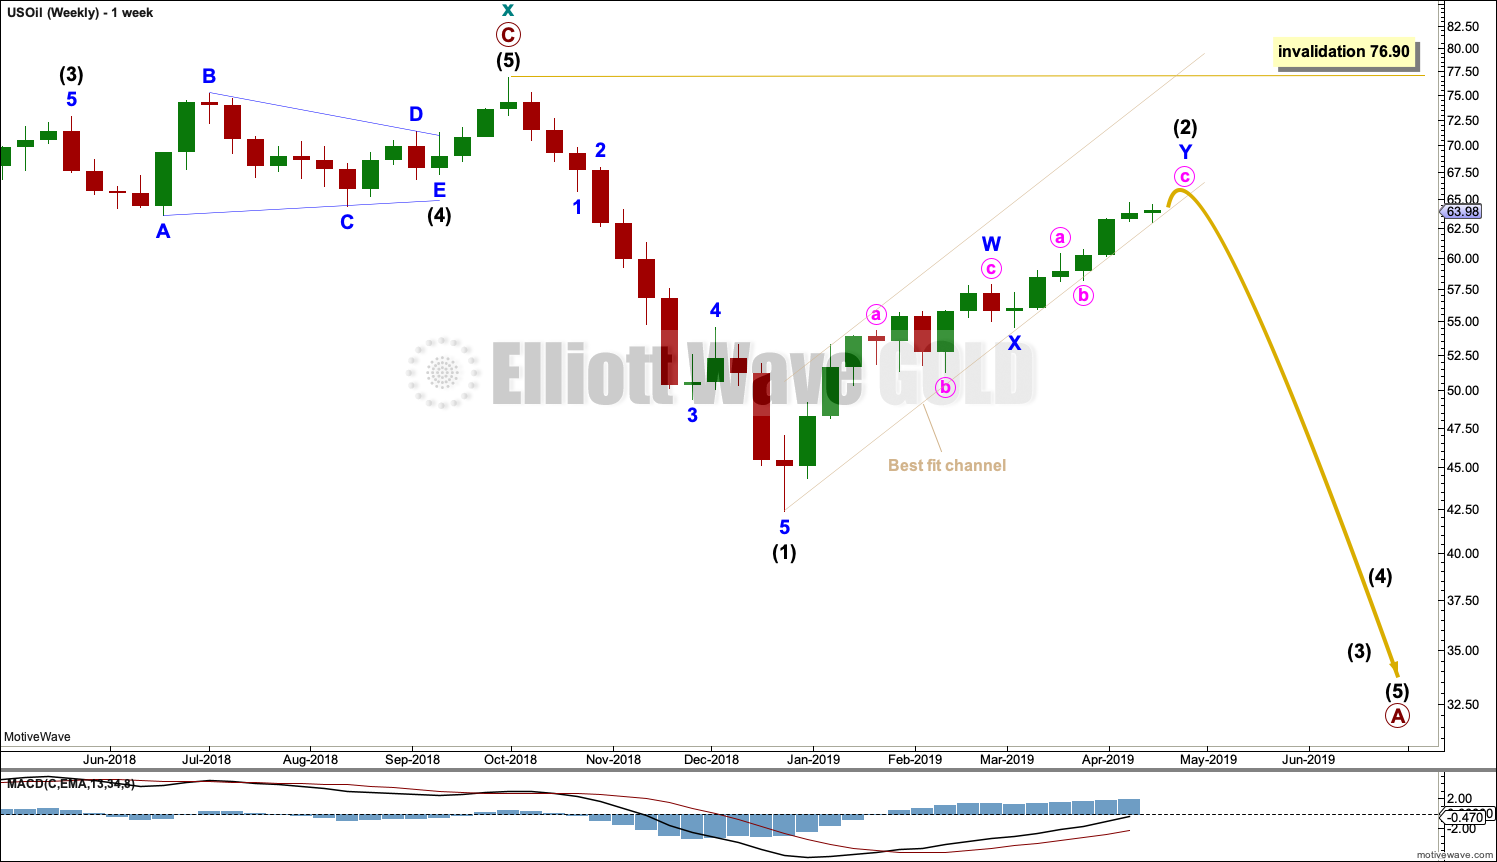
Click chart to enlarge.
This weekly chart is focussed on the start of cycle wave y.
Cycle wave y is expected to subdivide as a zigzag. A zigzag subdivides 5-3-5. Primary wave A must subdivide as a five wave structure if this wave count is correct.
Within primary wave A, intermediate wave (1) may now be complete.
Intermediate wave (2) is a possibly almost complete double zigzag.
Intermediate wave (2) may not move beyond the start of intermediate wave (1) above 76.90.
DAILY CHART
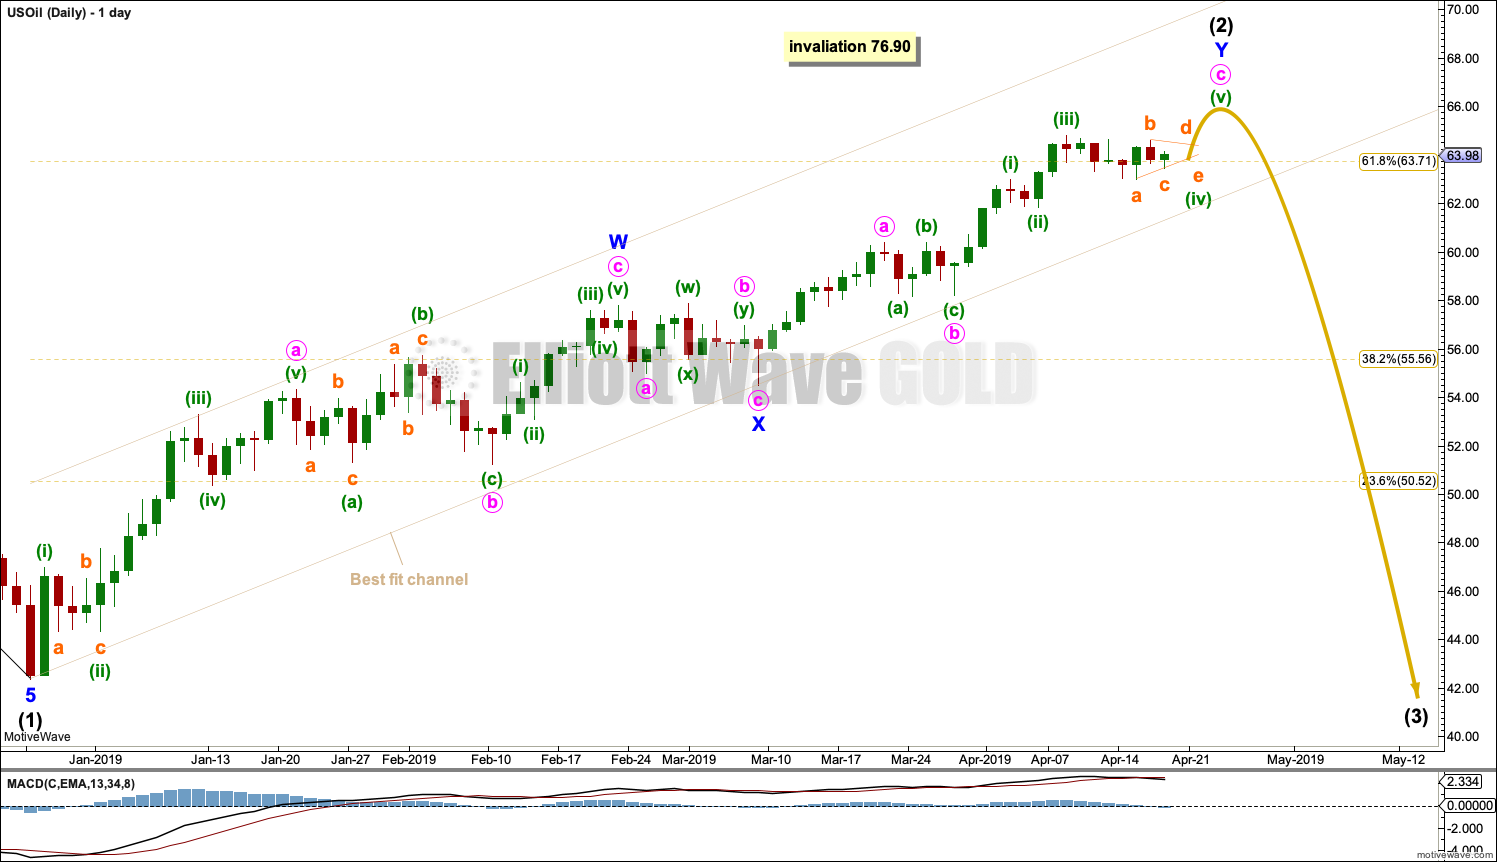
Click chart to enlarge.
Always assume the trend remains the same until proven otherwise.
Intermediate wave (2) may be an incomplete double zigzag. The first zigzag may be complete, labelled minor wave W. The double may be joined by a three in the opposite direction, a zigzag labelled minor wave X.
Minor wave Y still may be incomplete. Within minor wave Y, minute wave c may be an incomplete impulse with minuette wave (iv) an almost complete triangle. A short fifth wave up for minuette wave (v) may be required to complete the structure.
The channel is drawn as a best fit. If this channel is breached by a full candlestick below and not touching it, then that at this stage would indicate a trend change.
Intermediate wave (2) may not move beyond the start of intermediate wave (1) above 76.90.
TECHNICAL ANALYSIS
MONTHLY CHART
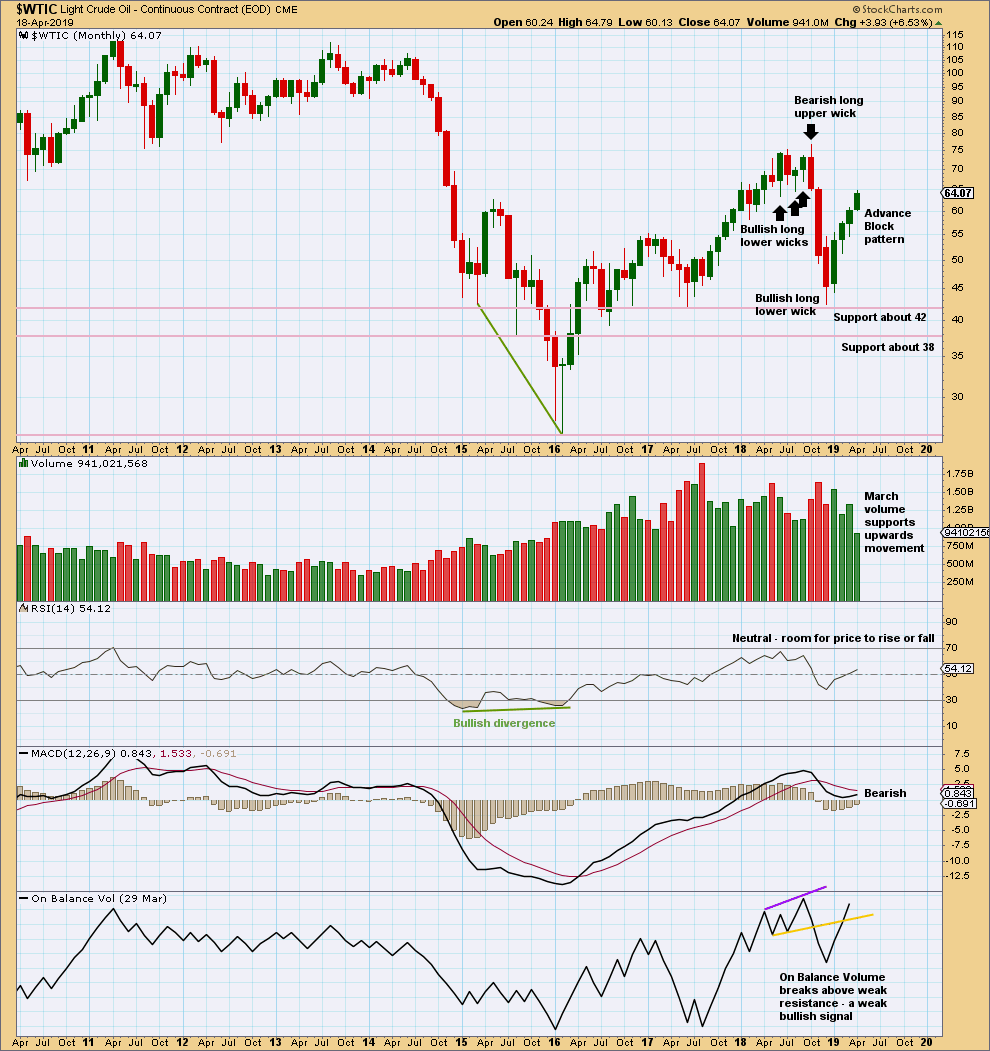
Click chart to enlarge. Chart courtesy of StockCharts.com.
The Advance Block pattern signals developing weakness. But the long lower wicks of the last two complete monthly candlesticks and some support from volume for March suggest more upwards movement for April.
This upwards bounce may be tiring.
WEEKLY CHART
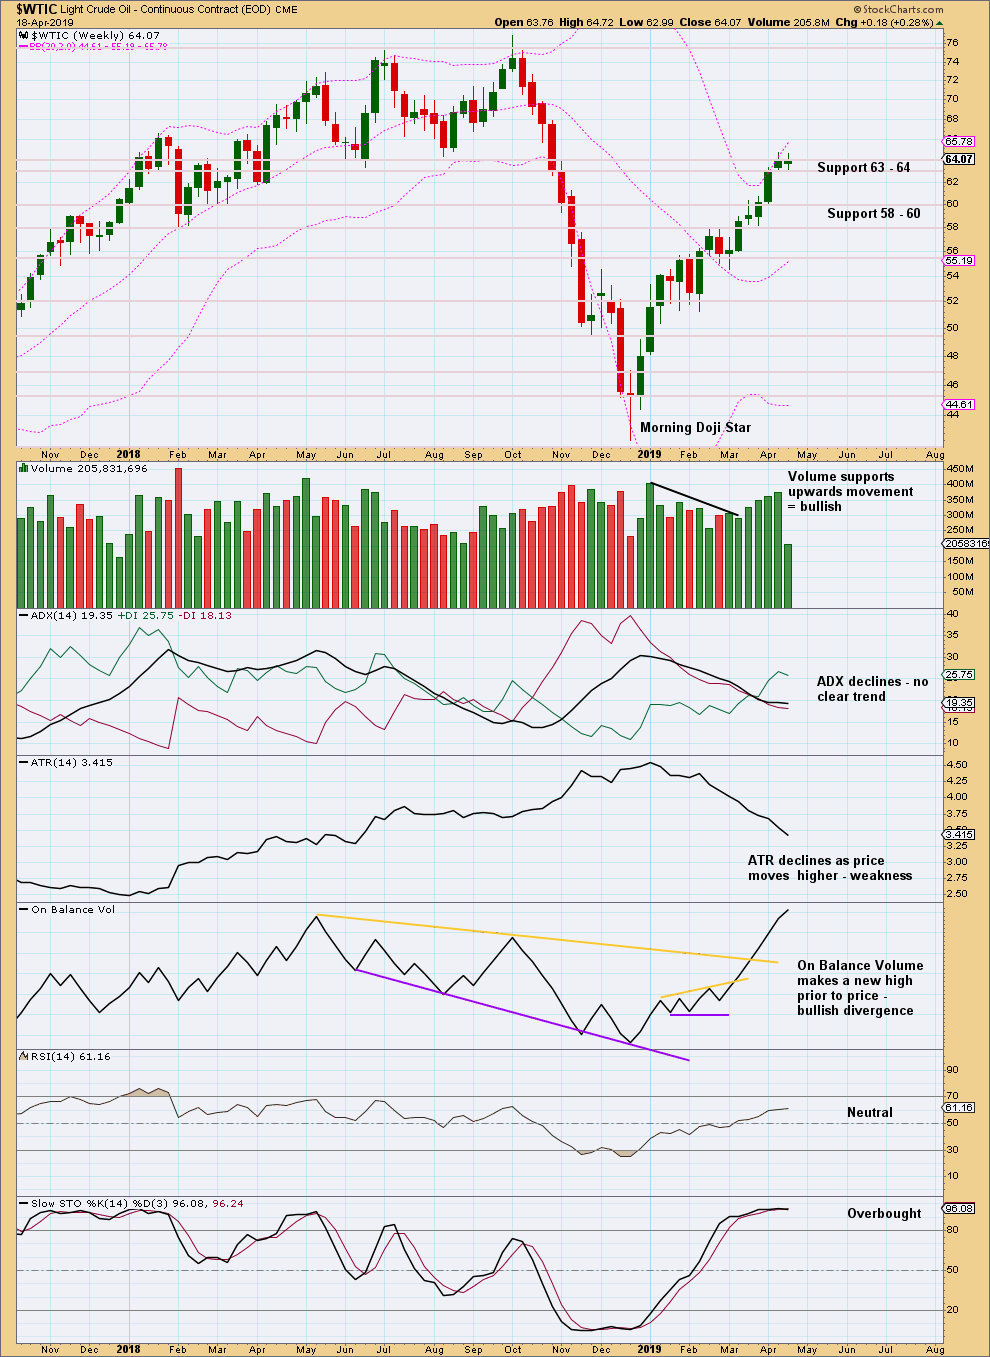
Click chart to enlarge. Chart courtesy of StockCharts.com.
This week was a short week, so no conclusion may be drawn from lighter volume.
This week my view of an Advance Block pattern on the weekly chart is changed. The first two candlesticks in an Advance Block pattern should be have about equal length real bodies and in this example the second candlestick is longer.
DAILY CHART
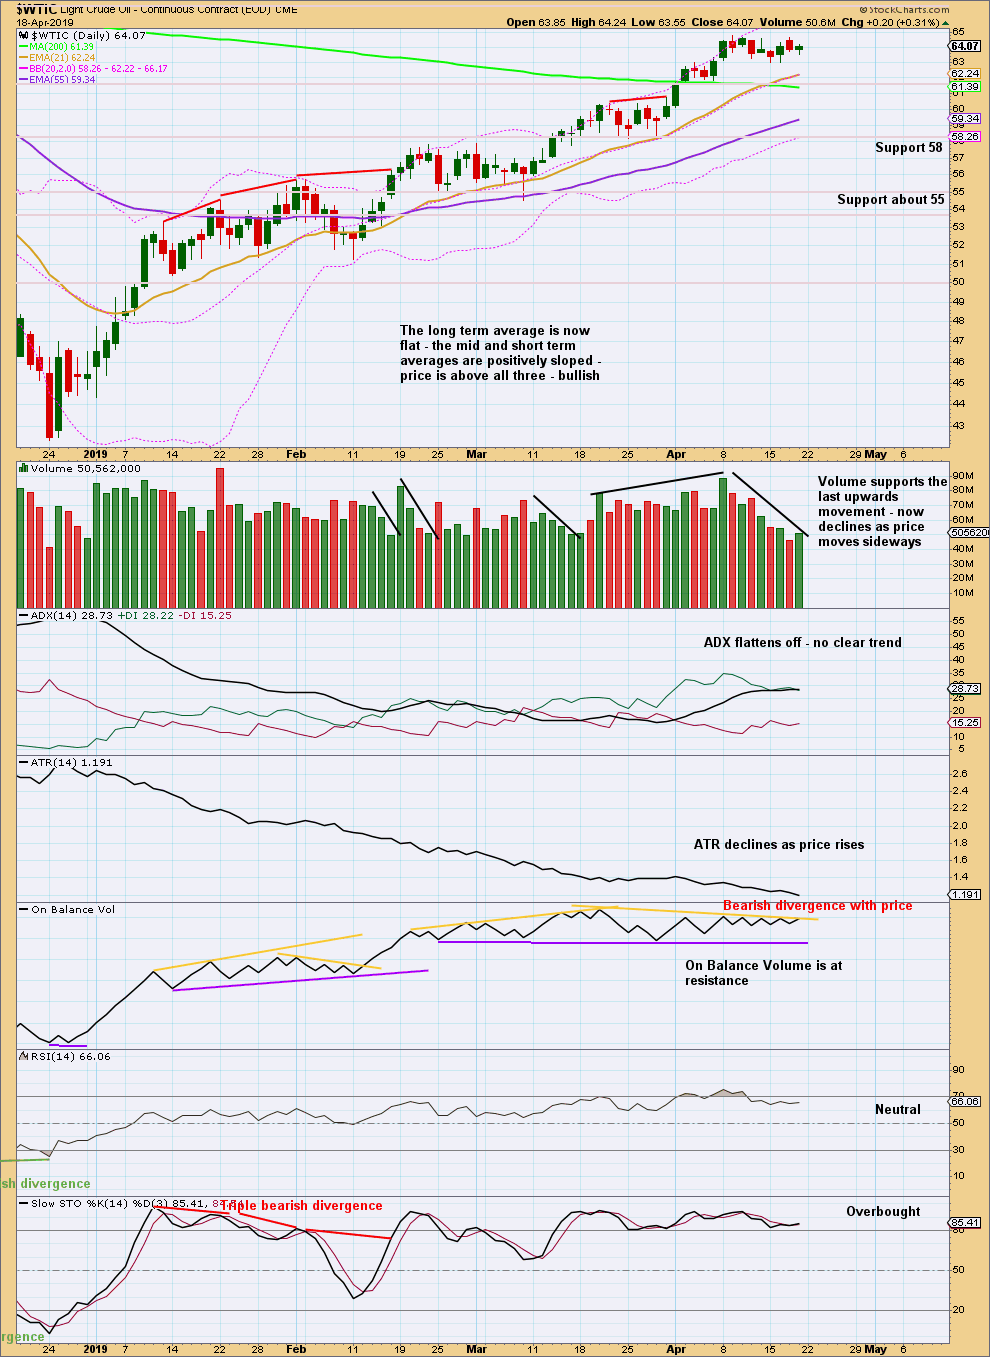
Click chart to enlarge. Chart courtesy of StockCharts.com.
Since the 24th of December 2018 there has been a series of higher highs and higher lows, the basic definition of an upwards trend. Assume this will continue until proven it has ended. A lower low below the low of the 28th of March 2019 would provide evidence the bounce is over.
Stochastics may continue to remain overbought and may exhibit further divergence before the bounce ends.
While On Balance Volume has made a new high at the weekly chart level, for the shorter term at the daily chart level there is now some evidence of weakness as it does not confirm last highs.
Overall, this chart remains mostly bullish, but the upwards bounce does look somewhat weak.
—
Always practice good risk management as the most important aspect of trading. Always trade with stops and invest only 1-5% of equity on any one trade. Failure to manage risk is the most common mistake new traders make.
Hi Lara, Any thoughts on Gold’s potential Cup & Handle formation?
Hi Lara, has oil breached the channel on your charts? It defo has on mine, but I know the data on tradingview.com is different from the data you have.
Cheers,
Jiten
Not yet. Price is right at the lower edge of my channel.
I’ve added the price points here to show you how I’m drawing it. I’ve chosen these anchor points because it gives a channel which contains all the upwards movement, so it’s more conservative.
It does look like a high may now be in for Oil, but I’d rather wait for a breach of the channel before I have confidence in that idea.
Thanks Lara for the updates and answers- they really help!
You’re most welcome. I’m here to help.
Hi Lara,
Oil made a pretty big move over the last two days . There was discussion of a price ceiling of $66 last week to maintain the current wave count. Does that still apply with price moving above $66 today?
Tia,
Jiten
It means that how I had intermediate (2) was wrong.
I’ve taken a blank chart for intermediate (2) and now have a new idea, a simpler single zigzag.
The limit for this idea is the invalidation point. A target for minor C to = 1.618 X minor A would be at 70.58.
The bottom line for Oil is that while price remains within the channel, assume upwards movement will continue.
This correction is proving very difficult to find the end. Volume supported yesterday’s upwards movement quite strongly. On Balance Volume has broken the resistance line giving a bullish signal.
There is now bearish divergence between price and RSI with RSI previously overbought. Sometimes divergence can simply disappear, but not always. With the data in hand today it is indicating weakness and this divergence with RSI can signal the end is quite close now.
There may be a complex Head and Shoulders pattern on the daily chart for Gold.
The neck line has been breached. A small bounce may now back test resistance there. Look for a little bounce tomorrow to maybe end about that line.
A target is calculated at 1,217 which is very close to the Elliott wave target at 1,220.
Thank you so much Lara. The same pattern is observed on GDX. It has broken down below the neckline and has some strength to the downward movement evidenced yesterday while Gold was still positive. My 150% position in DUST has been handsomely profitable with a long way to go yet. I am singing my happy morning song today despite my diverticulitis! Thanks for all the insight.
Rodney: I didn’t note that one on GDX because the neck line has a strong slope there. I’m leaving GDX with the triangle, which gives a pretty similar target and breakout anyway.
Hi Lara, is this now invalidated as price has moved below the start of minuette (i)?
Tia,
Jiten
No. Price is moving in the direction that a downwards breakout following a Head and Shoulders pattern expects. So no, the pattern is not invalidated. Price is doing exactly as predicted from it.
Sorry, by invalidated, I was referring to the price making a bounce upto the head and shoulder neck line (~ 1286). I was thinking that since price has gone below the end of minuette (i) then there’s a higher probability that minuette (ii) has ended and it would be unlikely that price would go up again to hit support at ~1286.
It looks like yesterday completed a bounce to test resistance at the neckline.
I’d now expect to see price move down and away with increasing downward momentum.