

S&P 500
Upwards movement continues as expected.
A new Elliott wave count at the monthly chart level is presented.
Summary: The upwards trend remains intact and there is underlying strength in this market still. The next mid-term target is at 3,010. However, some near-term caution may be warranted due to strong resistance and now a cluster of bearish signals from VIX.
The final target remains the same at 3,045. Alternate monthly wave counts allow for a target as high as 4,119.
The biggest picture, Grand Super Cycle analysis, is here.
Monthly charts are again reviewed this week, and a new idea is presented. Two alternate monthly charts remain here. Video is here.
ELLIOTT WAVE COUNTS
The two Elliott wave counts below will be labelled First and Second rather than main and alternate as they may be about of even probability. When the current impulse of primary wave 5 (second wave count) or cycle wave V (first wave count) may be complete, then these two wave counts will diverge on the severity of the expected following bear market.
FIRST WAVE COUNT
MONTHLY CHART
Click chart to enlarge.
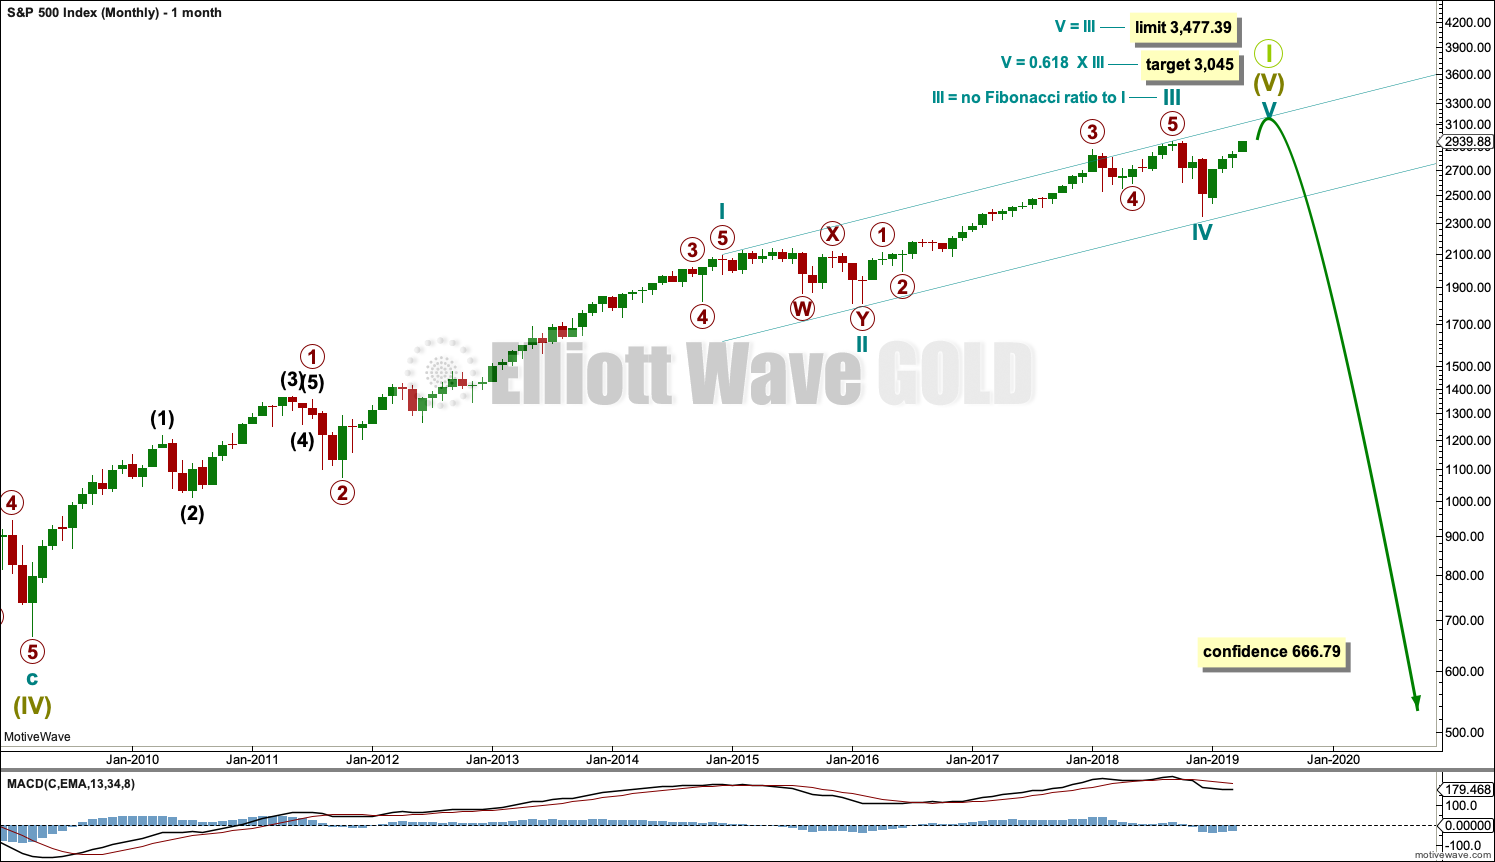
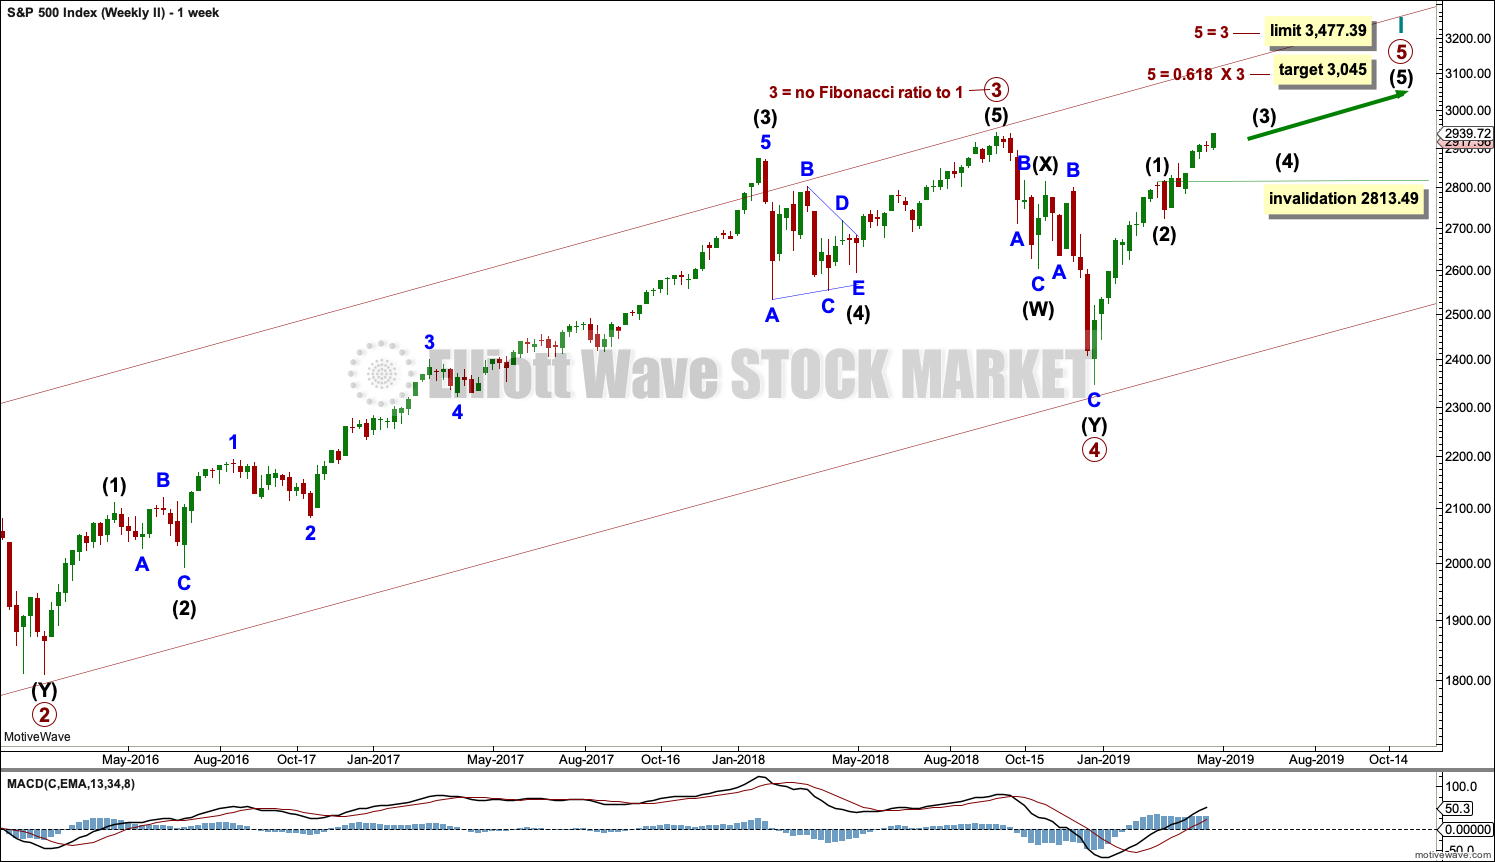
Super Cycle wave (IV) completed a 8.5 year correction. Thereafter, a bull market began for Super Cycle wave (V). The structure of Super Cycle wave (V) is incomplete. It is subdividing as an impulse.
There is no Fibonacci ratio between cycle waves I and III within Super Cycle wave (V). Cycle wave V will be limited to no longer than equality with cycle wave III, so that cycle wave III is not the shortest actionary wave.
A channel is drawn about the impulse of Super Cycle wave (V) using Elliott’s first technique. Cycle wave IV found support about the lower edge.
There is perfect alternation between a shallow time consuming combination for cycle wave II and now a deeper and more brief double zigzag for cycle wave IV. The speed and depth of cycle wave IV makes these two corrections look like they should be labelled the same degree. This wave count has the right look.
The middle of the third wave overshoots the upper edge of the Elliott channel drawn about this impulse. All remaining movement is contained within the channel. This has a typical look.
Within cycle wave V, no second wave correction may move beyond the start of its first wave below 2,346.58.
This wave count expects MACD to begin to exhibit divergence with price as price makes new highs. Cycle wave III may exhibit strongest momentum and cycle wave V may exhibit some weakness. If price makes new highs but MACD does not, then this would remain the main wave count.
Within Super Cycle wave (V), cycle wave III may not be the shortest actionary wave. Because cycle wave III is shorter than cycle wave I, this limits cycle wave V to no longer than equality in length with cycle wave III at 3,477.39. A target is calculated for cycle wave V to end prior to this point.
This wave count agrees with MACD. Cycle wave III exhibits strongest momentum, and primary wave 3 within cycle wave III exhibits the strongest histogram within MACD.
This wave count expects that when cycle wave V completes Super Cycle wave (V) and Grand Super Cycle wave I, that a huge bear market to potentially last decades may begin. It should move substantially below 666.79.
WEEKLY CHART
Click chart to enlarge.
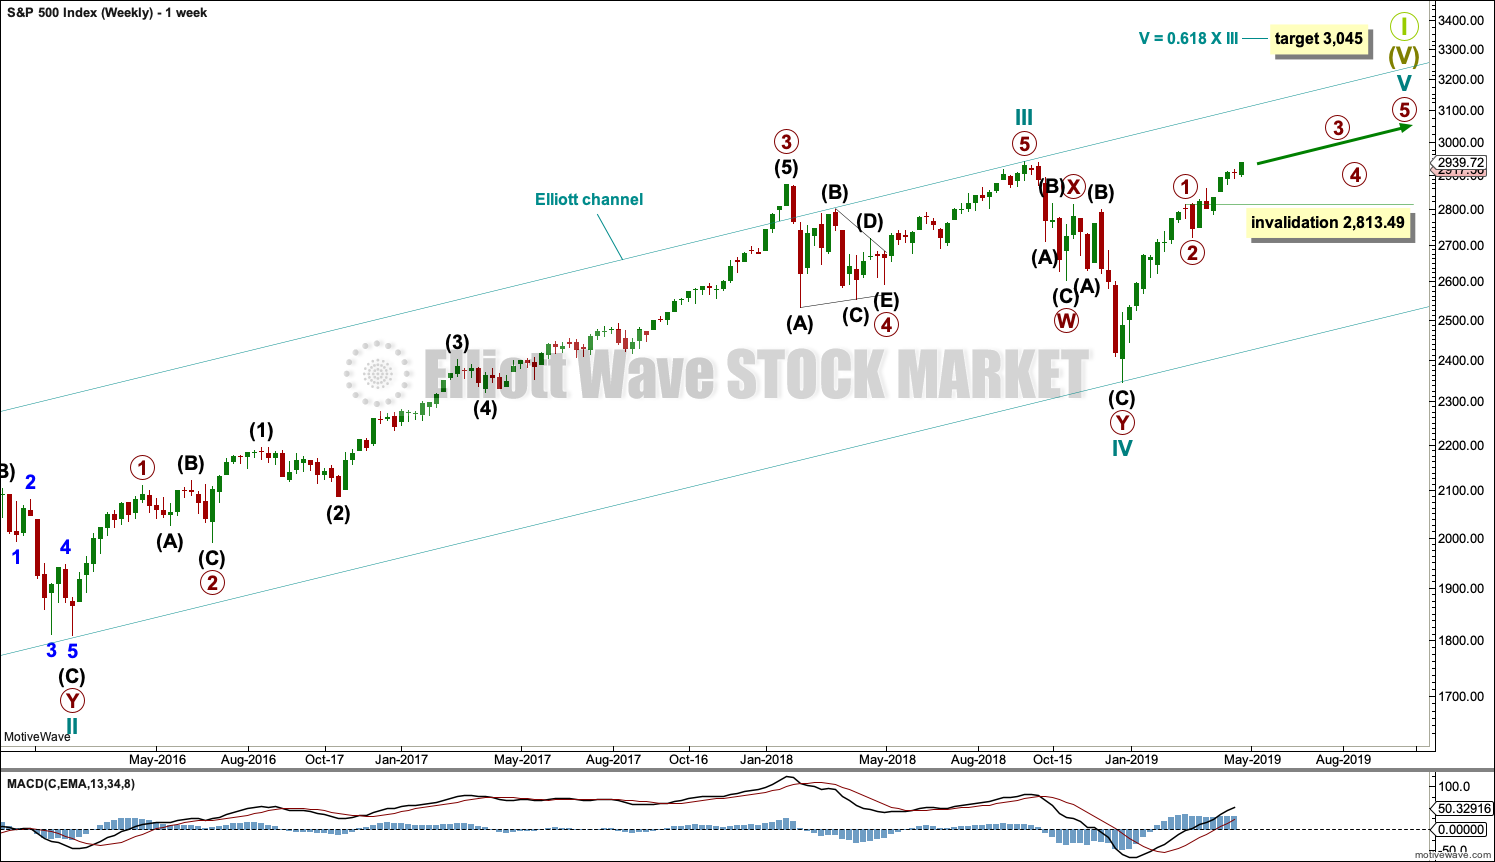
This weekly chart shows all of cycle waves III, IV and V so far.
Cycle wave II fits as a time consuming double combination: flat – X – zigzag. Combinations tend to be more time consuming corrective structures than zigzags. Cycle wave IV has completed as a multiple zigzag that should be expected to be more brief than cycle wave II.
Cycle wave IV may have ended at the lower edge of the Elliott channel.
Within cycle wave V, primary waves 1 and 2 may now be complete. Primary wave 3 has moved above the end of primary wave 1. When it arrives, primary wave 4 may not move into primary wave 1 price territory below 2,813.49.
Although both cycle waves II and IV are labelled W-X-Y, they are different corrective structures. There are two broad groups of Elliott wave corrective structures: the zigzag family, which are sharp corrections, and all the rest, which are sideways corrections. Multiple zigzags belong to the zigzag family and combinations belong to the sideways family. There is perfect alternation between the possible double zigzag of cycle wave IV and the combination of cycle wave II.
Although there is gross disproportion between the duration of cycle waves II and IV, the size of cycle wave IV in terms of price makes these two corrections look like they should be labelled at the same degree. Proportion is a function of either or both of price and time.
Draw the Elliott channel about Super Cycle wave (V) with the first trend line from the end of cycle wave I (at 2,079.46 on the week beginning 30th November 2014) to the high of cycle wave III, then place a parallel copy on the low of cycle wave II. Cycle wave V may find resistance about the upper edge.
It is possible that cycle wave V may end in October 2019. If it does not end there, or if the AD line makes new all time highs during or after June 2019, then the expectation for cycle wave V to end would be pushed out to March 2020 as the next possibility. Thereafter, the next possibility may be October 2020. March and October are considered as likely months for a bull market to end as in the past they have been popular. That does not mean though that this bull market may not end during any other month.
DAILY CHART
Click chart to enlarge.
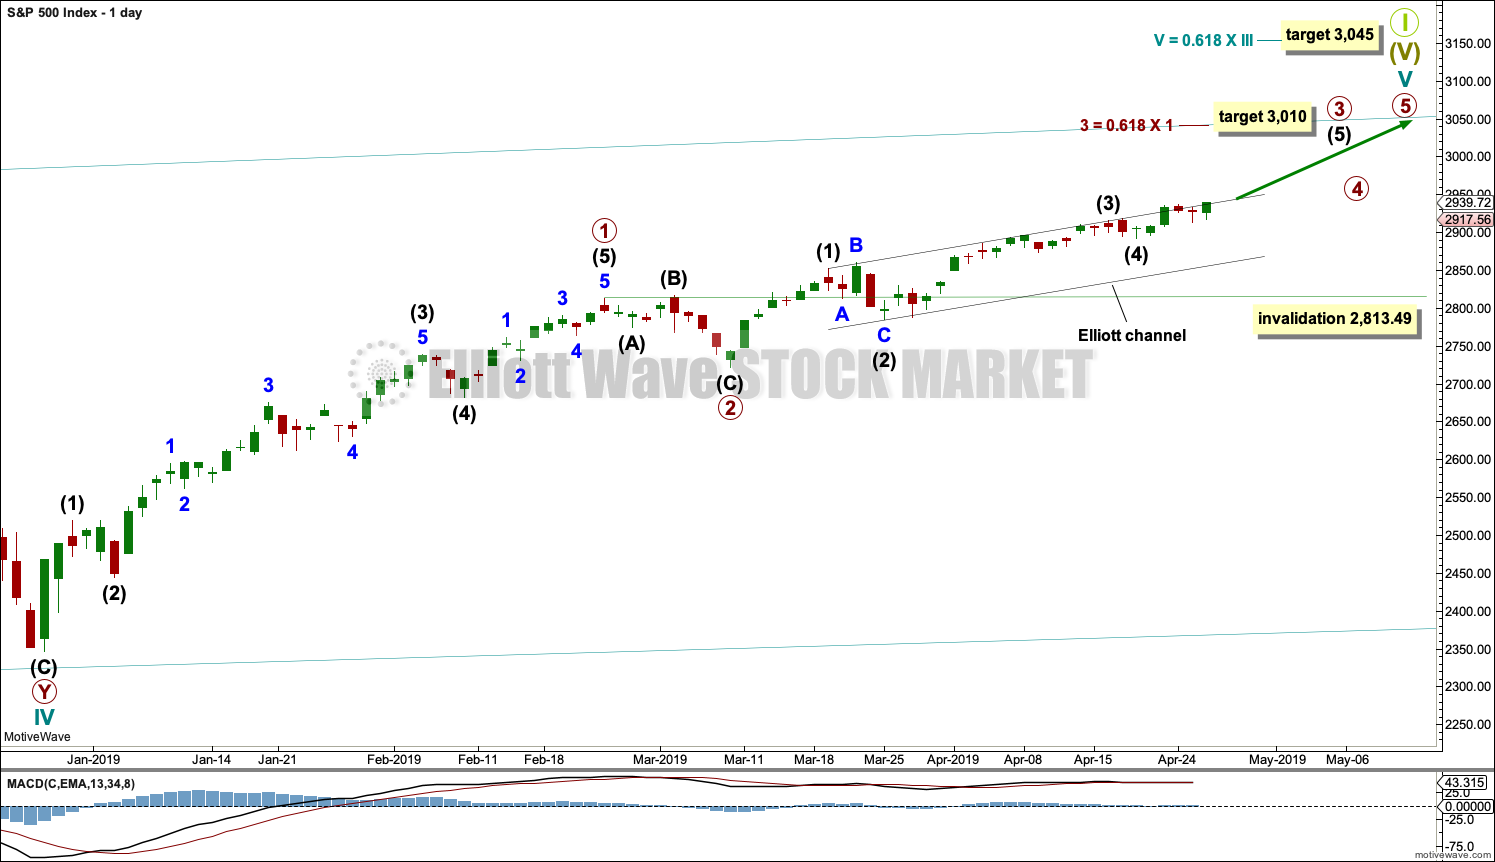
The daily chart will focus on the structure of cycle wave V.
Cycle wave V must subdivide as a five wave motive structure, either an impulse or an ending diagonal. An impulse is much more common and that will be how it is labelled. A diagonal would be considered if overlapping suggests it.
Primary wave 1 may have been a long extension, a smaller fractal of cycle wave I on the monthly chart.
Primary wave 2 may have been a very brief and shallow expanded flat correction.
Within primary wave 3, intermediate waves (1) through to (4) may be complete. Intermediate wave (5) to end primary wave 3 may end soon or may yet continue to extend. When it is complete, then primary wave 3 may be complete.
Primary wave 4 may not move into primary wave 1 price territory below 2,813.49.
SECOND WAVE COUNT
MONTHLY CHART
Click chart to enlarge.
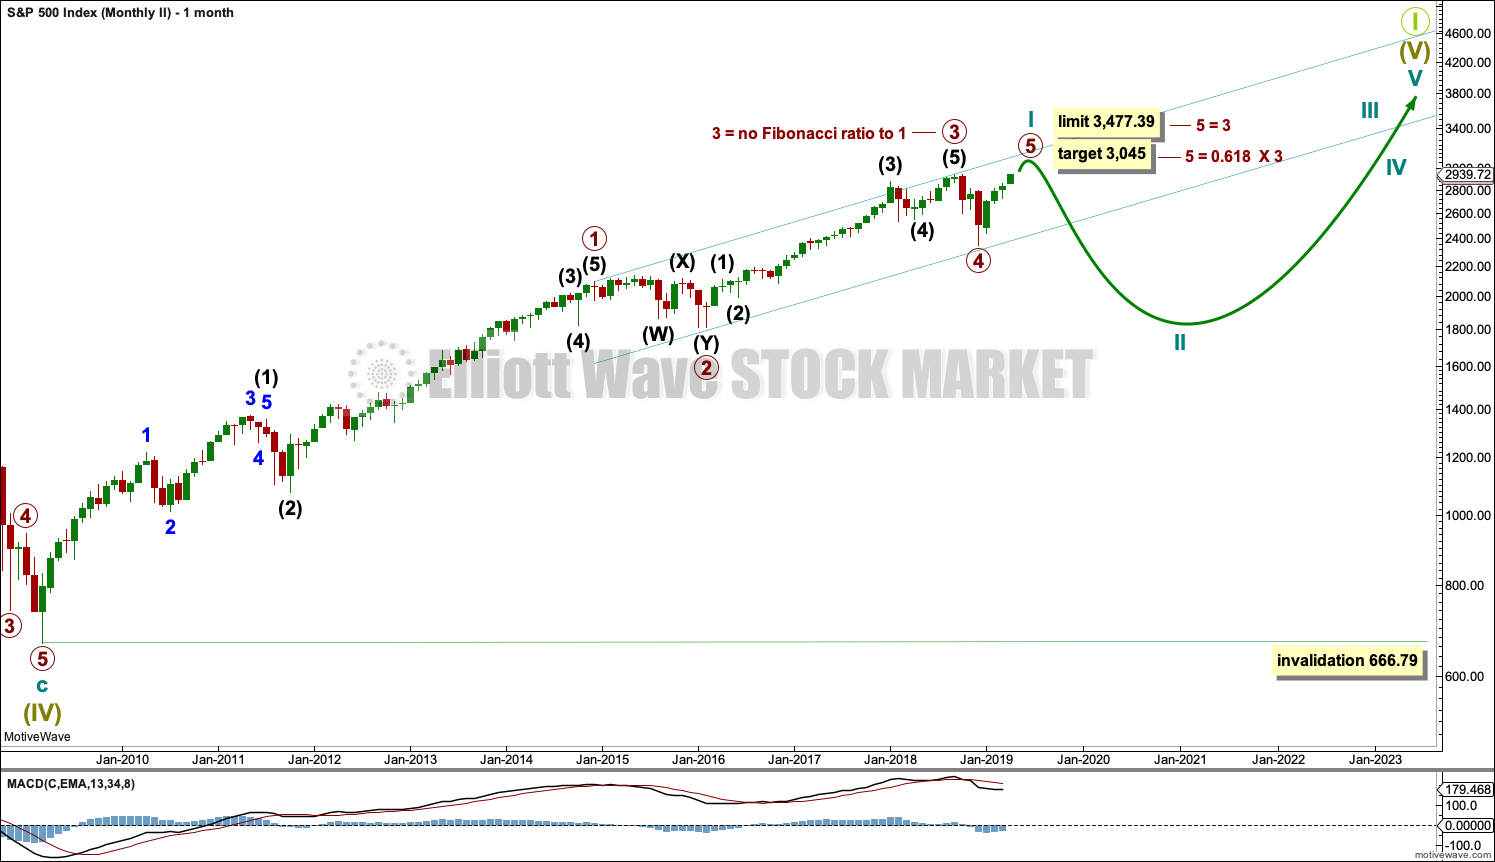
This monthly chart sees all subdivisions from the end of the March 2009 low in almost the same way, with the sole difference being the degree of labelling.
If the degree of labelling for the entirety of this bull market is all moved down one degree, then only a first wave at cycle degree may be nearing an end.
When cycle wave I is complete, then cycle wave II should meet the technical definition of a bear market as it should retrace more than 20% of cycle wave I, but it may end about either the 0.382 or 0.618 Fibonacci Ratios of cycle wave I. Cycle wave II may end close to the low of primary wave II within cycle wave I, which is at 1,810.10.
Thereafter, a new bull market for cycle wave III may begin. It should have support from volume and fundamentals.
The end of Grand Super Cycle wave I may be about 10 years or so away.
WEEKLY CHART
Click chart to enlarge.
This weekly chart is identical to the first weekly chart, with the sole difference being the degree of labelling.
TECHNICAL ANALYSIS
MONTHLY CHART
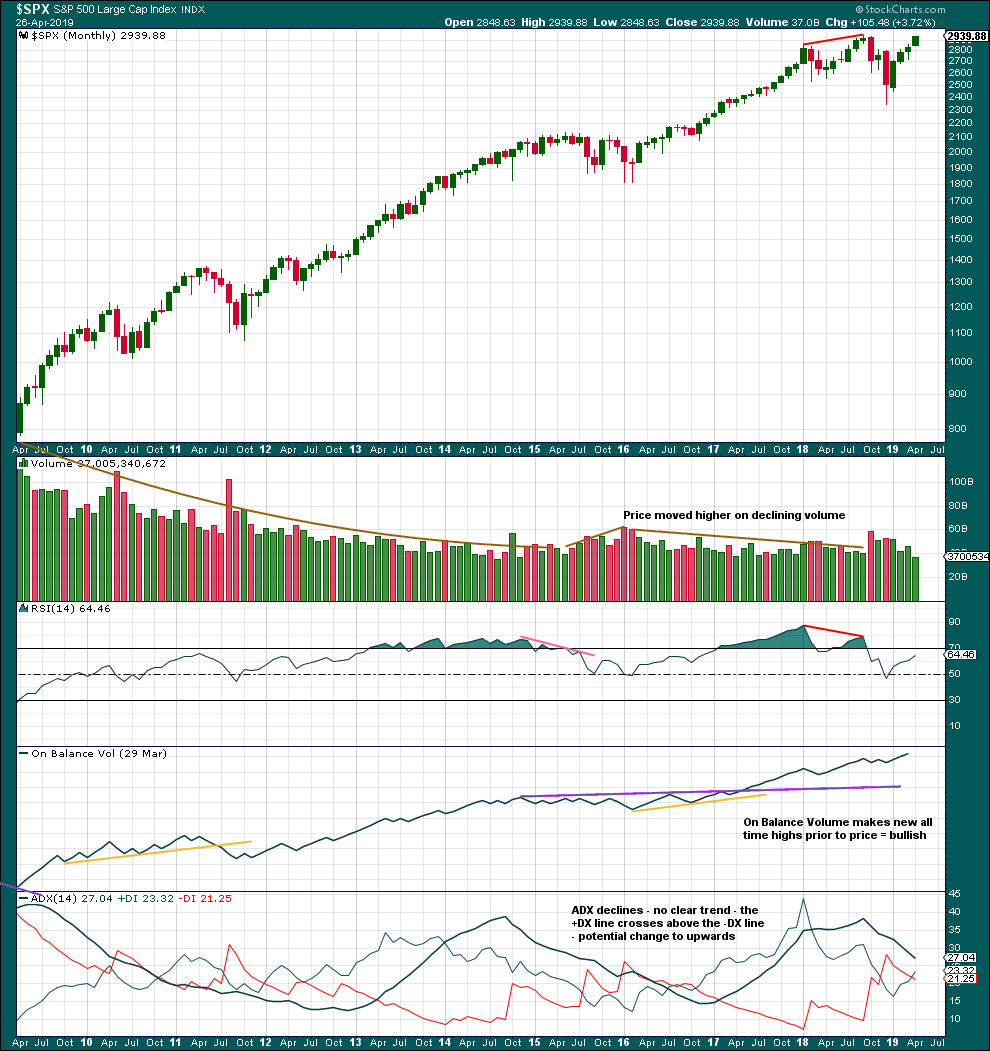
Click chart to enlarge. Chart courtesy of StockCharts.com.
Price moving higher on declining volume has been a feature of this bull market since 2009. This may fit the larger picture that sees this bull market as a Super Cycle degree fifth wave. Fifth waves should exhibit some weakness; they do not always have support from volume. It may also fit the picture for the new second Elliott wave count; if this is a first wave, it may exhibit some weakness.
RSI indicates the main monthly wave count may be more likely. It reached into overbought towards the end of both cycle waves I and III for that wave count.
WEEKLY CHART
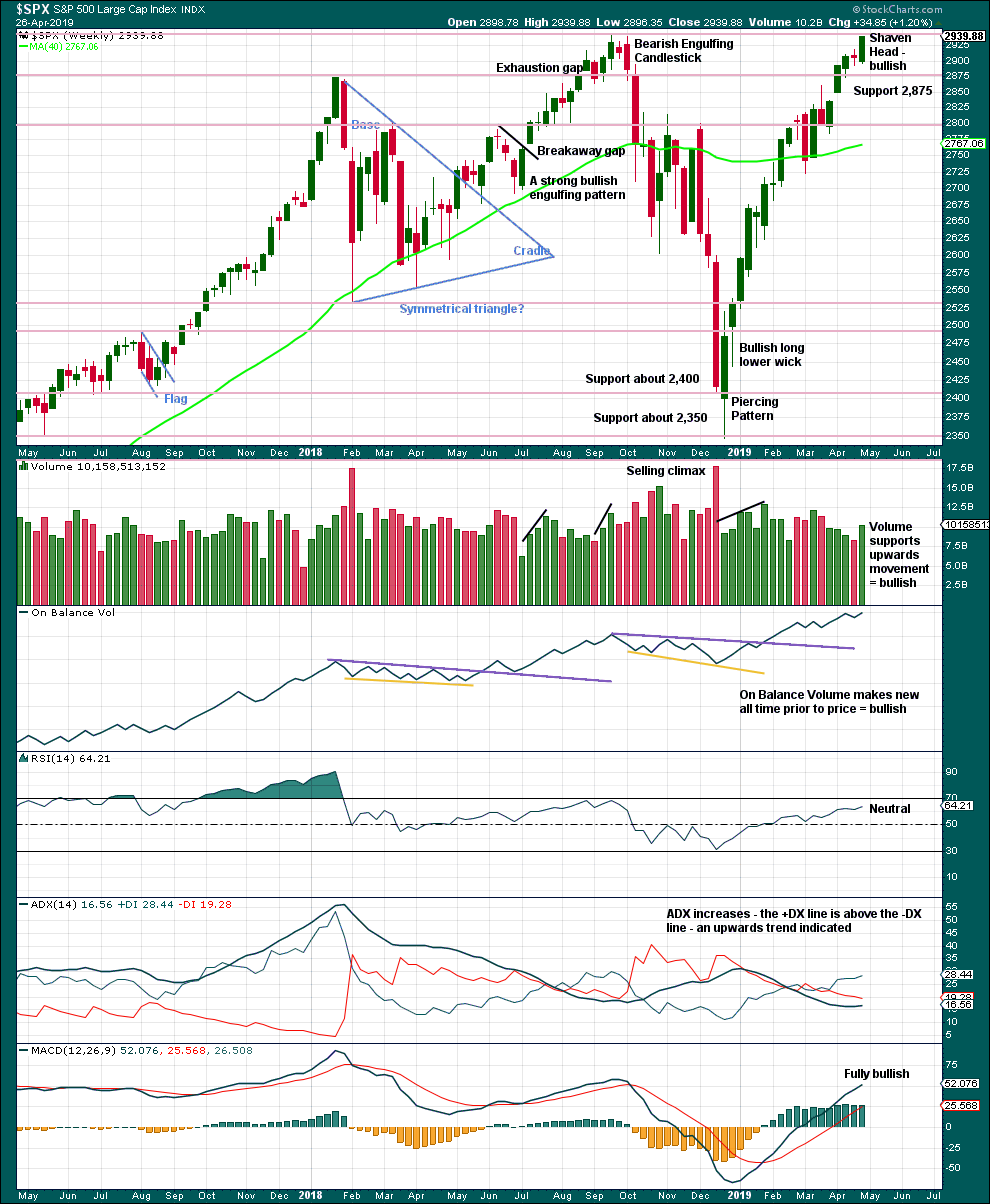
Click chart to enlarge. Chart courtesy of StockCharts.com.
Next resistance is about the prior all time high about 2,940.
This chart is fully bullish. A new all time high may come on Monday.
DAILY CHART
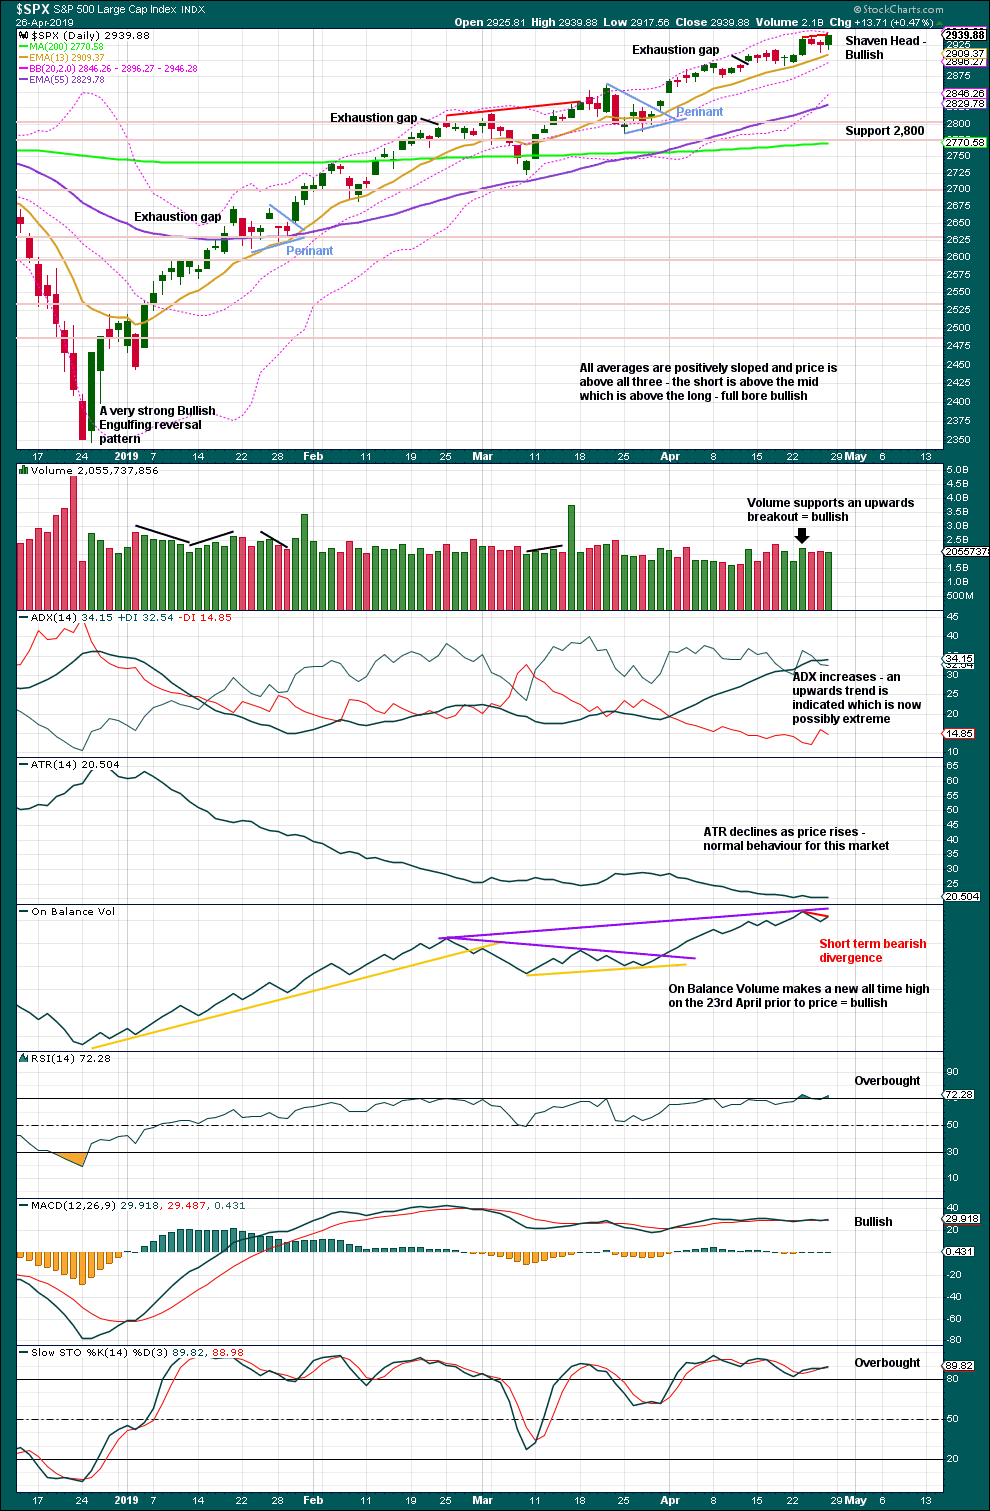
Click chart to enlarge. Chart courtesy of StockCharts.com.
The December 2018 low is expected to remain intact. The two 90% upwards days on 26th December 2018 and 6th January 2019 indicate this upwards trend has internal strength.
While the last swing low of the 25th of March remains intact, there exists a series of higher highs and higher lows from the major low in December 2018. It would be safest to assume the upwards trend remains intact. ADX agrees.
The shaven head on today’s candlestick should be given weight. A new all time high may come on Monday.
Short-term bearish divergence between price and On Balance Volume will not be given weight. It has proven recently to be unreliable.
BREADTH – AD LINE
WEEKLY CHART
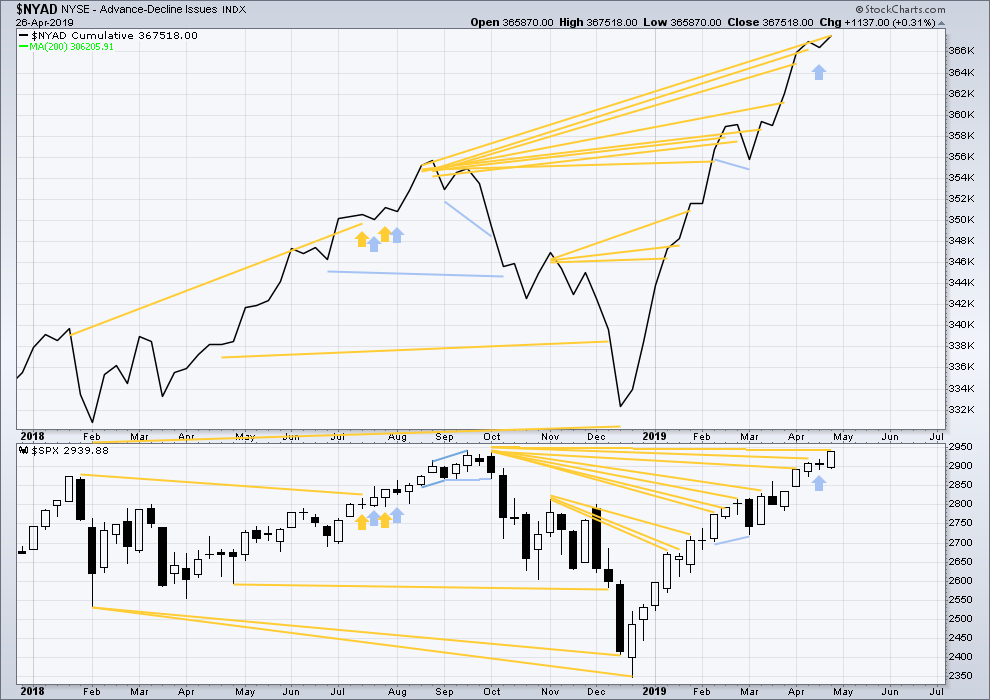
Click chart to enlarge. Chart courtesy of StockCharts.com. So that colour blind members are included, bearish signals
will be noted with blue and bullish signals with yellow.
Every single bear market from the Great Depression and onwards has been preceded by a minimum of 4 months divergence between price and the AD line. With the AD line making a new all time high again in April, the end of this bull market and the start of a new bear market must be a minimum of 4 months away, which is the end of August 2019 at this time.
This week the AD line makes another new all time high with price failing to make a corresponding new all time high by the slimmest of margins at 1.03 points.
Mid and large caps have both made new highs above the swing high of the 25th of February, but small caps have not. However, small caps AD line has made a new all time high on the 12th of April indicating broad strength underlying this market. Mid and small caps continue to lag. This rise is driven primarily by large caps, which is typical for an aged bull market.
DAILY CHART
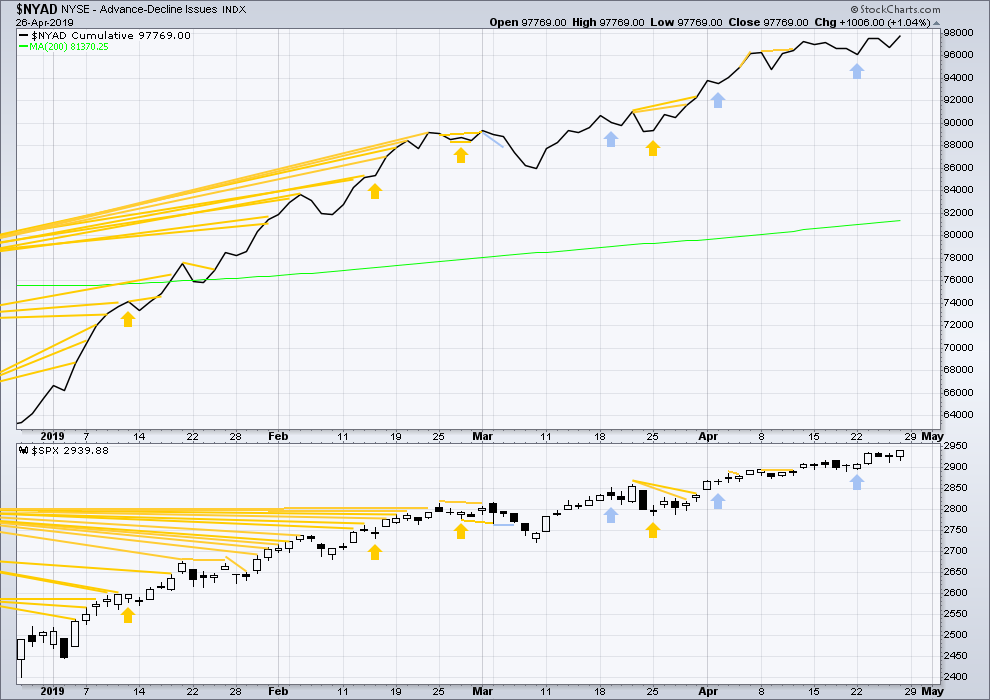
Click chart to enlarge. Chart courtesy of StockCharts.com. So that colour blind members are included, bearish signals
will be noted with blue and bullish signals with yellow.
Breadth should be read as a leading indicator.
Both price and the AD line moved higher today. Upwards movement has support from increasing market breadth, and breadth is not increasing faster than price.
VOLATILITY – INVERTED VIX CHART
WEEKLY CHART
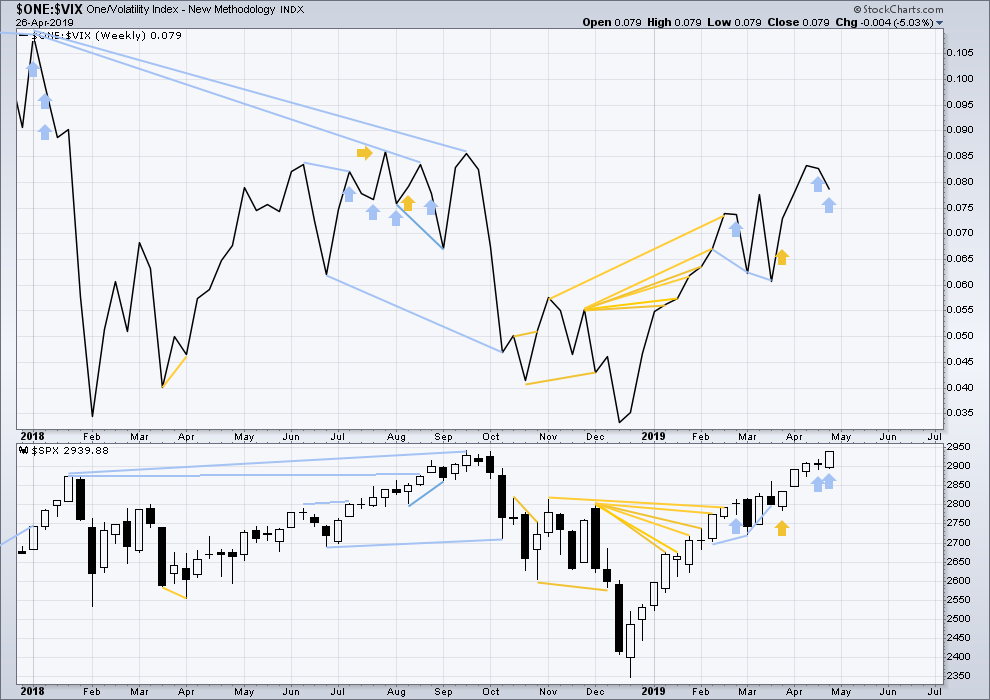
Click chart to enlarge. Chart courtesy of StockCharts.com. So that colour blind members are included, bearish signals
will be noted with blue and bullish signals with yellow.
For two weeks in a row price has moved higher and inverted VIX has moved lower. Last week was not so clear as the weekly price candlestick was red, but this week is clear. Price has moved strongly higher, but inverted VIX has moved strongly lower. This divergence is bearish for the short to mid term and may be warning of an approaching primary (or intermediate) degree correction.
DAILY CHART
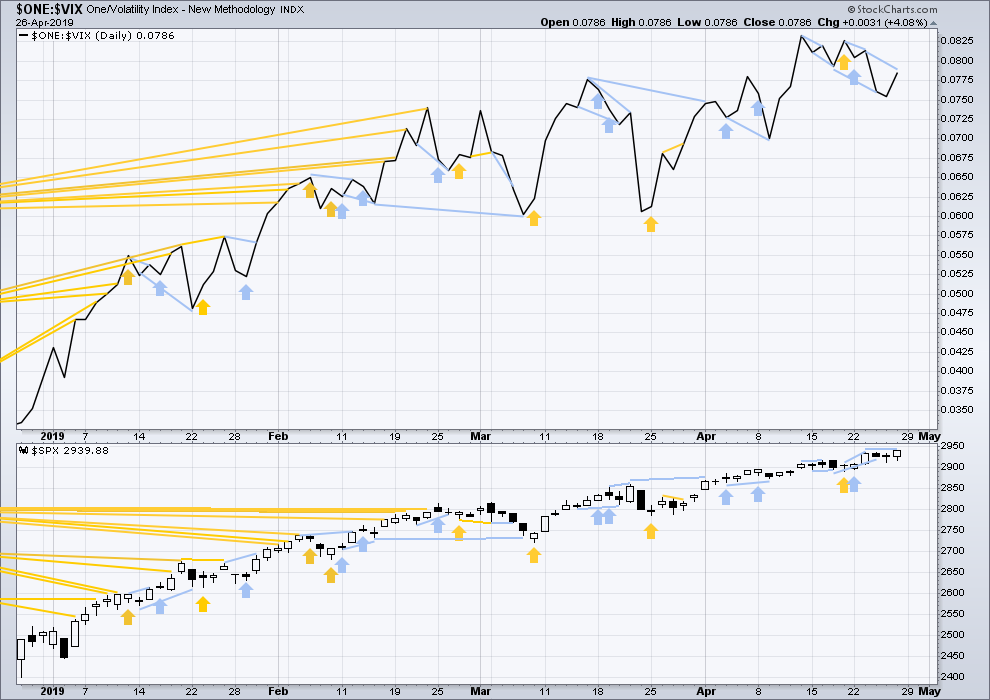
Click chart to enlarge. Chart courtesy of StockCharts.com. So that colour blind members are included, bearish signals
will be noted with blue and bullish signals with yellow.
Price has made a new short-term high, but inverted VIX has not. There is now double bearish short-term divergence.
DOW THEORY
Dow Theory confirmed a bear market in December 2018. This does not necessarily mean a bear market at Grand Super Cycle degree though; Dow Theory makes no comment on Elliott wave counts. On the 25th of August 2015 Dow Theory also confirmed a bear market. The Elliott wave count sees that as part of cycle wave II. After Dow Theory confirmation of a bear market in August 2015, price went on to make new all time highs and the bull market continued.
DJIA: 23,344.52 – a close on the 19th of December at 23,284.97 confirms a bear market.
DJT: 9,806.79 – price has closed below this point on the 13th of December.
S&P500: 2,532.69 – a close on the 19th of December at 2,506.96 provides support to a bear market conclusion.
Nasdaq: 6,630.67 – a close on the 19th of December at 6,618.86 provides support to a bear market conclusion.
With all the indices moving now higher, Dow Theory would confirm a bull market if the following highs are made:
DJIA: 26,951.81
DJT: 11,623.58
S&P500: 2,940.91
Nasdaq: 8,133.30 – a new high has been made on 24th of April 2019.
GOLD
A bounce has continued higher. Price remains below the invalidation point and within the base channel for the daily Elliott wave count.
Summary: For the very short term, look for this bounce to possibly end about 1,294 or at resistance at the upper edge of the base channel. Thereafter, expect the downwards trend to resume.
The Elliott wave target is at 1,220. The classic analysis target is at 1,217. Risk is just above the upper edge of the base channel on the daily chart.
Look out now for a possible strong increase in downwards momentum next week.
Three long-term targets are now calculated for cycle wave c to end. Confidence in a new downwards trend may be had with a new low below 1,160.75.
Grand SuperCycle analysis is here.
Last monthly charts are here. Video is here.
MAIN ELLIOTT WAVE COUNT
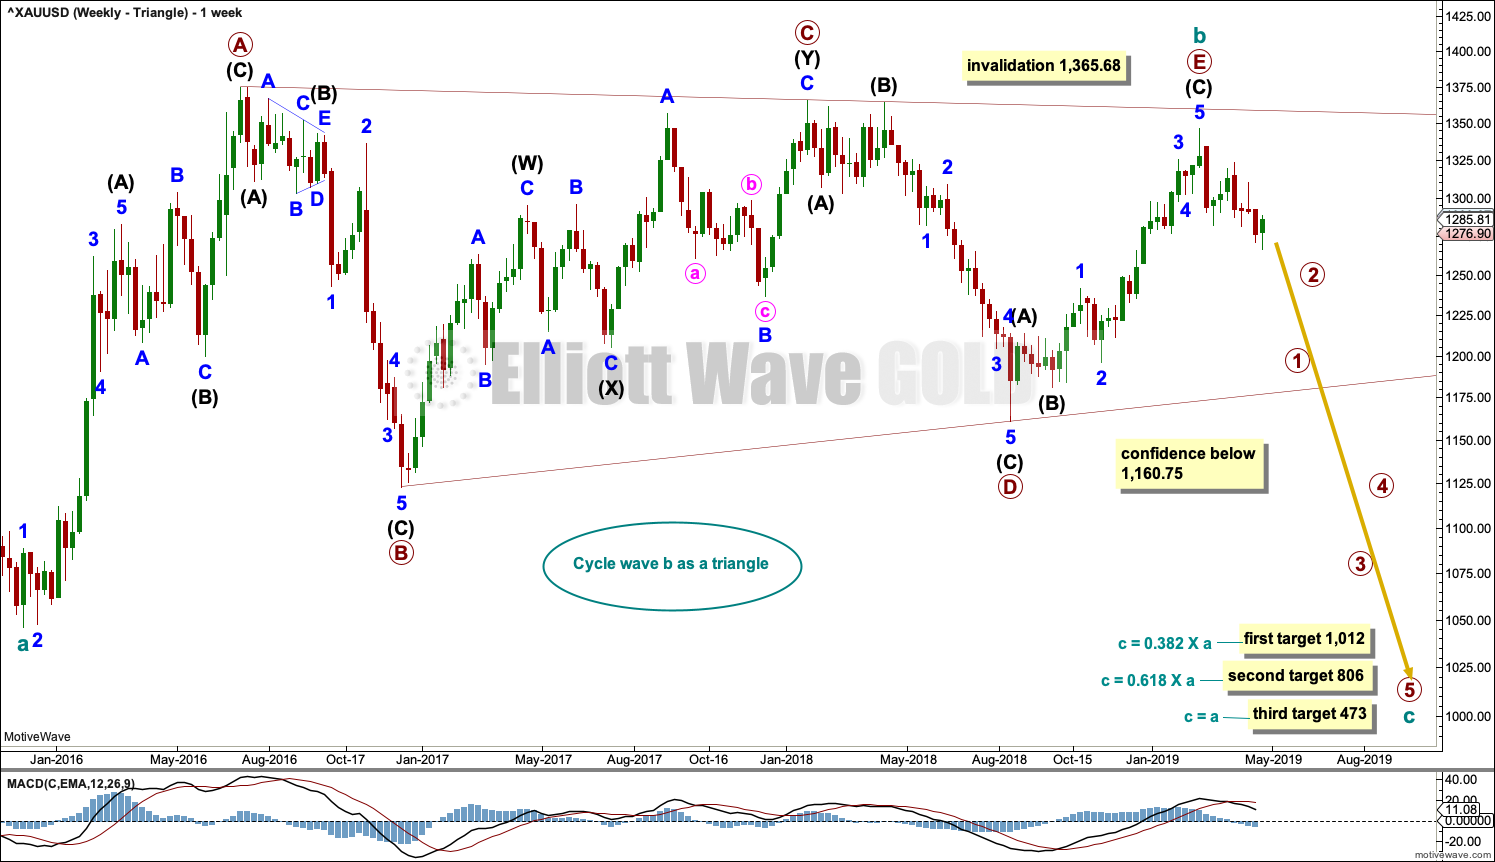
WEEKLY CHART – TRIANGLE
Click chart to enlarge.
This is the preferred wave count.
Cycle wave b may be a complete regular contracting triangle. If it continues further, then primary wave E may not move beyond the end of primary wave C above 1,365.68.
Four of the five sub-waves of a triangle must be zigzags, with only one sub-wave allowed to be a multiple zigzag. Wave C is the most common sub-wave to subdivide as a multiple, and this is how primary wave C for this example fits best.
There are no problems in terms of subdivisions or rare structures for this wave count. It has an excellent fit and so far a typical look.
This wave count would expect a cycle degree trend change has recently occurred. Cycle wave c would most likely make new lows below the end of cycle wave a at 1,046.27 to avoid a truncation.
Primary wave E has exhibited reasonable weakness as it came to an end. Triangles often end with declining ATR, weak momentum and weak volume.
If this weekly wave count is correct, then cycle wave c downwards should develop strength, ATR should show some increase, and MACD should exhibit an increase in downwards momentum.
Three targets are calculated for cycle wave c. Cycle wave a lasted 4.25 years. Cycle wave b may be over in 3.17 years. Cycle wave c may last a minimum of 2 years and possibly up to 5 years.
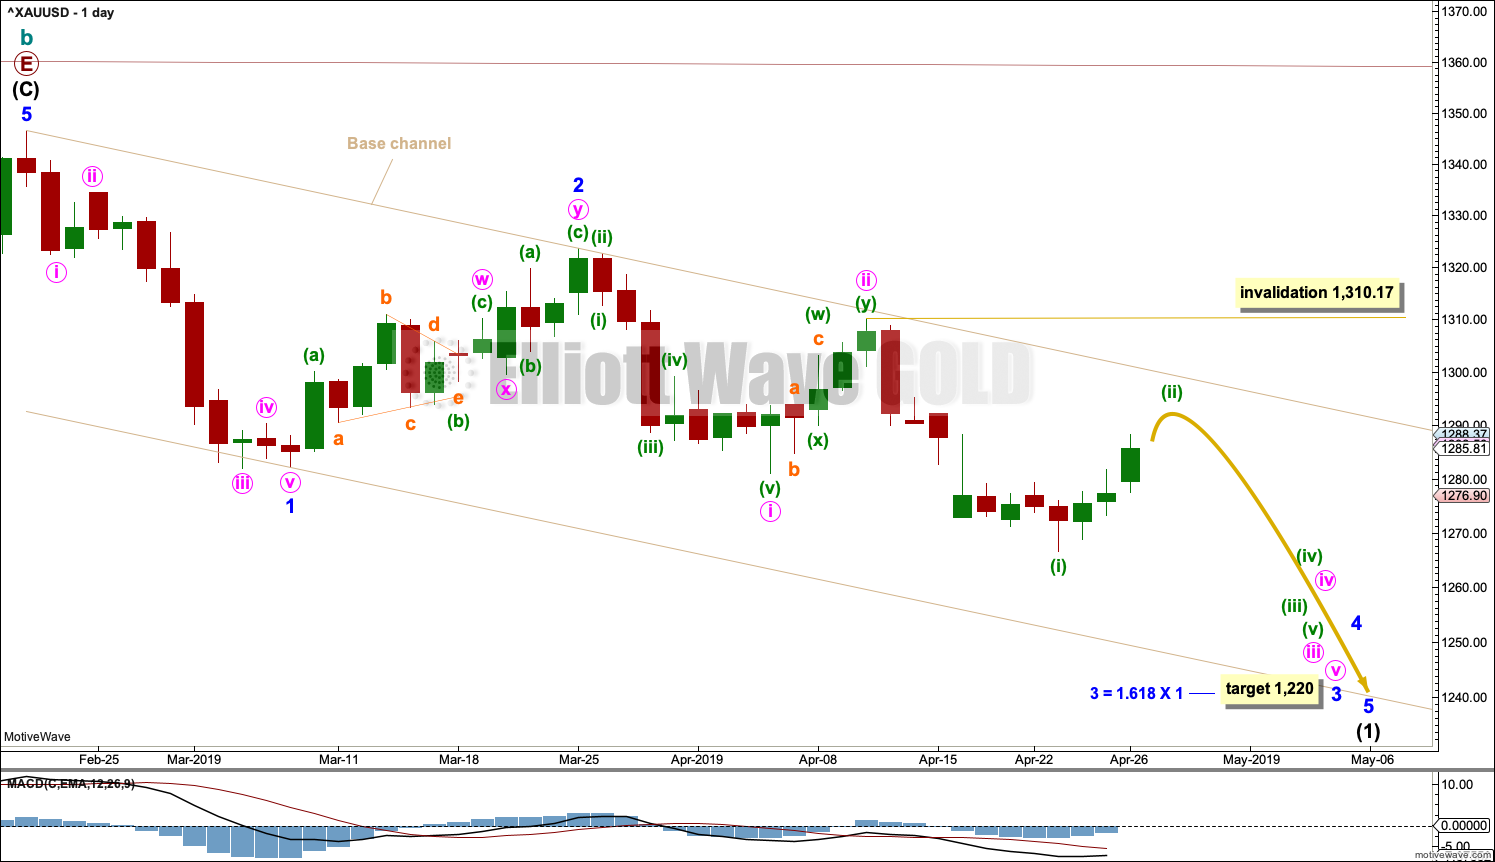
DAILY CHART – TRIANGLE
Click chart to enlarge.
Cycle wave c must subdivide as a five wave structure, either an impulse or an ending diagonal. An impulse is much more common and that shall be how it is labelled unless overlapping suggests a diagonal should be considered.
A new trend at cycle degree should begin with a five wave structure on the daily chart, which will be labelled minor wave 1.
A base channel is drawn about minor waves 1 and 2. There will be bounces and consolidations on the way down. The last bounce has found resistance at the upper edge of the base channel. Towards its middle or end the power of a third wave may be able to break below support at the lower edge of the base channel. The upper edge of the base channel may be used to calculate a trailing stop for short positions.
Minor wave 3 may only subdivide as an impulse. Within the impulse, minute waves i and ii may now be complete and minute wave iii may only subdivide as an impulse. Within minute wave iii, minuette wave (ii) may not move beyond the start of minuette wave (i) above 1,310.17. It is possible that minuette wave (ii) may again test resistance at the upper edge of the base channel. If price does get up that high, a reversal about that point would be very likely.
Minute wave iii has moved below the end of minute wave i meeting a core Elliott wave rule.
It is possible that minute wave iii and / or minor wave 3 may end with a selling climax; either or both may exhibit a swift and strong fifth wave to end the impulse. This behaviour is typical of commodities, and this tendency is especially prevalent for third wave impulses.
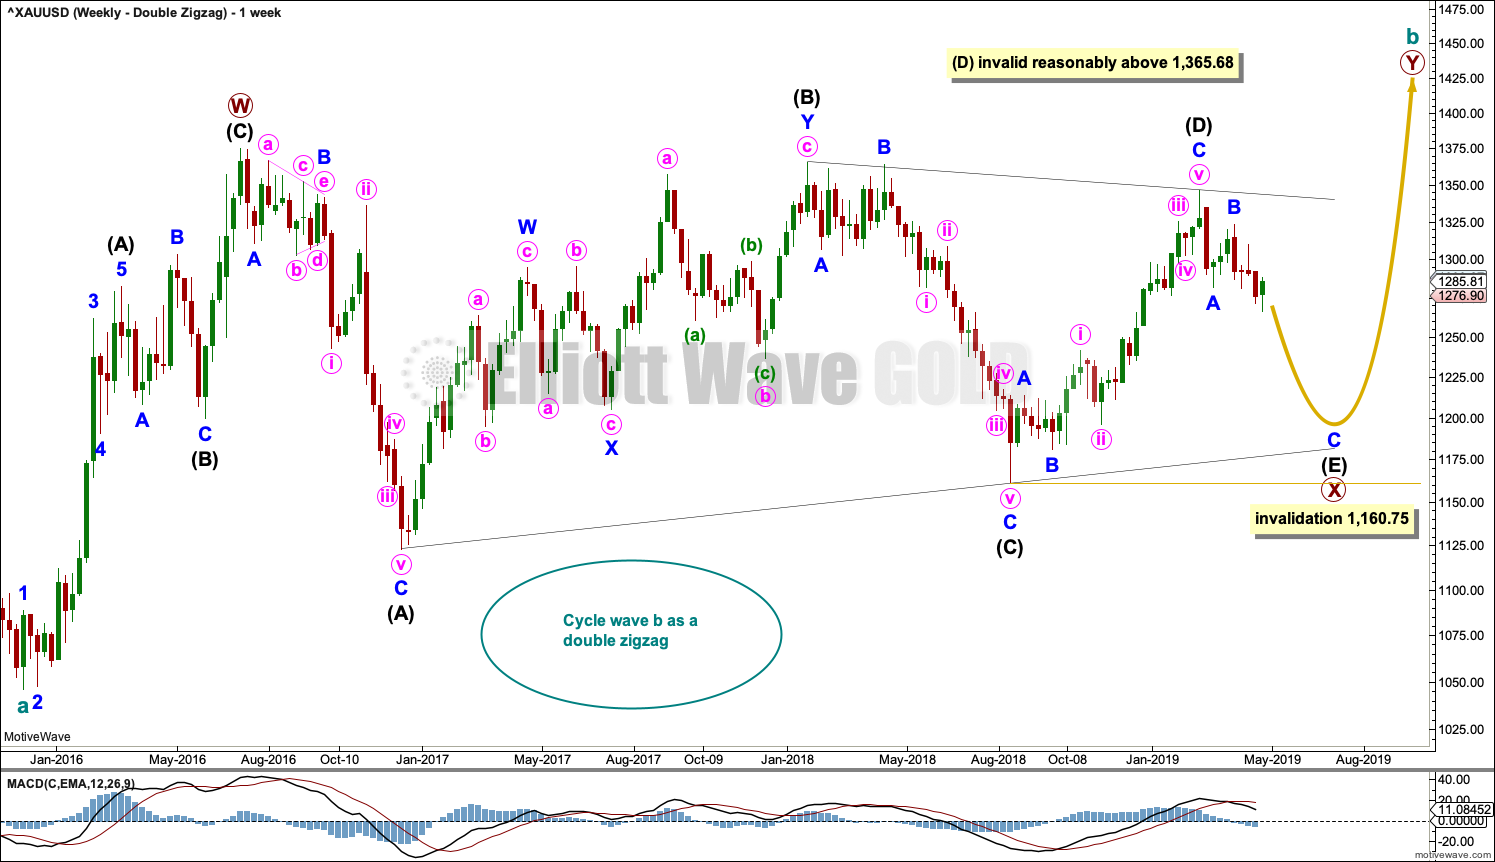
WEEKLY CHART – DOUBLE ZIGZAG
Click chart to enlarge.
It is possible that cycle wave b may be an incomplete double zigzag or a double combination.
The first zigzag in the double is labelled primary wave W. This has a good fit.
The double may be joined by a corrective structure in the opposite direction, a triangle labelled primary wave X. The triangle would be about four fifths complete.
Within multiples, X waves are almost always zigzags and rarely triangles. Within the possible triangle of primary wave X, it is intermediate wave (B) that is a multiple; this is acceptable, but note this is not the most common triangle sub-wave to subdivide as a multiple. These two points reduce the probability of this wave count.
Intermediate wave (D) may be complete. The (B)-(D) trend line is almost perfectly adhered to with the smallest overshoot within intermediate wave (C). This is acceptable.
Intermediate wave (E) should continue to exhibit weakness: ATR should continue to show a steady decline, and MACD may begin to hover about zero.
Intermediate wave (E) may not move beyond the end of intermediate wave (C) below 1,160.75.
This wave count may now expect downwards movement for several weeks.
Primary wave Y would most likely be a zigzag because primary wave X would be shallow; double zigzags normally have relatively shallow X waves.
Primary wave Y may also be a flat correction if cycle wave b is a double combination, but combinations normally have deep X waves. This would be less likely.
This wave count has good proportions and no problems in terms of subdivisions.
Intermediate wave (E) should subdivide as a zigzag labelled minor waves A-B-C. Zigzags subdivide 5-3-5, exactly the same the start of an impulse.
The preferred wave count labels downwards movement minor waves 1-2-3, and this wave count labels downwards movement minor waves A-B-C. At the daily chart level, the subdivisions for both wave counts are seen in the same way.
ALTERNATE ELLIOTT WAVE COUNT
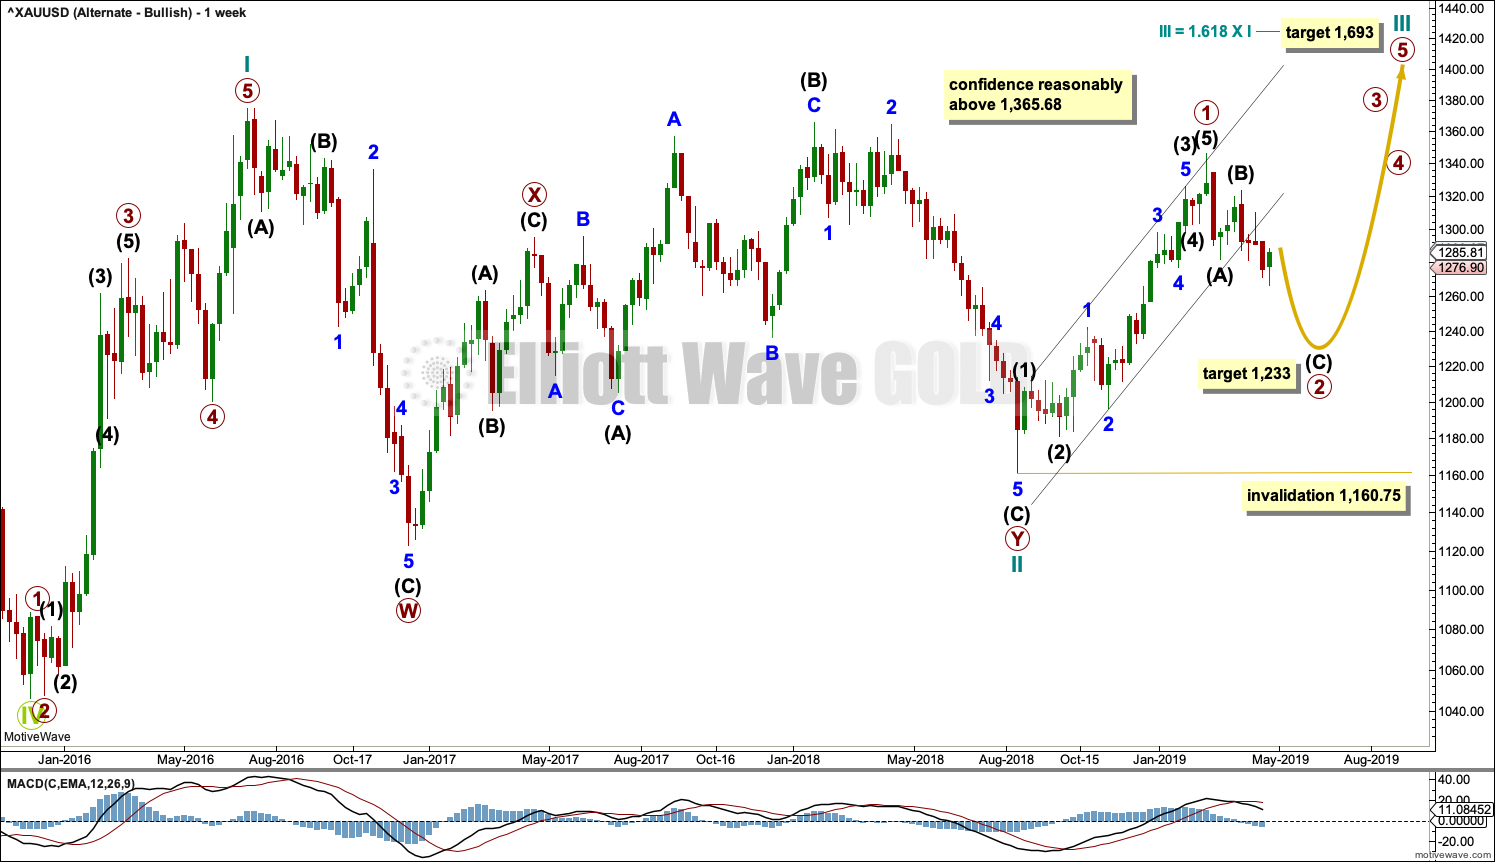
WEEKLY CHART
Click chart to enlarge.
If Gold is in a new bull market, then it should begin with a five wave structure upwards on the weekly chart. However, the biggest problem with this wave count is the structure labelled cycle wave I because this wave count must see it as a five wave structure, but it looks more like a three wave structure.
Commodities often exhibit swift strong fifth waves that force the fourth wave corrections coming just prior to be more brief and shallow than their counterpart second waves. It is unusual for a commodity to exhibit a quick second wave and a more time consuming fourth wave, and this is how cycle wave I is labelled. The probability of this wave count is low due to this problem.
Cycle wave II subdivides well as a double combination: zigzag – X – expanded flat.
Cycle wave III may have begun. Within cycle wave III, primary wave 1 may now be complete. The target for primary wave 2 is the 0.618 Fibonacci ratio of primary wave 1. Primary wave 2 may not move beyond the start of primary wave 1 below 1,160.75.
A black channel is drawn about primary wave 1. Primary wave 2 may breach the lower edge of this channel.
Cycle wave III so far for this wave count would have been underway now for 36 weeks. It should be beginning to exhibit some support from volume, increase in upwards momentum and increasing ATR. However, ATR continues to decline and is very low, and momentum is weak in comparison to cycle wave I. This wave count lacks support from classic technical analysis.
TECHNICAL ANALYSIS
WEEKLY CHART
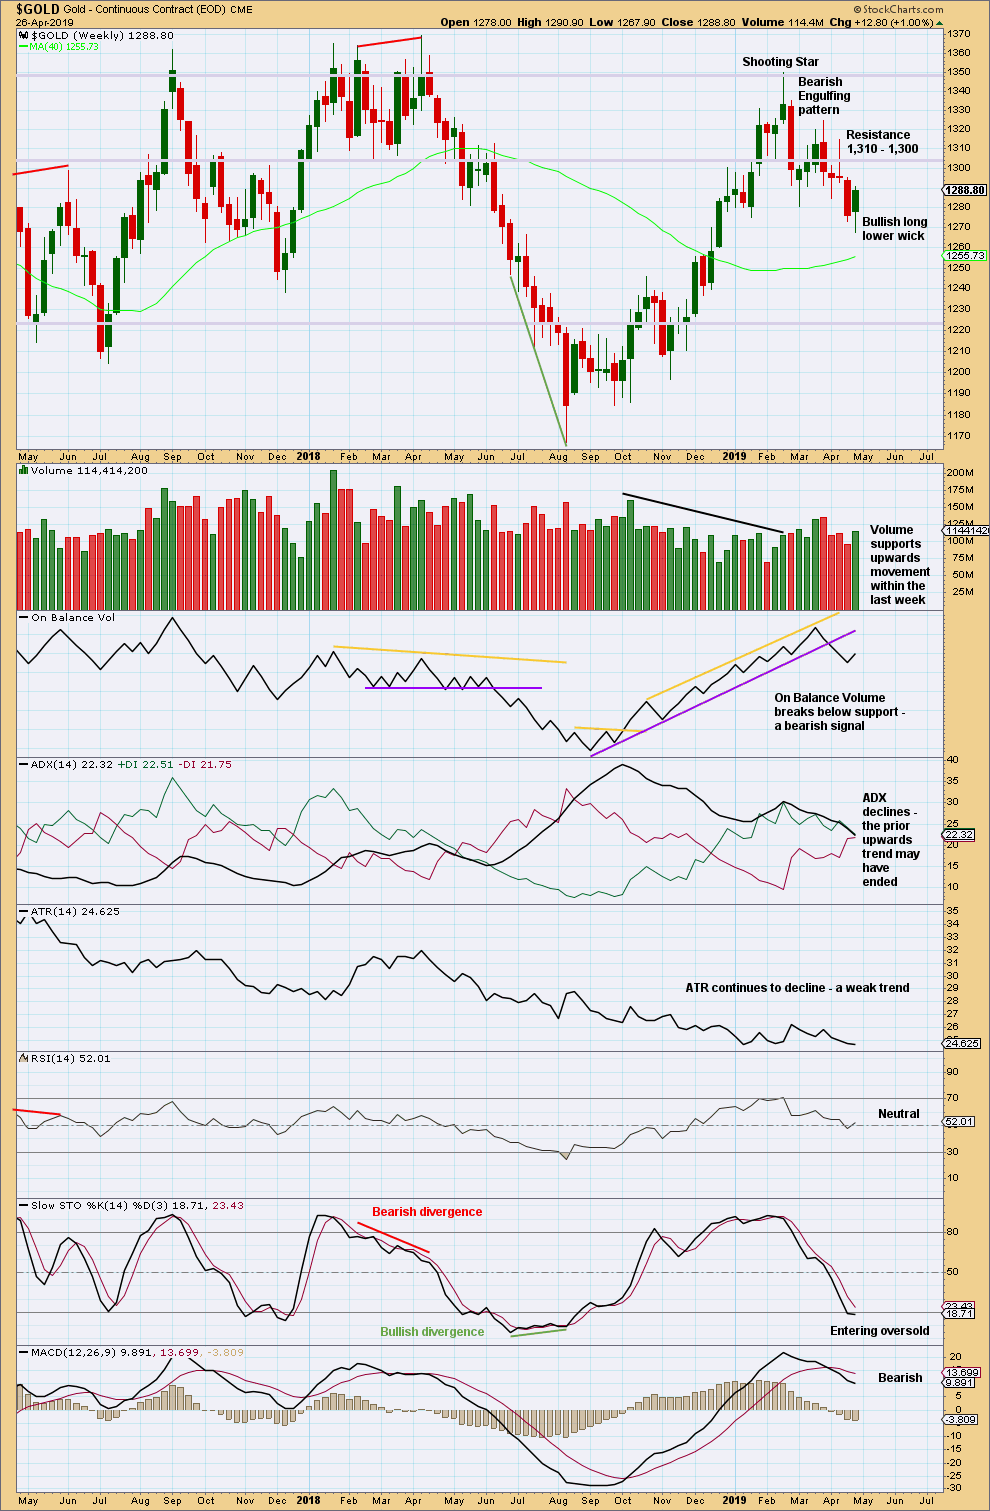
Click chart to enlarge. Chart courtesy of StockCharts.com.
A green weekly candlestick, a long lower wick, and support from volume for upwards movement this week suggest more upwards movement next week.
DAILY CHART
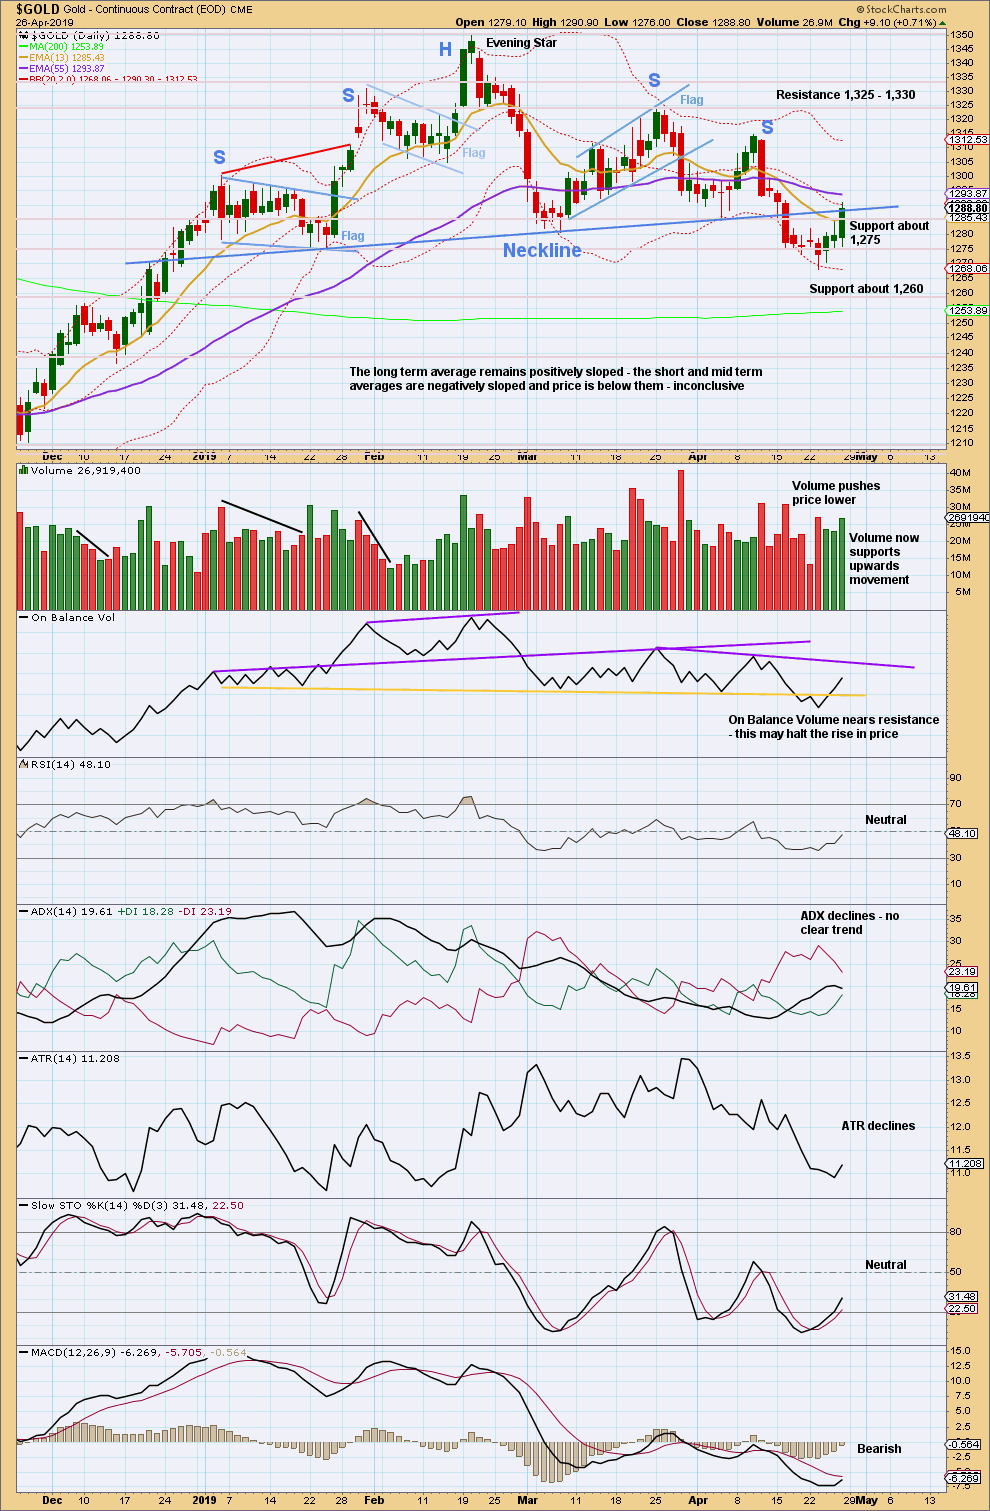
Click chart to enlarge. Chart courtesy of StockCharts.com.
From August 2018 Gold moved higher with a series of higher highs and higher lows. This series remained intact until the 1st of March 2019 when a lower low was made. At that stage, it was possible that Gold had seen a trend change.
There is now a new series of two lower swing highs and two lower swing lows. This supports the idea that there has been a trend change and Gold is in a new downwards trend. ADX now agrees.
A complex Head and Shoulders pattern is identified. The neck line has been breached. A target is at 1,217. The neck line is not perfectly showing where this throwback is finding resistance.
This bounce looks like a counter trend movement within a new downwards trend at this stage.
GDX WEEKLY CHART
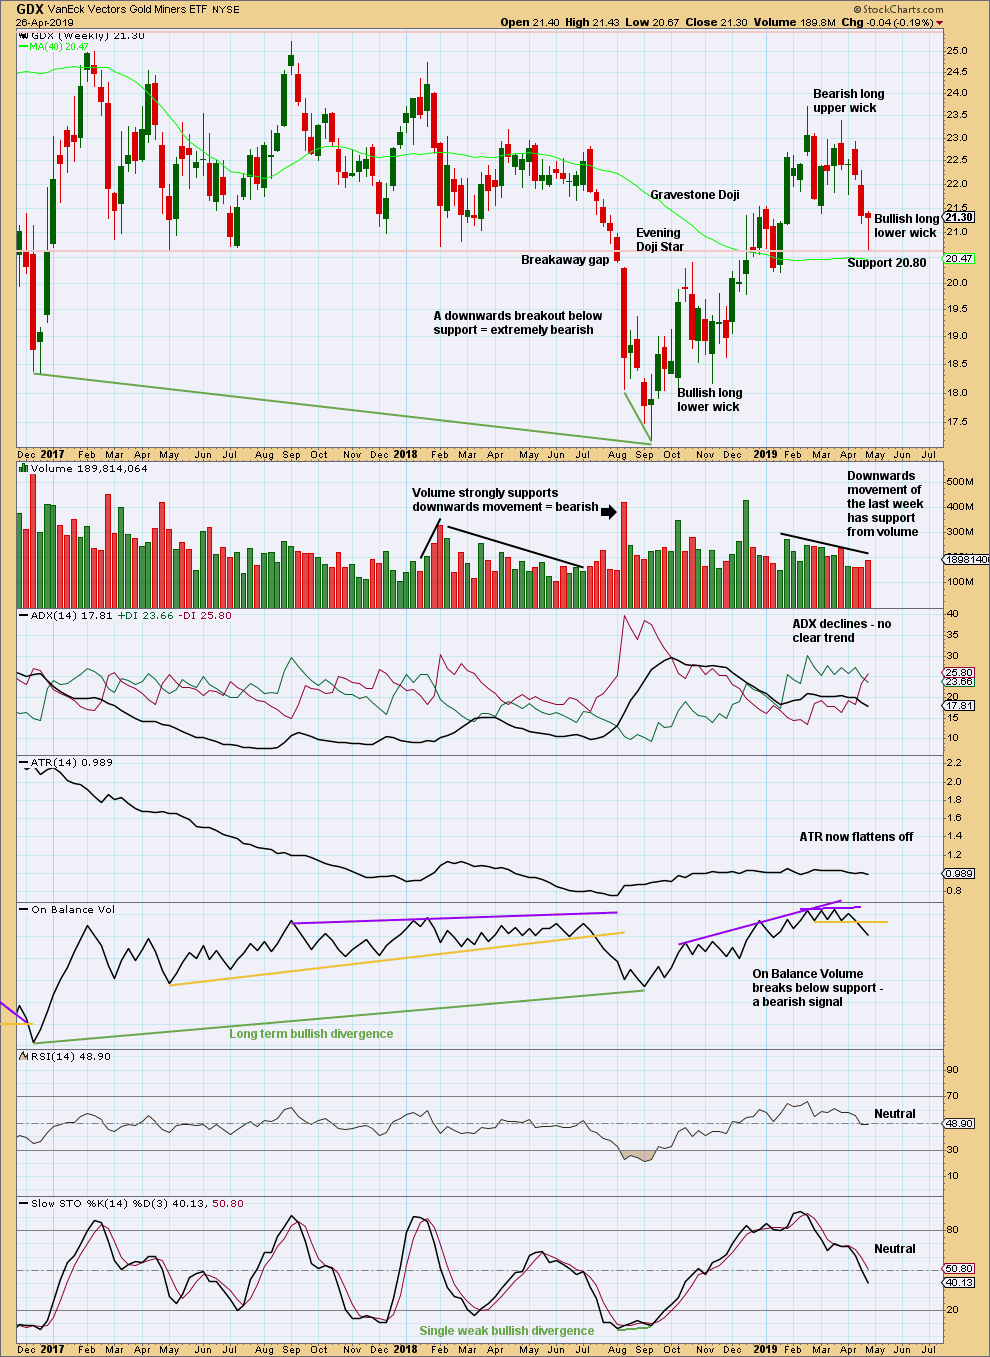
Click chart to enlarge. Chart courtesy of StockCharts.com.
There is now a series of two lower highs and lower lows at the weekly chart level. GDX may have seen a trend change to downwards, but ADX does not yet agree. The bearish signal from On Balance Volume supports this view.
For the short term, price looks to be bouncing up off support about 20.80. The lower wick suggests this bounce may continue next week.
GDX DAILY CHART
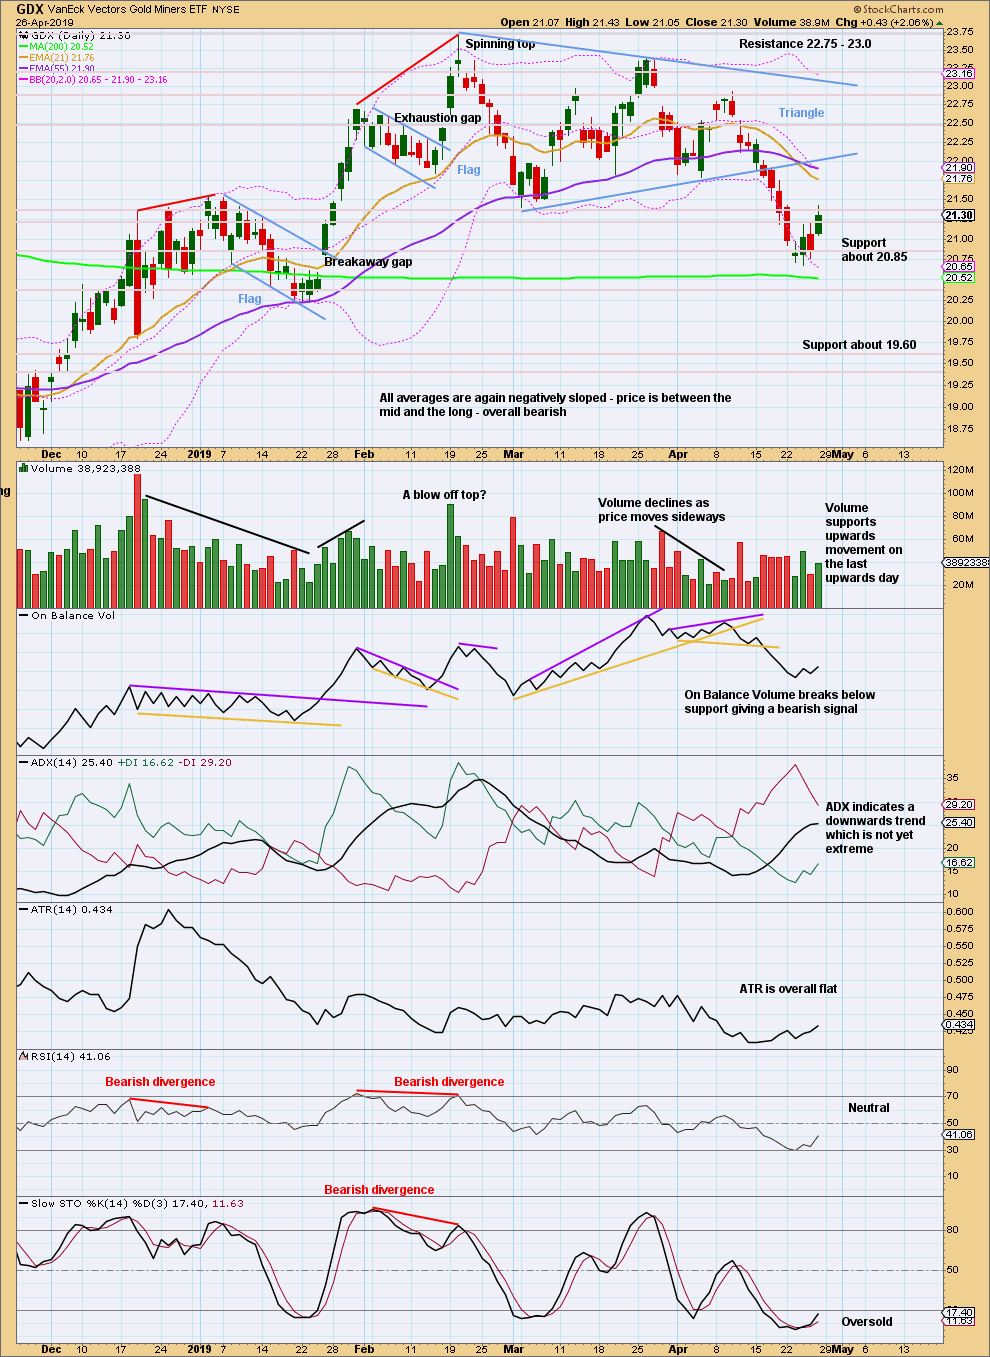
Click chart to enlarge. Chart courtesy of StockCharts.com.
At the daily chart level, the view of an upwards trend may be in doubt with a new swing low on the 1st of March 2019 that moved below the prior swing low of the 14th of February 2019. At that stage, the series of higher highs and higher lows was no longer intact and a trend change was possible.
Since then price has not made another higher high.
Price closed below the lower triangle trend line on a downwards day that has support from volume. Volume is not required for a downwards breakout, but more confidence in the breakout may be had when volume does support downwards movement.
A target calculated from the triangle width is now at 19.58. This is also about the next level of support.
For the very short term, volume today again suggests a bounce here may continue.
US OIL
A little more upwards movement was expected for the week.
The weekly candlestick forms an important pattern, and the daily volume profile supports it.
Summary: Oil may have now found a high. The next wave down may begin. The final target is now calculated at 10.72.
Confidence that a high is in place may be had if the channel on the daily chart is breached by a full candlestick below and not touching the lower edge of the trend channel.
MAIN ELLIOTT WAVE COUNT
MONTHLY CHART
Click chart to enlarge.
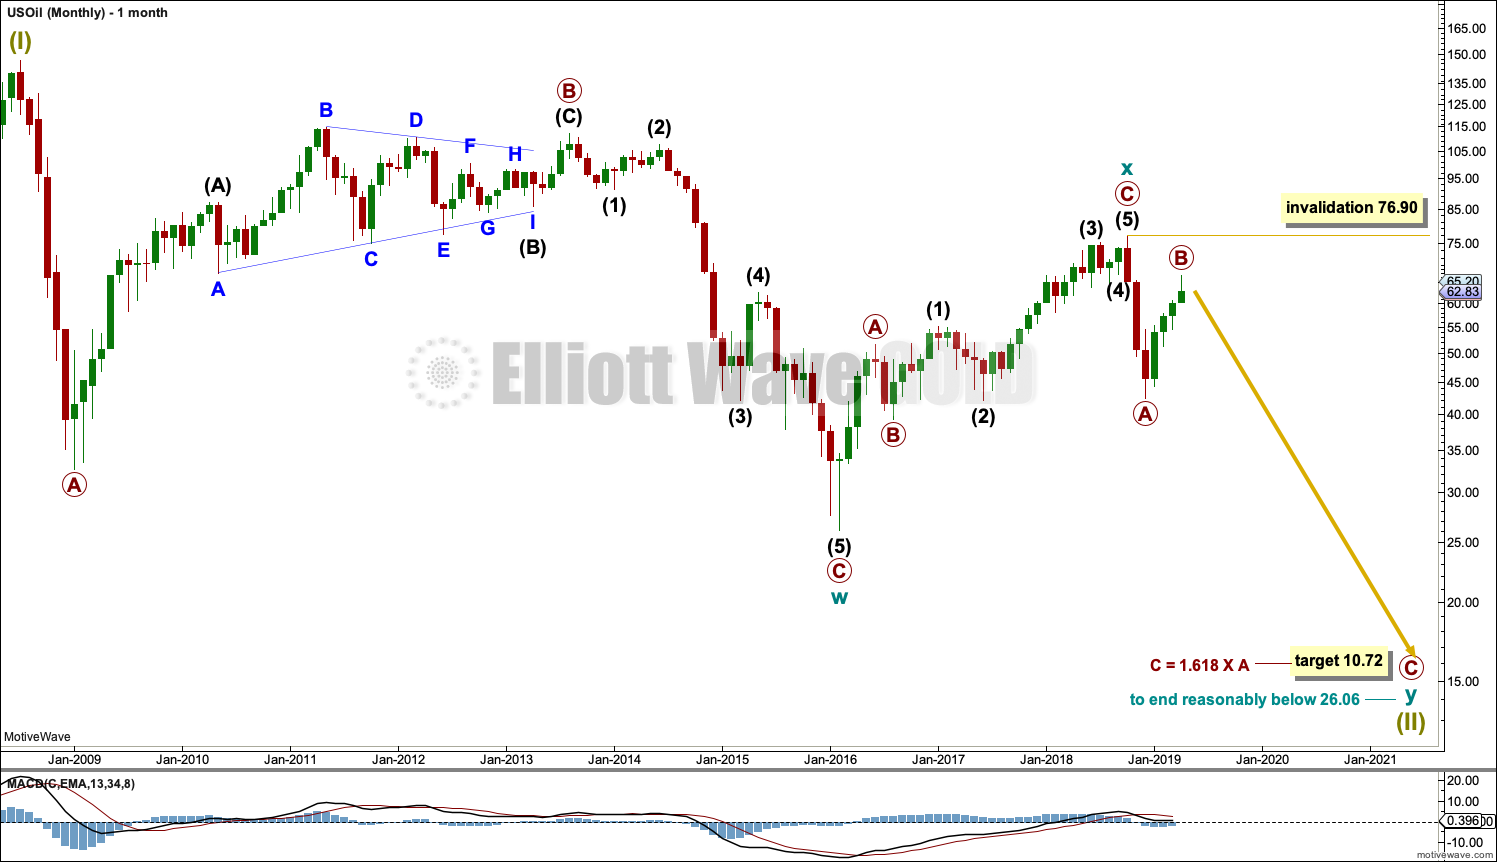
Classic technical analysis favours a bearish wave count for Oil at this time.
The large fall in price from the high in June 2008 to February 2016 is seen as a complete three wave structure. This large zigzag may have been only the first zigzag in a deeper double zigzag.
Upwards movement from February 2016 to October 2018 will not fit readily as a five wave structure but will fit very well as a three. With a three wave structure upwards, this indicates the bear market may not be over.
The first zigzag down is labelled cycle wave w. The double is joined by a now complete three in the opposite direction, a zigzag labelled cycle wave x.
The purpose of a second zigzag in a double is to deepen the correction when the first zigzag does not move price deep enough. Cycle wave y would be expected to move reasonably below the end of cycle wave w to deepen the correction. Were cycle wave y to reach equality with cycle wave w that takes Oil into negative price territory, which is not possible. Cycle wave y would reach 0.618 the length of cycle wave w at $2.33.
A better target calculation would be using the Fibonacci ratios between primary waves A and C within cycle wave y.
This week the degree of labelling within cycle wave y is moved up one degree in consideration of the size of the last two waves.
Within the zigzag of cycle wave y, primary wave A may have been over at the last low and now primary wave B may be complete this week. Were primary wave C to reach only equality in length with primary wave A, then cycle wave y would not move beyond the end of cycle wave w. The next Fibonacci ratio in the sequence is used to calculate a target for primary wave C.
If it continues higher, then primary wave B may not move beyond the start of primary wave A above 76.90.
WEEKLY CHART
Click chart to enlarge.
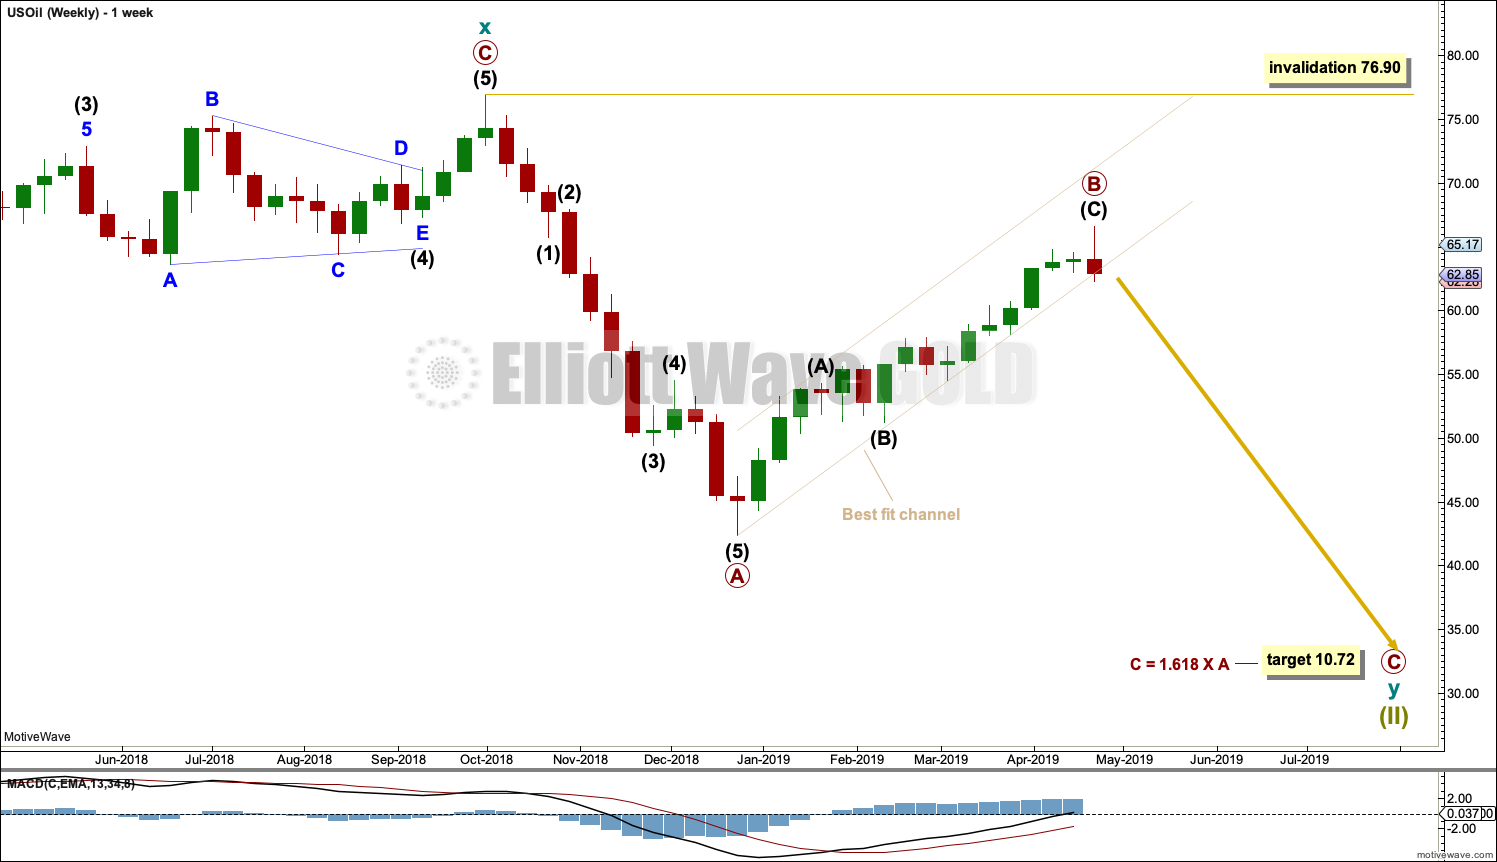
This weekly chart is focussed on the start of cycle wave y.
Cycle wave y is expected to subdivide as a zigzag. A zigzag subdivides 5-3-5. Primary wave A must subdivide as a five wave structure if this wave count is correct.
Primary wave A may be a complete five wave impulse at the last low.
Primary wave B may now be a complete single zigzag at the last high.
Primary wave C may have just begun. Primary wave C must subdivide as a five wave structure.
While there has not yet been a trend channel breach of the channel about primary wave B, the invalidation point must remain the same. If it continues higher, then primary wave B may not move beyond the start of primary wave A above 76.90.
DAILY CHART
Click chart to enlarge.
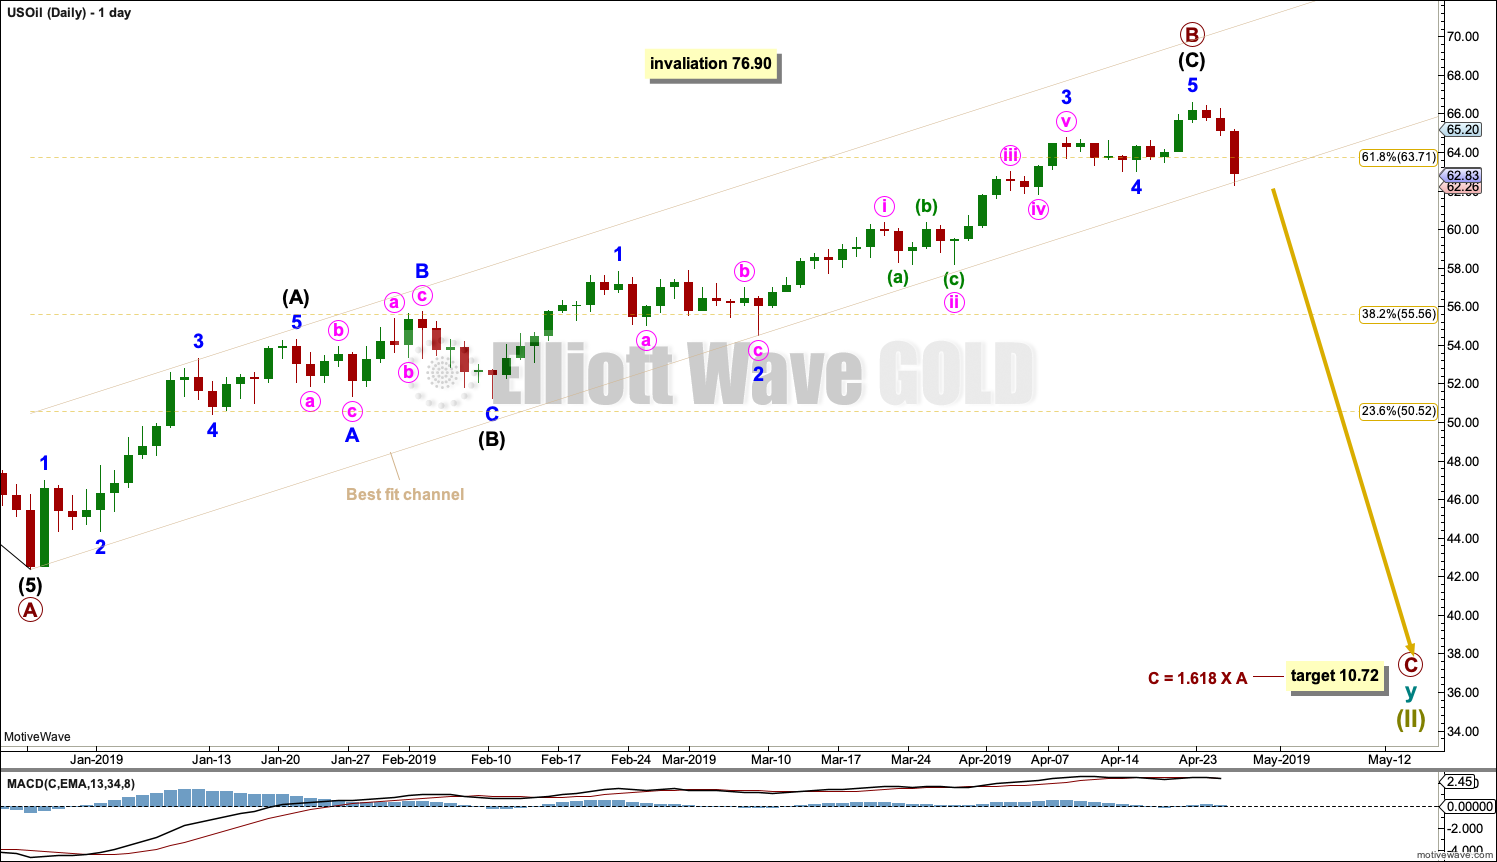
Primary wave B is now labelled as a complete single zigzag.
Note that monthly and weekly charts are on a semi-log scale, but this daily chart is on an arithmetic scale. This makes a slight difference to trend channels. Use this channel on a daily chart on an arithmetic scale.
The channel is drawn conservatively to contain all of the bounce of primary wave B. If a full daily candlestick is printed below and not touching the lower edge of this channel by a red daily candlestick, then that may be taken as indication primary wave B is over and primary wave C downwards has begun. At that point, the invalidation point may then be moved down to the high labelled primary wave B.
Primary wave C may last at least a year, and possibly longer. It may be extended in time; the subdivisions of intermediate waves (2) and (4) may show up at the weekly time frame.
TECHNICAL ANALYSIS
MONTHLY CHART
Click chart to enlarge. Chart courtesy of StockCharts.com.
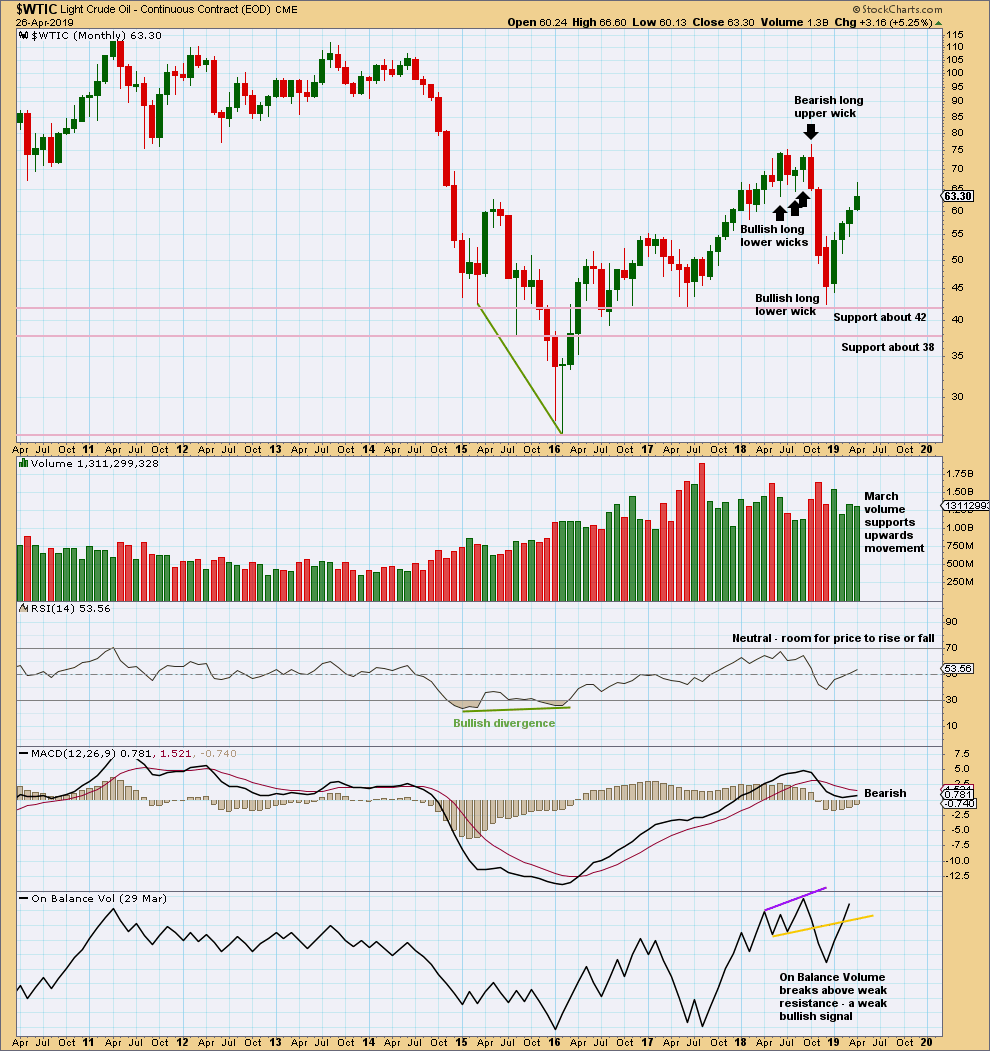
This upwards bounce may be tiring.
WEEKLY CHART
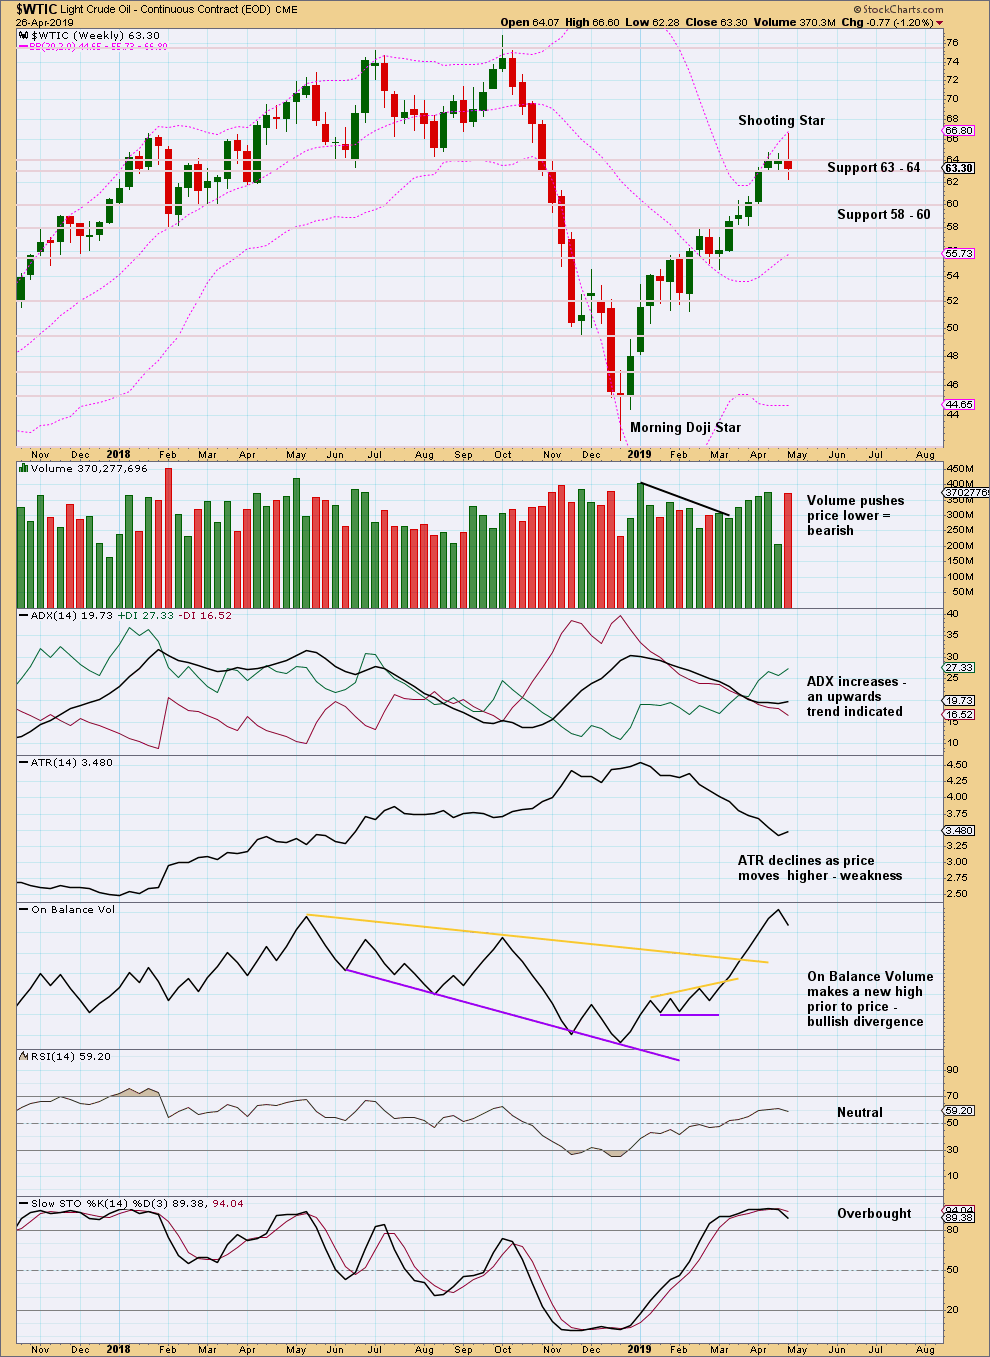
Click chart to enlarge. Chart courtesy of StockCharts.com.
A Shooting Star candlestick pattern is a bearish reversal pattern when it comes at the end of an upwards movement.
This week completed an outside week with the balance of volume downwards and a red candlestick. Volume during the week supports downwards movement. This adds significance to the Shooting Star pattern.
DAILY CHART
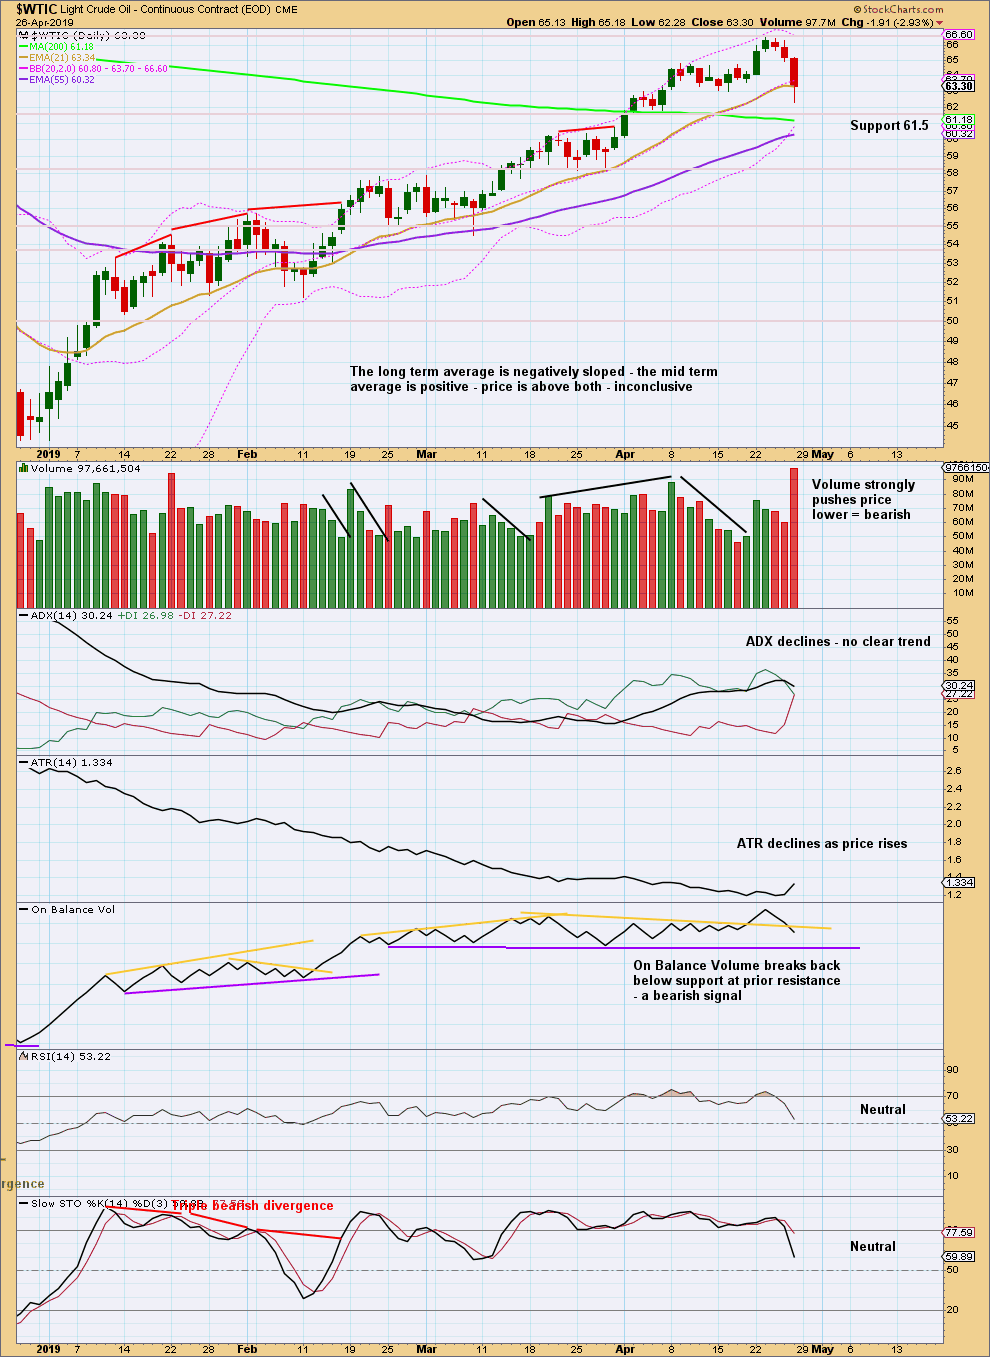
Click chart to enlarge. Chart courtesy of StockCharts.com.
Since the 24th of December 2018 there has been a series of higher highs and higher lows, the basic definition of an upwards trend. Assume this will continue until proven it has ended. A lower low below the low of the 28th of March 2019 would provide evidence the bounce is over.
Divergence between price and On Balance Volume almost disappeared at the last high. The signal from On Balance Volume is weak because this line was weakened by the prior bullish breach.
The short-term volume profile is strongly bearish. In conjunction with extreme RSI at highs and now a bearish reversal pattern on the weekly chart, it does look here like Oil may have finally found a high.
—
Always practice good risk management as the most important aspect of trading. Always trade with stops and invest only 1-5% of equity on any one trade. Failure to manage risk is the most common mistake new traders make.
Sometimes I trade based on “tape reading” and gut. I’ve decided to close my short gold positions and wait after this rather unexpected move today. It appears there is a more complex corrective pattern taking shape, and I am suspecting 1300 needs to be tested again. I certainly could be wrong, however, I’ve decided to start a short position in the S&P 500 (2935) while I wait patiently for the gold correction to play out. I’ve made significant profits in both my equities account (long JDST) and my futures account (short GC) utilizing Lara’s analysis, and I could easily see gold “hanging in there” while a small correction plays out in the S&P 500 overt the next week. Another test of gold’s recent lows that fails and I’m likely going to re-enter the gold short trade (on the smaller side). Alternatively, if we get a stall again in the 1290 to 1300 area, then I’d re-establish my gold short trade (on the bigger side). Have a great weekend to all!
Corey
I agree, Friday ended strongly for Gold and there is some support from volume. On the daily chart Friday completes a Bullish Engulfing pattern.
It looks like the neck line of the H&S pattern may be tested again, about 1,290.
For the short term the EW count now will see minuette (ii) continuing as a regular flat, target 1,288.52.
Thank you for that reply Lara. At the US futures open here on Sunday night, I’ve elected to take my S&P short profits (I trade futures) at 2896 and re-establish a medium size short gold position at 1286. Whenever markets knee-jerk, I often try to take advantage of opposite side. Will probably increase my short gold position measurably over the next day.
S&P500:
I am now expecting primary 3 has ended and primary 4 has arrived. I expect primary 4 to last about two weeks or so and to be relatively shallow. If it is long lasting or deep enough it may find support at the lower edge of the maroon Elliott channel.
FWIW, here is my chart showing potential H&S pattern(s) on GDX. Please note, the trendlines as shown are not drawn in an orthodox or classical manner. I have them essentially with no slope, more like the bottom of a consolidation period.
At this point I favor the Alternate as shown in purple. Actually, though, both may be considered valid patterns at the same time. These are supported by Lara’s Gold wave counts.
Thanks for sharing Rodney.
It’s not a really clear one is it. But either way, whether we’re noting a H&S pattern or a triangle, there’s been a trend change to down now for GDX.
Hi Lara,
(S&P 500)
Thanks for the second wave monthly count…. It makes a lot of sense… You are such a genius at your analysis.
The lessons that I am always learning about the markets is that we have to be open minded at all times for all possibilities.
Thanks again.
Mathieu
You’re welcome.
But, to be fair, moving the degree of labelling is a very simple thing to do to consider an alternate idea.
I’m really interested in the implications for the economy over the next decade or so from that alternate.
Theres so much geo political uncertainty (there always is) thats obviously beyond the scope of these analyses but these do effect markets. And a US presidential election 18 months away to boot. To me its interesting that in some of your analyses the beginning of the bear market (and perhaps a beginning of a new grand super cycle wave) may correspond with the election
Rich
The underlying theory of Elliott wave is that it is social mood, us, that moves markets and creates the news. That news follows the markets, that it is our social mood that creates geopolitical events, and those events follow markets.
It’s a really controversial point, almost no one today accepts it.
But it’s a fundamental aspect of EW.
When I watch or read news I focus on my local New Zealand news. I’m often unaware of geopolitical events and meetings that are supposed to affect markets. I do this partly because it all seems like so much noise, and also because this way it doesn’t affect my analysis. I’m just focused on the charts and the numbers.
Hi Lara,
Question about VIX on the S&P…. Is it possible that the VIX can increase when the S&P 500 is about to or is breaking out in the upward direction?
Thanks
Mathieu
Hi Lara
On the same subject as Mathieu, regarding inverted VIX as an indicator of a trend change, haven’t you stated in the past that you don’t give much weight to inverted VIX in terms of divergence?
Thanks as always and I second Mathieu’s point about the excellent effort at creating the second wave count on the monthly charts.
Rich
“Is it possible that the VIX can increase when the S&P 500 is about to or is breaking out in the upward direction?”
Yes. I can do whatever it likes. It did this at the weekly chart level for the three weeks up to the high in January 2018. Price moved strongly higher for three weeks, but VIX also moved higher for three weeks. That was a warning that primary 3 was about to end and the triangle for primary 4 then arrived.
“haven’t you stated in the past that you don’t give much weight to inverted VIX in terms of divergence?”
I have. A single signal on its own I will give no weight to. A weak signal also, like when the price candlestick is unclear (higher high, higher low, but red candlestick and balance of volume down).
But when the signal is clear and strong and there is a cluster of them, then I will give it some weight.