
Last analysis on the 16th of May expected a relatively brief and shallow fourth wave correction to be followed by possibly explosive upwards movement for a fifth wave.
Summary: For the short to mid term, look out for an explosive upwards movement. When 1-3 weeks of vertical movement are seen with some decline in volume on the last week, then look out for a sharp turn and a deep correction. If bearish divergence between price and RSI persists, then have more confidence in a reversal.
The deep correction to come may be anywhere from about 0.65 to 0.95 of the first wave up (which began at 3,169.53 on 15th December 2018). At its end, it may offer an excellent buying opportunity for Bitcoin.
The data used for this analysis comes from Yahoo Finance BTC-USD.
All charts are on a semi-log scale.
MAIN ELLIOTT WAVE COUNT
MONTHLY
Click chart to enlarge.
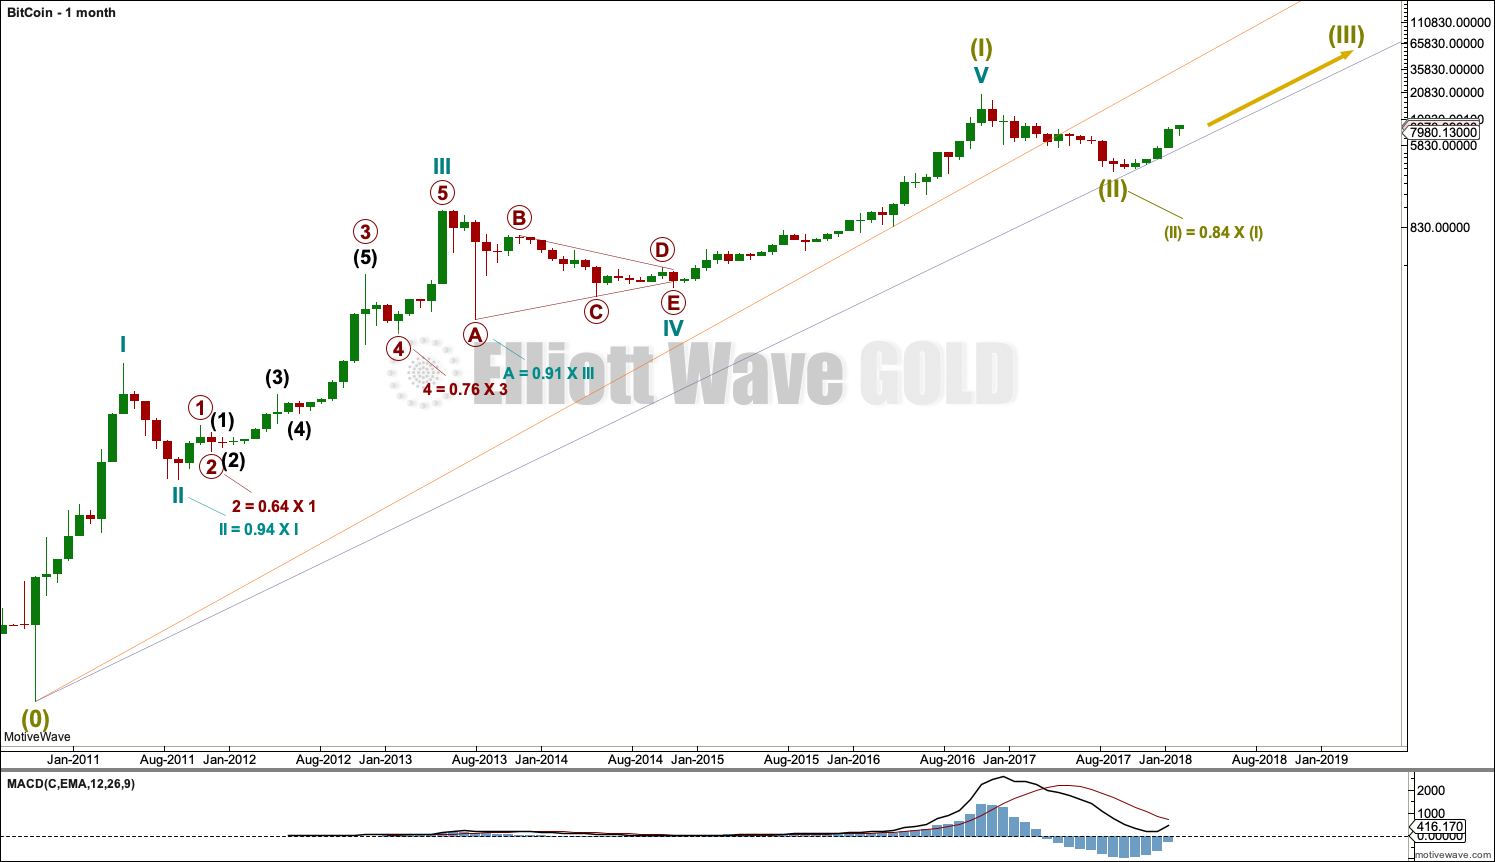
It is possible to see a completed five wave impulse upwards for Bitcoin.
I am unable to find reasonable Fibonacci ratios within this wave count. It appears that Bitcoin may not exhibit Fibonacci ratios very often between its waves, so this makes target calculation impossible. Classic technical analysis was used to identify a high in place on December 23, 2017.
What is very clear from this chart is that Bitcoin forms classic bubbles. It has done so now several times and may now be doing so again. This looks like an even larger bubble than the Tulip Mania. So far each bubble has popped and Bitcoin has collapsed, to then thereafter form a new bubble. Each bubble is larger than the one prior; so if another Bitcoin bubble is forming, it may be expected to take price substantially above the all time high.
Bitcoin tends to behave like an extreme commodity: price moves upwards for about 2 – 4 weeks in a near vertical movement at the end of its rises. Following this vertical movement the resulting downwards movement is very deep (in percentage terms) and often very quick.
The next rise begins slowly with basing action over weeks or months, and then as the rise nears its end another vertical movement completes it. Also, there are volume spikes just before or at the end, which is another feature typical of commodity like behaviour.
This has happened now several times. The most notable instances are the rise up to the week ending 24th November, 2013, and the week ending 5th June, 2011. The following sharp drops were 94% and 93% respectively.
The last instance was the rise up to the last all time high for Bitcoin at 19,870.62 on the 17th of December 2017. The drop thereafter may now be considered as highly likely to be complete. If the drop is complete, it was only an 84% drop.
WEEKLY

Click chart to enlarge.
Super Cycle wave (II) may be a complete zigzag.
Super Cycle wave (III) must move above the end of Super Cycle wave (I) at 19,870.62. It must move far enough above this point to allow room for Super Cycle wave (IV) to unfold and remain above Super Cycle wave (I) price territory.
Super Cycle wave (I) lasted 7.2 years and Super Cycle wave (II) may have been over within just under one year. It would be reasonable to expect Super Cycle wave (III) to last well over 7 years, possibly a Fibonacci 8 or 13 years.
Super Cycle wave (III) must unfold as a simple five wave impulse, and within this impulse there should be two large corrections for cycle waves II and IV. So far cycle wave I may be incomplete. When cycle wave I may be complete, then cycle wave II may offer a good entry to purchase Bitcoin at a very good price. Cycle wave II may correct to about 0.80 to 0.95 of cycle wave I.
DAILY
Click chart to enlarge.
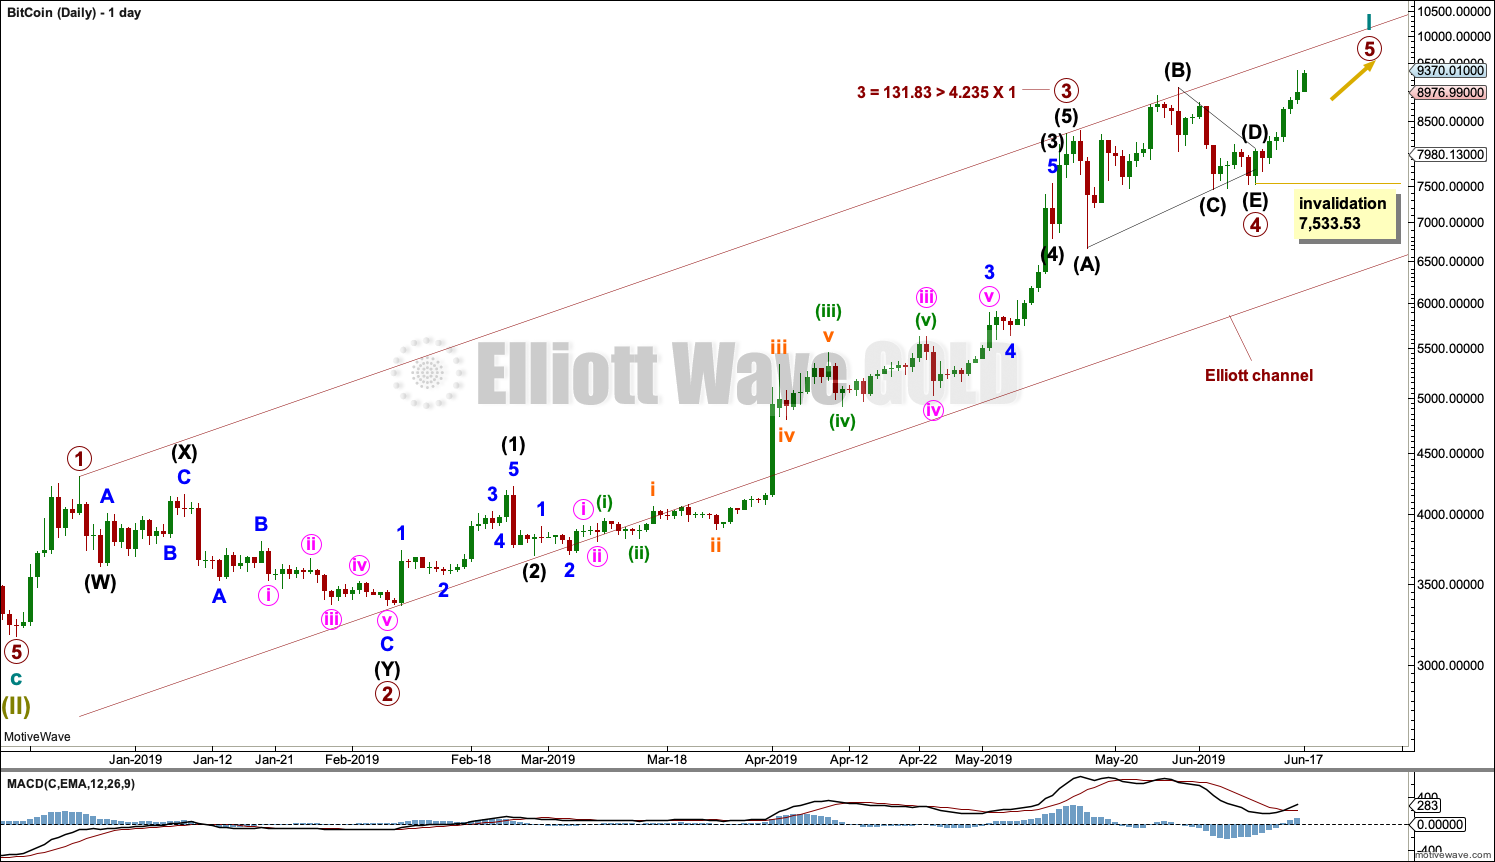
Bitcoin typically forms curved first wave impulses with time consuming and deep second wave corrections, then accelerates through to the end of its third waves, has brief and more shallow fourth wave corrections, and then finishes with explosive fifth waves. This is an extreme behaviour most typically seen in commodities.
This wave count now sees primary waves 3 and 4 complete. There is alternation between a deep 0.83 double zigzag of primary wave 2 and a shallow 0.15 running contracting triangle of primary wave 4. Primary wave 4 is typically more brief than primary wave 2: 44 days to 26 days.
Primary wave 5 may be expected to be explosive. This would be typical behaviour for this market.
Atypically, there is a Fibonacci ratio between primary waves 3 and 1. No Fibonacci ratio between primary wave 5 and either of primary waves 3 or 1 should be expected.
Within primary wave 5, no second wave correction may move beyond its start below 7,533.53.
ALTERNATE WAVE COUNT
WEEKLY
Click chart to enlarge.
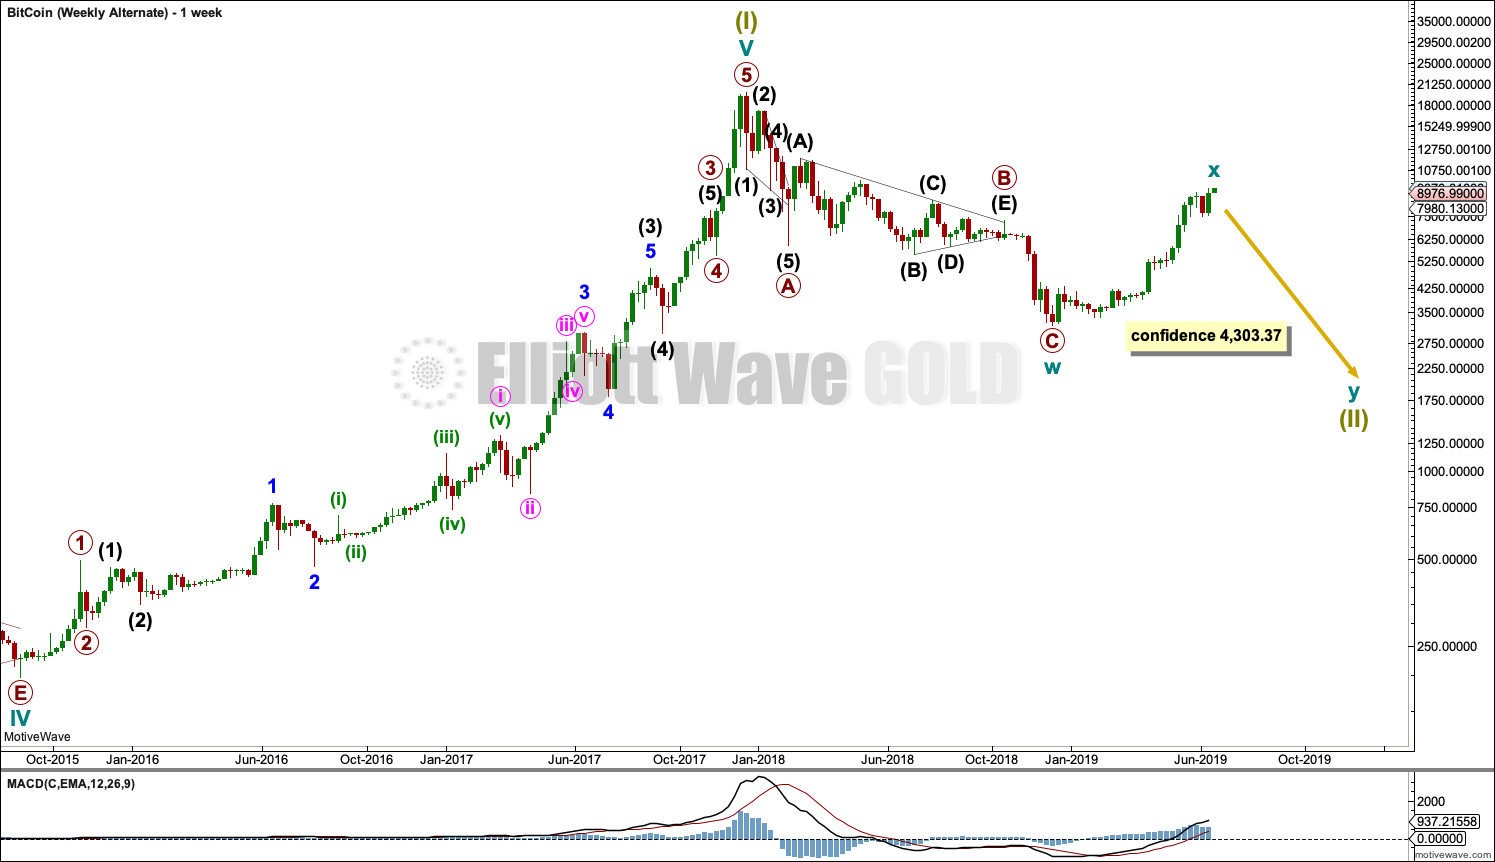
This wave count is identical to the main wave count up to the all time high for Bitcoin. Thereafter, it moves the degree of labelling within Super Cycle wave (II) all down one degree. It is possible that Super Cycle wave (II) may not be complete and may continue lower as a double zigzag. Double zigzags are fairly common Elliott wave corrective structures.
Within the double zigzag, cycle wave x may now be complete. Cycle wave y may begin.
The purpose of a second zigzag in a double is to deepen the correction when the first zigzag does not move price deep enough. To achieve this purpose cycle wave y may be expected to move reasonably below the end of cycle wave w at 3,169.53.
Within multiples, there is no rule stating a limit for X waves. There can be no Elliott wave rule to apply to cycle wave x to determine when this wave count would be invalidated.
DAILY

Click chart to enlarge.
Cycle wave x must subdivide as a corrective structure and would most likely be a zigzag. It will not fit as a triangle, flat or combination, and so it is labelled as a zigzag.
This wave count now has a very serious problem with behaviour which does not fit this market. For cycle wave x to be counted as a zigzag, there is now gross disproportion within primary wave C between minor waves 2 and 4. Minor wave 4 is much more time consuming at 24 sessions to minor wave 2 at only 2 sessions. This market typically exhibits disproportionate fourth and second waves, but with the fourth wave more brief than the second.
This wave count will now be discarded at this time based upon exceptionally low probability. This adds a little confidence to the main wave count and the idea that Bitcoin may be forming a new bubble.
TECHNICAL ANALYSIS
WEEKLY
Click chart to enlarge.
The following characteristics can be noted at the end of prior major highs for Bitcoin:
The first sharp rise to the week beginning 5th June 2011: near vertical movement for several weeks, a sharp volume spike for a blow off top on the final week, and no candlestick reversal pattern on the weekly chart but an Evening Doji Star on the daily chart. The following correction was 0.94.
The next sharp rise to the week beginning 7th April 2013: near vertical movement for three weeks, a sharp volume spike on the final week that closed red and formed a Bearish Engulfing pattern on the weekly chart, a Bearish Engulfing pattern on the daily chart, ADX remained very extreme for most of the rise, and single week bearish divergence between price and RSI at the end. The following correction was 0.82.
The next sharp rise to the week beginning 24th November 2013: vertical movement for four weeks, a strong rise in volume until the last week (which saw volume fall), a Bearish Engulfing pattern on the weekly chart, an Evening Doji Star on the daily chart (the third candlestick of which had strong support from volume), ADX reached very extreme for many days, and RSI reached extreme overbought and there exhibited single bearish divergence. The following correction was 0.93.
The last sharp rise to the all time high at 19,870.62 on the 17th of December 2018: vertical movement for three weeks, a strong increase in volume up to the last week (which saw a fall in volume), a Bearish Engulfing pattern on the weekly chart that had support from volume; on the daily chart, ADX reached very extreme for a coupe of weeks or so, RSI reached overbought and there exhibited single bearish divergence, and early downwards movement from the high had support from volume. The following correction was 0.84.
Some conclusions may be drawn about how to identify a major high in Bitcoin:
– Look for vertical movement on the weekly chart for at least two weeks, and possibly up to several (although when it is more than three the movement may be interspaced with a small pause).
– Look for either a sharp volume spike for a blow off top, or a strong increase in volume then followed by a single week of lighter volume at the possible high.
– A bearish candlestick reversal pattern has been seen so far at every major high for Bitcoin, so an absence of any candlestick reversal pattern at a potential high should be viewed very suspiciously.
– ADX is of no use as it may remain very extreme for long periods of time.
– RSI may also remain very extreme for long periods of time and may not exhibit any divergence, but it may add a little confidence in the high if it does exhibit bearish divergence in conjunction with other indicators being bearish.
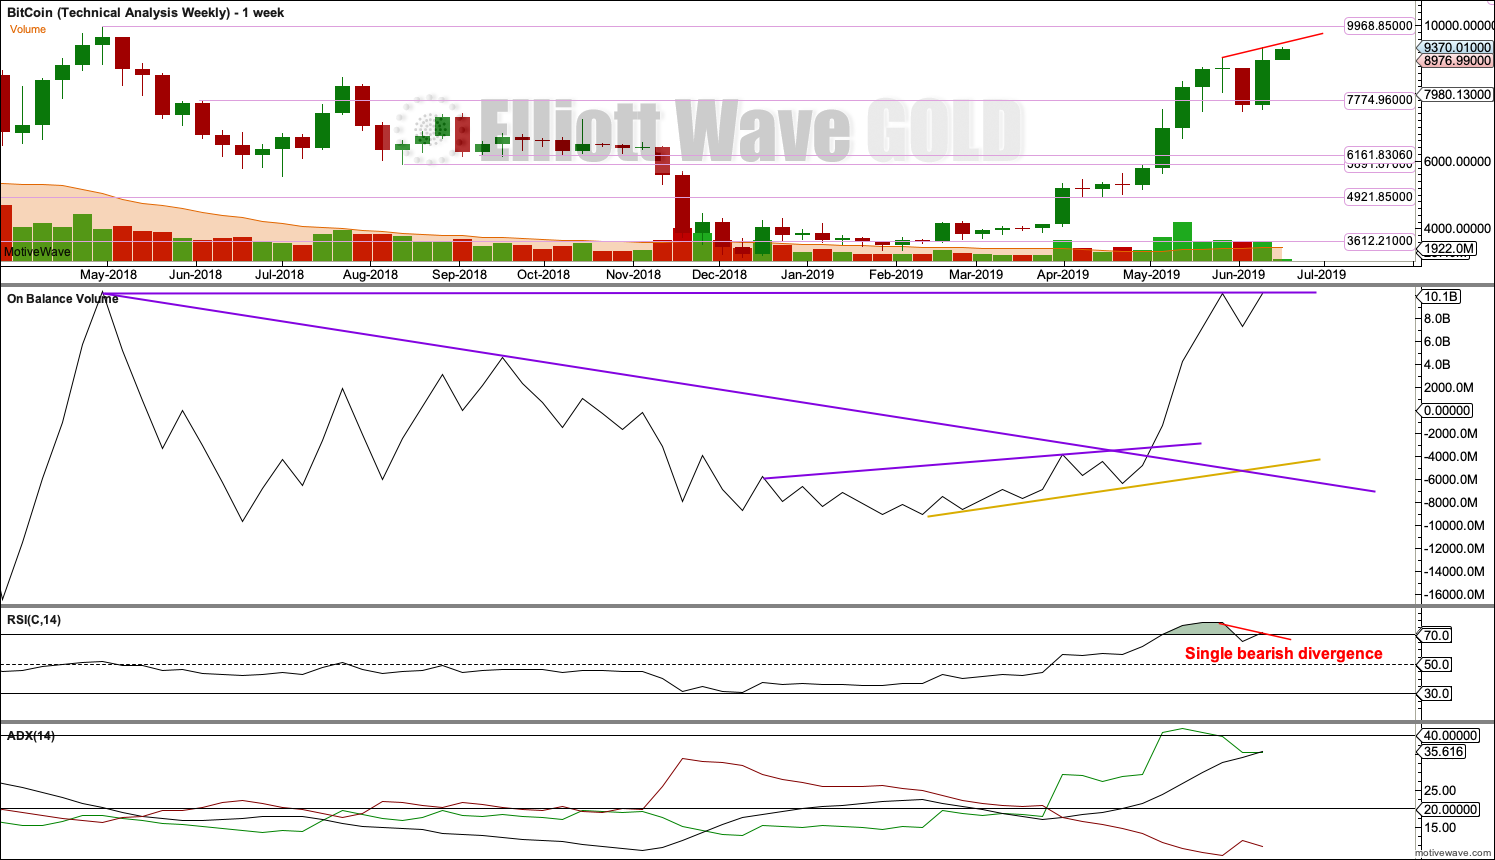
The last vertical rise in price up to the week beginning 26th May 2019 has been interspaced by a brief correction and now price is rising again. Look now for a short 2-3 weeks of vertical rise. If bearish divergence between price and RSI persists, then be alert for a sharp reversal and a large fall in price after the expected vertical rise.
There is a cluster of resistance above about 9,970 to 11,800.
DAILY
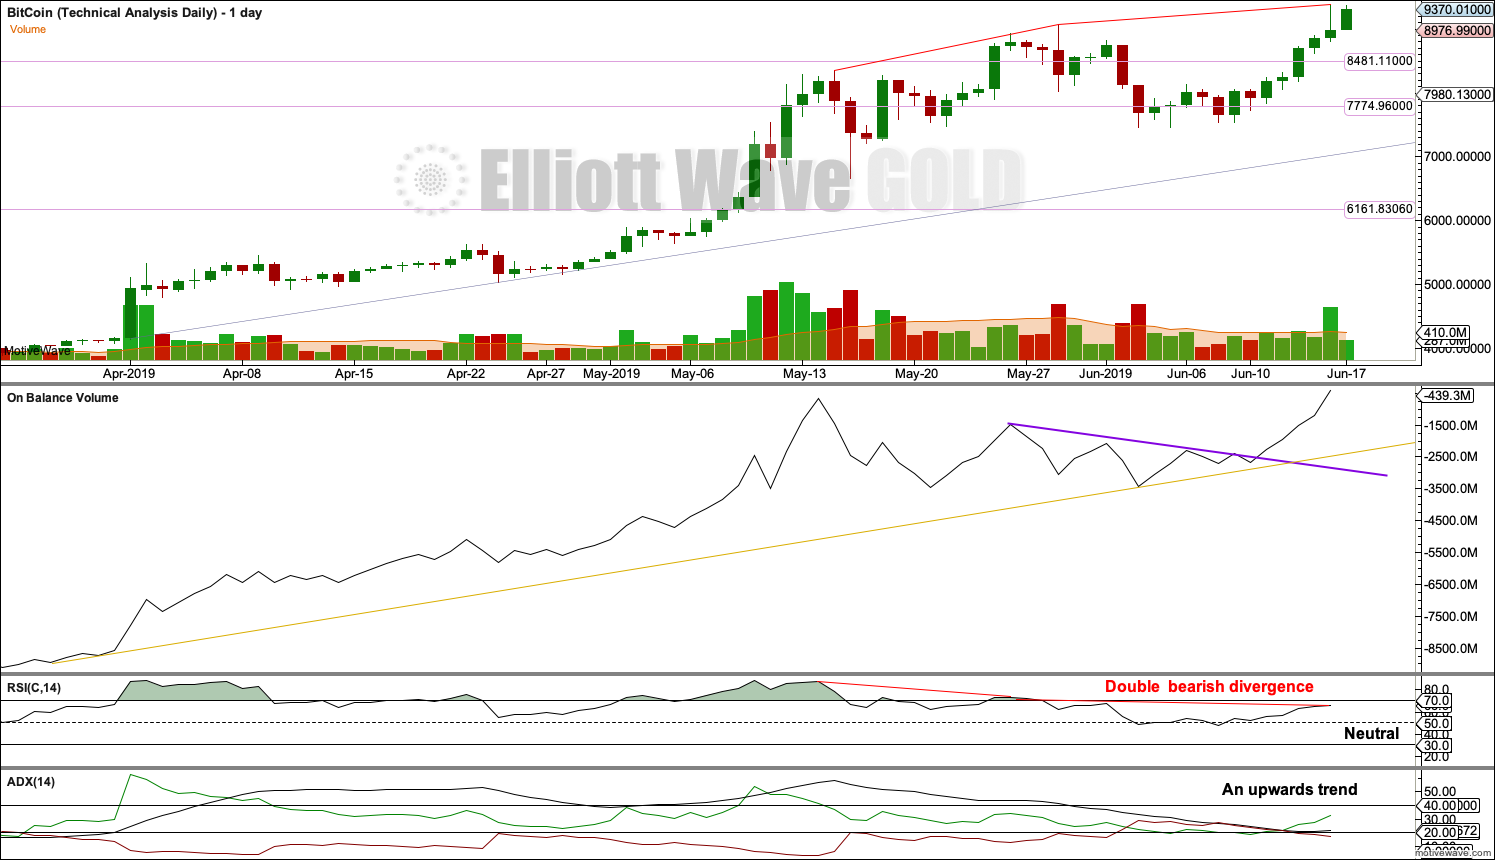
Click chart to enlarge.
A support line is drawn for price. While price remains above this line, assume the trend remains upwards.
Bearish divergence between price and RSI is a strong warning that the current rise in price may end sooner rather than later. However, this divergence on its own is not a signal and sometimes can simply disappear.
Published @ 06:54 p.m. EST.
—
Careful risk management protects your trading account(s).
Follow my two Golden Rules:
1. Always trade with stops.
2. Risk only 1-5% of equity on any one trade.
—
New updates to this analysis are in bold.
Thank you for sharing your analysis, Lara, it is a thorough analysis and carries some interesting insights, particularly for an inexperienced elliottician such as myself. Two contrarian topics, if I may: I don’t understand why you keep referring to a SuperCycle degree when your own wave notation refers to it as a multi-decade 40-70 year degree. You also keep referring to Bitcoin as a bubble (over and over) and make a depreciative comparison to the Tulip Mania, but that’s not technical, so I guess it shouldn’t really matter.
I’m not quite sure what you mean by Bitcoin not following Fibonacci Ratios, either. This is just such a perfect textbook Fibonacci market to me… like the 4.618 we just made on Intermediate Wave 3 ending, if I’m not mistaken, on May, 14th, the perfect golden ratio triangle waves for Intermediate Wave X in the bear market last year, and so many other examples. Would you care to comment on this point? Thank you again attention and shared content.
Hi Miguel, thanks for the constructive comment.
Bubbles and identification of them is a part of technical analysis. My CMT level III exam used the recent Chinese stock market and crash as an example of a bubble, it’s something that is identifiable. When price moves up vertically and reaches very extreme over extended conditions, with price highly over valued in relation to some system of valuation and then price turns sharply and crashes, it meets the definition of a bubble. Bitcoin has done this several times. A bearish move of over 80% well exceeds the technical definition of a bear market (20%) and meets the expectation of a crash in that it should be a sudden and dramatic decline. My comparison to the Tulip Mania isn’t necessarily depreciative, I make no value judgement on whether this bubble is good or bad. In fact, I see it as an opportunity. I’m simply making a comparison to a relatively well known bubble in history and trying to point out that the price history of Bitcoin shows it’s behaviour is more extreme.
In my Bitcoin analysis of Super Cycle wave (I) there are no Fibonacci Ratios at cycle degree, only one at primary degree (P5 to P3 within cycle I) and very few at lower degrees. That is what made target calculation at the end of Super Cycle wave (I) so very difficult.
4.618 is not a Fibonacci ratio. You may find this brief explanation of Fibonacci Ratios helpful? I have noted the ratio between primary waves 3 and 1 (I’ve made a mistake on my chart too, the notation should reach 3 = 131.83 > 4.236 (not 4.235) X 1). I can’t see an intermediate X in my wave count so I don’t know what you’re referring to there. The triangle within the recent bear market I have labelled cycle wave b, and within it I can find no adequate Fibonacci Ratios. I can see no triangle sub-wave which is 0.618 to its predecessor. If you’re seeing something different then please do point out my error.
Finally, you’re right in my choice of degree of labelling in that it sees a Super Cycle wave which is less than 40 years. It is certainly possible to move that all down one degree, to see only cycle wave I over at the all time high for Bitcoin, and that may have a better fit. If Bitcoin does make a new all time high as my count expects then I may need to move the degree of labelling down one. It makes zero difference to EW structure, target calculation or expectations for future structure. Getting the degree right is one of the hardest things in EW, and it’s important to be open and flexible to changing it. Also, the guidelines for how long waves should last are really rough guidelines only.
Regarding technical research, I can only conclude you didn’t actually read the analysis in this post nor previous posts for Bitcoin. Also, you ignore the fact that my Bitcoin analysis has been remarkably accurate in pinpointing the last major high, and a sharp fall after that.
I really do wonder sometimes why people want to nitpick this analysis, not offer their own, and don’t seem to want to follow someone who has a public track record of accuracy. I mean, what more could you possibly want? Perfection?
Your comment that this analysis “flies in the face of EW” is the most amusing. You’ve not noted how or where. Just random negativity.
Blocked.
great work Lara
thank you for your effort
you are the # 1 in Elliott Waves in world
Thank you very much
On weekly 1 – is there a chance this is over now?
If not, where are we putting the target ?
Thank you.
Yes, it’s possible that cycle I could be over. But I don’t think so, because it hasn’t ended with vertical upwards movement. Which it has every other time a wave of a major degree (intermediate, primary or cycle) has ended. So I wouldn’t be expecting it to do something entirely new this time.
I have not calculated a target because Bitcoin rarely exhibits Fibonacci Ratios. Here within cycle I there is already a Fibonacci ratio at primary degree, and so it would be exceptionally unusual for primary 5 to exhibit a Fibonacci ratio to either of primary waves 3 or 1. That makes target calculation for primary 5 to end impossible.
I do not calculate targets for Bitcoin because of the lack of Fibonacci Ratios it exhibits bits. I will be using classic TA to identify a high as soon after it has happened as is possible.