

S&P 500
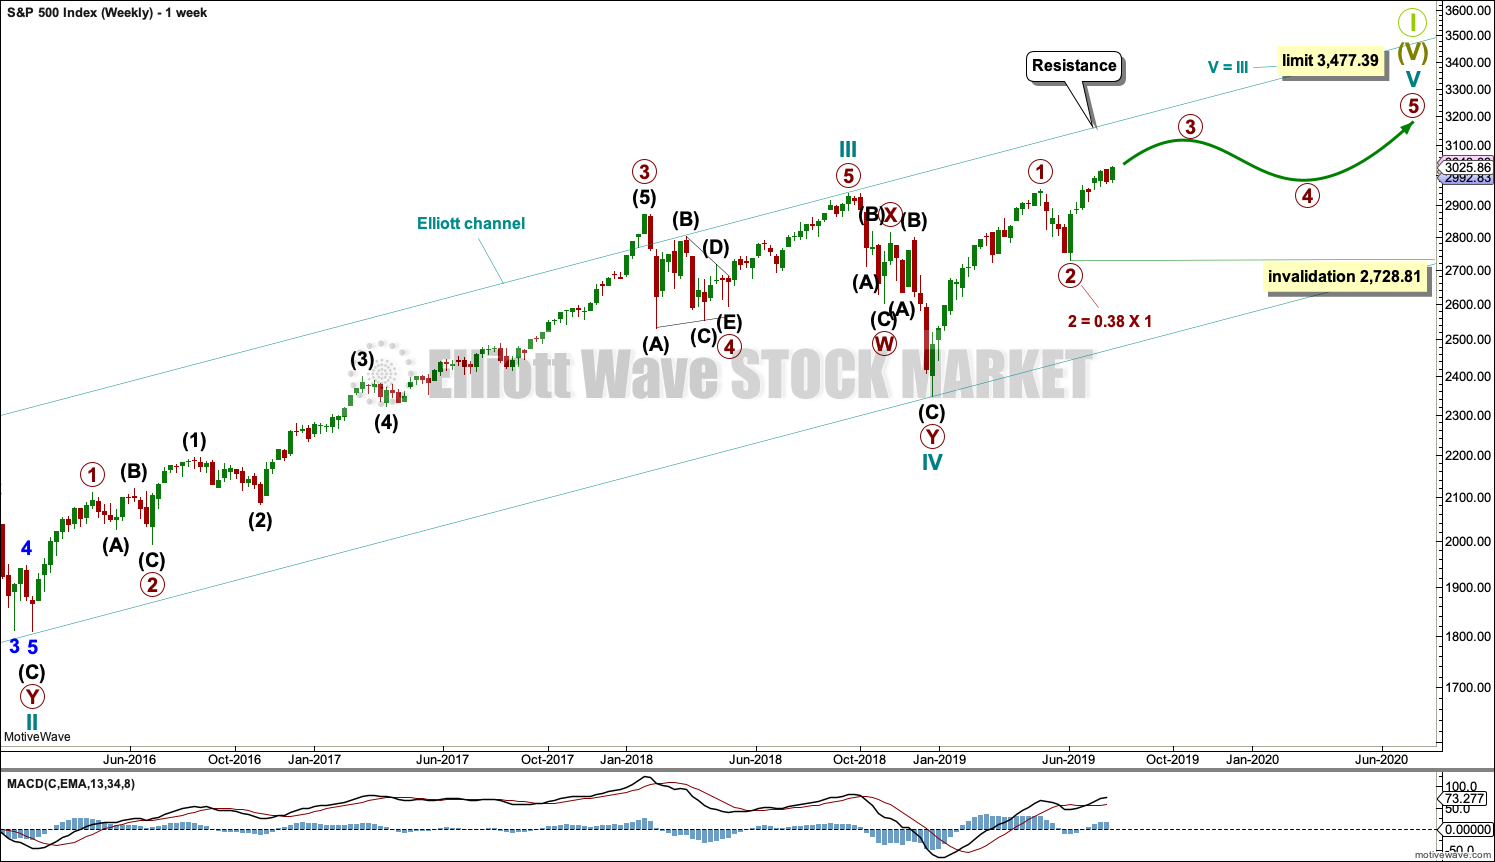
The middle of a third wave may be unfolding as expected. Elliott wave targets remain the same.
Summary: A short-term target for the middle of a third wave to end is now at 3,097. A mid-term target for a third wave at intermediate degree is at 3,148.
Use the best fit trend channel as a guide to where pullbacks may find support along the way up.
The biggest picture, Grand Super Cycle analysis, is here.
Monthly charts were last published here, with video here. There are two further alternate monthly charts here. Video is here.
ELLIOTT WAVE COUNTS
The two weekly Elliott wave counts below will be labelled First and Second. They may be about of even probability. When the fifth wave currently unfolding on weekly charts may be complete, then these two wave counts will diverge on the severity of the expected following bear market. To see an illustration of this future divergence monthly charts should be viewed.
FIRST WAVE COUNT
WEEKLY CHART
Click chart to enlarge.
The basic Elliott wave structure consists of a five wave structure up followed by a three wave structure down (for a bull market). This wave count sees the bull market beginning in March 2009 as an incomplete five wave impulse and now within the last fifth wave, which is labelled cycle wave V. This impulse is best viewed on monthly charts. The weekly chart focusses on the end of it.
Elliott wave is fractal. This fifth wave labelled cycle wave V may end a larger fifth wave labelled Super Cycle wave (V), which may end a larger first wave labelled Grand Super Cycle wave I.
The teal Elliott channel is drawn using Elliott’s first technique about the impulse of Super Cycle wave (V). Draw the first trend line from the end of cycle wave I (off to the left of the chart, the weekly candlestick beginning 30th November 2014) to the end of cycle wave III, then place a parallel copy on the end of cycle wave II. This channel perfectly shows where cycle wave IV ended at support. The strongest portion of cycle wave III, the end of primary wave 3, overshoots the upper edge of the channel. This is a typical look for a third wave and suggests the channel is drawn correctly and the way the impulse is counted is correct.
Within Super Cycle wave (V), cycle wave III is shorter than cycle wave I. A core Elliott wave rule states that a third wave may never be the shortest. For this rule to be met in this instance, cycle wave V may not be longer in length than cycle wave III. This limit is at 3,477.39.
Within cycle wave V, primary waves 1 and 2 may now be complete. Within primary wave 3, no second wave correction may move beyond its start below 2,728.81.
Cycle wave V may subdivide either as an impulse or an ending diagonal. Impulses are much more common. Ending diagonals normally have second and fourth waves that are deep; the common depth is from 0.66 to 0.81 the prior wave. So far a correction within cycle wave V has not been deeper than 0.5, so a diagonal at this stage looks very unlikely (but remains possible).
In historic analysis, two further monthly charts have been published that do not have a limit to upwards movement and are more bullish than this wave count. Members are encouraged to consider those possibilities (links below summary) alongside the wave counts presented on a daily and weekly basis.
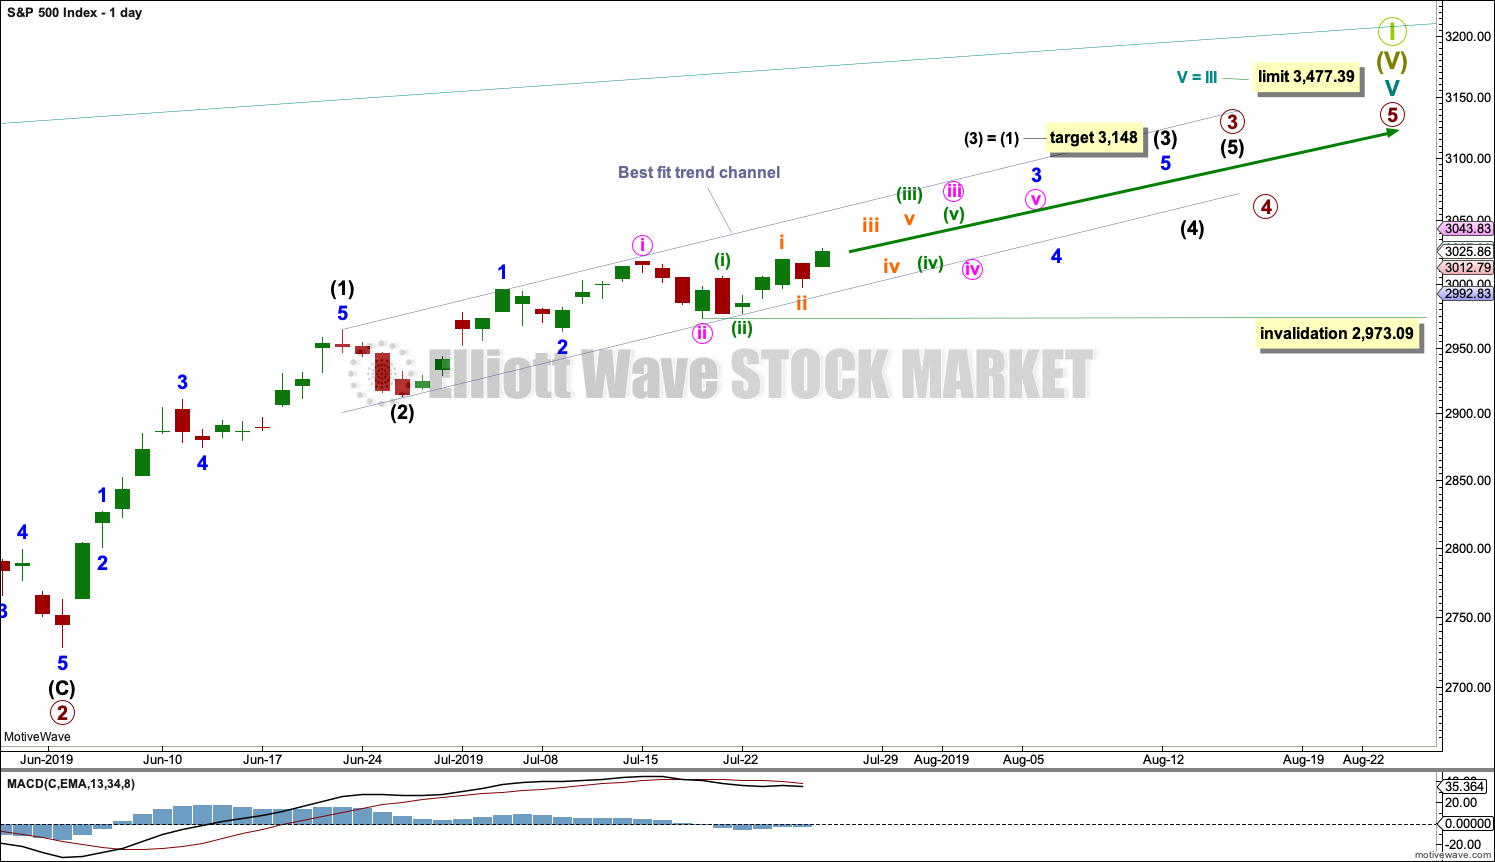
The daily chart below will now focus on price movement from the low of primary wave 2.
DAILY CHART
Click chart to enlarge.
Cycle wave V must subdivide as a five wave motive structure. Within that five wave structure, primary waves 1 and 2 may be complete.
Primary wave 3 must move above the end of primary wave 1 (this rule has now been met). Primary wave 3 may only subdivide as an impulse.
This wave count now sees a series of six first and second waves complete: primary, intermediate, minor, minute, minuette and subminuette. The middle of a third wave up may be underway. It may be expected to exhibit some increase in momentum, and it may have support from volume.
Within minute wave iii, no second wave correction may move beyond the start of its first wave below 2,973.09.
SECOND WAVE COUNT
WEEKLY CHART
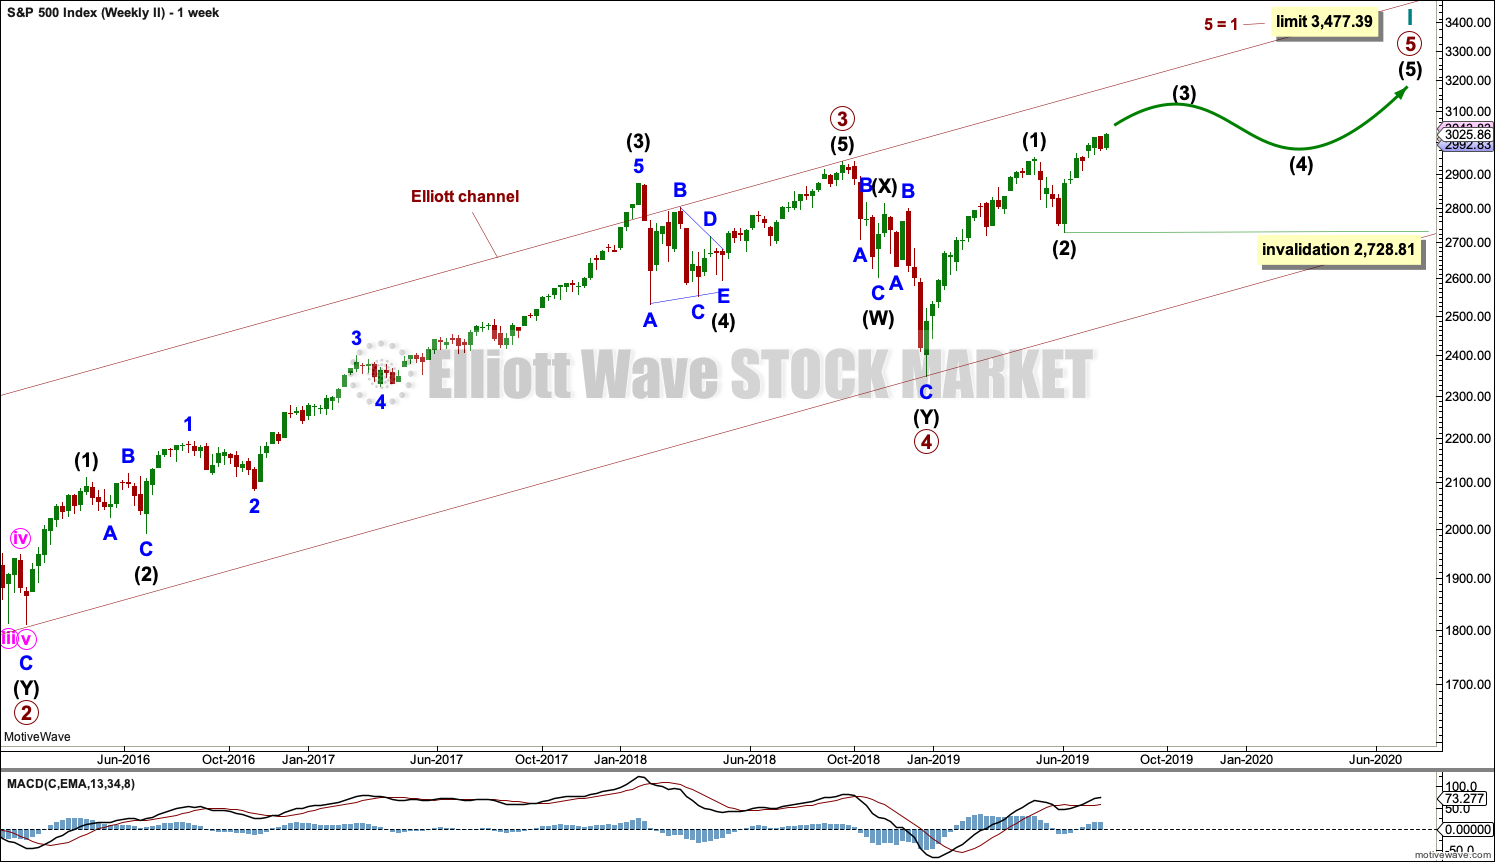
Click chart to enlarge.
This weekly chart is almost identical to the first weekly chart, with the sole exception being the degree of labelling.
This weekly chart moves the degree of labelling for the impulse beginning in March 2009 all down one degree. This difference is best viewed on monthly charts.
The impulse is still viewed as nearing an end; a fifth wave is still seen as needing to complete higher. This wave count labels it primary wave 5.
TECHNICAL ANALYSIS
WEEKLY CHART
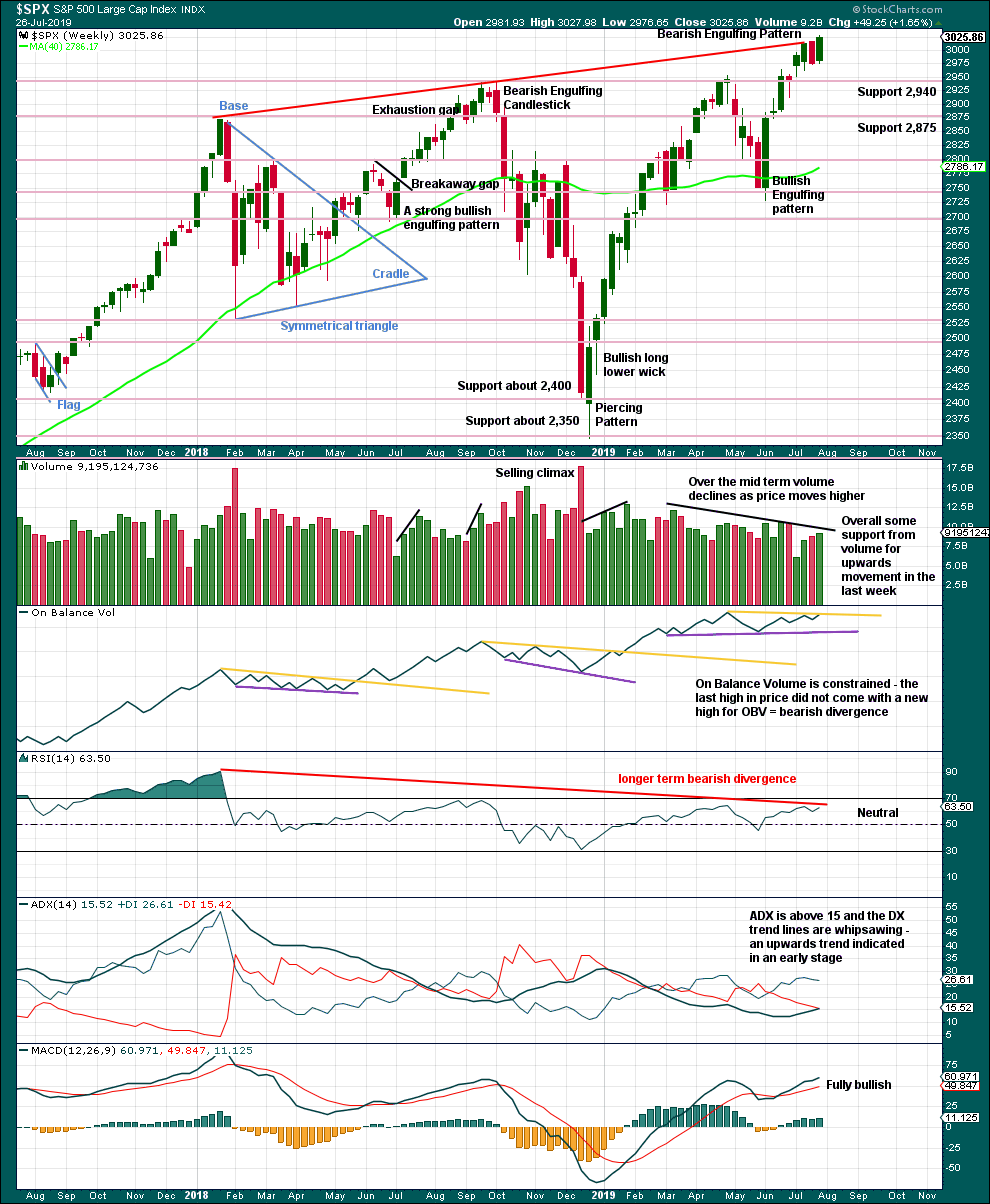
Click chart to enlarge. Chart courtesy of StockCharts.com.
Last week’s Bearish Engulfing candlestick pattern is now negated by a strong bullish candlestick immediately after it. It is considered to have failed to predict any downwards movement.
This week volume offers some support to upwards movement, although the longer-term trend of declining volume with rising price persists.
Bearish divergence between price and On Balance Volume is too slight to be given much weight in this analysis. Sometimes this can just disappear, particularly when it is very weak.
Longer-term bearish divergence between price and RSI may develop further before larger downwards trend begins to resolve it.
The strongest signal ADX can give is when it rises up from low levels and below both directional lines to 15 or above. This week ADX gives a strong signal for an upwards trend, which may be in its relatively early stages.
DAILY CHART
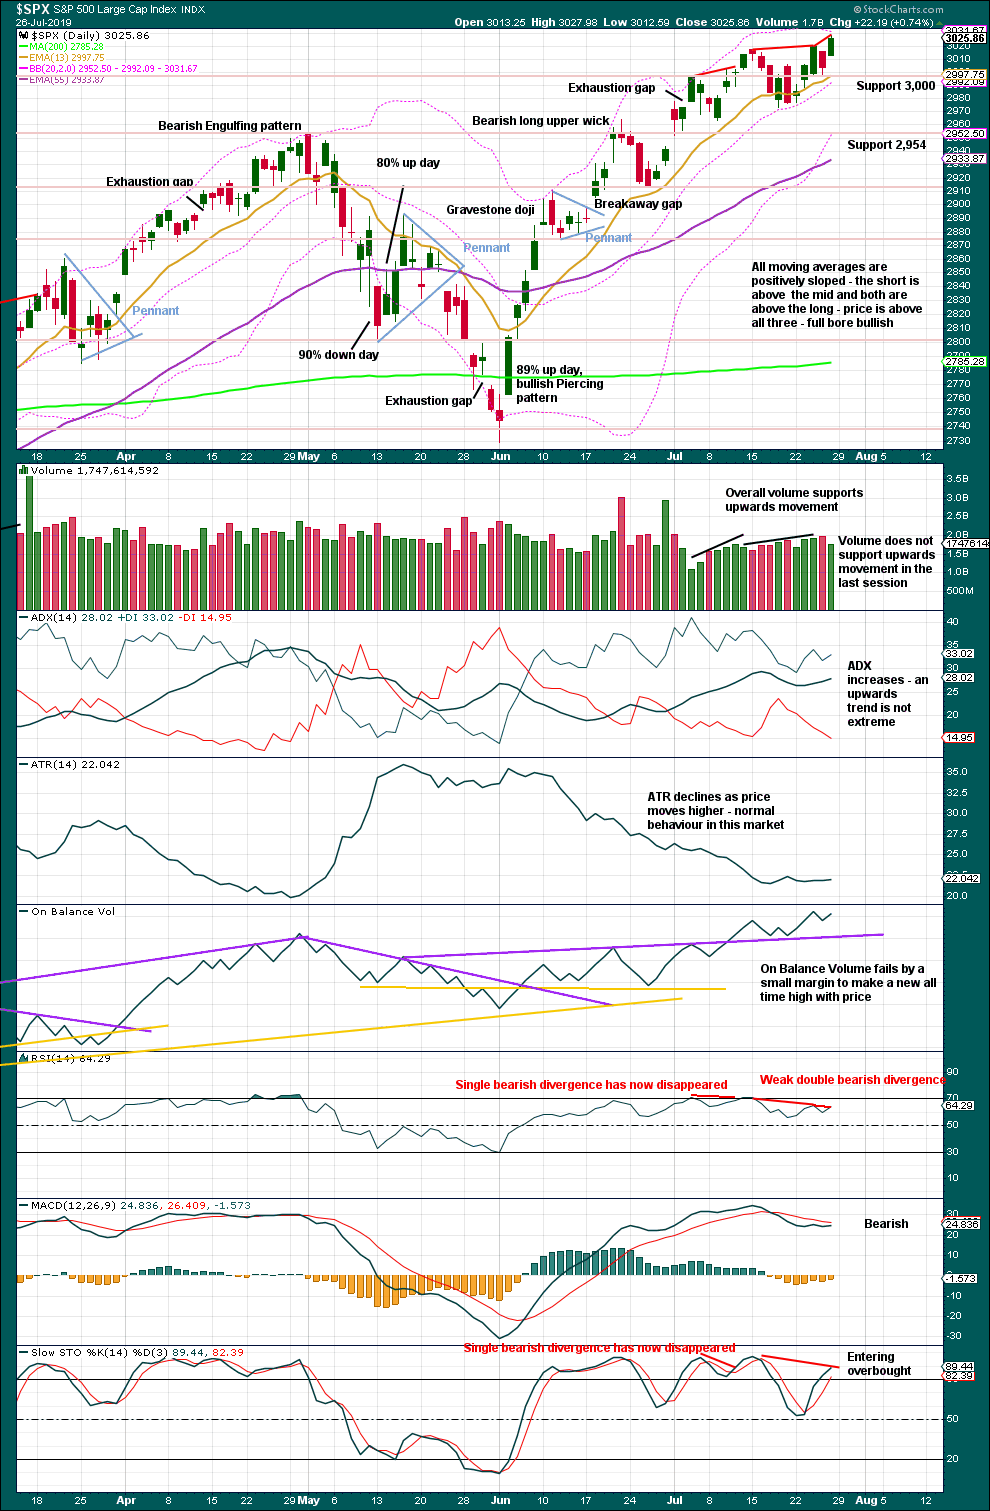
Click chart to enlarge. Chart courtesy of StockCharts.com.
ADX at both daily and weekly chart levels indicates an upwards trend which is not extreme at either time frame.
The small bearish divergence between price and On Balance Volume is not given weight. It is too short term and too weak; it may simply disappear. Likewise, short-term bearish divergence between price and RSI may also disappear.
Support about 3,000 has been tested and has held. It may continue to do so.
BREADTH – AD LINE
WEEKLY CHART
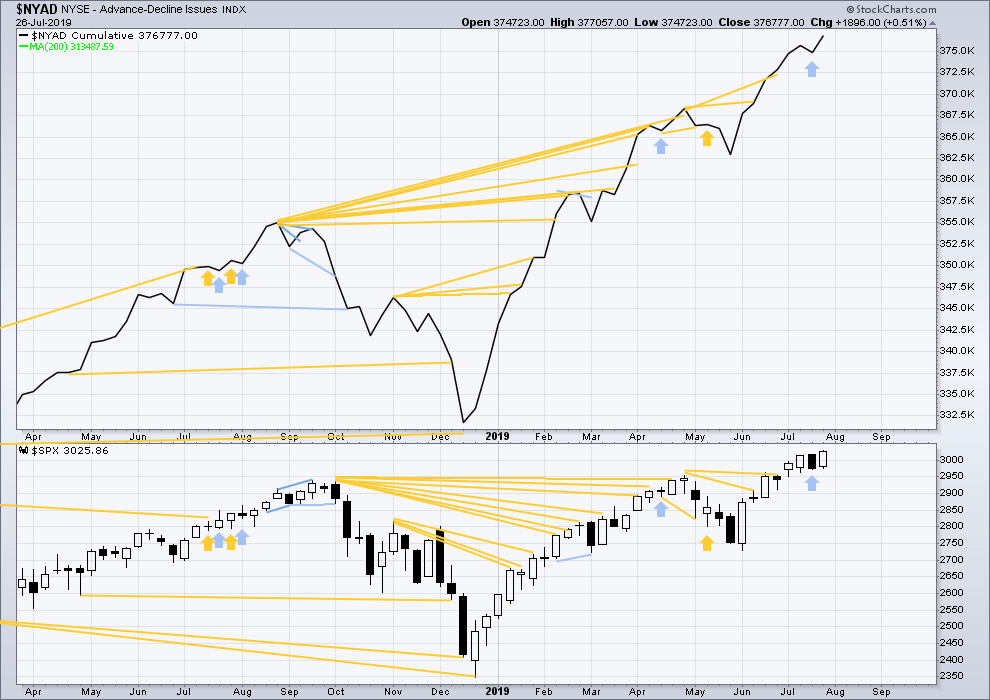
Click chart to enlarge. Chart courtesy of StockCharts.com. So that colour blind members are included, bearish signals
will be noted with blue and bullish signals with yellow.
Bear markets from the Great Depression and onwards have been preceded by an average minimum of 4 months divergence between price and the AD line with only two exceptions in 1946 and 1976. With the AD line making new all time highs again this week, the end of this bull market and the start of a new bear market is very likely a minimum of 4 months away, which is mid November 2019.
In all bear markets in the last 90 years there is some positive correlation (0.6022) between the length of bearish divergence and the depth of the following bear market. No to little divergence is correlated with more shallow bear markets. Longer divergence is correlated with deeper bear markets.
If a bear market does develop here, it comes after no bearish divergence. It would therefore more likely be shallow.
This week both price and the AD line make new all time highs on the weekly chart. There is no divergence.
Mid caps have now made a new all time high this week, but small caps remain below their all time high of 25th February 2019. Weakness is now predominantly in small caps. This is normal behaviour during the later stages of a bull market, and may be expected to develop further before the bull market may end. Tops are a process and that process may last months to even years.
DAILY CHART
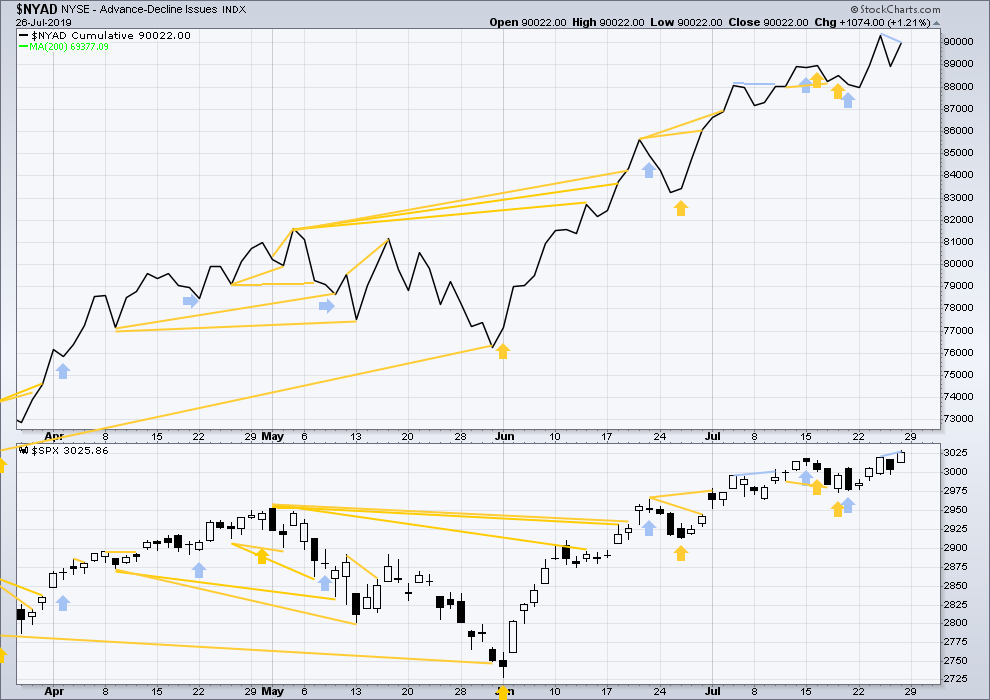
Click chart to enlarge. Chart courtesy of StockCharts.com. So that colour blind members are included, bearish signals
will be noted with blue and bullish signals with yellow.
Breadth should be read as a leading indicator.
Both the AD line and price have moved higher on Friday. Price has made a new all time high, but the AD line has failed to make a corresponding new all time high. This divergence is bearish for the short term.
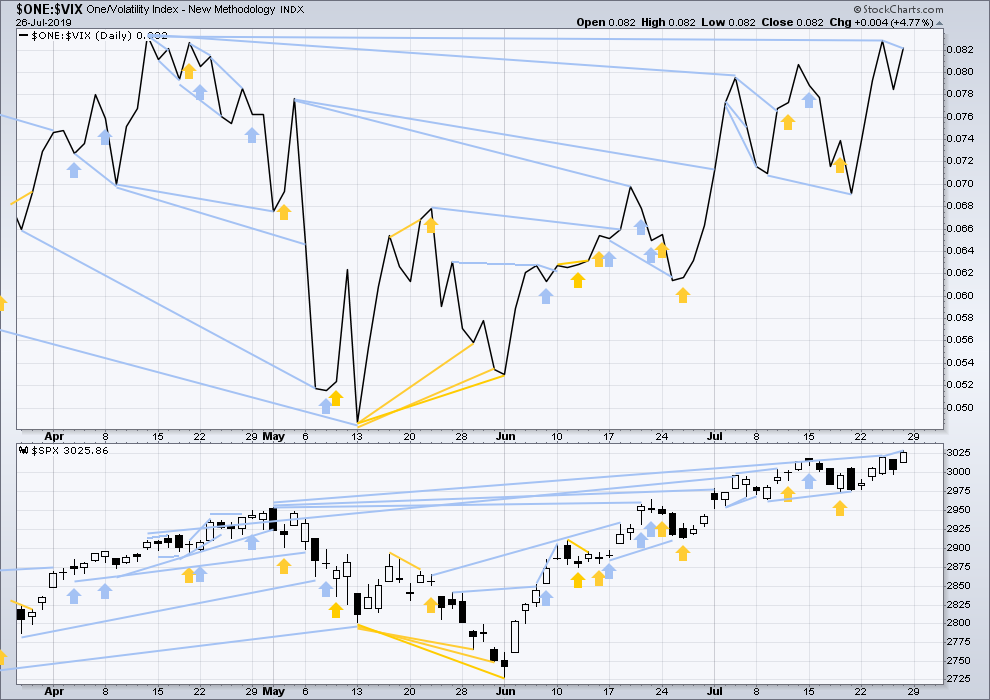
VOLATILITY – INVERTED VIX CHART
WEEKLY CHART
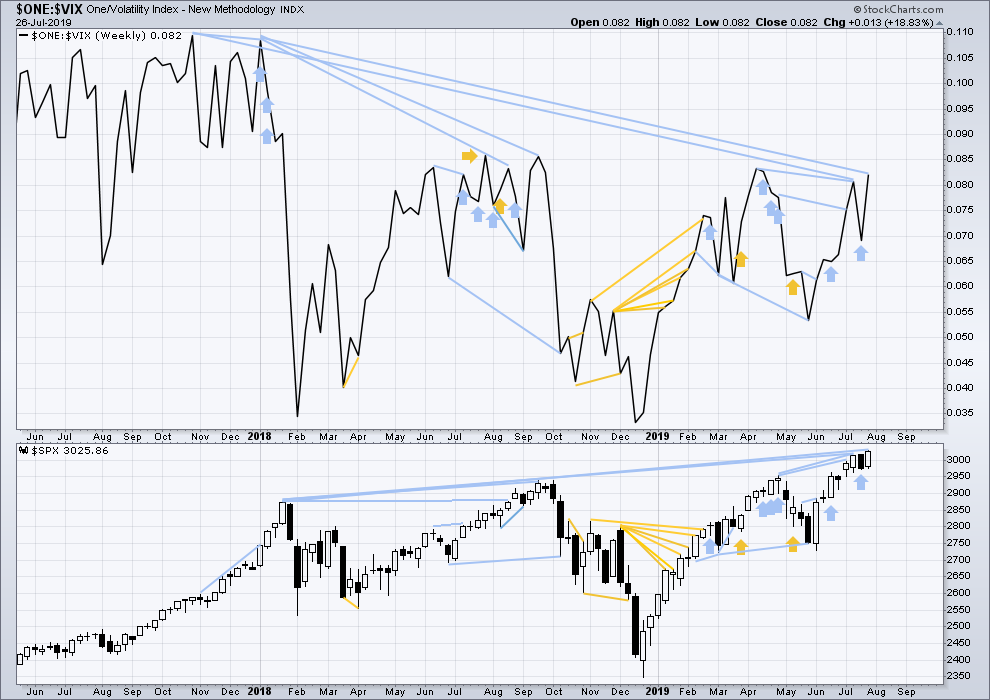
Click chart to enlarge. Chart courtesy of StockCharts.com. So that colour blind members are included, bearish signals
will be noted with blue and bullish signals with yellow.
The all time high for inverted VIX (which is the same as the low for VIX) was on 30th October 2017. There is now nearly one year and eight months of bearish divergence between price and inverted VIX.
The rise in price is not coming with a normal corresponding decline in VIX; VIX remains elevated. This long-term divergence is bearish and may yet develop further as the bull market matures.
This divergence may be an early warning, a part of the process of a top developing that may take years. It may not be useful in timing a trend change.
This week price has made a new all time high, but inverted VIX still exhibits longer-term bearish divergence. For the short term, there is no divergence between price and inverted VIX for the last swing high two weeks ago.
DAILY CHART
Click chart to enlarge. Chart courtesy of StockCharts.com. So that colour blind members are included, bearish signals
will be noted with blue and bullish signals with yellow.
Price has made a new all time high, but inverted VIX has failed to make a new short-term high above its prior high two sessions before. This divergence is bearish for the very short term.
DOW THEORY
Dow Theory confirmed a bear market in December 2018. This does not necessarily mean a bear market at Grand Super Cycle degree though; Dow Theory makes no comment on Elliott wave counts. On the 25th of August 2015 Dow Theory also confirmed a bear market. The Elliott wave count sees that as part of cycle wave II. After Dow Theory confirmation of a bear market in August 2015, price went on to make new all time highs and the bull market continued.
DJIA: 23,344.52 – a close on the 19th of December at 23,284.97 confirms a bear market.
DJT: 9,806.79 – price has closed below this point on the 13th of December.
S&P500: 2,532.69 – a close on the 19th of December at 2,506.96 provides support to a bear market conclusion.
Nasdaq: 6,630.67 – a close on the 19th of December at 6,618.86 provides support to a bear market conclusion.
With all the indices having moved higher following a Dow Theory bear market confirmation, Dow Theory would confirm a bull market if the following highs are made:
DJIA: 26,951.81 – a close above this point has been made on the 3rd of July 2019.
DJT: 11,623.58 – to date DJT has failed to confirm an ongoing bull market.
S&P500: 2,940.91 – a close above this point was made on the 29th of April 2019.
Nasdaq: 8,133.30 – a close above this point was made on the 26th of April 2019.
GOLD
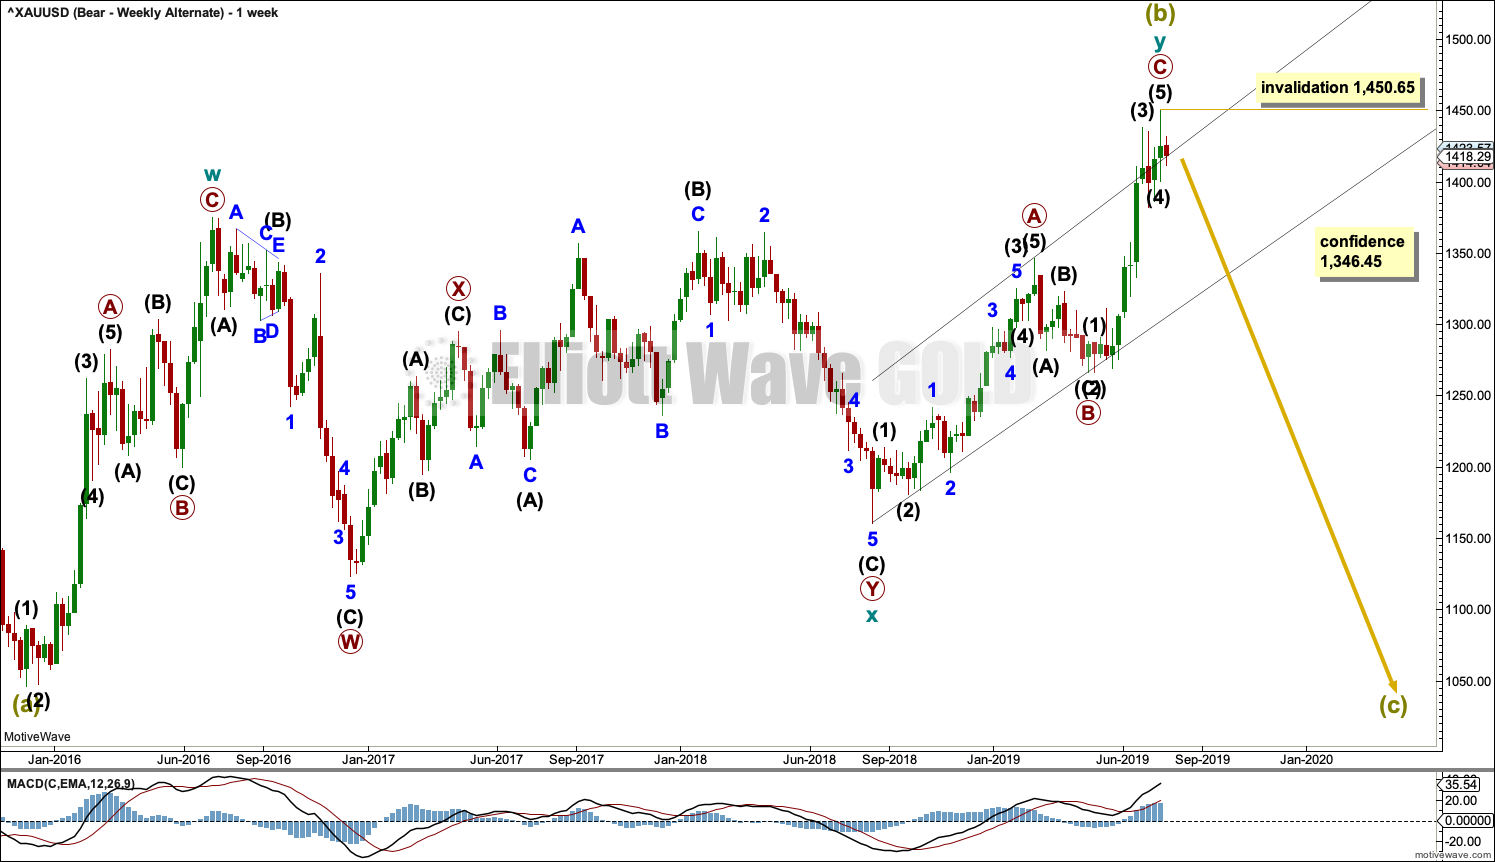
At the end of this week, it is time to review monthly charts for Gold. Three Elliott wave counts are published for monthly charts.
Summary: There remains an upwards trend in place at the weekly chart level. This week looks like a counter trend movement. However, the trend is nearing extreme and conditions are overbought, so caution is strongly advised for long positions. The risk of a trend change, larger pullback or consolidation is very high.
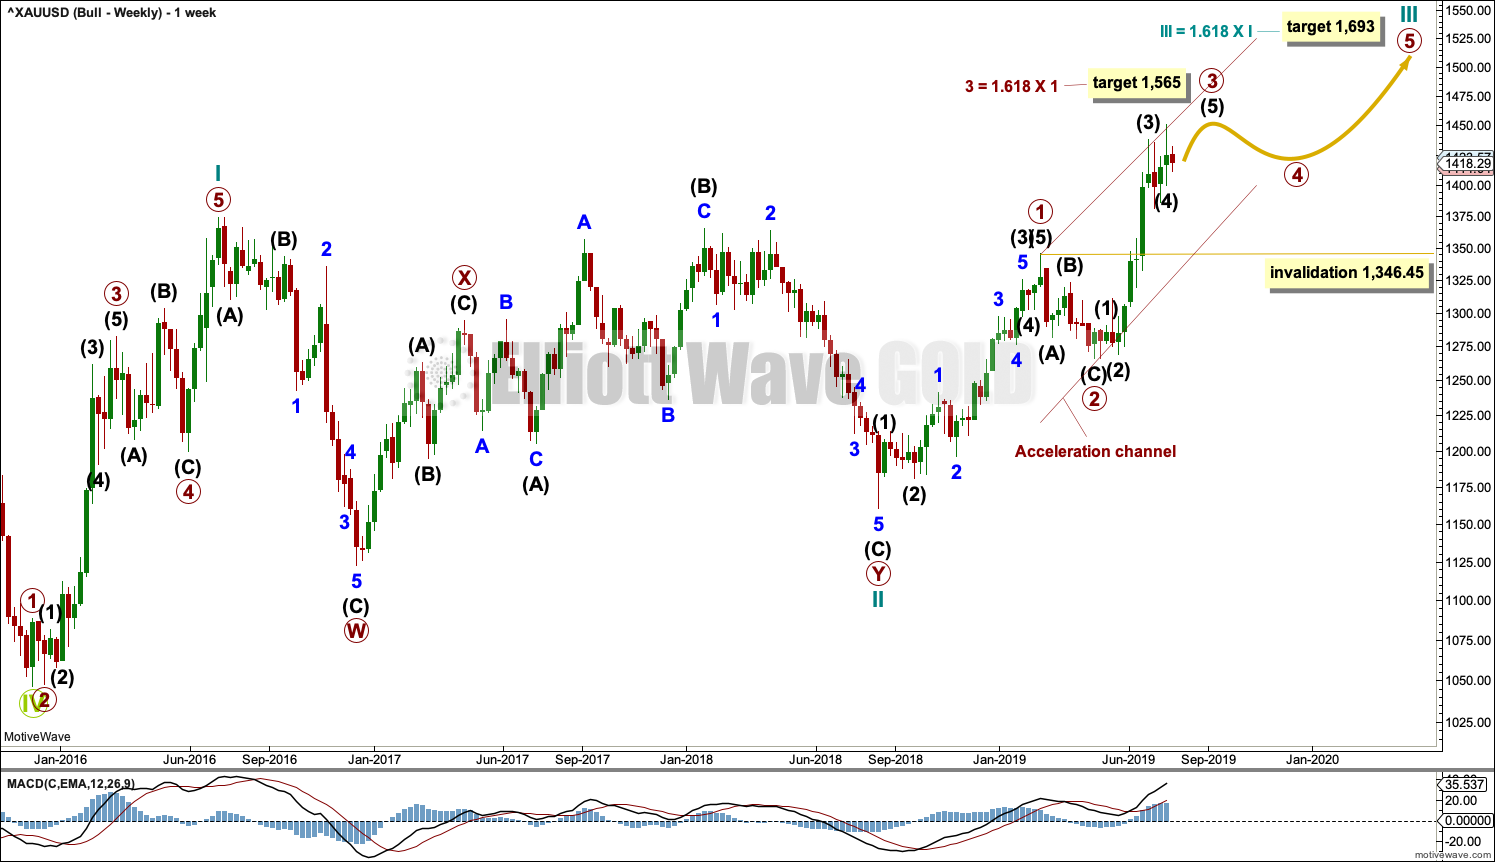
The bullish Elliott wave count remains valid while price remans above 1,346.45. The mid-term target is 1,565.
It now looks more likely that for the two bearish wave counts some further consolidation may continue to relieve extreme conditions, before a final wave up to 1,595.
Grand SuperCycle analysis is here.
BEARISH ELLIOTT WAVE COUNTS
MONTHLY CHART
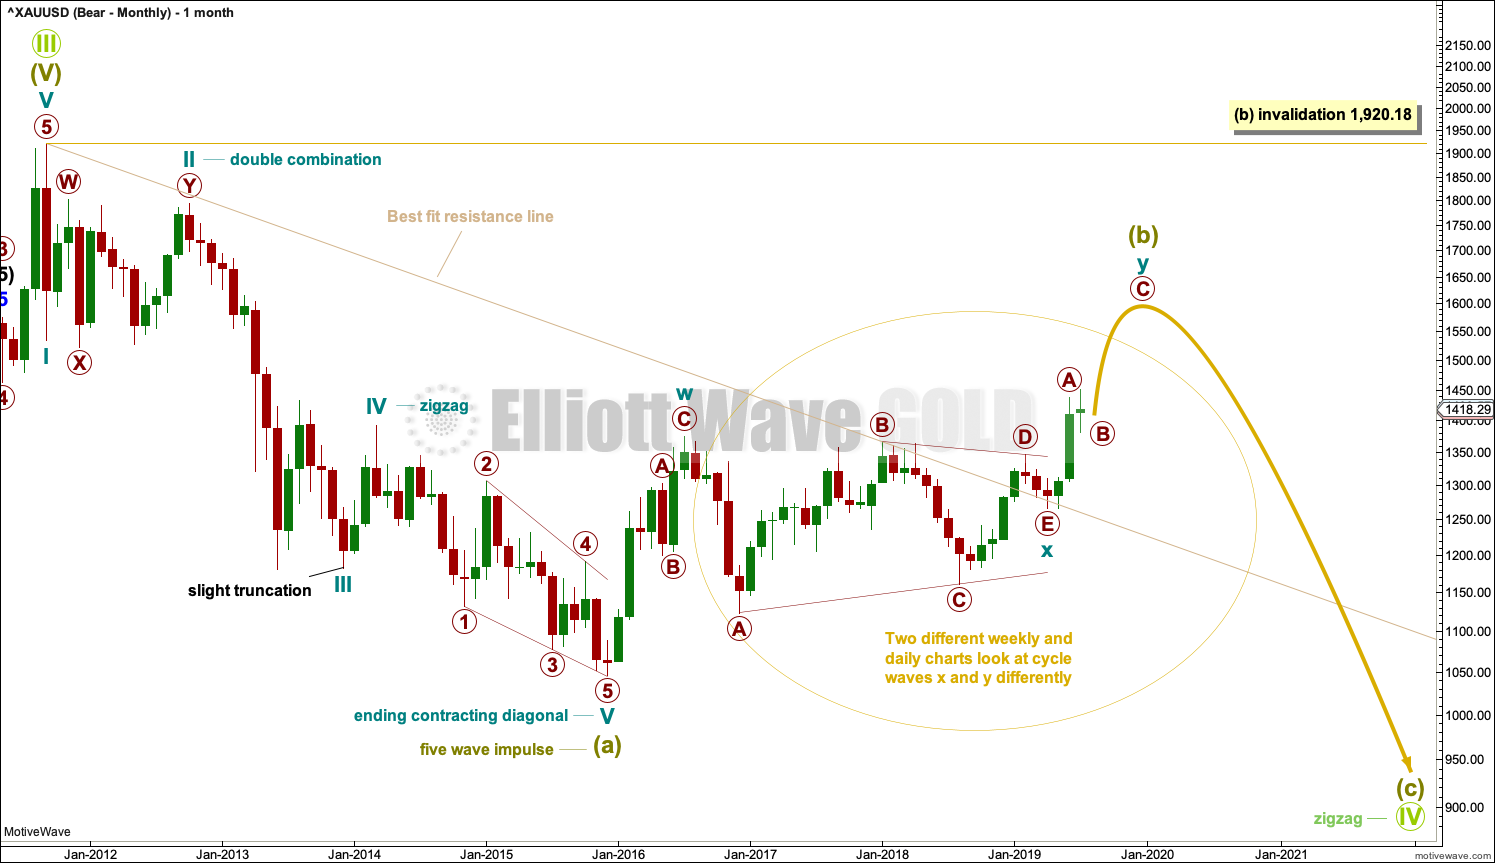
Click chart to enlarge.
The degree of labelling for all bear wave counts is today moved up one degree. Guidelines as to how long each wave should last based upon its degree should be approached with a great deal of flexibility. When waves extend, they do so in price and time leaving non-extended waves much more brief.
The main wave count will look at the large downwards wave from the all time high as a five wave impulse. For this main wave count, it will be labelled as Super Cycle wave (a), within a zigzag for Grand Super Cycle wave IV.
If Super Cycle wave (a) is a five, then Super Cycle wave (b) may not move beyond its start above 1,920.18.
Super Cycle wave (b) may or may not be complete. There are two weekly charts below.
When Super Cycle wave (b) is complete, then Super Cycle wave (c) downwards should unfold. Super Cycle wave (c) would most likely reach about equality in length with Super Cycle wave (a).
If this wave count unfolds as expected, then a huge zigzag downwards may be complete when Super Cycle wave (c) completes. Now that the degree of labelling is moved up one degree, the zigzag may complete a bear market for Grand Super Cycle wave IV. A new bull market may develop from there.
MAIN WEEKLY CHART
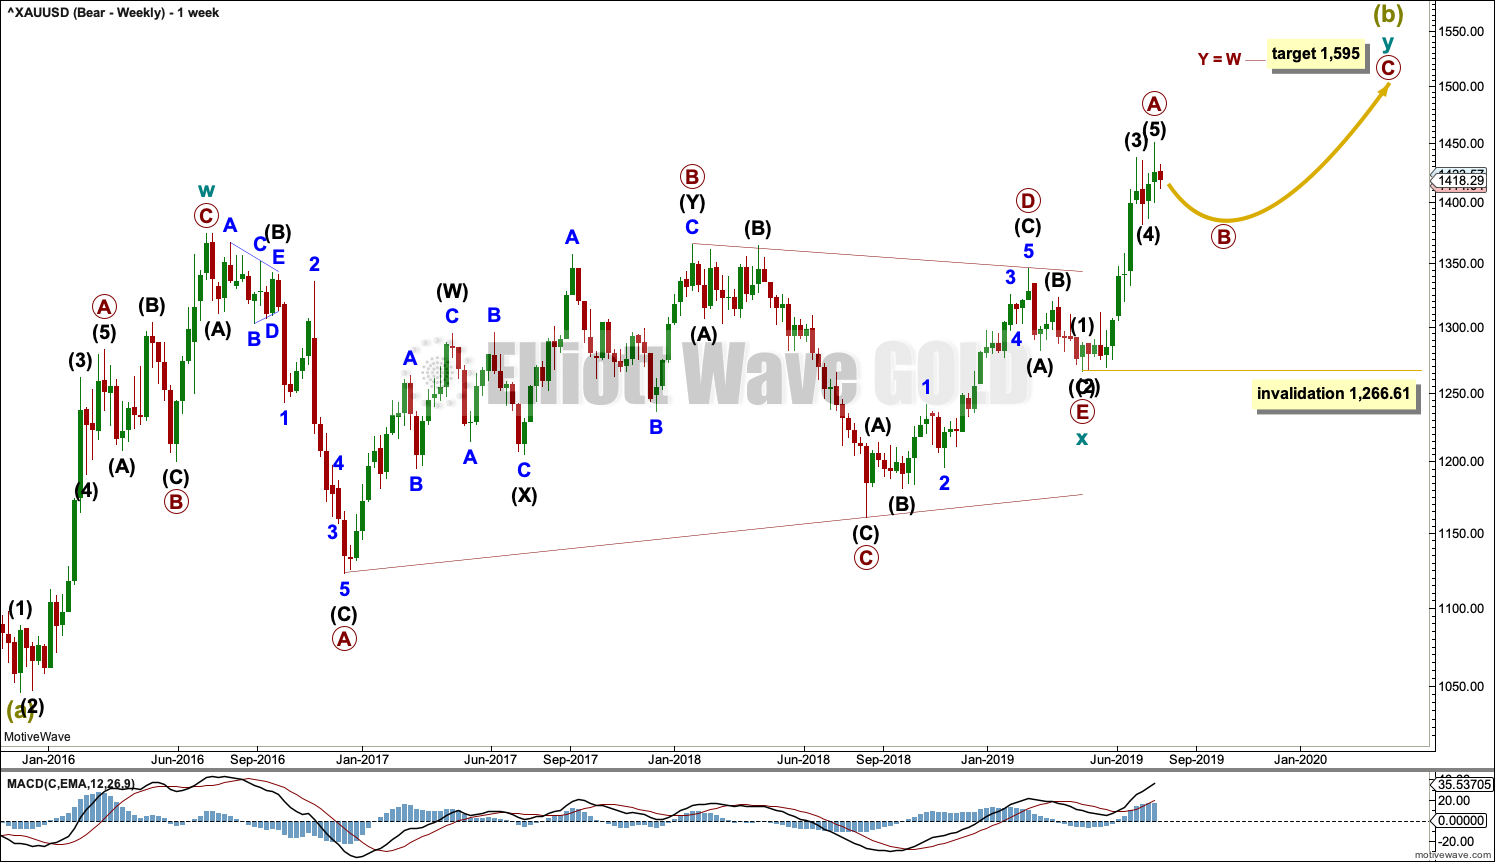
Click chart to enlarge.
It remains possible that Super Cycle wave (b) is an incomplete double zigzag.
The first zigzag in the double is seen in the same way for both bearish wave counts, a zigzag labelled cycle wave w.
This main bearish wave count sees cycle wave x as regular contracting triangle. Cycle wave y must subdivide as a zigzag if Super Cycle wave (b) is a double zigzag. Within cycle wave y, primary wave A may now be complete, and primary wave B may not move beyond the start of primary wave A below 1,266.61.
Primary wave B may continue further for a few more weeks to relieve extreme conditions and complete a corrective Elliott wave structure.
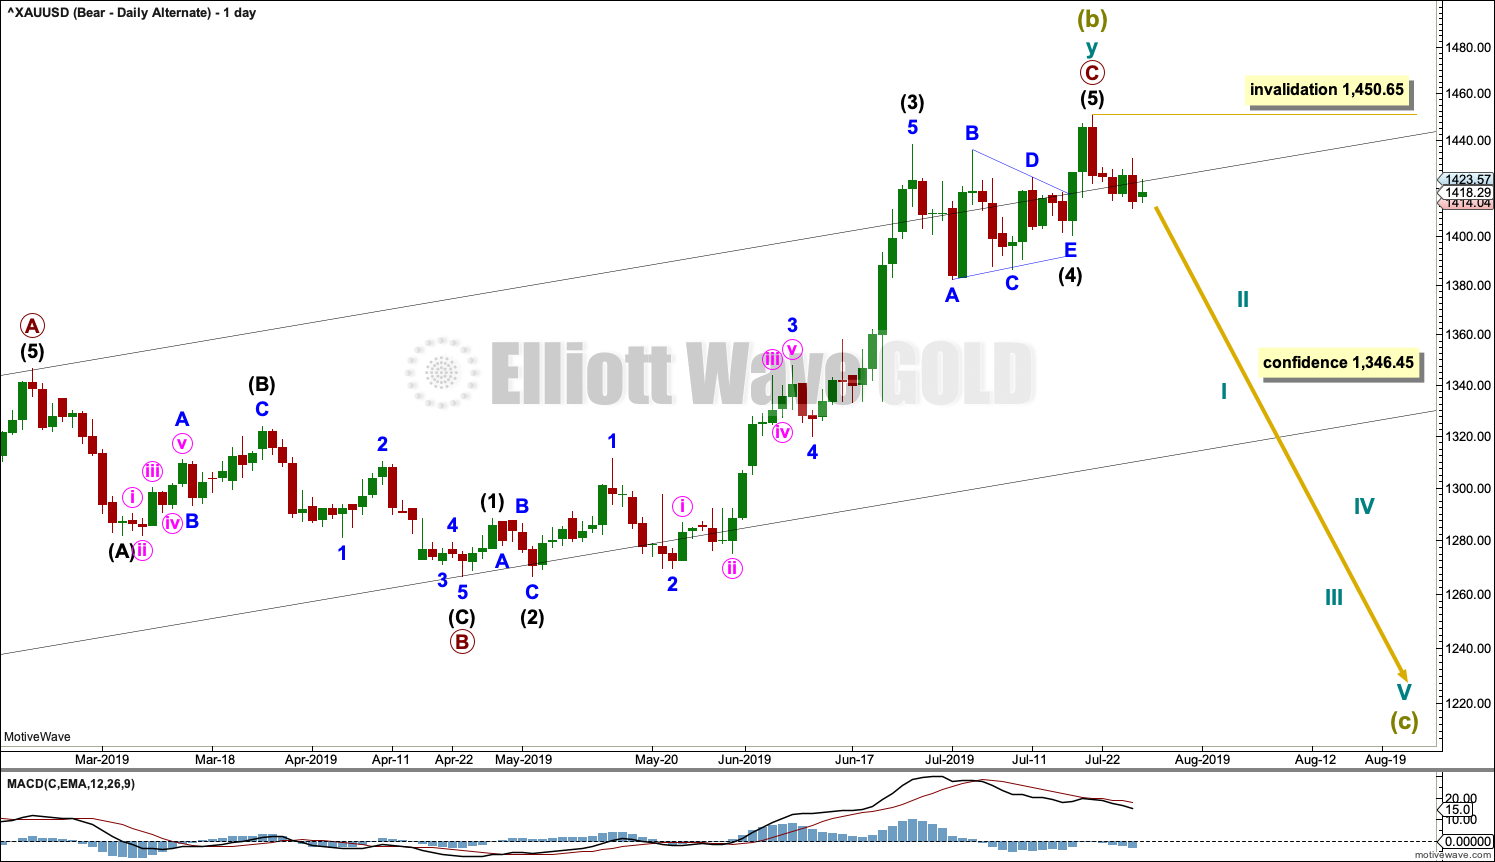
MAIN DAILY CHART
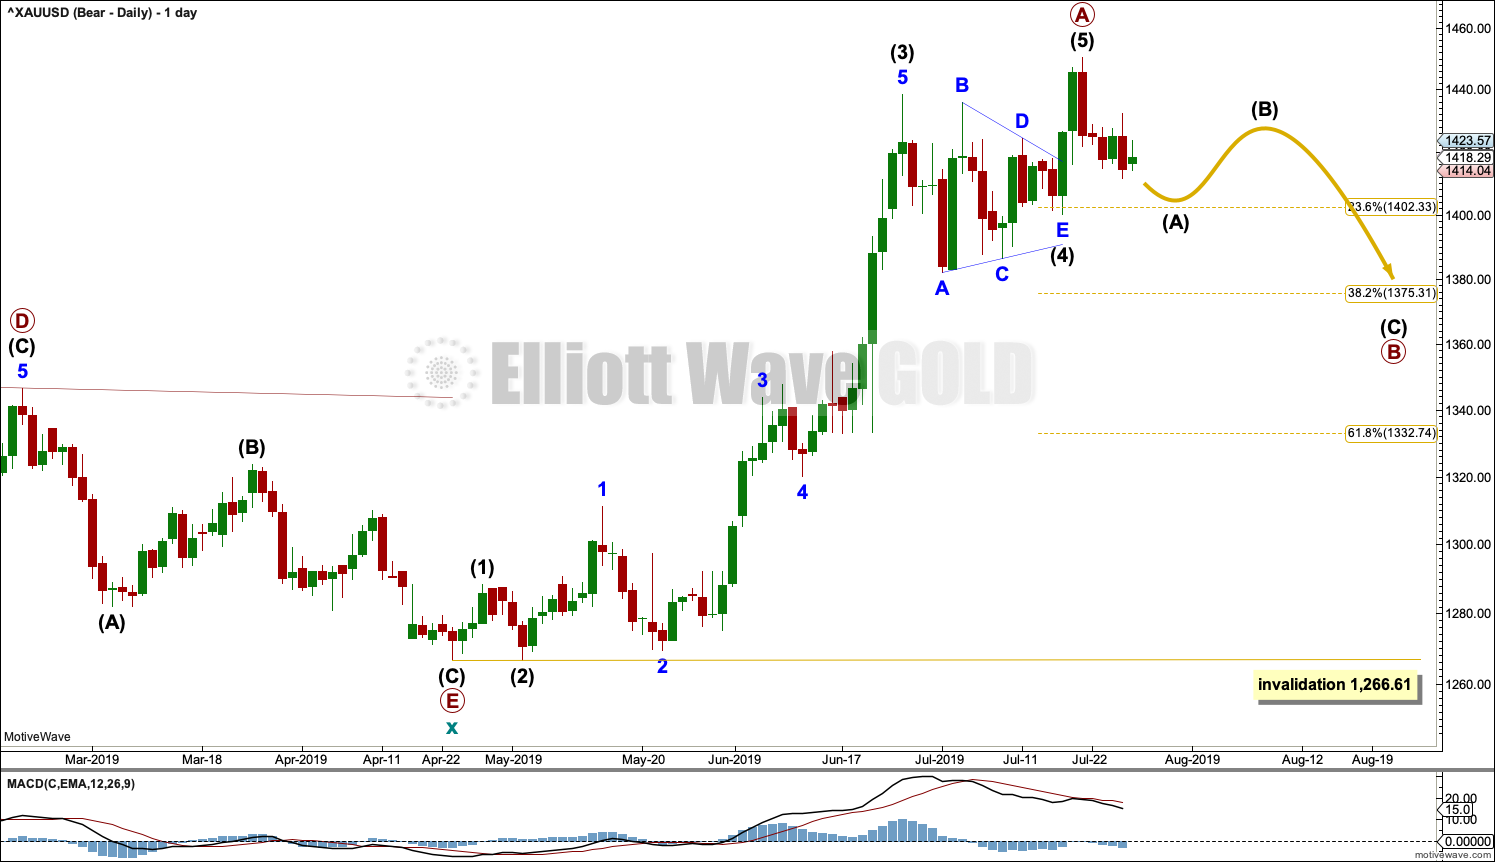
Click chart to enlarge.
Within cycle wave y, primary wave A may now be a complete five wave impulse.
Primary wave B may unfold over a few weeks. Primary wave B may subdivide as any one of more than 23 possible corrective Elliott wave structures. It may be a quick sharp pullback as a zigzag, or it may be a time consuming sideways consolidation as a combination, flat or triangle.
Primary wave B should exhibit weakness.
Primary wave B may end about either the 0.382 or 0.618 Fibonacci Ratios. It may be relatively shallow if it finds support about 1,375, so the 0.382 Fibonacci ratio may be favoured as a target.
If primary wave B subdivides as any one of an expanded flat, running triangle or combination, then it may include a new high above its start at 1,450.65. A new high above this point does not invalidate this wave count.
ALTERNATE WEEKLY CHART
Click chart to enlarge.
At the end of this week, this wave count is now judged to be an alternate. Small range days this week are not convincing as the start of a strong new downwards trend. However, this wave count remains valid.
It remains possible that a trend change at Super Cycle degree occurred last week and a new downwards wave began there.
Double zigzags are common structures, but within them their X waves are almost always single zigzags that are relatively brief and shallow. However, this wave count sees cycle wave x as a complete double combination: zigzag – X – expanded flat.
An X wave may occasionally subdivide as a multiple. In a multiple the maximum number of corrective structures is three: W, Y and Z. To label any one of W, Y or Z as a multiple would violate the Elliott wave rule. Here, the rule is met.
Cycle wave y may be a complete zigzag. Within the zigzag, primary wave C is 5.19 short of equality in length with primary wave A.
The purpose of a second zigzag in a double zigzag is to deepen the correction when the first zigzag does not move price far enough. This purpose has been achieved.
A new low now by any amount at any time frame below 1,346.45 would invalidate the bullish wave count below and provide some confidence in this wave count.
A new high by any amount at any time frame above 1,450.65 would invalidate this wave count.
ALTERNATE DAILY CHART
Click chart to enlarge.
Primary wave C may now be a complete impulse.
Gold often exhibits surprisingly short and brief fifth waves out of its fourth wave triangles, and this wave count expects that it may have done so here. This wave count follows common tendencies for this market.
Super Cycle wave (c) should move below the end of Super Cycle wave (a) at 1,046.27 to avoid a truncation. Super Cycle wave (c) may only subdivide as a five wave structure, most likely an impulse. Within Super Cycle wave (c), no second wave correction may move beyond the start of its first wave above 1,450.65.
ALTERNATE MONTHLY CHART
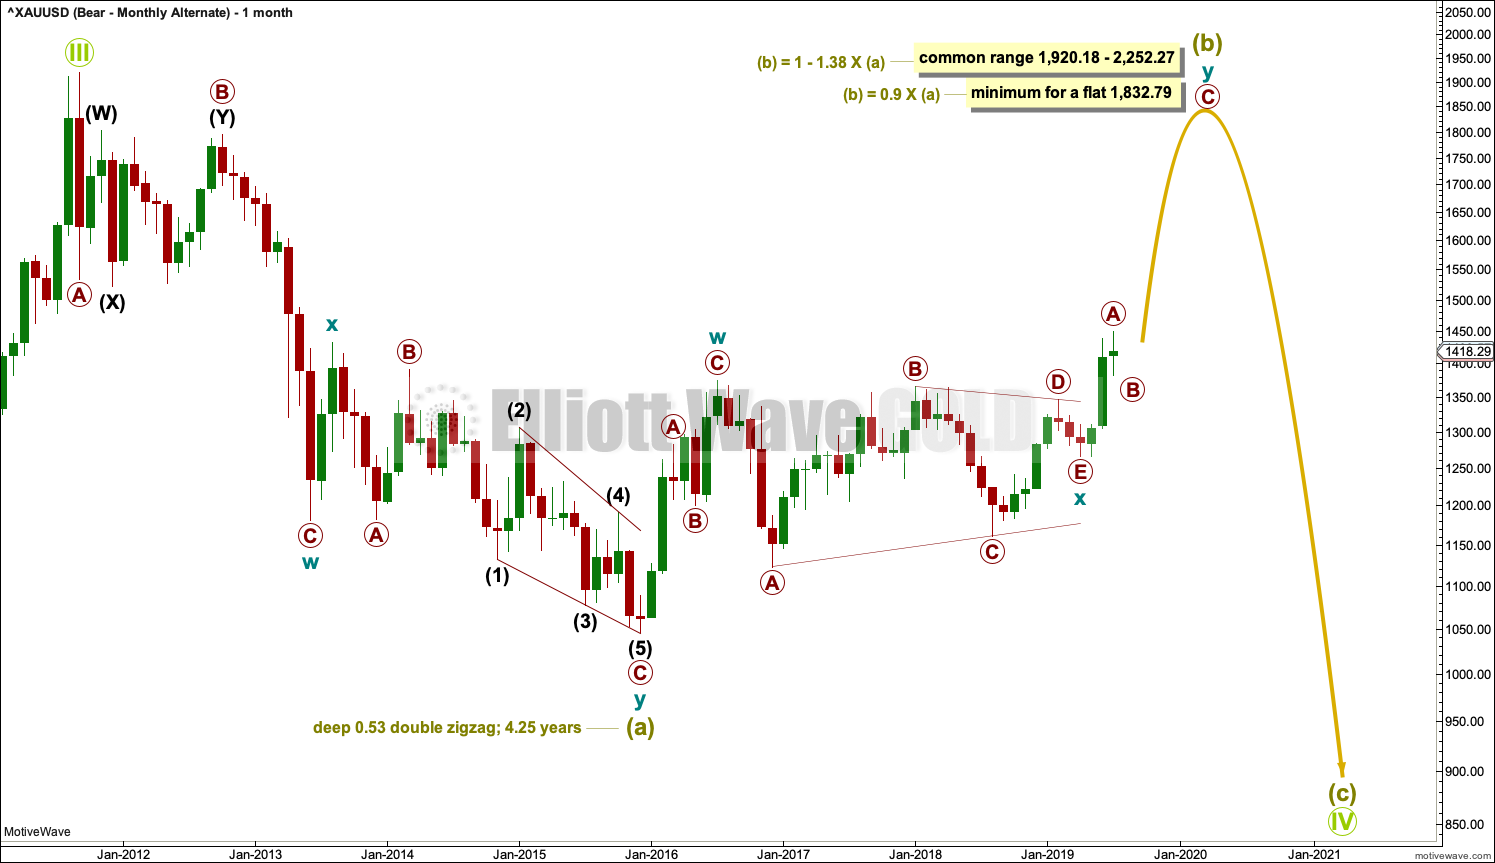
Click chart to enlarge.
The large wave down from September 2011 to November 2015 may also be seen as a three wave structure, a double zigzag.
If the big wave down is a multiple three wave structure, then Grand Super Cycle wave (IV) may be either a flat or triangle. It may not be a combination because they may not have multiples within any one of W, Y or Z.
If Grand Super Cycle wave (IV) is a flat correction, then within it Super Cycle wave (b) must retrace a minimum 0.9 length of Super Cycle wave (a) at 1,832.79.
If Grand Super Cycle wave (IV) is a triangle, then there is no minimum requirement for Super Cycle wave (b). There is only the structural requirement that it should be a three wave structure. Super Cycle wave (b) would need to move higher for a triangle to have the right look.
At this stage, it looks like Super Cycle wave (b) for this wave count may be an unfolding double zigzag. A double zigzag for Super Cycle wave (b) may see cycle wave y reach up to the minimum requirement at 1,832.79 for a flat correction, for the structure one degree higher at Grand Super Cycle degree.
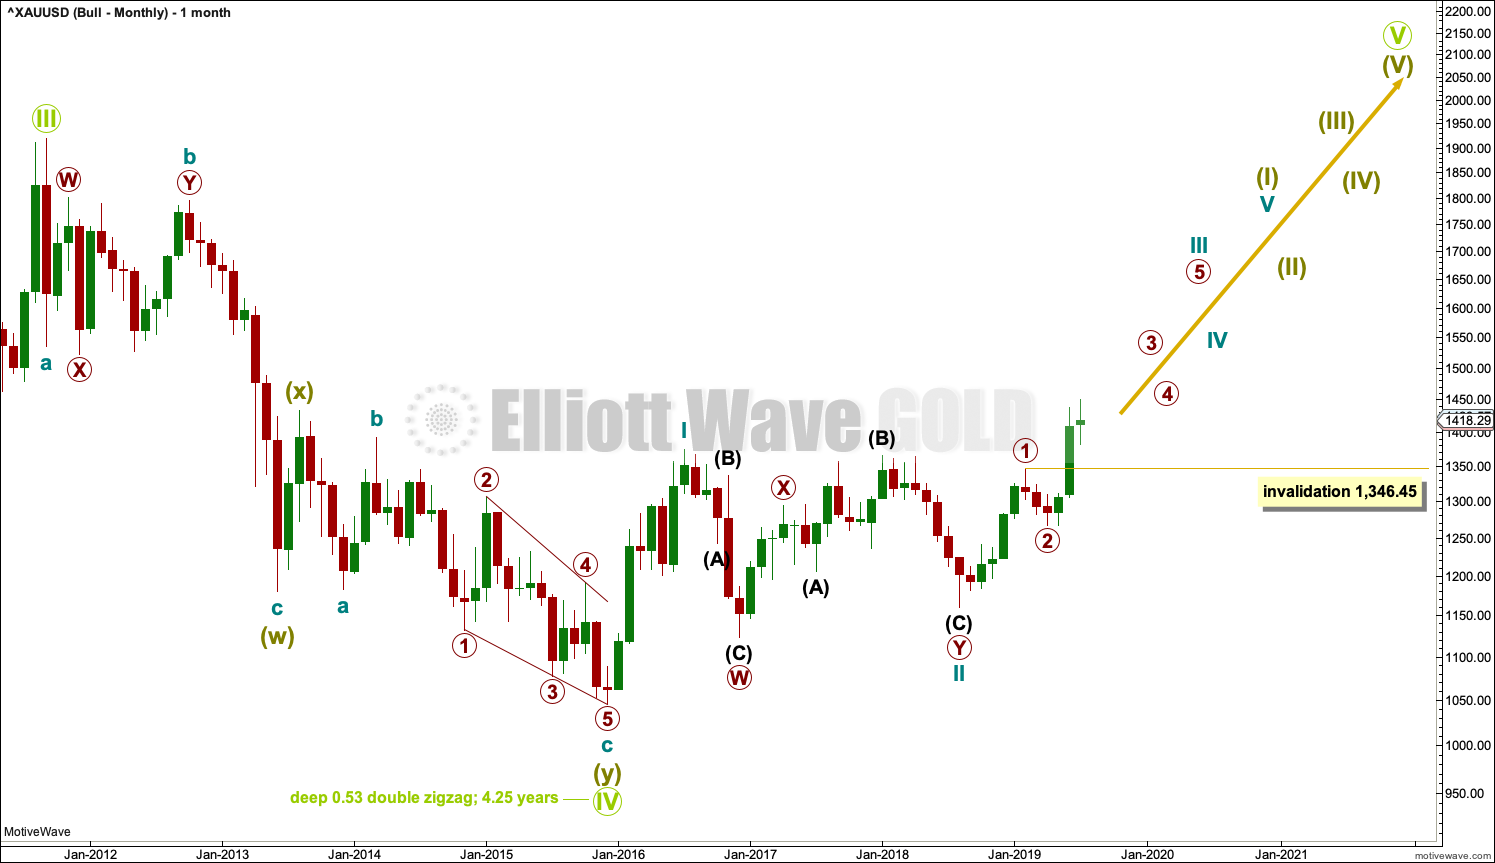
BULLISH ELLIOTT WAVE COUNT
MONTHLY CHART
Click chart to enlarge.
By simply moving the degree of labelling within the last huge wave down all up one degree, it is possible to see that Grand Super Cycle wave IV could be over. It would be rather brief though at only 4.25 years. However, Grand Super Cycle wave II in the Grand Super Cycle analysis is expected to have lasted only about 8 years, so this possibility should be accepted.
If there has been a trend change at Grand Super Cycle degree in the end of November 2015, then a new five wave structure upwards should develop from there at the monthly chart level.
Gold will often form long slow basing movements. Its first waves can be short and its second waves long lasting and deep.
Cycle wave I may have been complete and relatively short and brief at only 7 months duration.
Cycle wave II may now be a complete double combination.
WEEKLY CHART
Click chart to enlarge.
This wave count sees the the bear market complete at the last major low for Gold in November 2015.
If Gold is in a new bull market, then it should begin with a five wave structure upwards on the weekly chart. However, the biggest problem with this wave count is the structure labelled cycle wave I because this wave count must see it as a five wave structure, but it looks more like a three wave structure.
Commodities often exhibit swift strong fifth waves that force the fourth wave corrections coming just prior and just after to be more brief and shallow than their counterpart second waves. It is unusual for a commodity to exhibit a quick second wave and a more time consuming fourth wave, and this is how cycle wave I is labelled. This wave count still suffers from this very substantial problem, and for this reason bearish wave counts are still considered above as they have a better fit in terms of Elliott wave structure.
Cycle wave II subdivides well as a double combination: zigzag – X – expanded flat.
Cycle wave III may have begun. Within cycle wave III, primary waves 1 and 2 may now be complete. If it continues lower as a double zigzag, then primary wave 2 may not move beyond the start of primary wave 1 below 1,160.75.
Cycle wave III so far for this wave count would have been underway now for 49 weeks. It may be beginning to exhibit some support from volume and increasing ATR. If this increase continues, then this wave count would have some support from technical analysis.
Draw an acceleration channel about primary waves 1 and 2: draw the first trend line from the end of primary wave 1 to the last high, then place a parallel copy on the last high. Keep redrawing the channel as price continues higher. When primary wave 3 is complete, then this channel would be drawn using Elliott’s first technique about the impulse. The lower edge may provide support.
Primary wave 4 may not move into primary wave 1 price territory below 1,346.45. Because the data used for this analysis is cash market data no overlap between primary waves 4 and 1 should be allowed. The invalidation point is absolute.
DAILY CHART
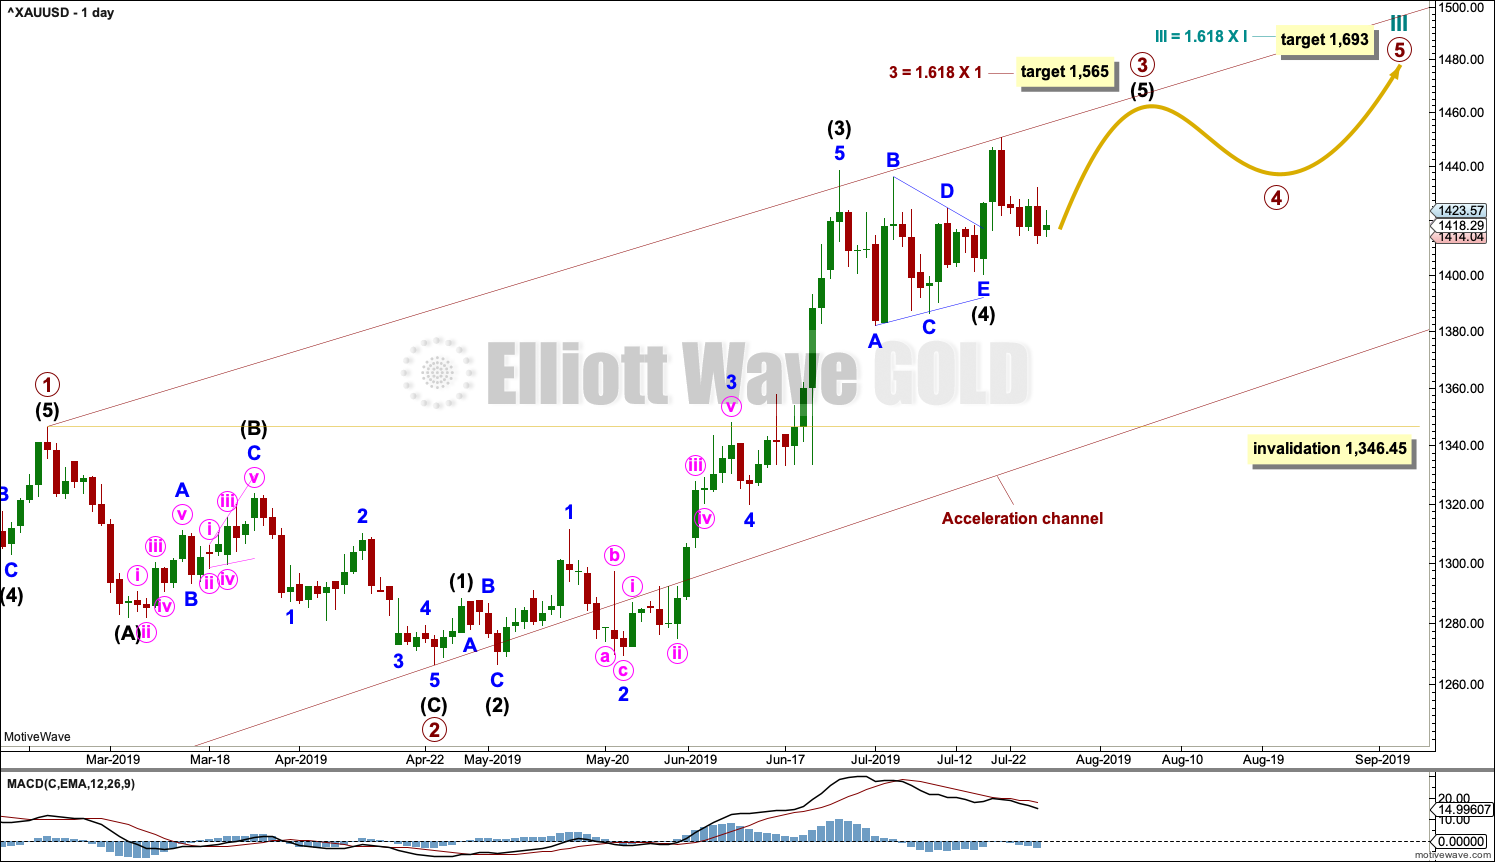
Click chart to enlarge.
Primary wave 3 may only subdivide as an impulse. Within the impulse, intermediate waves (1) through to (4) are all now complete. It is possible that intermediate wave (5) could be over at the last high, but for this wave count it would look more normal if it continued higher.
When it arrives, then primary wave 4 may not move into primary wave 1 price territory below 1,346.45.
TECHNICAL ANALYSIS
MONTHLY CHART
Click chart to enlarge. Chart courtesy of StockCharts.com.
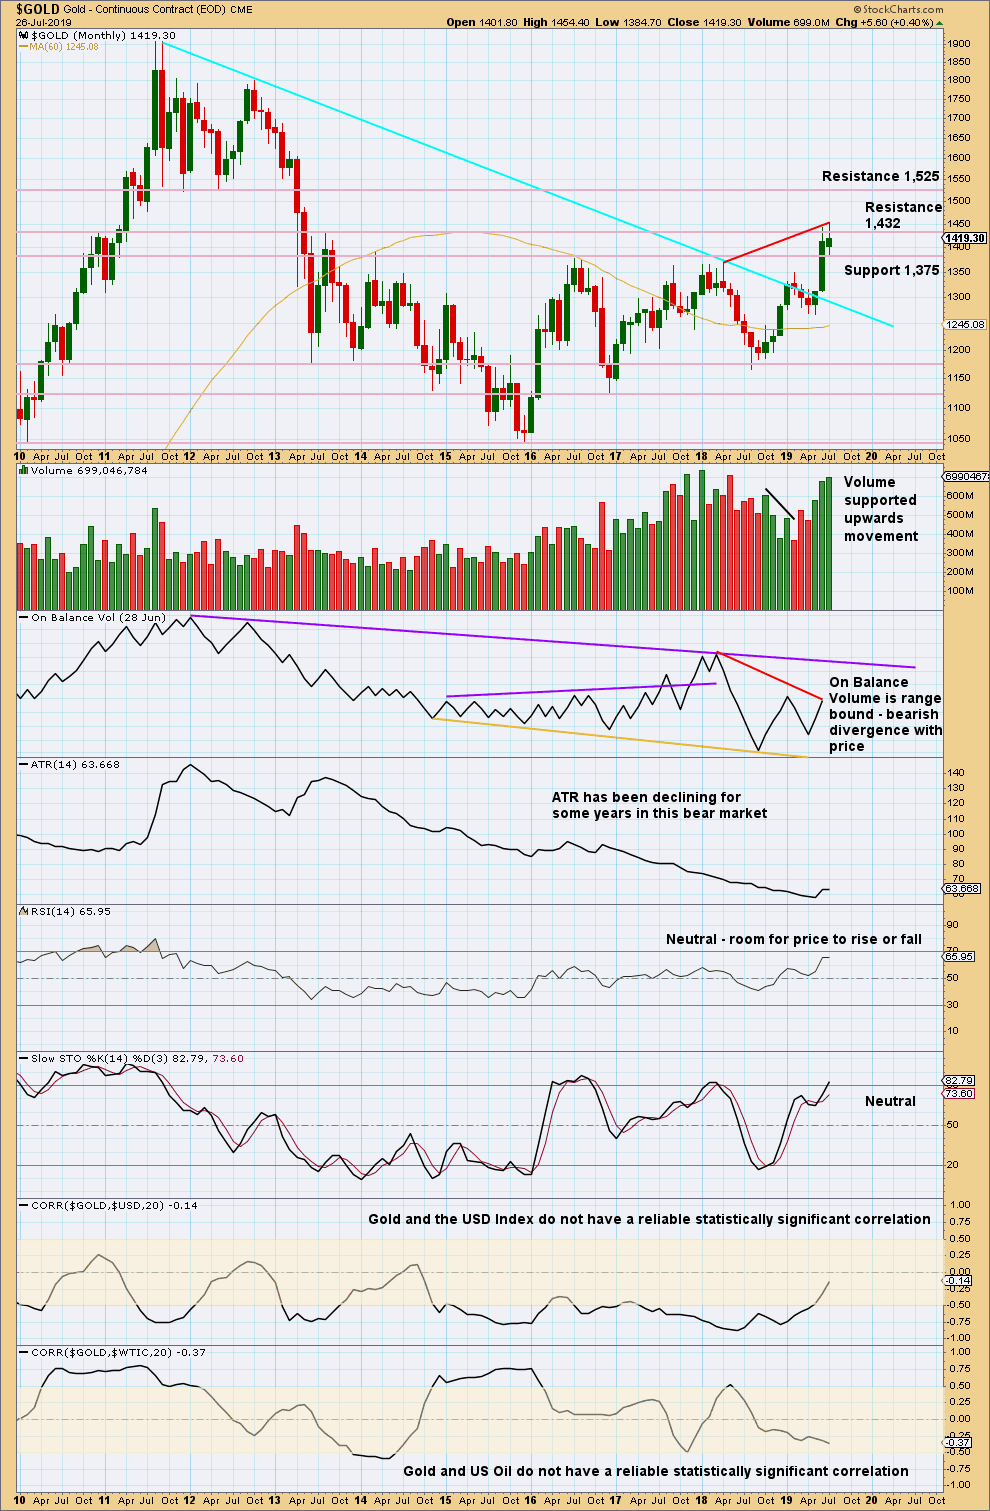
Gold has effected an upwards breakout above multi-year resistance and above the cyan bear market trend line. Look for next resistance identified on the chart.
The new high in price above prior highs for March / April 2018 have not been matched by new highs for On Balance Volume. This divergence is bearish and supports a bearish Elliott wave count. This divergence may be given a little weight because it is strong and evident on the monthly chart.
WEEKLY CHART
Click chart to enlarge. Chart courtesy of StockCharts.com.
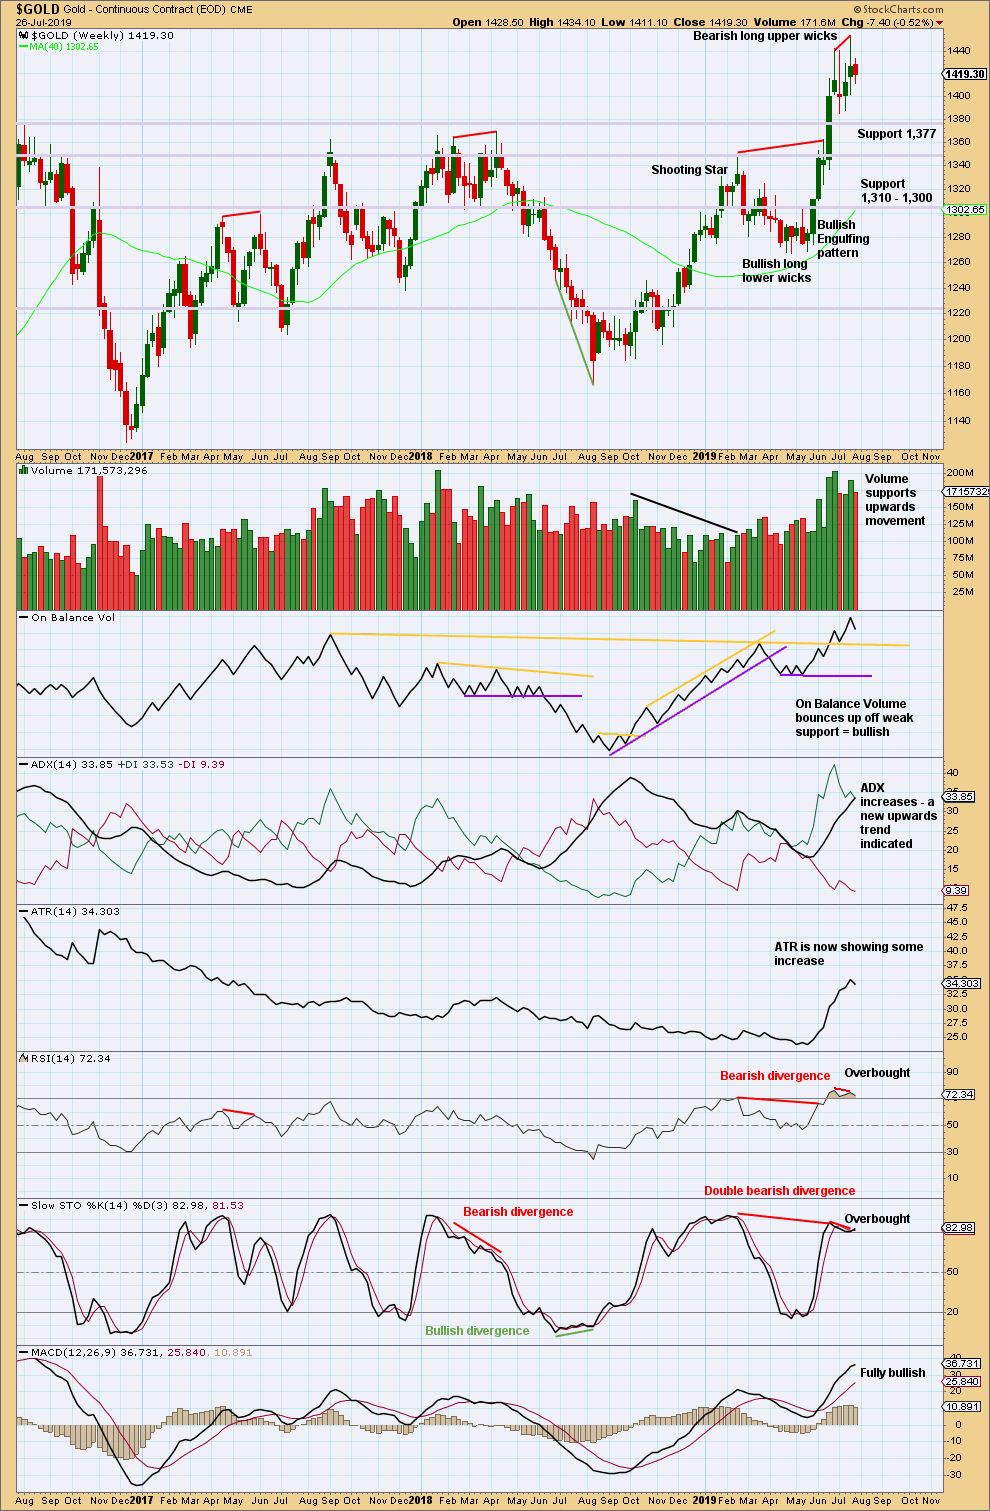
A new high two weeks ago exhibits some bearish divergence between price and RSI. However, as has been seen recently, sometimes this divergence simply disappears.
The bottom line remains that a multi year breakout occurred a few weeks ago, and it occurred with strength in volume. While price remains above support about 1,377 and ADX indicates an upwards trend, this chart will remain overall bullish.
DAILY CHART
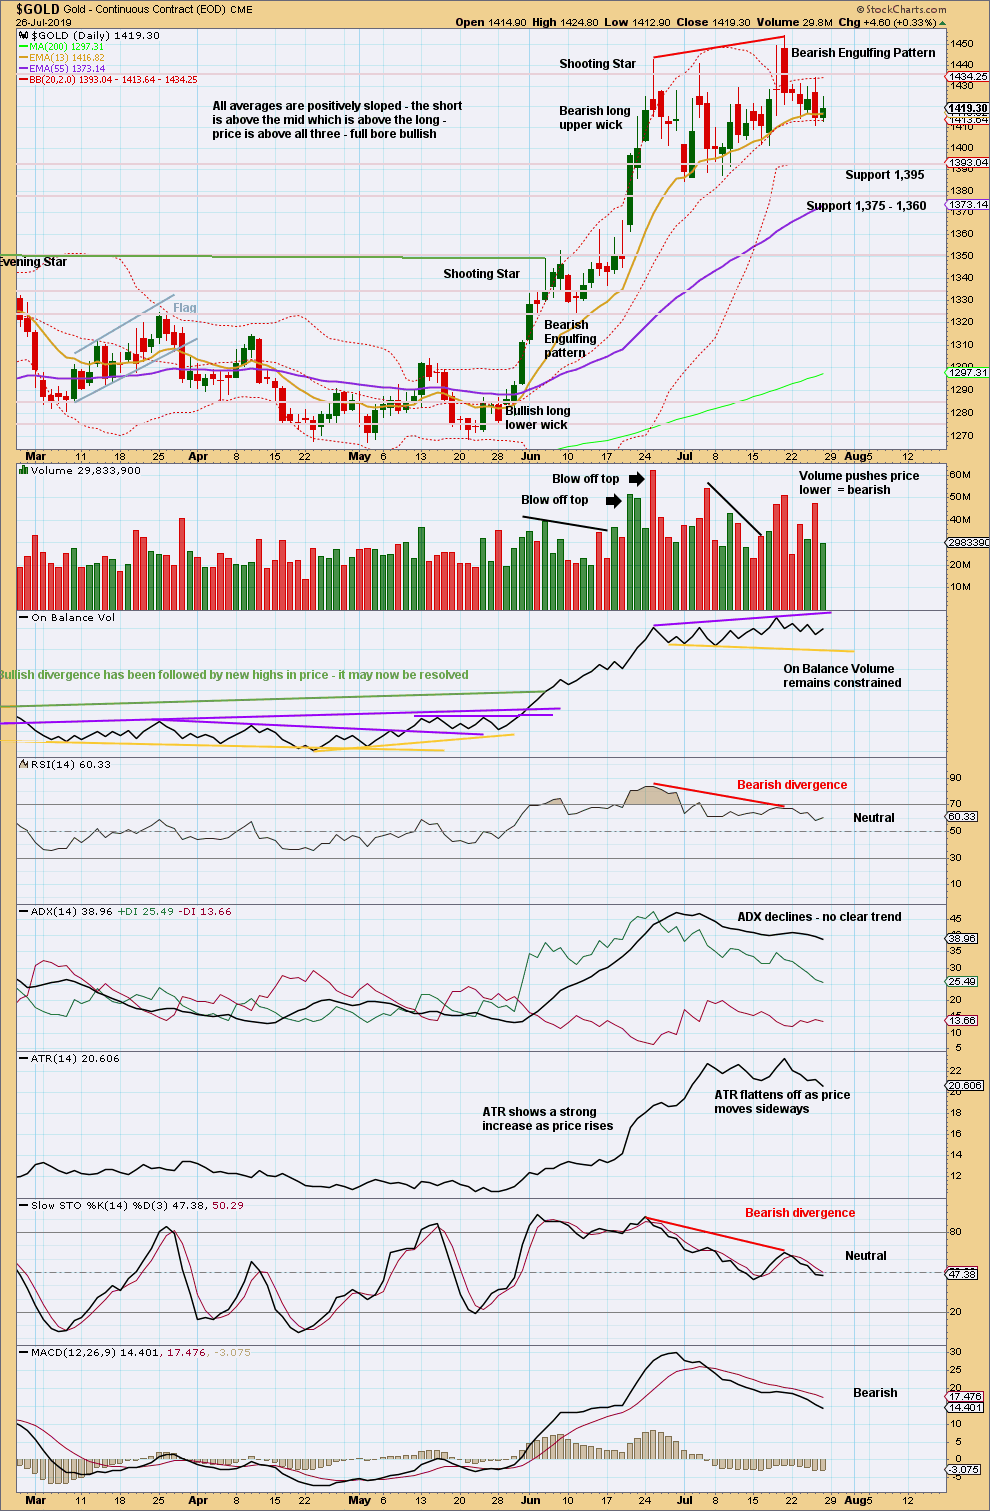
Click chart to enlarge. Chart courtesy of StockCharts.com.
A slow drift lower with declining ATR this week looks like a counter trend movement to relieve extreme conditions.
Extreme conditions for ADX have not yet been relieved. The ADX line remains above both directional lines and still close to 40.
RSI is now back in neutral territory.
Another week or so of consolidation or pullback may be required to complete before the larger upwards trend is ready to resume.
GDX WEEKLY CHART
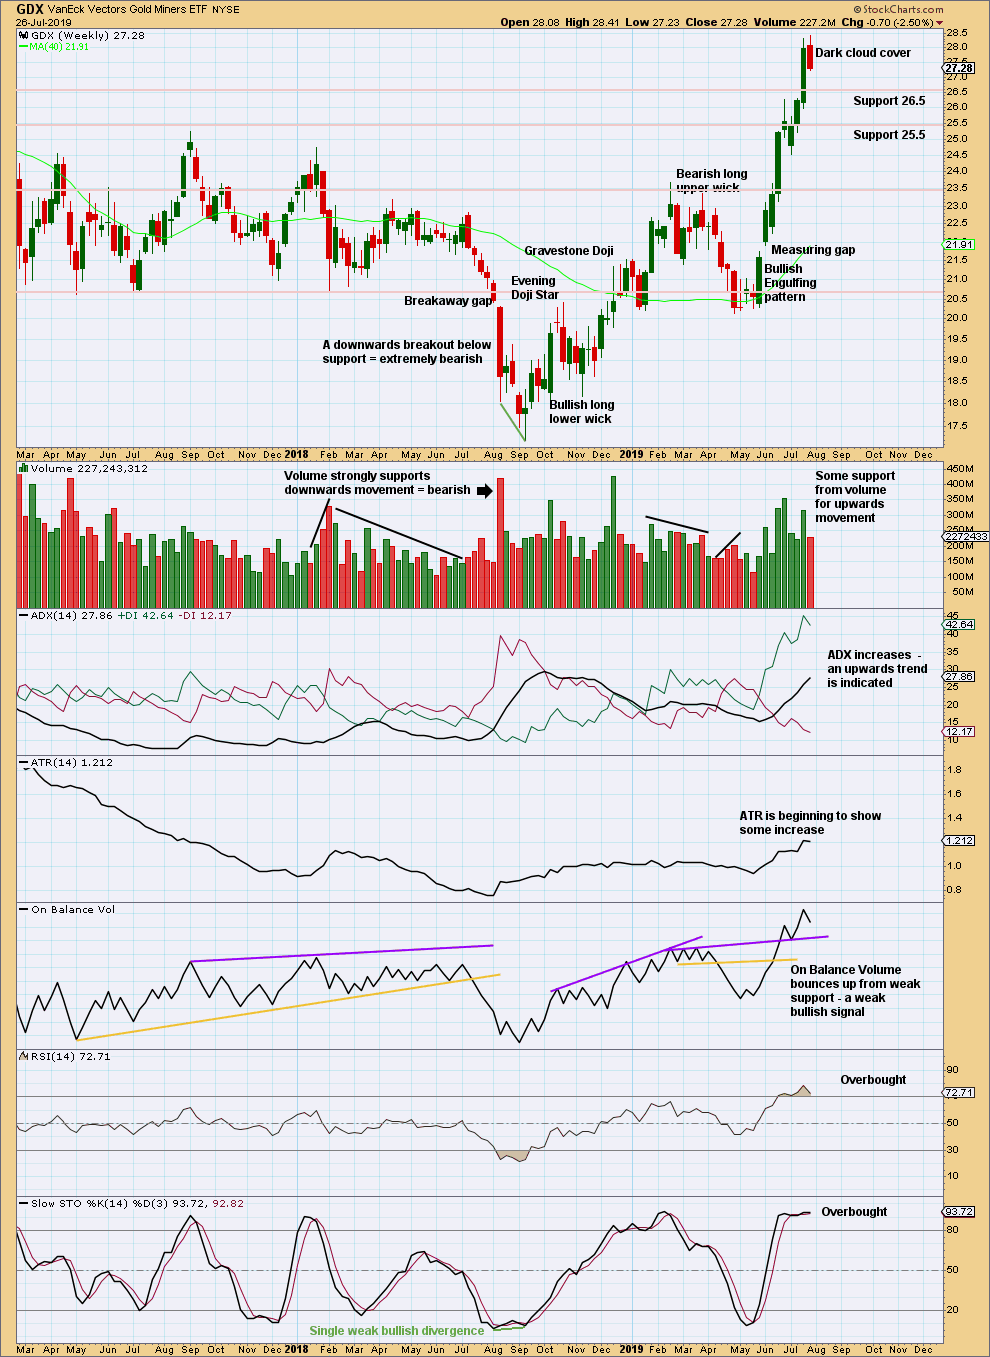
Click chart to enlarge. Chart courtesy of StockCharts.com.
The bearish candlestick reversal pattern this week indicates a potential trend change.
Candlestick reversal patterns make no comment on the direction of the new trend (a full 180 degree reversal or sideways) nor for how long it may last. This reversal pattern may indicate a consolidation to unfold here, or it may indicate a new downwards trend.
Strength or weakness in the next one to very few weeks may indicate which scenario may be preferred.
GDX DAILY CHART
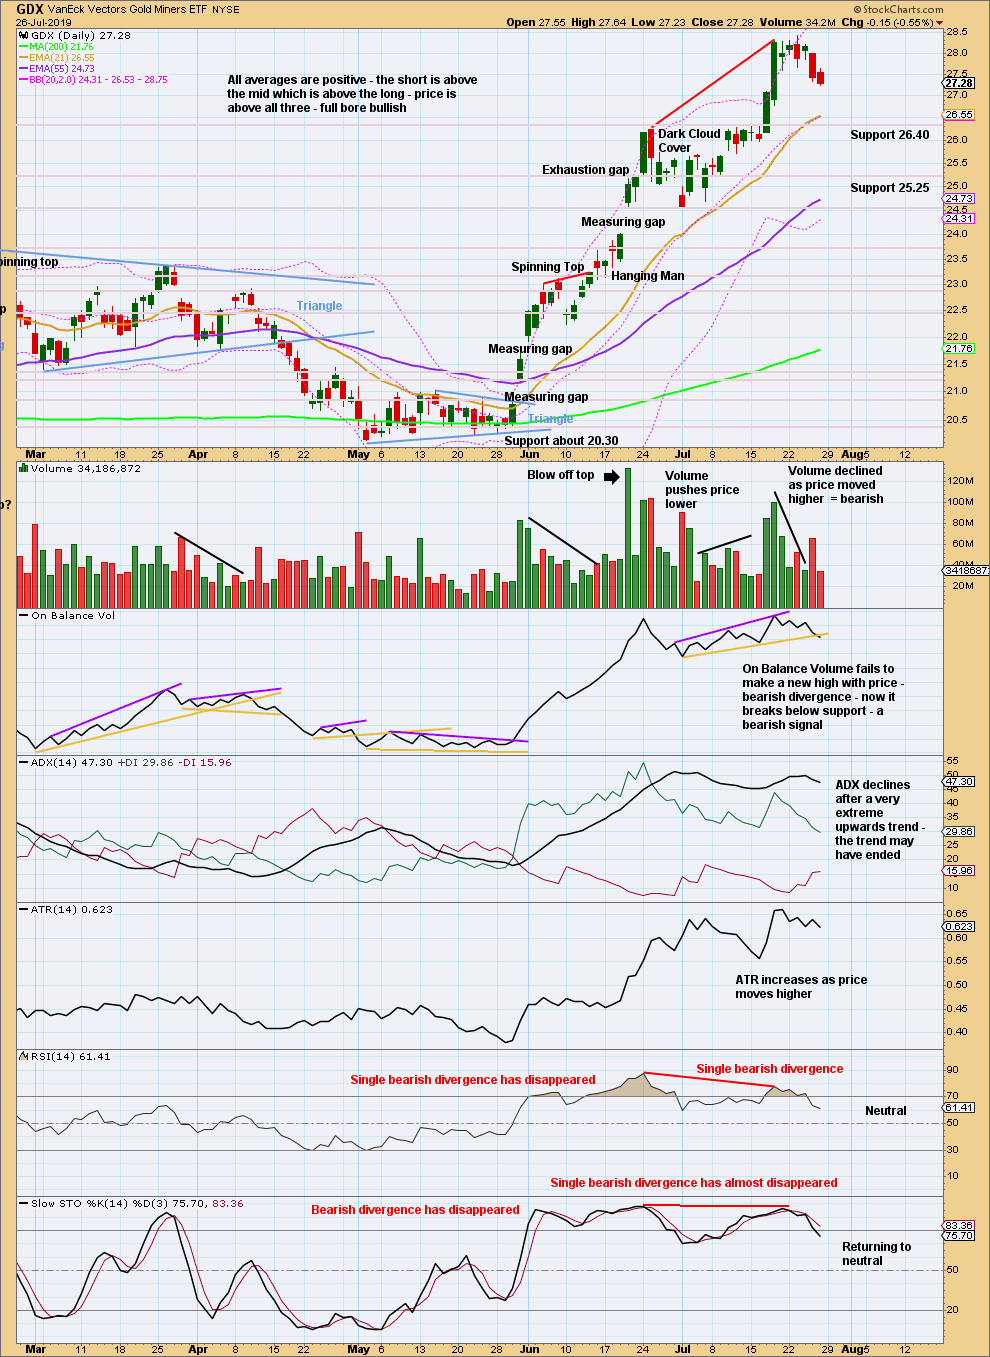
Click chart to enlarge. Chart courtesy of StockCharts.com.
The short-term volume profile and a bearish signal now from On Balance Volume support a bearish outlook for GDX at least for the short term.
A new swing low below 24.53 would confirm a trend change.
US OIL
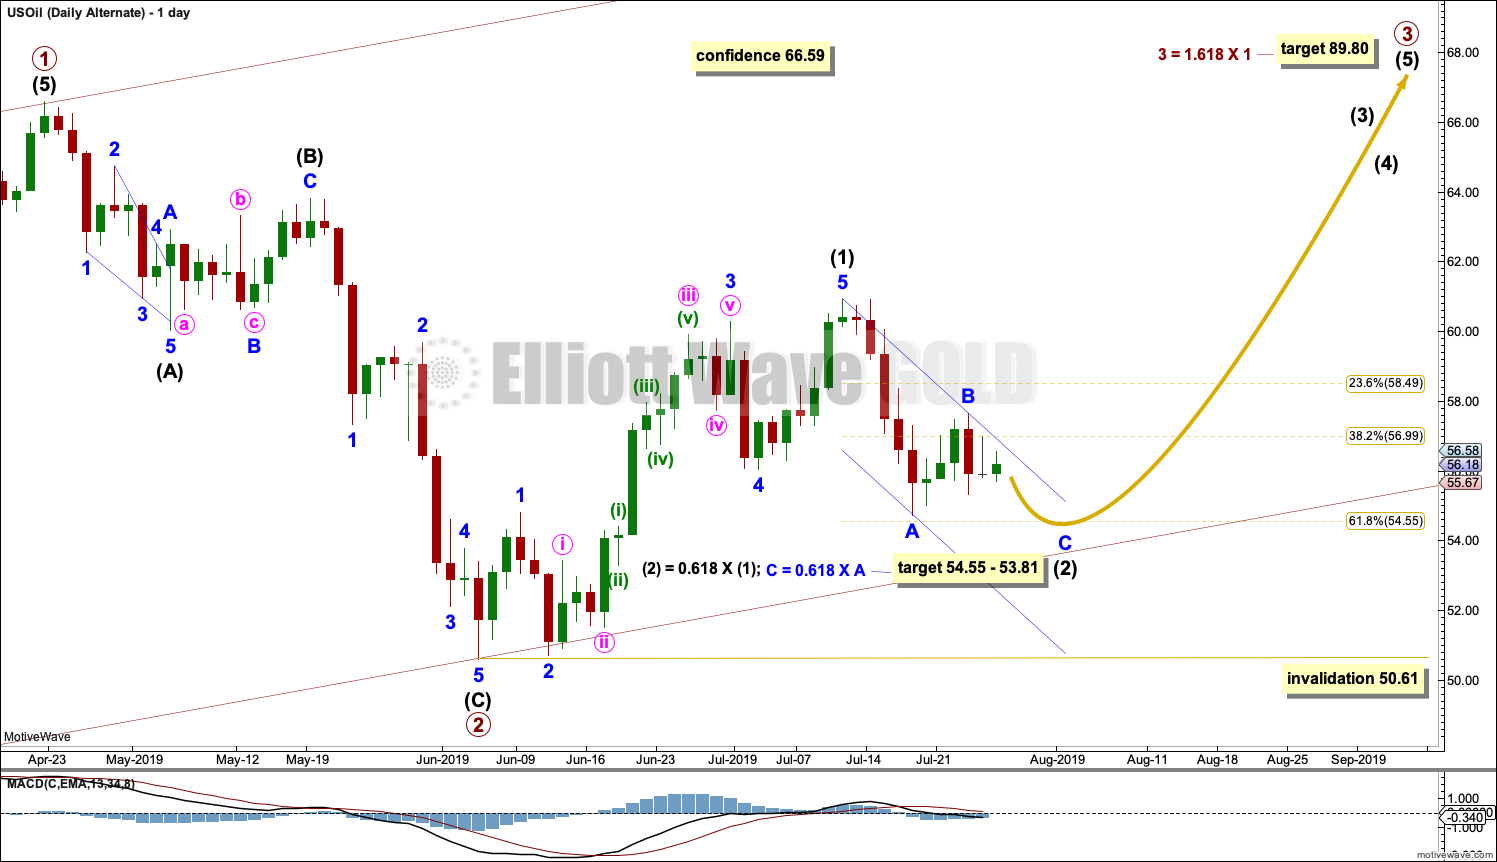
Downwards movement with a possible small bounce for a second wave was expected for the week. A small inside week fits the expectation for a small bounce.
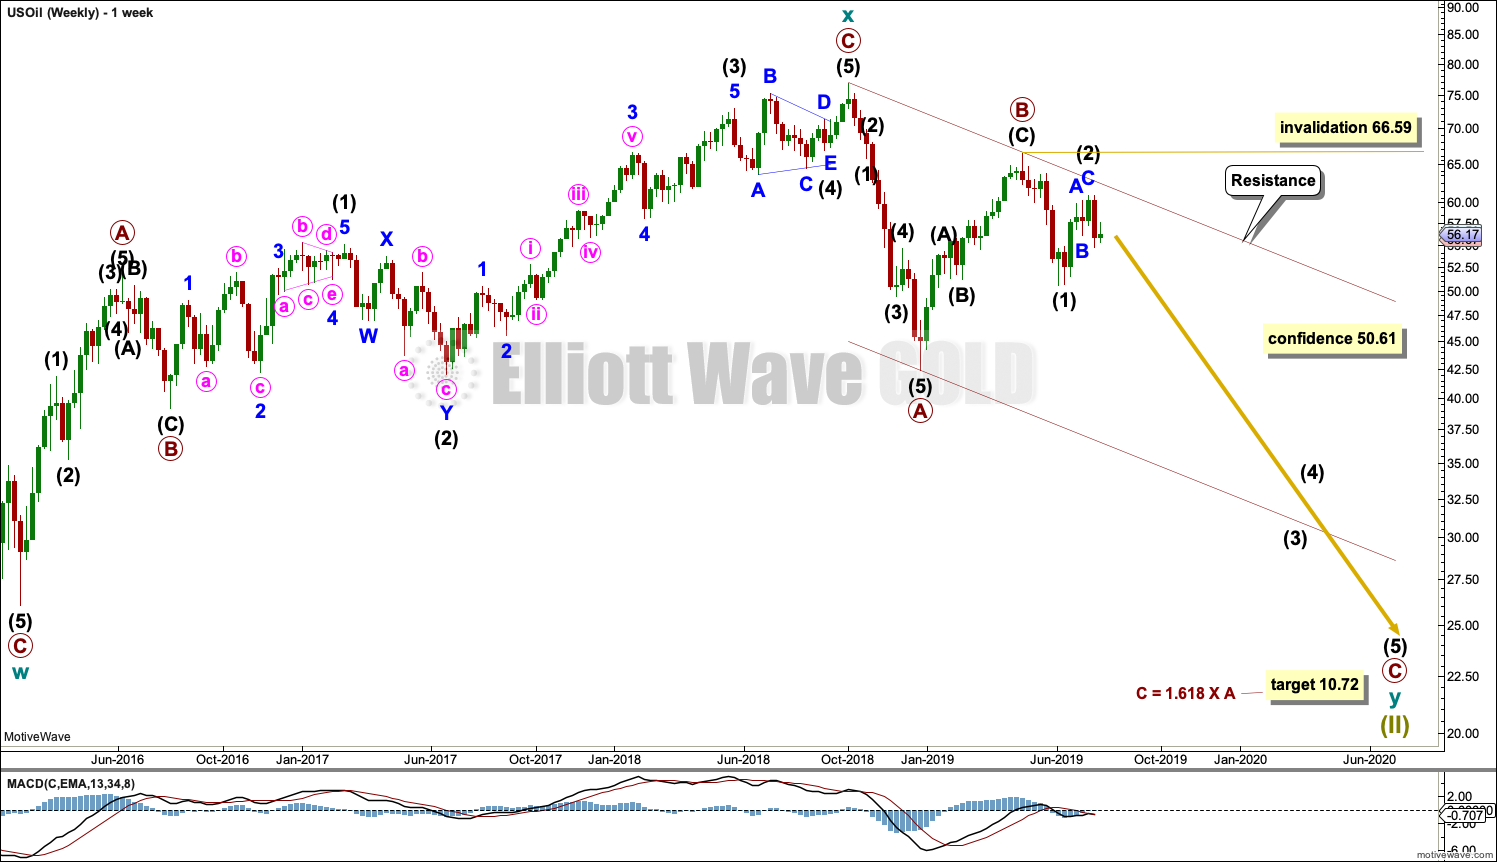
Summary: A new mid-term target is now at 35.25 for a third wave down. This may exhibit an increase in momentum, and may end with a capitulation spike.
The final target is calculated at 10.72. Confidence in this target may be had if price makes a new low below 50.61.
The bullish alternate wave count would have confidence above 66.59. At that stage, a target for a third wave to end would be at 89.80.
MAIN ELLIOTT WAVE COUNT
MONTHLY CHART
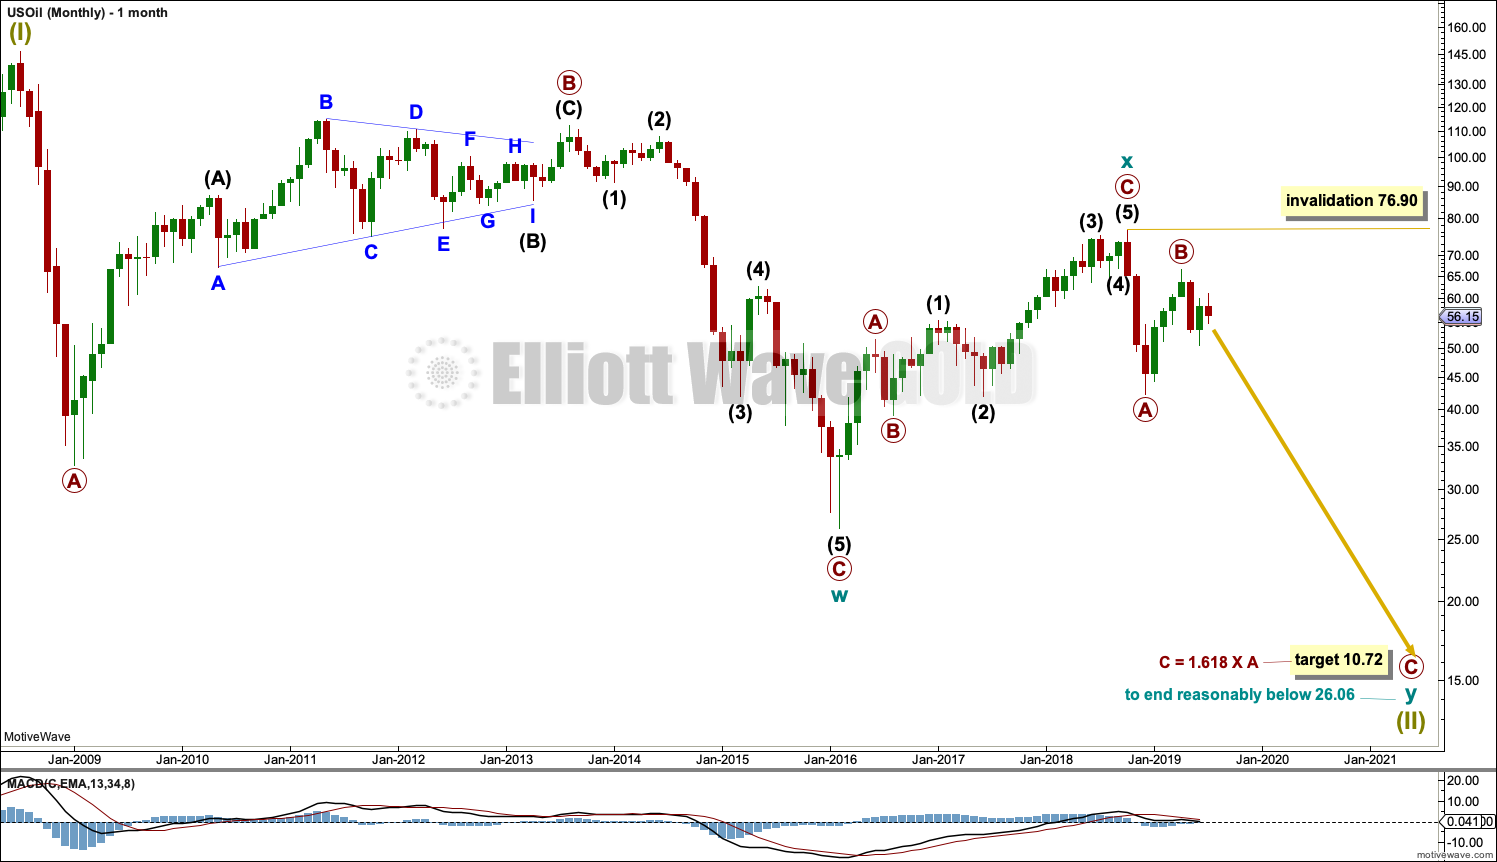
Click chart to enlarge.
The basic Elliott wave structure is five steps forward and three steps back. This Elliott wave count expects that US Oil is still within a three steps back pattern, which began in July 2008. The Elliott wave count expects that the bear market for US Oil continues.
This Elliott wave corrective structure is a double zigzag, which is a fairly common structure. The correction is labelled Super Cycle wave (II).
The first zigzag in the double is complete and labelled cycle wave y. The double is joined by a three in the opposite direction labelled cycle wave x, which subdivides as a zigzag. The second zigzag in the double may now have begun, labelled cycle wave w.
The purpose of a second zigzag in a double zigzag is to deepen the correction when the first zigzag does not move price deep enough. To achieve this purpose cycle wave y may be expected to move reasonably below the end of cycle wave w at 26.06. The target calculated would see this expectation met.
Cycle wave y is expected to subdivide as a zigzag, which subdivides 5-3-5.
Cycle wave w lasted 7.6 years and cycle wave x lasted 2.7 years. Cycle wave y may be expected to last possibly about a Fibonacci 5 or 8 years.
If it continues higher, then primary wave B may not move beyond the start of primary wave A above 76.90.
WEEKLY CHART
Click chart to enlarge.
This weekly chart shows all of cycle waves x and y so far.
Cycle wave y is expected to subdivide as a zigzag. A zigzag subdivides 5-3-5. Primary wave A must subdivide as a five wave structure if this wave count is correct.
Primary wave A may be a complete five wave impulse at the last low.
Primary wave B may now be a complete single zigzag at the last high.
Primary wave C may have just begun. Primary wave C must subdivide as a five wave structure.
Primary wave A lasted 12 weeks, just one short of a Fibonacci 13.
Primary wave C may be longer in time as well as price. If cycle wave y lasts a Fibonacci 5 years, then primary wave C within it may take as long as a Fibonacci 233 weeks.
Intermediate wave (1) within primary wave C may be a complete impulse. Intermediate wave (2) may not move beyond the start of intermediate wave (1) above 66.59.
Draw a channel about the zigzag of primary wave y using Elliott’s technique for a correction. Draw the first trend line from the start of primary wave A to the end of primary wave B, then place a parallel copy on the end of primary wave A. The upper edge of this channel may show where bounces along the way down find resistance. The lower edge of the channel may provide support.
DAILY CHART
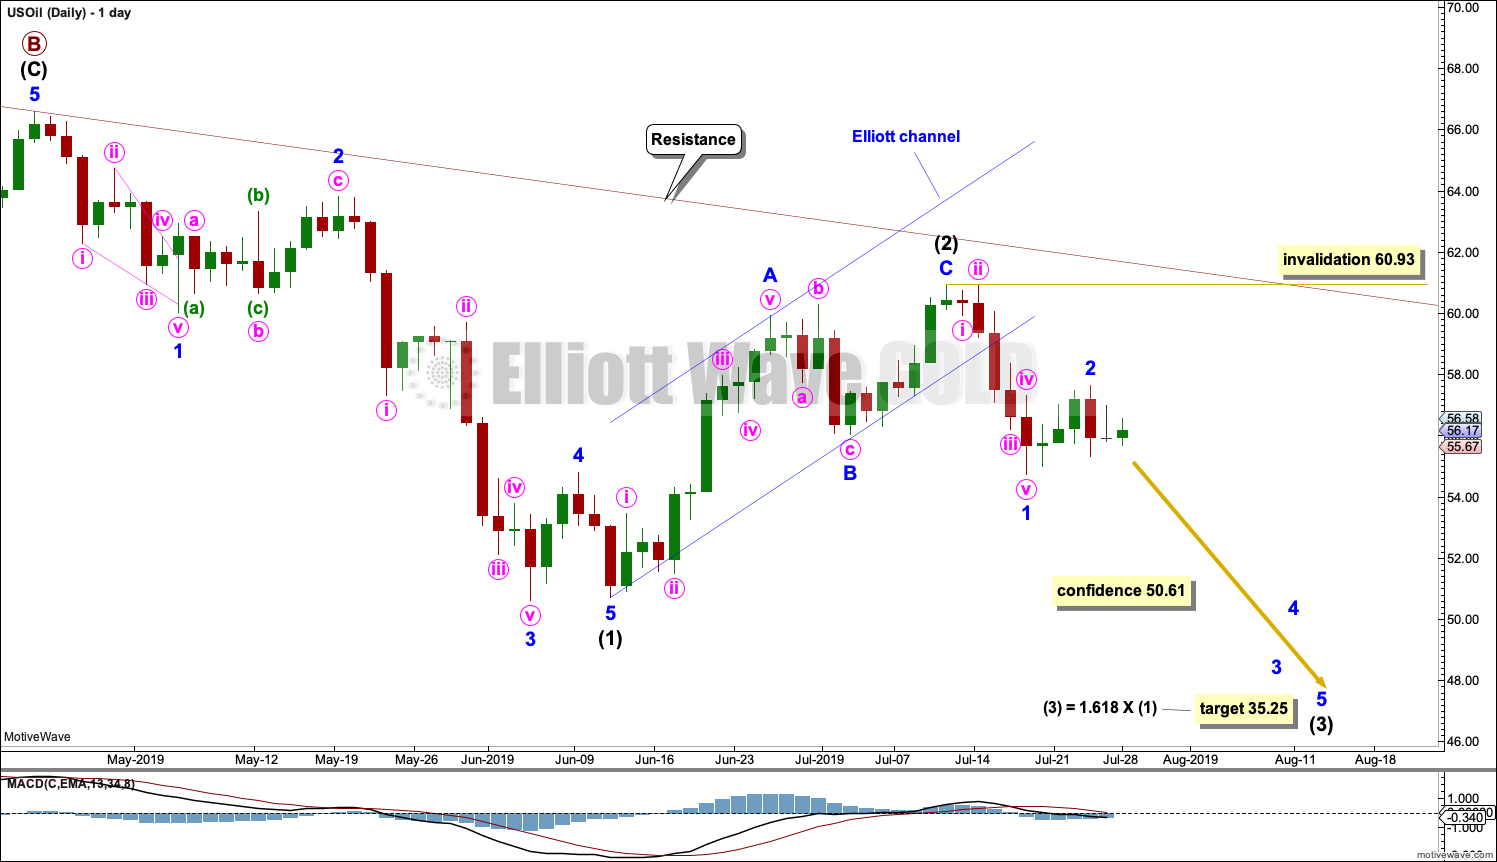
Click chart to enlarge.
Note that monthly and weekly charts are on a semi-log scale, but this daily chart is on an arithmetic scale. This makes a slight difference to trend channels.
It is possible that intermediate wave (1) is complete. Minor wave 4 for this wave count exhibits some alternation to minor wave 2; minor wave 2 may be a relatively deep zigzag or flat, and minor wave 4 may be a more shallow zigzag.
Minor wave 5 ends with a slight 0.11 truncation.
Intermediate wave (2) may also now be complete as a zigzag.
Intermediate wave (3) may only subdivide as an impulse, and it must move below the end of intermediate wave (1). Within intermediate wave (3), minor waves 1 and 2 may now be complete. It is possible that minor wave 2 may continue higher as a double zigzag. Minor wave 2 may not move beyond the start of minor wave 1 above 60.93.
The next downwards wave of minor wave 3 within intermediate wave (3) may be expected to exhibit an increase in momentum and an increase in ATR. It may have support from volume pushing price lower.
ALTERNATE ELLIOTT WAVE COUNT
MONTHLY CHART
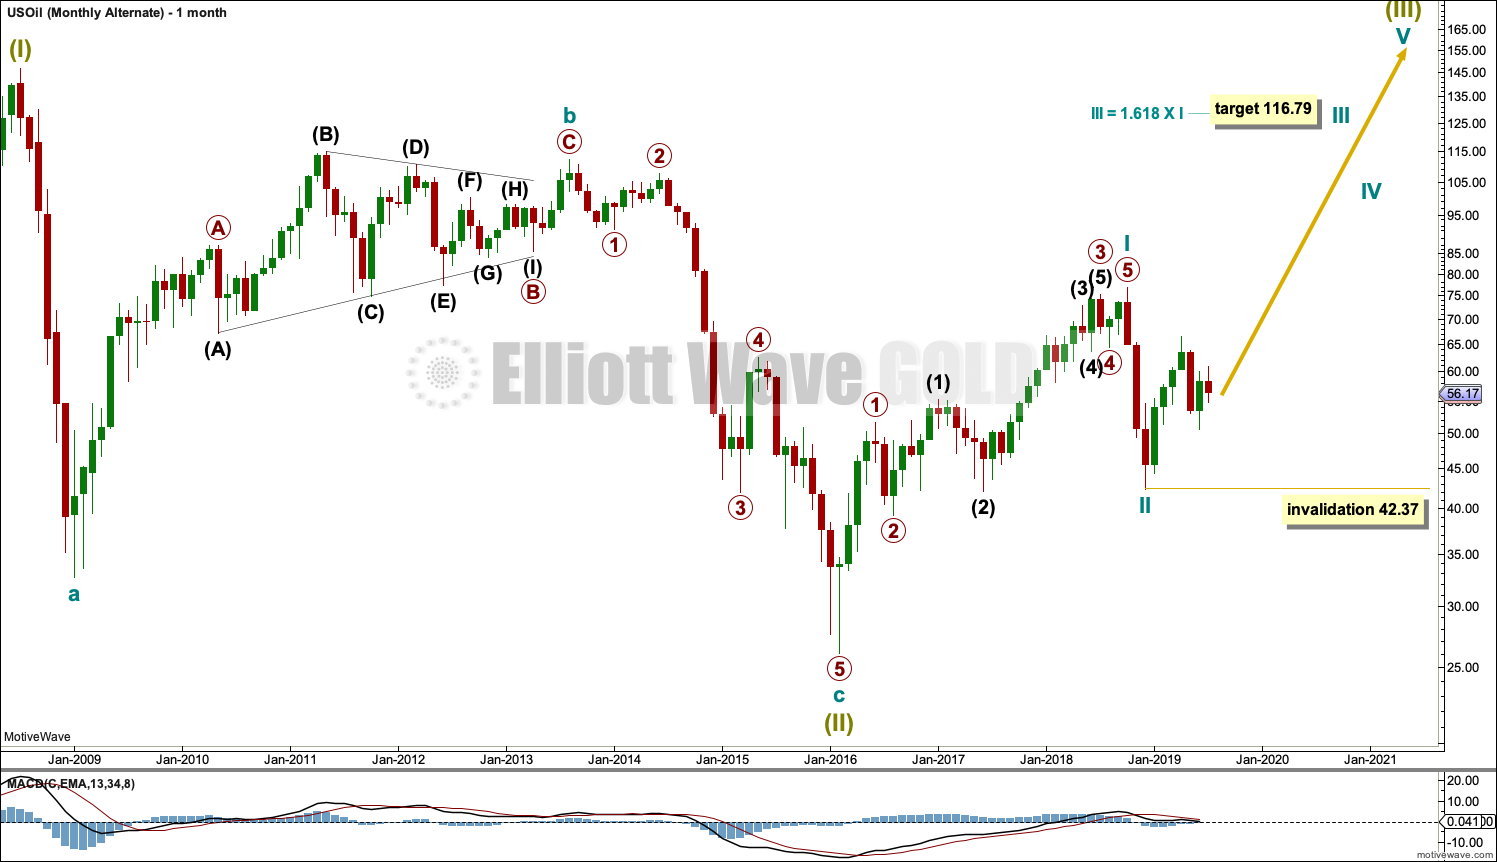
Click chart to enlarge.
It is possible that the bear market is over for Oil and a new bull market has begun.
For a bullish wave count for Oil, the upwards wave from the major low at 26.06 in February 2016 must be seen as a complete five wave impulse. This is labelled cycle wave I.
Cycle wave II may be a complete zigzag at 0.679 the depth of cycle wave I.
A target is calculated for cycle wave III to reach a common Fibonacci ratio to cycle wave I.
Within cycle wave III, no second wave correction may move beyond the start of its first wave below 42.37.
WEEKLY CHART
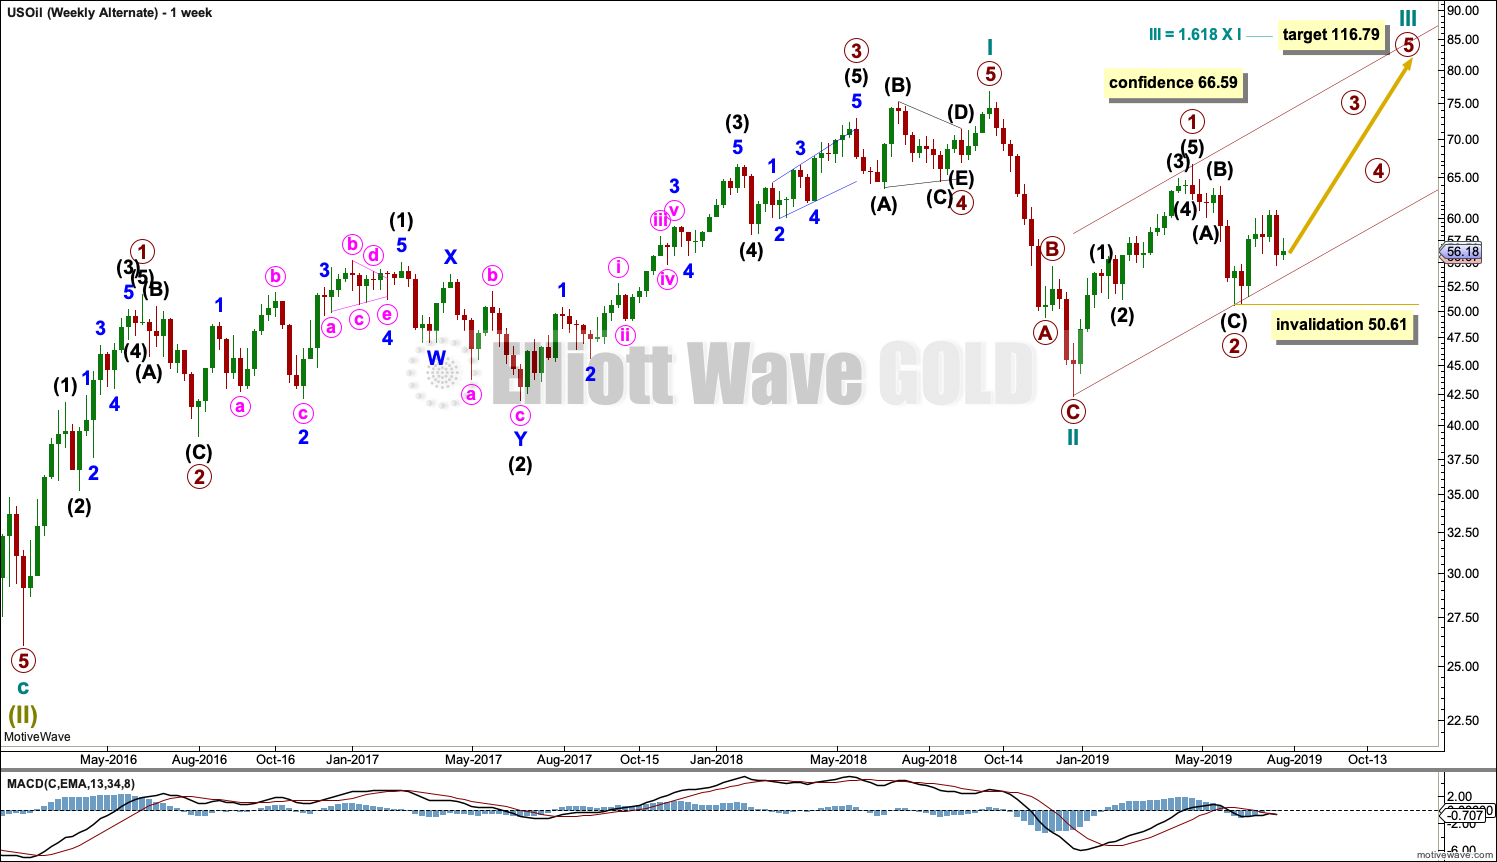
Click chart to enlarge.
This weekly chart shows detail of cycle wave I as a five wave impulse.
Cycle wave II does look best as a three. This is the only part of this wave count that has a better look than the main wave count, which sees this downwards wave as a five.
Cycle wave III may only subdivide as an impulse. Within cycle wave III, so far primary waves 1 and 2 may be complete.
Draw a base channel about primary waves 1 and 2. Draw the first trend line from the start of primary wave 1 to the end of primary wave 2, then place a parallel copy on the end of primary wave 1. The lower edge of this base channel may provide support for lower degree second wave corrections along the way up.
DAILY CHART
Click chart to enlarge.
Primary wave 3 may only subdivide as an impulse. Within the impulse, intermediate wave (1) may be complete.
Intermediate wave (2) may now be moving lower as a zigzag. A target is now calculated at two wave degrees for intermediate wave (2) to end.
Intermediate wave (2) may not move beyond the start of intermediate wave (1) below 50.61.
TECHNICAL ANALYSIS
MONTHLY CHART
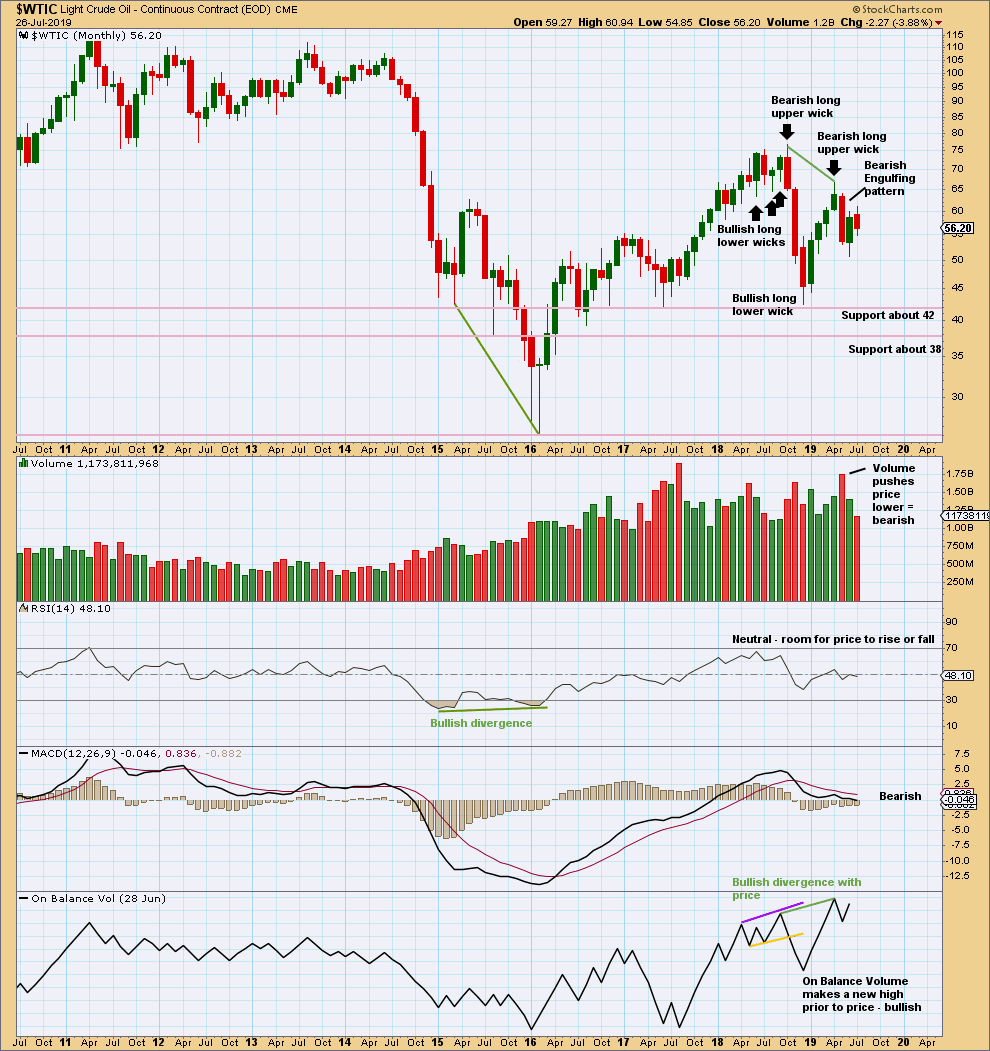
Click chart to enlarge. Chart courtesy of StockCharts.com.
May has closed with a strong Bearish Engulfing candlestick pattern, which has strong support from volume. This supports the main Elliott wave count.
June moved price lower with a lower low and a lower high, but the candlestick closed green and the balance of volume was upwards. Upwards movement within the month did not have support from volume. This also supports the main Elliott wave count.
Bullish divergence between price and On Balance Volume supports the alternate Elliott wave count.
WEEKLY CHART
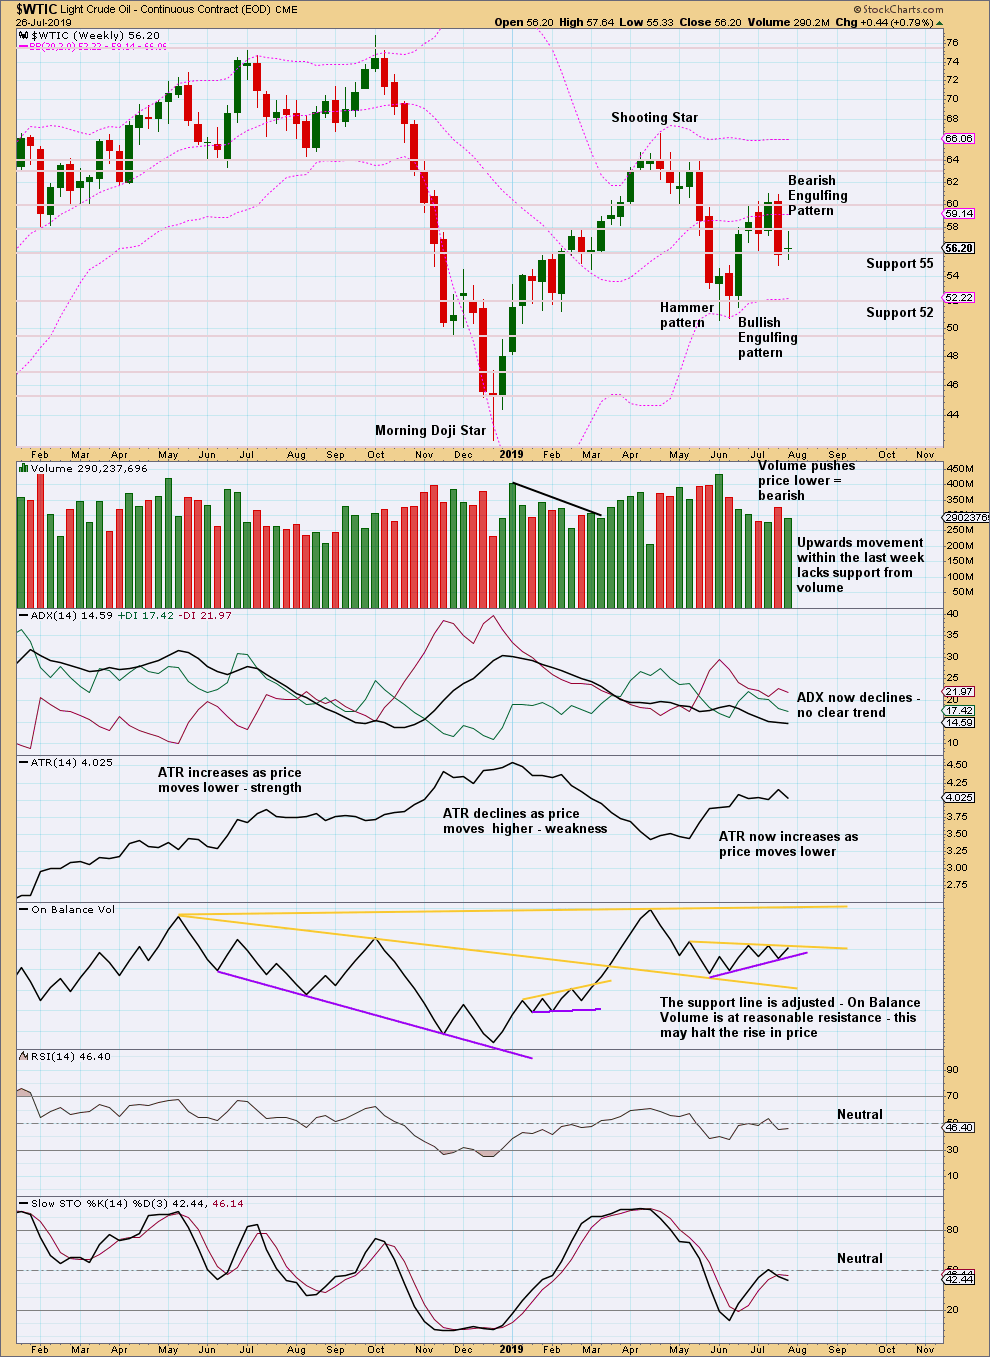
Click chart to enlarge. Chart courtesy of StockCharts.com.
Last week a strong bearish candlestick reversal pattern after a bounce of five weeks has good support from volume and a bearish signal from On Balance Volume. This fairly strongly supports the main Elliott wave count.
This week an inside week completes as a Doji, which lacks support from volume for upwards movement within the week. This also supports the main Elliott wave count.
DAILY CHART
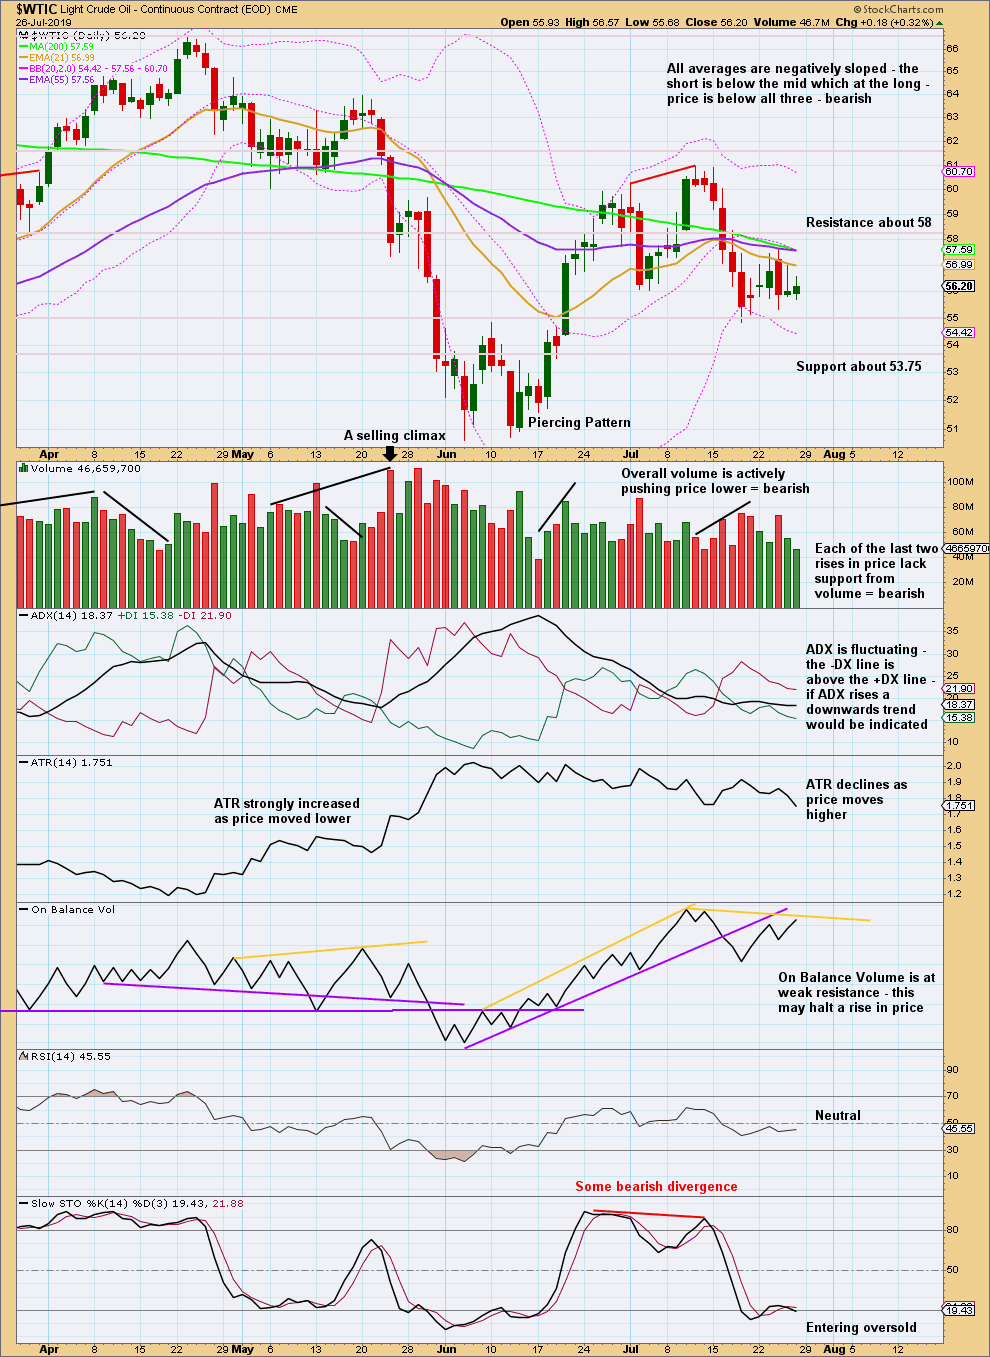
Click chart to enlarge. Chart courtesy of StockCharts.com.
The downwards day of the 24th of July had increased ATR and a strong push from volume moving price lower. The Elliott wave count sees this as the first day of a third wave. Third waves should exhibit strength. This supports the Elliott wave count.
—
Always practice good risk management as the most important aspect of trading. Always trade with stops and invest only 1-5% of equity on any one trade. Failure to manage risk is the most common mistake new traders make.
Lara,
Until there is more proof oil is bearish I’m leaning toward your daily alternate usoil chart. If RSI should start breaking below June’s lows on multiple time frames than I’ll take a bearish view into consideration. Right now with the Elliott wave oscillator near 0 line both daily and weekly that leads me to believe this could be a 2nd wave up. I also see trend line support on multiple time frames as well. I don’t like primary (circle) 2 at the December lows so I guess the alternate would be minor c wave down now. I can’t prove a corrective wave following Bill Williams right now. Now less see if higher highs continues 🙂
Lara,
I am now studying correlation co-efficients. I am using the free version of Stockcharts.
Can you point me to a few securities that have statistically significant and reliable correlation in the opposite direction, please. When one goes up, the other goes down. I wanna understand how that works.
Thank you kindly.
USD Index and EURUSD have a reliable statistically significant correlation co-efficient.
And just in case you haven’t read it, here’s my short explanation of the correlation co-efficient.
This morning I initiated my accumulation of short Oil positions using a 3X leveraged ETF. I have taken 1/4 or what should be my final full position. Stop loss orders are in place. Later today I am headed to a large amusement and water park / resort with my wife and 2 granddaughters. I will take in some of the ‘wild’ rides while hoping oil has a not so wild ride to the downside for months to come. Have a great week everyone.
Pretty cool Rodney. Which ETF did you go with? I’m into Drip, but considering dwt instead so I can track the oil price alone.
Nicely done Rodney!
3rd wave looking real now.
Updated daily chart for the S&P500:
Because the downwards movement of the last few hours has so strongly breached the channel which contained all prior upwards movement from the 3rd June low, I am relabelling that upwards wave as now complete, and this downwards wave as its correction. They should be labelled the same degree
So again, intermediate (1) may have been complete at the last high. Intermediate (2) may now be unfolding lower. The 0.382 Fibonacci ratio shall be a reasonable target. I wouldn’t expect intermediate (2) to be particularly deep, that’s not been the pattern for this market for some time now.
Within intermediate (2) a consolidation or bounce for minor B should unfold. It should exhibit weakness, it may be time consuming and complicated. It may take some time, about a week or so maybe. Then finally minor C down.
Looks like an oil short is the best trade to make now. I will be looking to open an OILD position early next week. Of course, SPX long is a position to consider. But I already have a large position long SPX.
I wish momentum was higher.
If we are in the beginning of a 3rd of a 3rd, momentum should increase substantially. At the moment, I am waiting to allow for a bit more upside. I think I will scale in over the next few days or weeks.
Oil just clocked some serious volume on the 15min chart.
Hi Lara,
Thanks for the monthly charts of Gold. Greatly appreciated…
For the bullish monthly chart, you talked about Super Cycle Wave IV being short.
I agree that it is short but in my opinion, I think it is entirely possible that what you have labelled as Super Cycle III is maybe Cycle 1 of Super Cycle III and what you what as Super Cycle IV is maybe Cycle II of Super Cycle III. In other words, we might have an extended Wave III and I move the labelling down 1 level.
The reason for that thinking is entirely macro fundamental…
The enormous debt accumulated since 1971 after the removal of the gold standard has to be inflated away. Since 2008, the central banks around the world decided not to default on the debt because of political influence. There is no turning back on that decision… The easiest path is to continue the illusion by printing money until we have hyperinflation. That might be a decade or 2 away.
With Europe and Japan having negative interest rates, it is difficult to imagine lower gold prices.
The question is how strong is the US dollar… If it is extremely strong, we might have a depression where everything goes down, and even gold. In order for that to happen, the US government will have to default on their debt. There is no chance of that happening.
With Trump pressuring almost daily the Fed to lower interest rates and the Fed did an about face on January 4th, 2019, I doubt the US dollar will be stronger than Gold. Gold broke out of a 6 year range on the news that the Fed will cut interest rates in late July which is now next week.
This is why It is very very difficult to believe your bearish EW counts on Gold, even though I understand the struggle of the 5 wave structure of Wave I… I am trying to figure out a fundamental scenario that it might happened with the dire picture of the interest rates… I cannot figure it out. Ideas???
I thought it was the S&P 500 going to the moon but that’s out the window since I really believe now your main EW count for the S&P 500. It has only a possible 10% upside from here…
Very interesting developments.
All the best,
Mathieu
Your idea of the high (all time high) being labelled only cycle wave I of Super Cycle wave III would see a cycle degree wave which lasted from 1931 to 2002, that’s 71 years.
While the approach to how long degrees of waves last should be fairly flexible, that’s just too flexible. That’s a horrible proportion with Super Cycle wave II which lasted 8 years (from 1923 to 1931).
Regarding your logic using fundamental analysis, I can make no comment.
Elliott wave is mutually exclusive to fundamental analysis. The underlying premise of Elliott wave is that it is our social mood (as expressed in market movement, waves) which drives the news, our politics and the decisions of politicians and the Fed and all other powerful decision making bodies, not the other way around.
It is a rather difficult concept to wrap ones head around at first, it flips everything we think we know on its head. I know it is also a wildly unpopular view currently and so you may disagree with it. That’s okay.
I approach all market analysis from a purely data driven point of view. I’m looking only at price, volume, momentum etc. I’m also looking at correlation co-efficients and not assuming a relationship between markets which don’t have a statistically significant and reliable correlation. That also appears to be a rather unpopular approach.
And so I do not know what the excuse or reason for a bearish movement in Gold could be. But if price does follow that wave count I am sure the talking heads will find one, after the fact.
A fascinating and informative discussion. Thank you both.
Hi Lara,
Thanks for that….
My analysis is 90% technical and 10% fundamental as the fundamental part gives me a vision of the future…
Currently, there are only 2 possible scenarios in the next 20 to 40 years: Either all markets collapse with the load of debt OR they will be inflated away. In 2008-2009, politicians have decided on the latter as they could not succumb to a long deflationary depression. Therefore, they have decided to sacrifice the currencies to keep the dream going. They will eventually go to zero creating an eventual hyperinflation…. So this tells me that Gold will probably end up in an upward parabolic move. Gold is the ultimate money… Your Supercycle chart shows the acceleration. Every sideways movement is getting shorter and shorter.
In my 20 years of experience in the precious metals market, when the gold miners lead the commodity upward (meaning gold stocks outperform gold), it is a bull market. I have seen it many times from 2001 to 2011…. The contrary occurred in 2011 and we had a major bear market in the Gold sector, the worst ever.
Stockcharts.com lets you do relative analysis by dividing one security by another…
Currently the ratio $XAU:$SPX is finally breaking out after an 8 year downturn. Also $XAU:$GOLD is breakout out. Silver equities are the best performing stocks currently since July 15th beating out my technology cloud stocks.
The above is more technical evidence that we have a major move in the precious metals. That’s a purely data driven point of view.
Are you using relative analysis (a.k. a. ratio charts in stockscharts.com) in your analysis to give you more evidence and clues on the next moves?
The excuse for a bearish move in both gold & the US markets would be that the central banks did not print enough money to keep the dream alive. This would mean the US dollar would be the king… However, from now on, I think all the future selloff like the one we had in the 4th quarter of 2018, will be just central banks being too optimistic in the economy and raising interest rates too quickly… They will changed their minds like they always do and become more dovish as they do NOT want to relive a 2008 again in their lives….
I was in the US markets until June 19th but I was floored when Gold broke that 6 year range… I could not ignore it anymore. Gold suffered so much bearishness during the last 8 years ( and I lived it and suffered as well) and to breakout like this? A lot of data driven and relative evidence are lining up for a bull market in Gold.
Cheers,
Mathieu
Thank you Mathieu. Very informative. Respect your real world market experience.
I have always wondered if miners lead the metal and I remember asking that question in this forum a year or so ago. I noticed at times it did and at times it did not. Now, I have the answer and it makes perfect sense when seen as the market discounting the future.
I live in Canada and my investments are in tax sheltered accounts. Recently, I converted my holdings to Canadian from the previous US$ denomination.
Thank you kindly.
Thanks again.
I don’t use ratio analysis (relative charts, gold to anything else) in my analysis, no.
I may be wrong in this assessment, but I look at those charts as having their own support and resistance which may be broken, and then a trend may continue, but for how long?
Just because support or resistance is broken does not mean it can’t be again broken in the other direction.
If a ratio is moving in one direction, that direction can change. So I don’t want to base my analysis of any one market on another market and a ratio between the two.
I’ll only base my analysis of one market on any other market if they have a reliable and statistically significant correlation co-efficient.
That may be unpopular, but it makes sense to me. And you are most welcome to disagree with my approach of course.
GDX broke below extremely significant support at 20.80 in August 2018 and moved strongly lower from there. But it hasn’t stayed below that support. It turned around and broke back above 20.80 in December 2018, just 4 months after it broke below. That taught me the hard way that once strong support or resistance is broken, it doesn’t mean price MUST stay on the other side.
Price can do whatever it pleases. So I’ve learned flexibility.
Lara,
You are by far the expert on EW analysis and hence my question. I emailed EWI, but never got an answer, even when I was a subscriber.
I am aware that the underlying premise of Elliott wave is that it is our social mood that drives the news. When we speak of “social mood”, how is it born or formed? Does it form as a result or interplay of world events or is it something that happens due to unknown reasons. Is it a factor of time? Where can I read more about this, please?
Thank you kindly.
Well, this is the “woo” area of Elliott wave, but it does have a little research to back it up.
As far as I know, this is how the underlying theory of social mood goes:
We are a social species, we herd in groups. I remember watching this IRL in real time when I was teaching years ago now (high school science). One school I taught in had about 1,000 students, and a central area with walkways above. Doing lunch time duty my colleague and I enjoyed watching how the kids moved in groups, and how those groups formed and changed. When there was something interesting they’d all move together (usually it was a fight which I then had to break up, ugh). It reminded us of nature documentaries when herds of ungulates roam on plains. Anyway, it may not be so relevant and my conclusions there may be wrong, but that’s the view we drew at the time (both biology teachers).
And so the theory is that as a species that forms large social groups, those groups have a mood. Optimistic or pessimistic. And that mood swings from one to the other, and the swings are in waves.
Three steps forward, two steps back. That’s the Elliott wave structure of our social waves. Each small optimistic wave is followed by a slightly smaller pessimistic wave. Then another optimistic wave. And so on, to form Elliott waves.
And it’s fractal. It builds upon itself. And Fibonacci math is embedded, as it is also observable in other aspects of nature.
This whole theory is very controversial, particularly in bull markets. Currently our stock markets as a barometer of our social mood has been in a long bull market over 10 years now. Technical Analysis of all varieties does tend to become unpopular in bull markets, reaching a peak of unpopularity at the peak of a bull market. Elliott wave is one of the more fringe theories in TA, so much so that the CMT Association recently removed it from their level III course.
So I expect many will read what I’ve written above and scoff. That’s okay, so long as you do so politely 🙂
Thank you Lara, much appreciated.
I wouldn’t worry too much about people that scoff. People that scoff tend not to learn or progress.
Thank you kindly.
Hi Lara,
Thanks for everything… I always respect your opinion…. It is always interesting to hear what you think on different aspects that I believe…
I treat ratio charts like any charts because they trend upwards, downwards or sideways…
When GDX broke down under 20.80, I totally agreed with you that GDX was going to be down for at least a year. The long standing sideways movement that failed gave you and me that information…
But having GDX and Gold reversed and going through resistance, that totally surprised me and showed that the bear market is most likely over.
Cheers,
Mathieu