

S&P 500
At the end of this week, the AD line and VIX indicate the most likely Elliott wave count.
Summary: The main wave count will expect intermediate wave (2) may now be over and a third wave up at two degrees may begin on Monday. The target is at 3,213. Confidence in this view may be had if any one or more of the following occurs next week:
– a new all time high in price with support from volume
– a new all time high in the AD line
– a 90% up day (or close to it)
– a strong bullish candlestick reversal pattern on the daily chart with support from volume
Alternatively, intermediate wave (2) may continue lower for another week or two as a double zigzag towards the 0.618 Fibonacci ratio at 2,842.28. Confidence in this view may be had if price makes a new low below 2,914.11 by any amount at any time frame.
The biggest picture, Grand Super Cycle analysis, is here.
Monthly charts were last published here, with video here. There are two further alternate monthly charts here. Video is here.
ELLIOTT WAVE COUNTS
The two weekly Elliott wave counts below will be labelled First and Second. They may be about of even probability. When the fifth wave currently unfolding on weekly charts may be complete, then these two wave counts will diverge on the severity of the expected following bear market. To see an illustration of this future divergence monthly charts should be viewed.
FIRST WAVE COUNT
WEEKLY CHART
Click chart to enlarge.
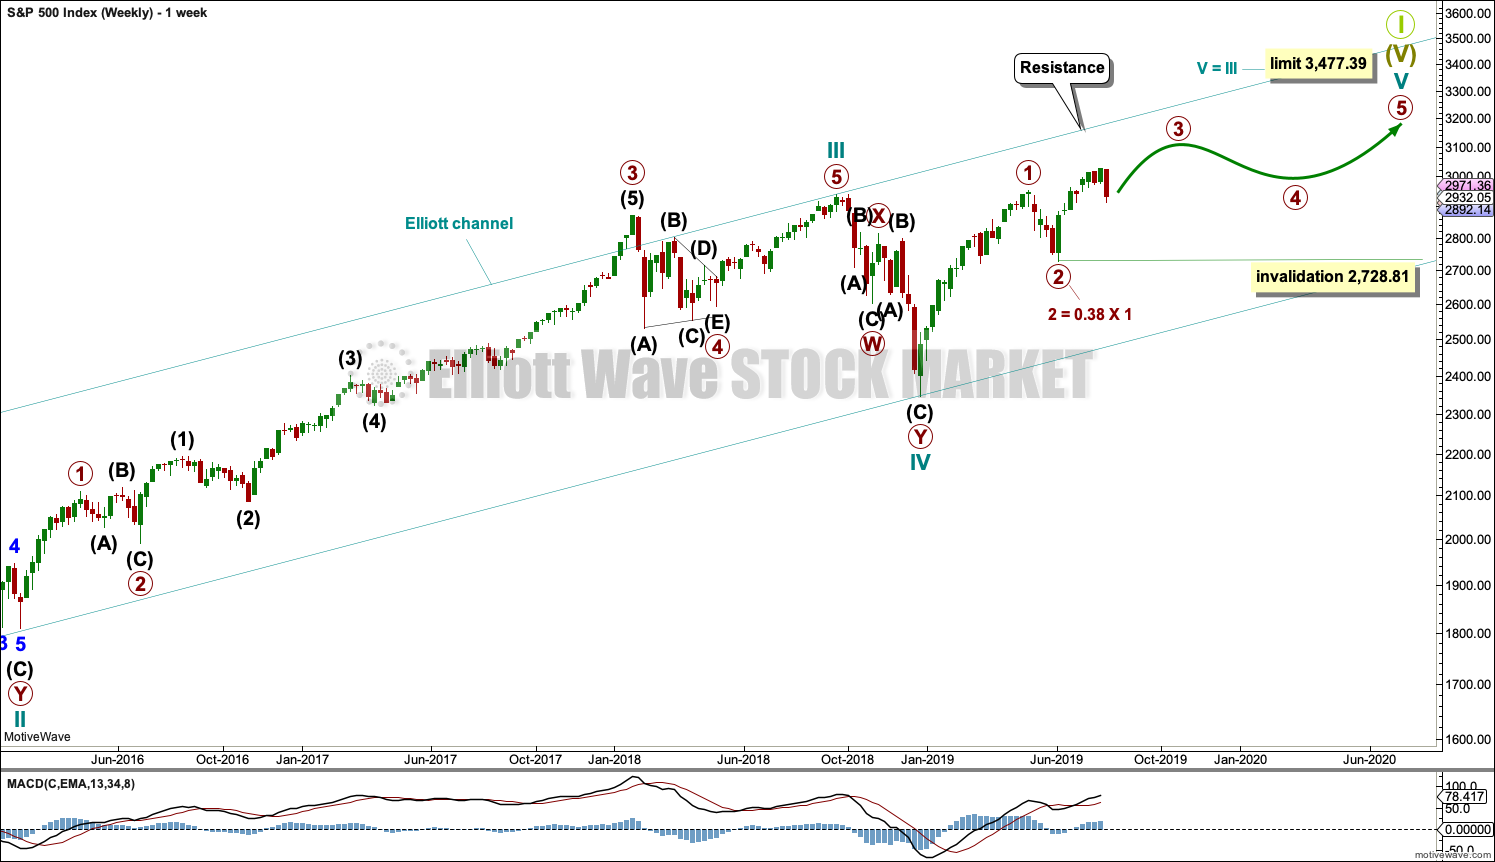
The basic Elliott wave structure consists of a five wave structure up followed by a three wave structure down (for a bull market). This wave count sees the bull market beginning in March 2009 as an incomplete five wave impulse and now within the last fifth wave, which is labelled cycle wave V. This impulse is best viewed on monthly charts. The weekly chart focusses on the end of it.
Elliott wave is fractal. This fifth wave labelled cycle wave V may end a larger fifth wave labelled Super Cycle wave (V), which may end a larger first wave labelled Grand Super Cycle wave I.
The teal Elliott channel is drawn using Elliott’s first technique about the impulse of Super Cycle wave (V). Draw the first trend line from the end of cycle wave I (off to the left of the chart, the weekly candlestick beginning 30th November 2014) to the end of cycle wave III, then place a parallel copy on the end of cycle wave II. This channel perfectly shows where cycle wave IV ended at support. The strongest portion of cycle wave III, the end of primary wave 3, overshoots the upper edge of the channel. This is a typical look for a third wave and suggests the channel is drawn correctly and the way the impulse is counted is correct.
Within Super Cycle wave (V), cycle wave III is shorter than cycle wave I. A core Elliott wave rule states that a third wave may never be the shortest. For this rule to be met in this instance, cycle wave V may not be longer in length than cycle wave III. This limit is at 3,477.39.
Within cycle wave V, primary waves 1 and 2 may now be complete. Within primary wave 3, no second wave correction may move beyond its start below 2,728.81.
Cycle wave V may subdivide either as an impulse or an ending diagonal. Impulses are much more common. Ending diagonals normally have second and fourth waves that are deep; the common depth is from 0.66 to 0.81 the prior wave. So far a correction within cycle wave V has not been deeper than 0.5, so a diagonal at this stage looks very unlikely (but remains possible).
In historic analysis, two further monthly charts have been published that do not have a limit to upwards movement and are more bullish than this wave count. Members are encouraged to consider those possibilities (links below summary) alongside the wave counts presented on a daily and weekly basis.
The daily chart below will now focus on price movement from the low of primary wave 2.
MAIN DAILY CHART
Click chart to enlarge.
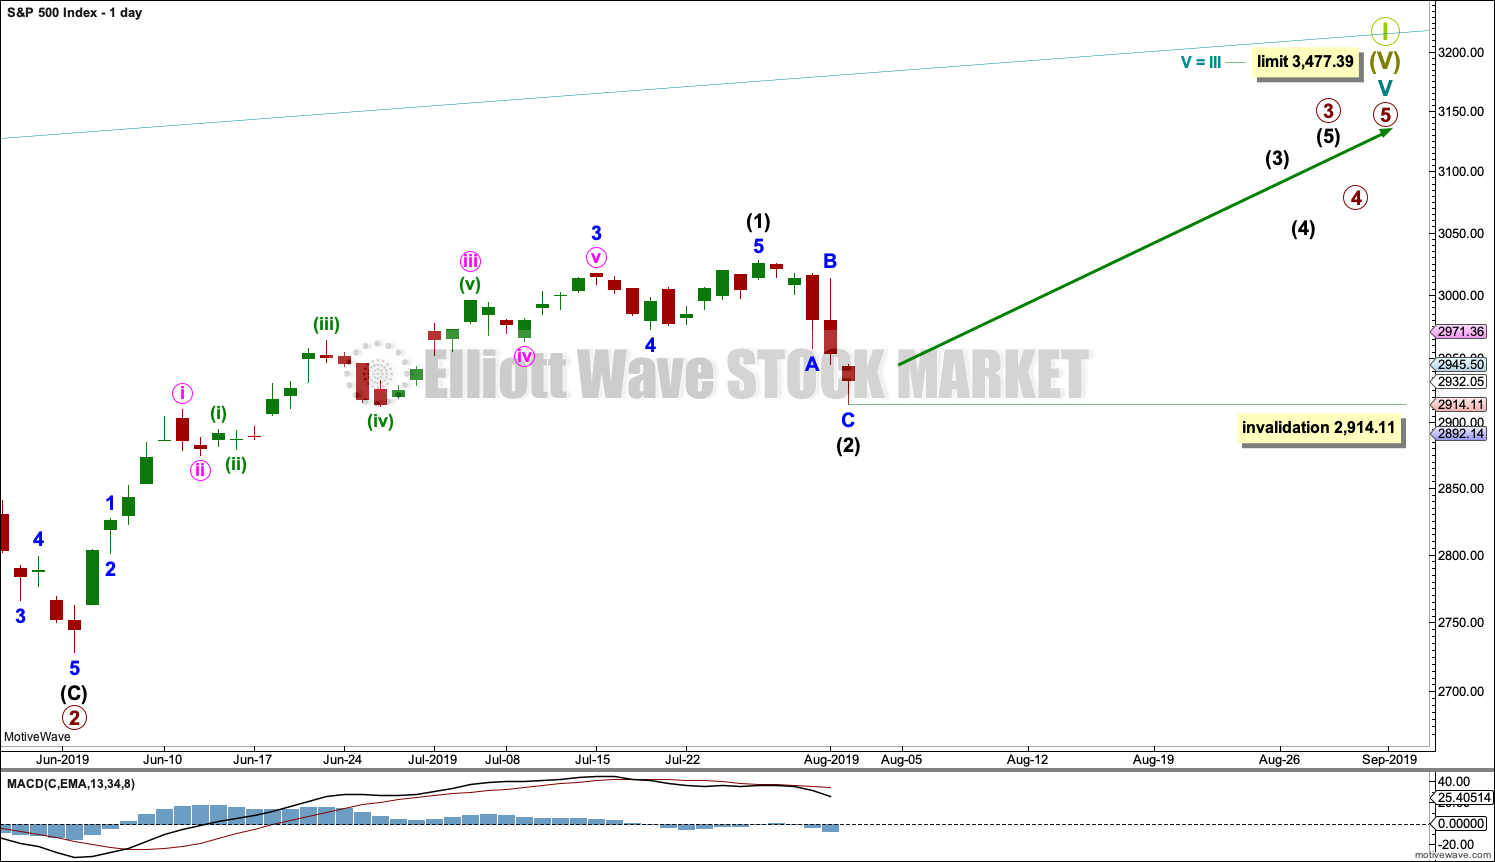
Cycle wave V must subdivide as a five wave motive structure. Within that five wave structure, only primary wave 1 may be complete.
Primary wave 3 may only subdivide as an impulse. Within primary wave 3, intermediate waves (1) and (2) may now be complete. Intermediate wave (2) may have ended close to the 0.382 Fibonacci ratio of intermediate wave (1).
A target is calculated for intermediate wave (3) that fits with the higher limit for cycle wave V. Within intermediate wave (3), no second wave correction may move beyond the start of its first wave below 2,914.11. This invalidation point is absolute.
This wave count expects a trend change at Friday’s low; this may be premature. Classic technical analysis will be used next week for confidence in this wave count as outlined in the summary above.
ALTERNATE DAILY CHART
Click chart to enlarge.
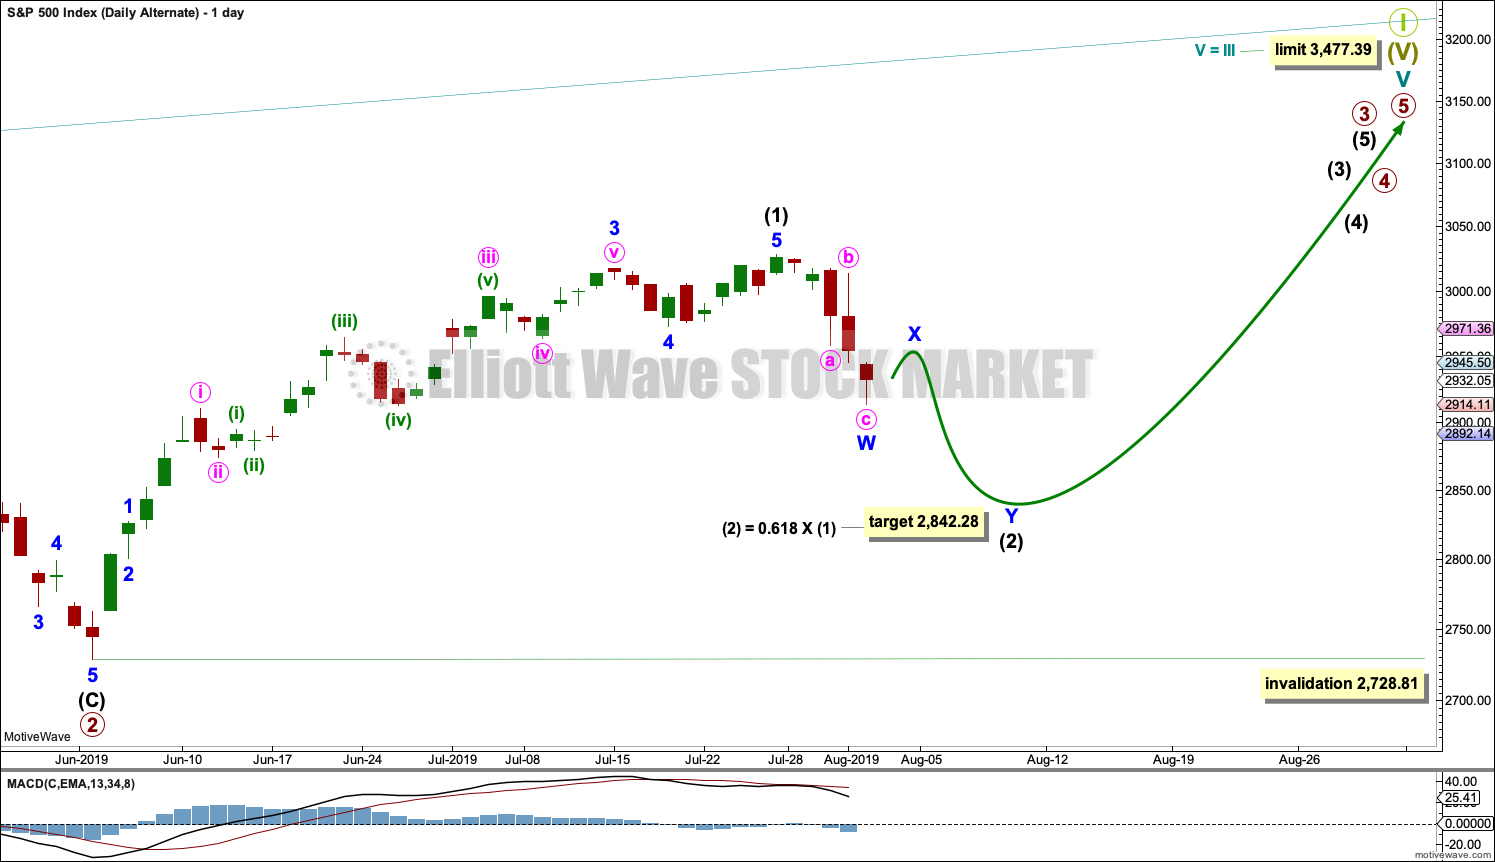
This wave count is identical to the main wave count up to the high labelled intermediate wave (1). Thereafter, the degree of labelling within intermediate wave (2) is moved down one degree. It is possible that intermediate wave (2) may continue lower for another week or two as a deeper double zigzag. The 0.618 Fibonacci ratio is a reasonable target.
Intermediate wave (2) may not move beyond the start of intermediate wave (1) below 2,728.81.
SECOND WAVE COUNT
WEEKLY CHART
Click chart to enlarge.
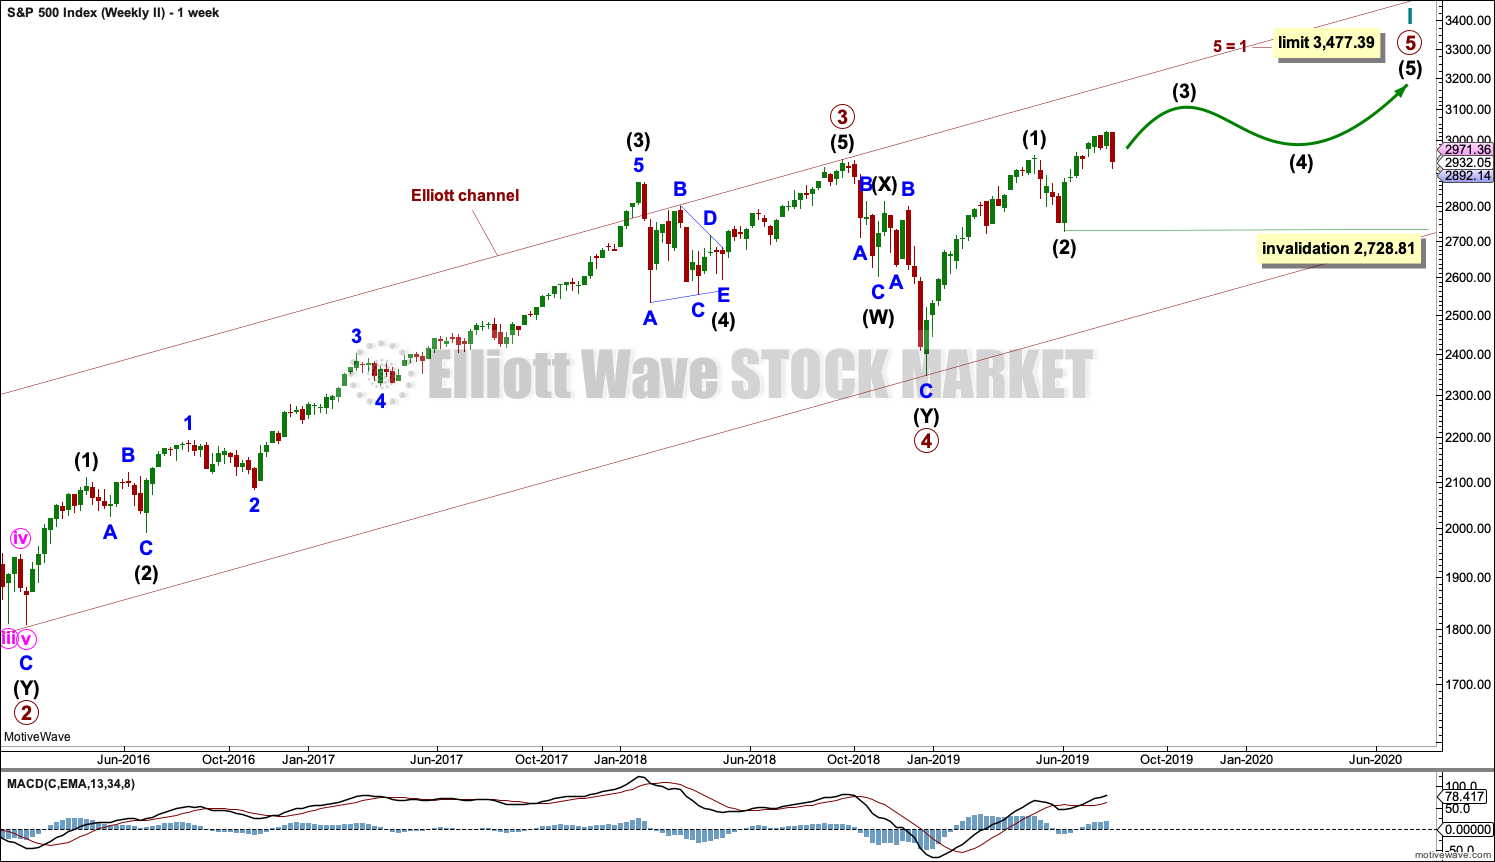
This weekly chart is almost identical to the first weekly chart, with the sole exception being the degree of labelling.
This weekly chart moves the degree of labelling for the impulse beginning in March 2009 all down one degree. This difference is best viewed on monthly charts.
The impulse is still viewed as nearing an end; a fifth wave is still seen as needing to complete higher. This wave count labels it primary wave 5.
TECHNICAL ANALYSIS
WEEKLY CHART
Click chart to enlarge. Chart courtesy of StockCharts.com.
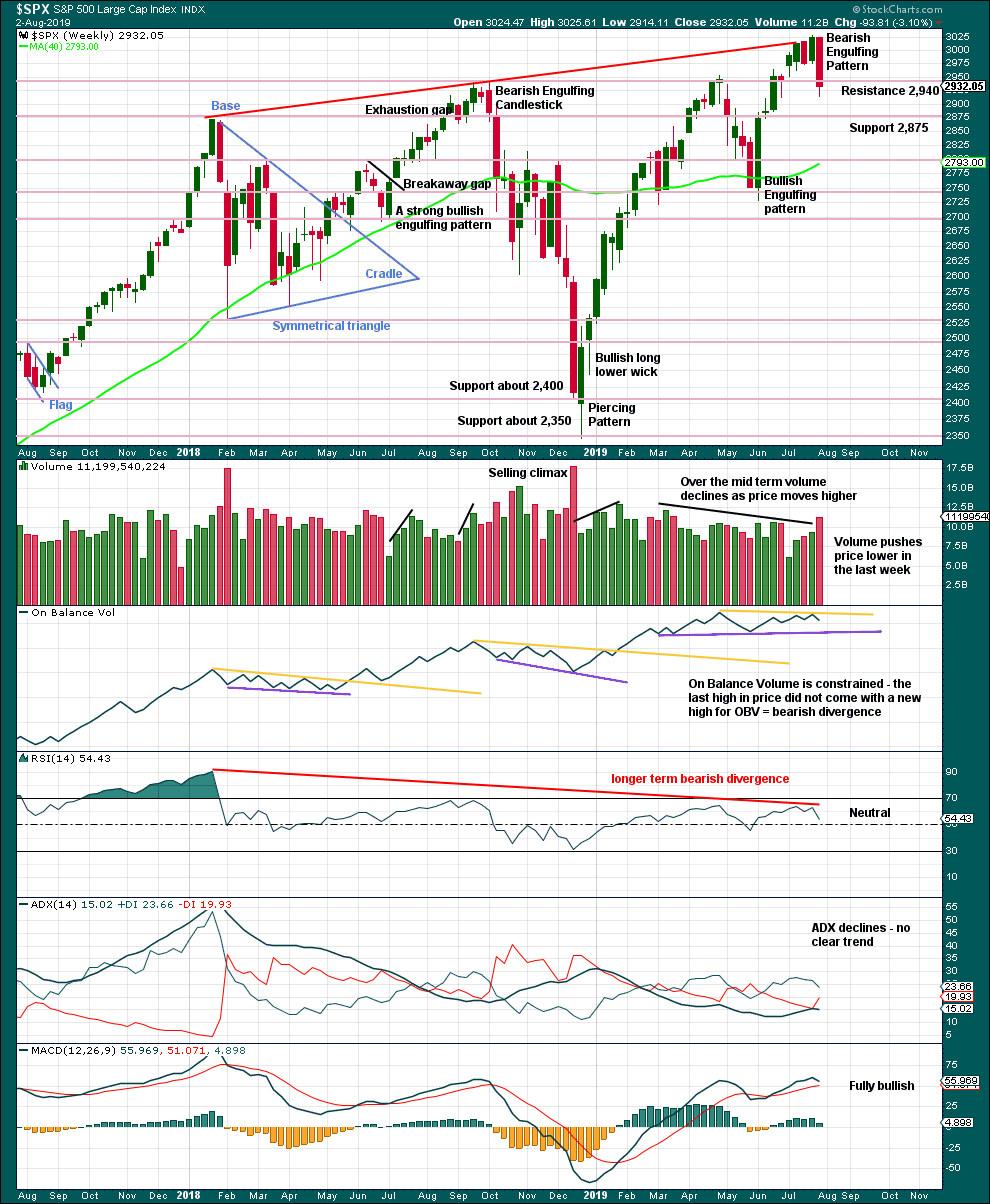
This week a very strong Bearish Engulfing candlestick pattern supports the alternate Elliott wave count. It has good support from volume.
DAILY CHART
Click chart to enlarge. Chart courtesy of StockCharts.com.
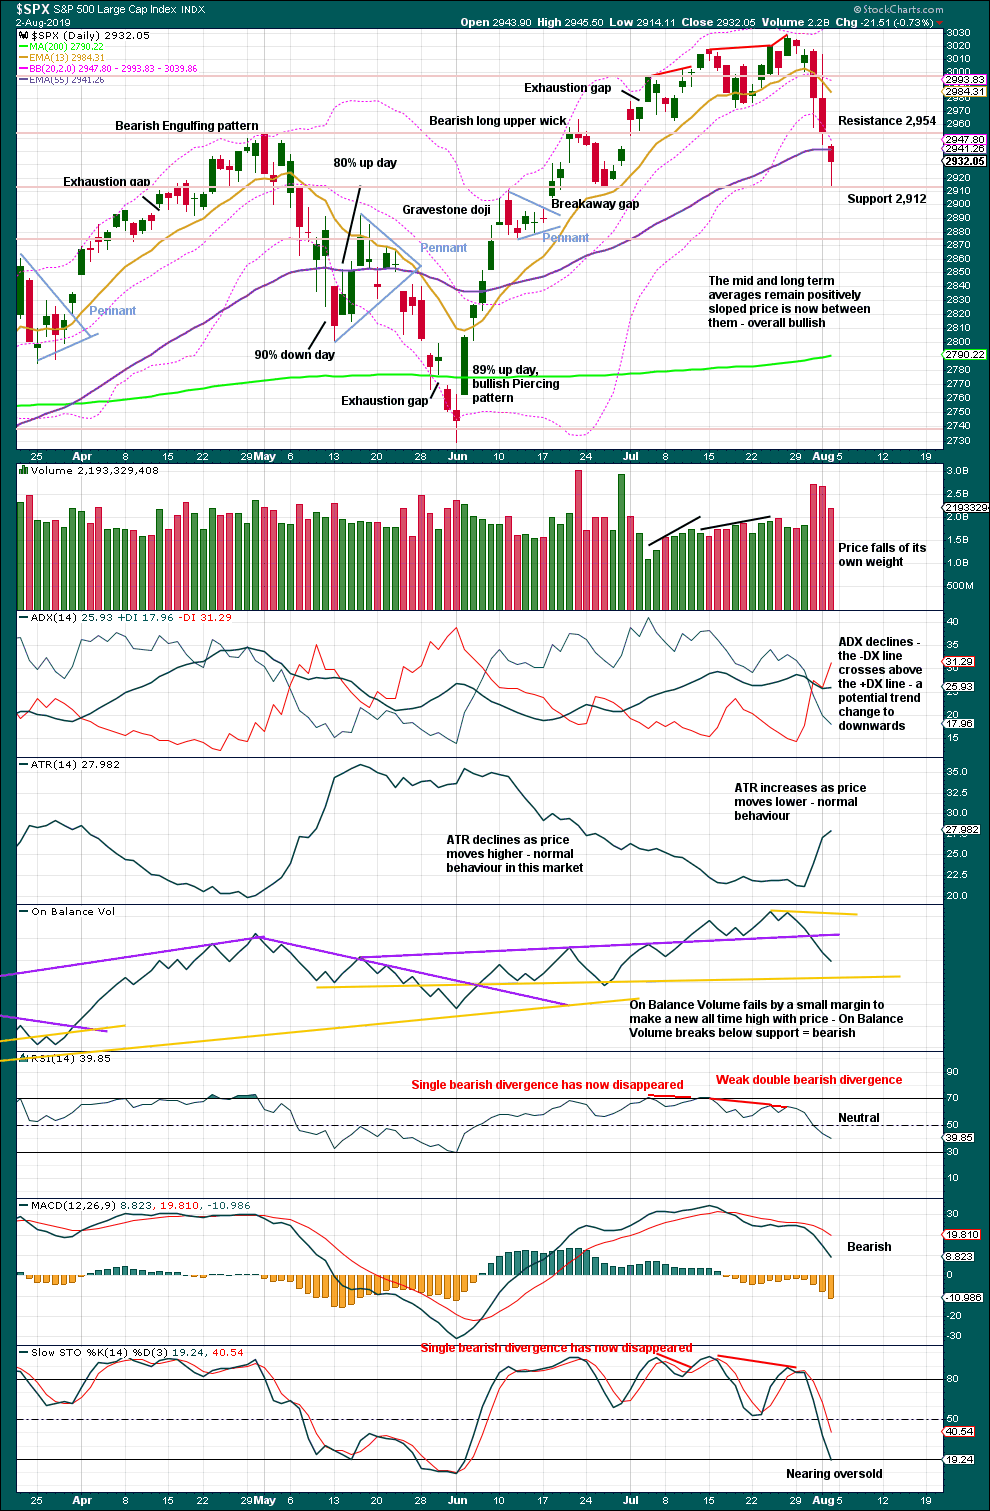
Support about 2,912 has been reached and from there price bounced up on Friday. The long lower wick on Friday’s candlestick is bullish for the short term.
There is still room for price to fall further before conditions reach oversold.
BREADTH – AD LINE
WEEKLY CHART
Click chart to enlarge. Chart courtesy of StockCharts.com. So that colour blind members are included, bearish signals
will be noted with blue and bullish signals with yellow.
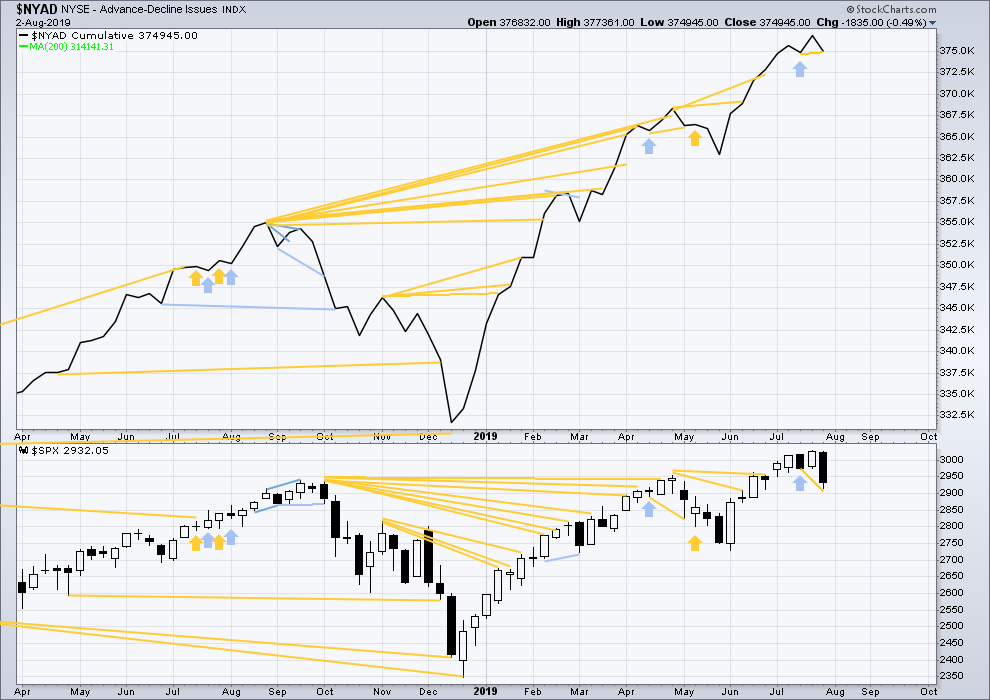
Bear markets from the Great Depression and onwards have been preceded by an average minimum of 4 months divergence between price and the AD line with only two exceptions in 1946 and 1976. With the AD line making new all time highs again this week, the end of this bull market and the start of a new bear market is very likely a minimum of 4 months away, which is mid November 2019.
In all bear markets in the last 90 years there is some positive correlation (0.6022) between the length of bearish divergence and the depth of the following bear market. No to little divergence is correlated with more shallow bear markets. Longer divergence is correlated with deeper bear markets.
If a bear market does develop here, it comes after no bearish divergence. It would therefore more likely be shallow.
This week price has made a new low below the short term low two weeks prior, but the AD line has failed to make a corresponding new low by a small margin. This divergence is bullish for the short term and slightly supports the main Elliott wave count.
DAILY CHART
Click chart to enlarge. Chart courtesy of StockCharts.com. So that colour blind members are included, bearish signals
will be noted with blue and bullish signals with yellow.
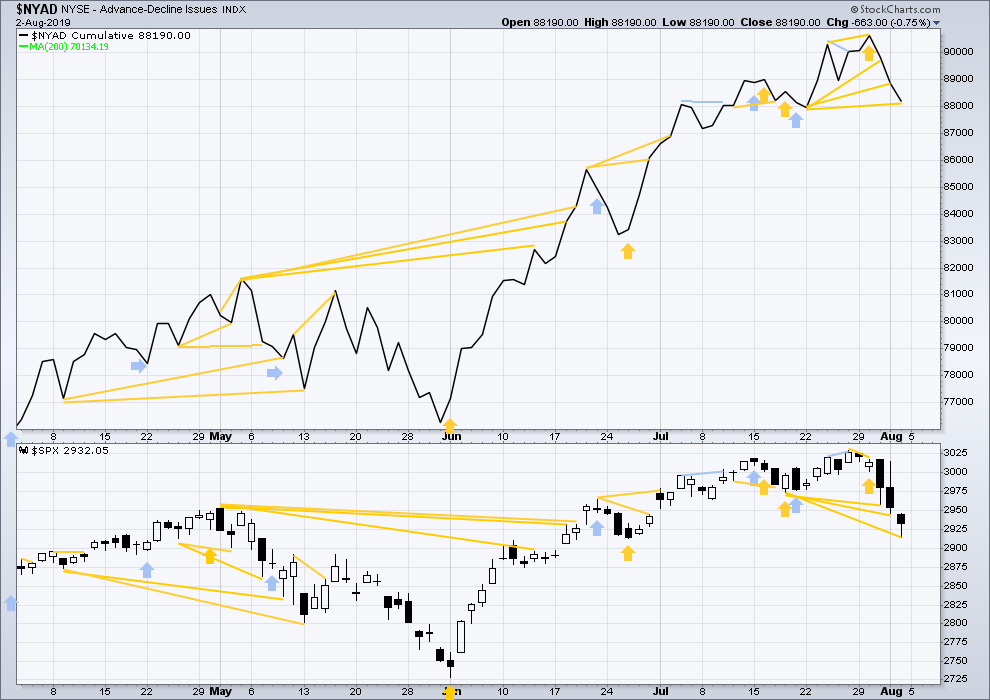
Breadth should be read as a leading indicator.
Price has moved lower to make another new low below the prior swing low of the 18th / 22nd July, but the AD line has not. Downwards movement does not have support from a corresponding decline in market breadth. This divergence is bullish and suggests any further downwards movement here from price may be relatively limited.
Within this pullback, mid and large caps made new short-term swing lows first then small caps followed on Friday.
VOLATILITY – INVERTED VIX CHART
WEEKLY CHART
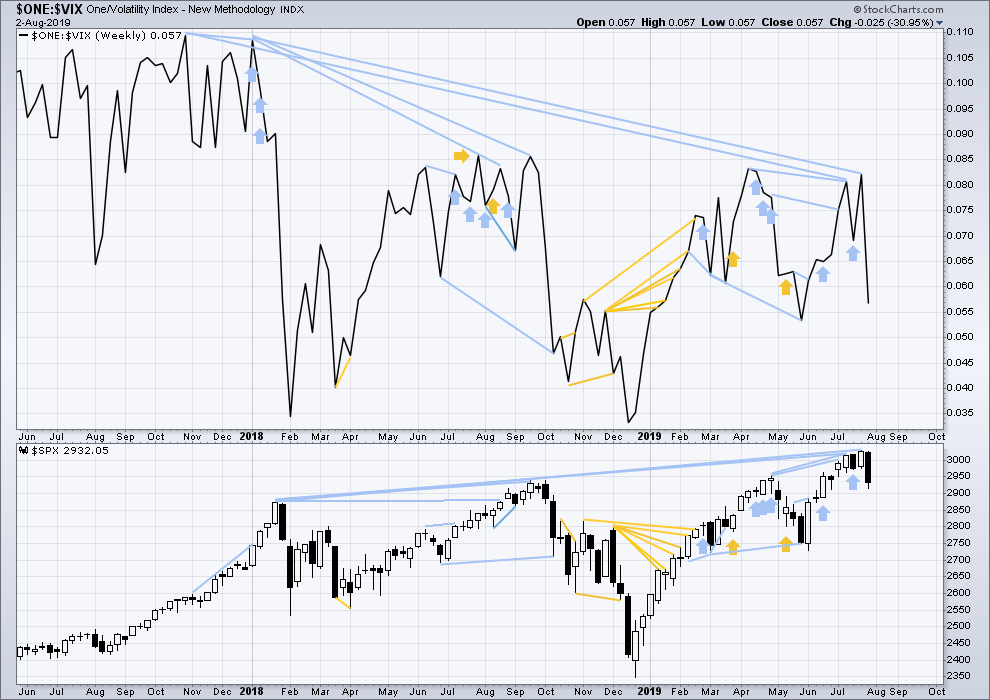
Click chart to enlarge. Chart courtesy of StockCharts.com. So that colour blind members are included, bearish signals
will be noted with blue and bullish signals with yellow.
The all time high for inverted VIX (which is the same as the low for VIX) was on 30th October 2017. There is now nearly one year and nine months of bearish divergence between price and inverted VIX.
The rise in price is not coming with a normal corresponding decline in VIX; VIX remains elevated. This long-term divergence is bearish and may yet develop further as the bull market matures.
This divergence may be an early warning, a part of the process of a top developing that may take years. It may not be useful in timing a trend change.
This week price and inverted VIX have both moved lower. Neither have made a new swing low below the prior swing low of the weeks beginning 28th May / 3rd June.
DAILY CHART
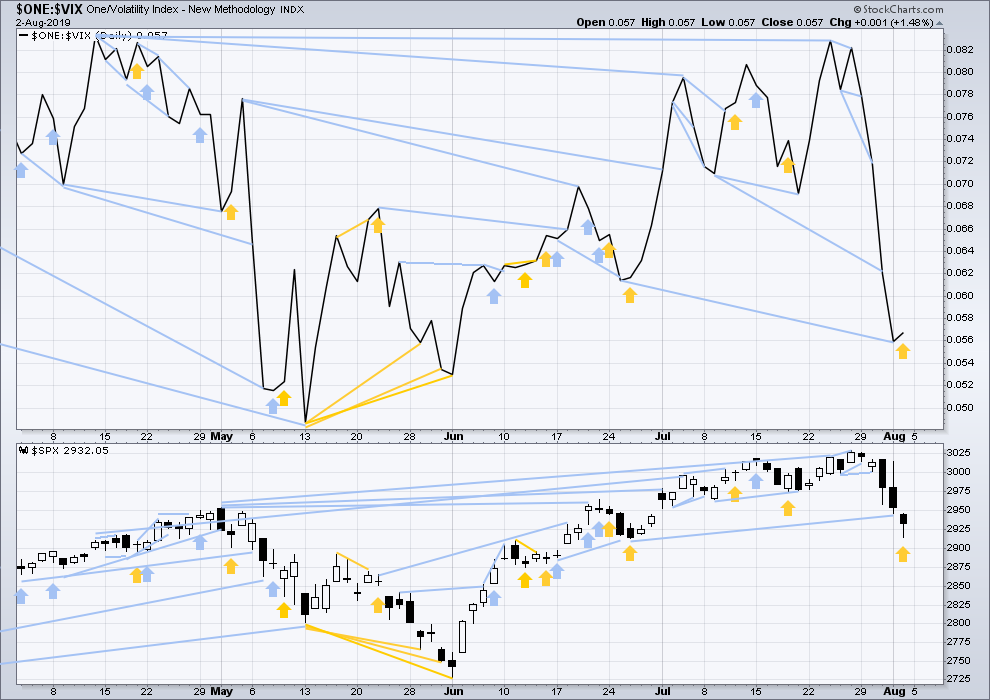
Click chart to enlarge. Chart courtesy of StockCharts.com. So that colour blind members are included, bearish signals
will be noted with blue and bullish signals with yellow.
Bearish mid-term divergence noted in last analysis between current lows and the prior swing low of 25th / 26th June remains, but after Friday’s downward movement it is very slight. It is considered too small to have any predictive value.
On Friday price moved lower, but inverted VIX has moved higher. Downwards movement on Friday did not come with a normal corresponding increase in VIX. This divergence is bullish for the short term and may offer a very small amount of support to the main Elliott wave count because it confirms bullish divergence between price and the AD line.
DOW THEORY
Dow Theory confirmed a bear market in December 2018. This does not necessarily mean a bear market at Grand Super Cycle degree though; Dow Theory makes no comment on Elliott wave counts. On the 25th of August 2015 Dow Theory also confirmed a bear market. The Elliott wave count sees that as part of cycle wave II. After Dow Theory confirmation of a bear market in August 2015, price went on to make new all time highs and the bull market continued.
DJIA: 23,344.52 – a close on the 19th of December at 23,284.97 confirms a bear market.
DJT: 9,806.79 – price has closed below this point on the 13th of December.
S&P500: 2,532.69 – a close on the 19th of December at 2,506.96 provides support to a bear market conclusion.
Nasdaq: 6,630.67 – a close on the 19th of December at 6,618.86 provides support to a bear market conclusion.
With all the indices having moved higher following a Dow Theory bear market confirmation, Dow Theory would confirm a bull market if the following highs are made:
DJIA: 26,951.81 – a close above this point has been made on the 3rd of July 2019.
DJT: 11,623.58 – to date DJT has failed to confirm an ongoing bull market.
S&P500: 2,940.91 – a close above this point was made on the 29th of April 2019.
Nasdaq: 8,133.30 – a close above this point was made on the 26th of April 2019.
GOLD
Price remains below resistance and above support. This week the trend reaches extreme and conditions are overbought. All three Elliott wave counts remain the same.
Summary: There remains an upwards trend in place at the weekly chart level. With conditions extreme, a sideways consolidation may continue next week and possibly for another few weeks to relieve extreme conditions. This scenario favours the main bearish wave count. The final target for that count is 1,595. There is strong support below about 1,375.
The bullish Elliott wave count remains valid while price remans above 1,346.45. The mid-term target is 1,565.
Grand SuperCycle analysis is here.
Monthly charts were last published here with video here.
BEARISH ELLIOTT WAVE COUNTS
MAIN WEEKLY CHART
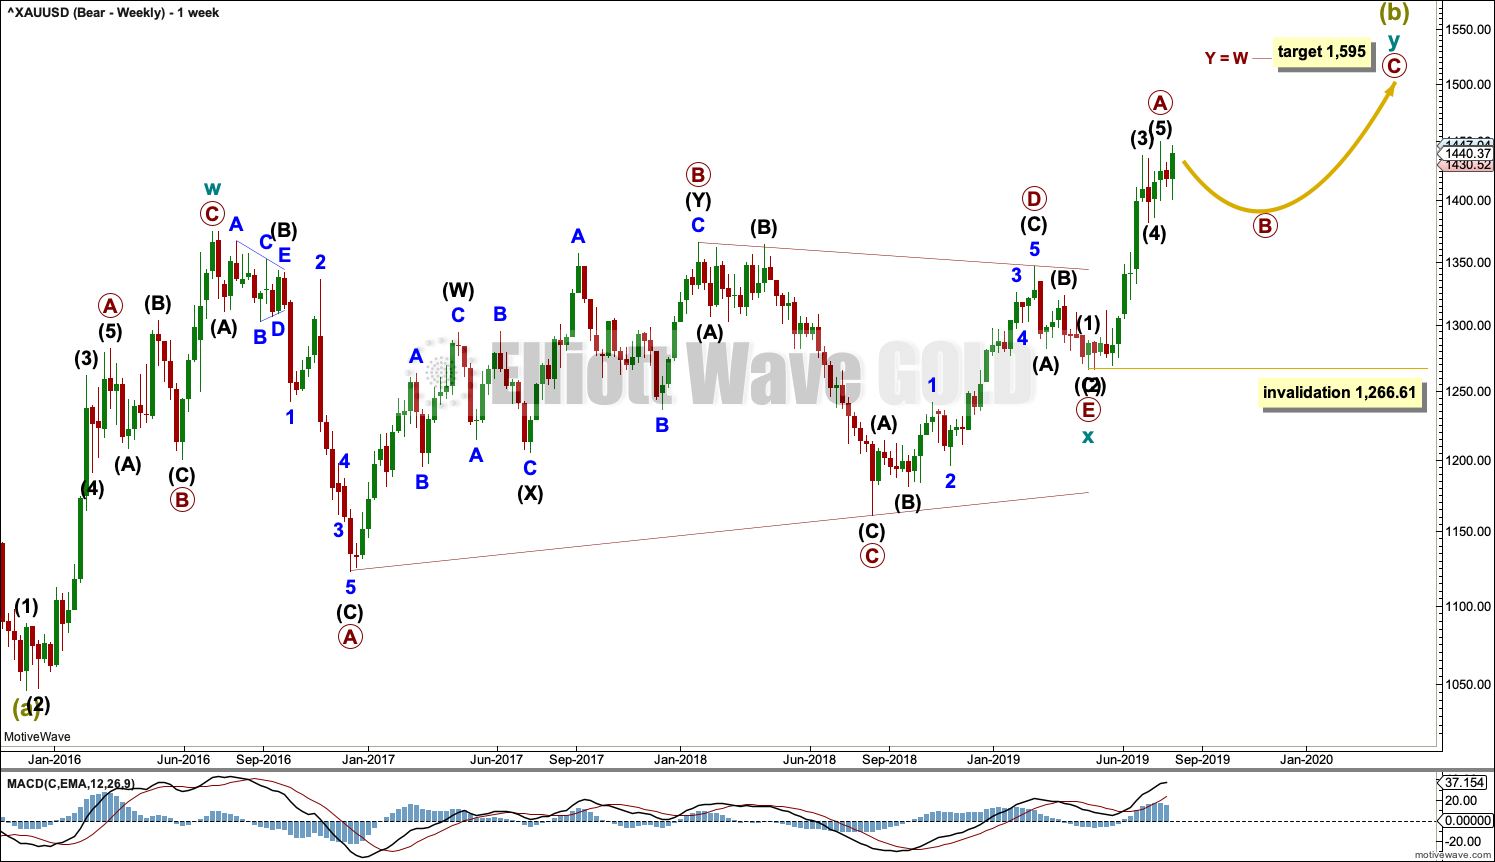
Click chart to enlarge.
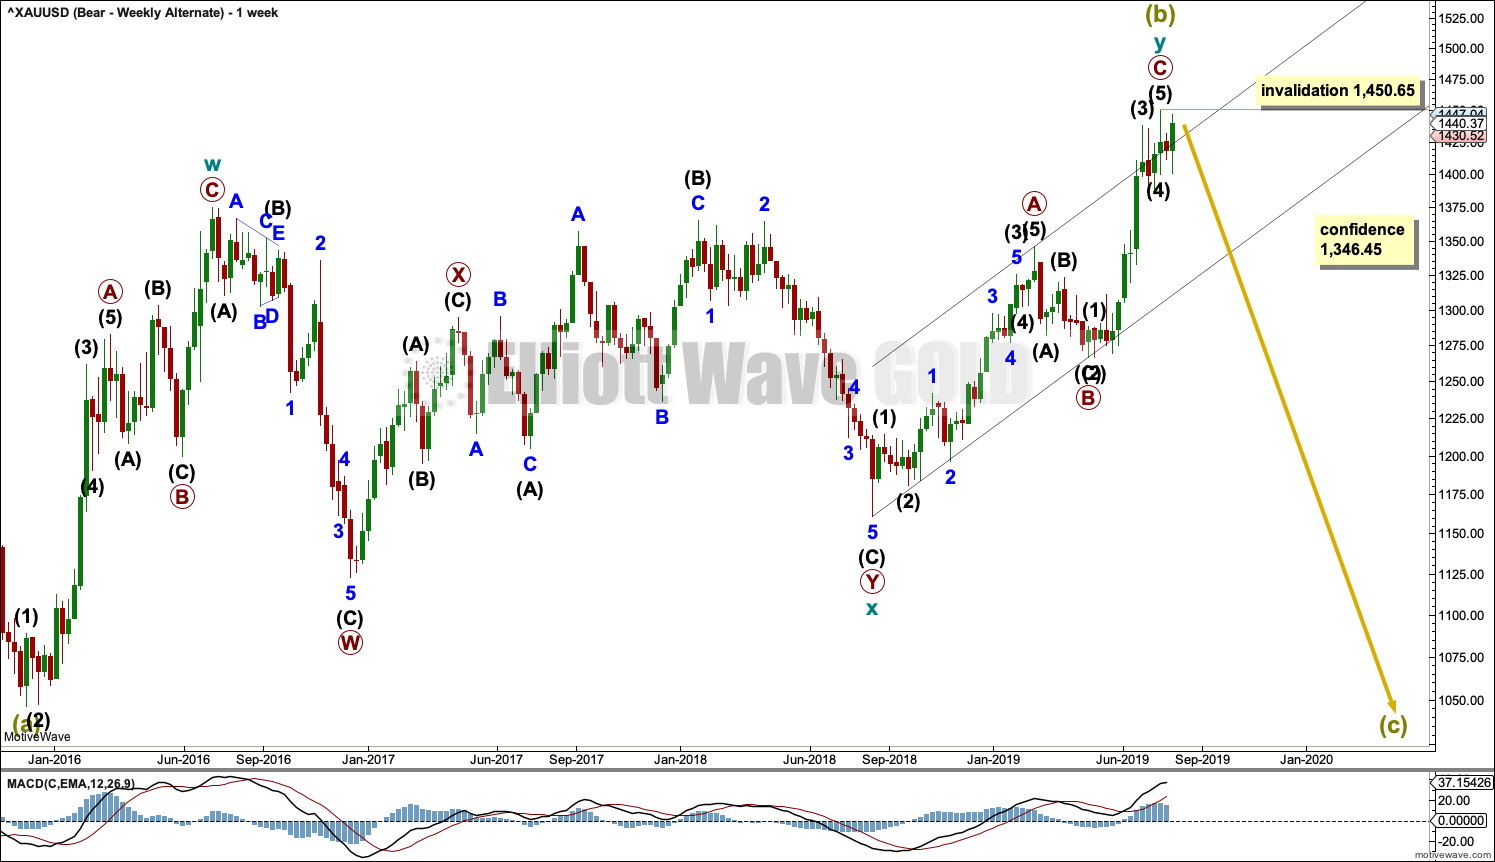
It remains possible that Super Cycle wave (b) is an incomplete double zigzag.
The first zigzag in the double is seen in the same way for both bearish wave counts, a zigzag labelled cycle wave w.
This main bearish wave count sees cycle wave x as regular contracting triangle. Cycle wave y must subdivide as a zigzag if Super Cycle wave (b) is a double zigzag. Within cycle wave y, primary wave A may now be complete, and primary wave B may not move beyond the start of primary wave A below 1,266.61.
Primary wave B may continue further for a few more weeks to relieve extreme conditions and complete a corrective Elliott wave structure.
MAIN DAILY CHART
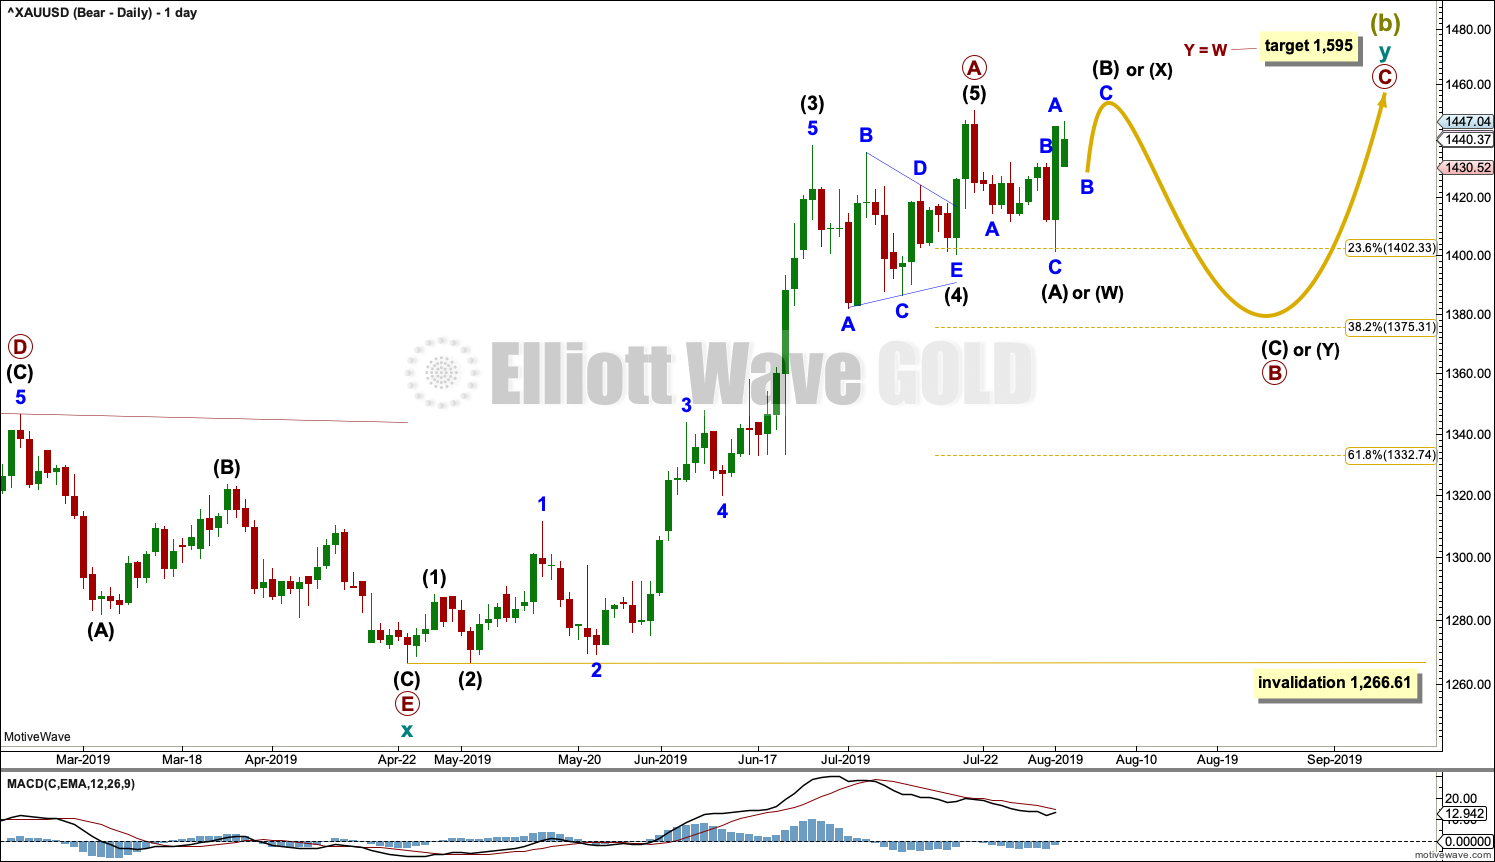
Click chart to enlarge.
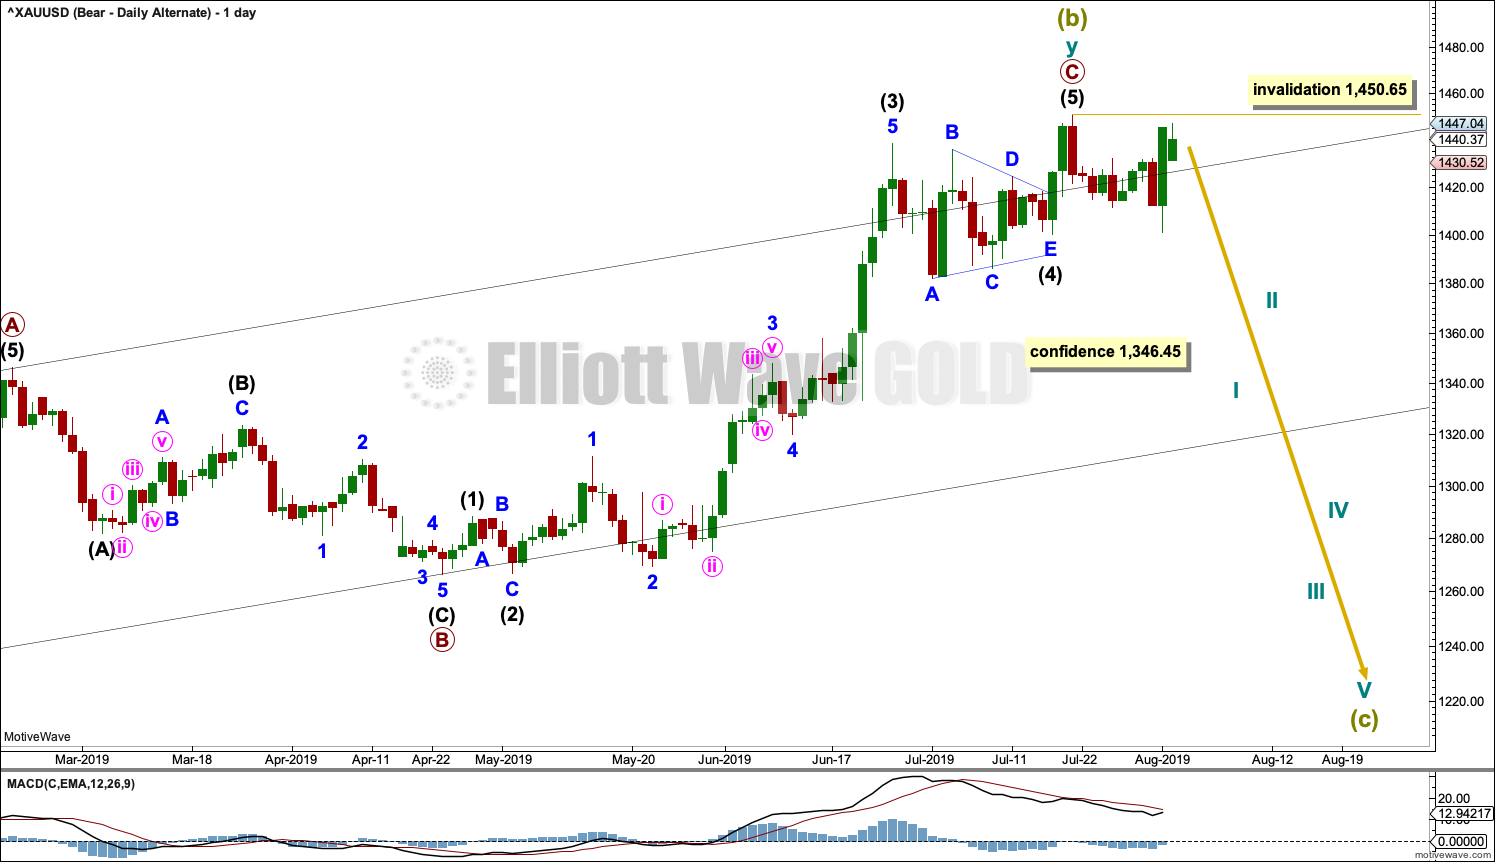
Within cycle wave y, primary wave A may now be a complete five wave impulse.
Primary wave B may unfold over a few weeks. Primary wave B may subdivide as any one of more than 23 possible corrective Elliott wave structures. At this stage, it may be a time consuming sideways consolidation as a combination, flat or triangle.
Primary wave B should exhibit weakness.
Primary wave B may end about either the 0.382 or 0.618 Fibonacci Ratios. It may be relatively shallow if it finds support about 1,375, so the 0.382 Fibonacci ratio may be favoured as a target.
If primary wave B subdivides as any one of an expanded flat, running triangle or combination, then it may include a new high above its start at 1,450.65. A new high above this point does not invalidate this wave count at the daily chart level.
Within primary wave B, intermediate wave (B) may be relatively time consuming and when complete should look like a three on the daily chart.
ALTERNATE WEEKLY CHART
Click chart to enlarge.
This wave count is now judged to be an alternate. With Barchart data not making a new high this week, this wave count remains valid.
It remains possible that a trend change at Super Cycle degree occurred on the 19th of July and a new downwards wave began there.
Double zigzags are common structures, but within them their X waves are almost always single zigzags that are relatively brief and shallow. However, this wave count sees cycle wave x as a complete double combination: zigzag – X – expanded flat.
An X wave may occasionally subdivide as a multiple. In a multiple the maximum number of corrective structures is three: W, Y and Z. To label any one of W, Y or Z as a multiple would violate the Elliott wave rule. Here, the rule is met.
Cycle wave y may be a complete zigzag. Within the zigzag, primary wave C is 5.19 short of equality in length with primary wave A.
The purpose of a second zigzag in a double zigzag is to deepen the correction when the first zigzag does not move price far enough. This purpose has been achieved.
A new low now by any amount at any time frame below 1,346.45 would invalidate the bullish wave count below and provide some confidence in a bearish wave count.
A new high by any amount at any time frame above 1,450.65 would invalidate this wave count.
ALTERNATE DAILY CHART
Click chart to enlarge.
Primary wave C may now be a complete impulse.
Gold often exhibits surprisingly short and brief fifth waves out of its fourth wave triangles, and this wave count expects that it may have done so here. This wave count follows common tendencies for this market.
Super Cycle wave (c) should move below the end of Super Cycle wave (a) at 1,046.27 to avoid a truncation. Super Cycle wave (c) may only subdivide as a five wave structure, most likely an impulse. Within Super Cycle wave (c), no second wave correction may move beyond the start of its first wave above 1,450.65.
BULLISH ELLIOTT WAVE COUNT
WEEKLY CHART
Click chart to enlarge.
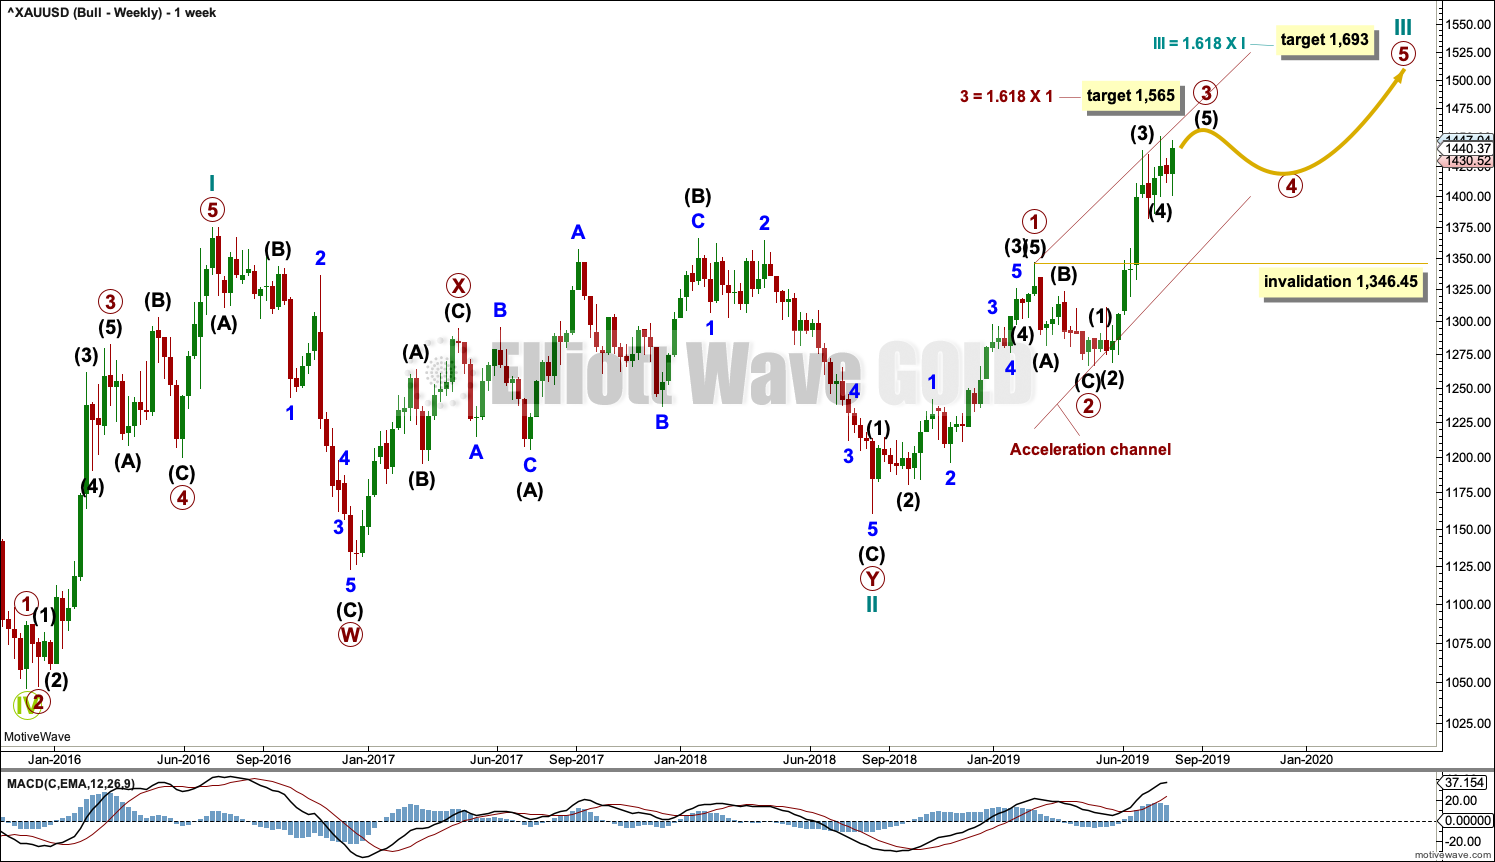
This wave count sees the the bear market complete at the last major low for Gold in November 2015.
If Gold is in a new bull market, then it should begin with a five wave structure upwards on the weekly chart. However, the biggest problem with this wave count is the structure labelled cycle wave I because this wave count must see it as a five wave structure, but it looks more like a three wave structure.
Commodities often exhibit swift strong fifth waves that force the fourth wave corrections coming just prior and just after to be more brief and shallow than their counterpart second waves. It is unusual for a commodity to exhibit a quick second wave and a more time consuming fourth wave, and this is how cycle wave I is labelled. This wave count still suffers from this very substantial problem, and for this reason bearish wave counts are still considered above as they have a better fit in terms of Elliott wave structure.
Cycle wave II subdivides well as a double combination: zigzag – X – expanded flat.
Cycle wave III may have begun. Within cycle wave III, primary waves 1 and 2 may now be complete. If it continues lower as a double zigzag, then primary wave 2 may not move beyond the start of primary wave 1 below 1,160.75.
Cycle wave III so far for this wave count would have been underway now for 50 weeks. It may be beginning to exhibit some support from volume and increasing ATR. If this increase continues, then this wave count would have some support from technical analysis.
Draw an acceleration channel about primary waves 1 and 2: draw the first trend line from the end of primary wave 1 to the last high, then place a parallel copy on the last high. Keep redrawing the channel as price continues higher. When primary wave 3 is complete, then this channel would be drawn using Elliott’s first technique about the impulse. The lower edge may provide support.
Primary wave 4 may not move into primary wave 1 price territory below 1,346.45. Because the data used for this analysis is cash market data no overlap between primary waves 4 and 1 should be allowed. The invalidation point is absolute.
DAILY CHART

Click chart to enlarge.
Primary wave 3 may only subdivide as an impulse. Within the impulse, intermediate waves (1) through to (4) are all now complete. It is possible that intermediate wave (5) could be over at the last high, but for this wave count it would look more normal if it continued higher.
When it arrives, then primary wave 4 may not move into primary wave 1 price territory below 1,346.45.
At any stage, a new low below the start of intermediate wave (5) at 1,400.34 by any amount at any time frame would indicate intermediate wave (5) should be over and primary wave 3 should be over. At that stage, a multi week correction for primary wave 4 may be expected to be underway.
TECHNICAL ANALYSIS
MONTHLY CHART
Click chart to enlarge. Chart courtesy of StockCharts.com.
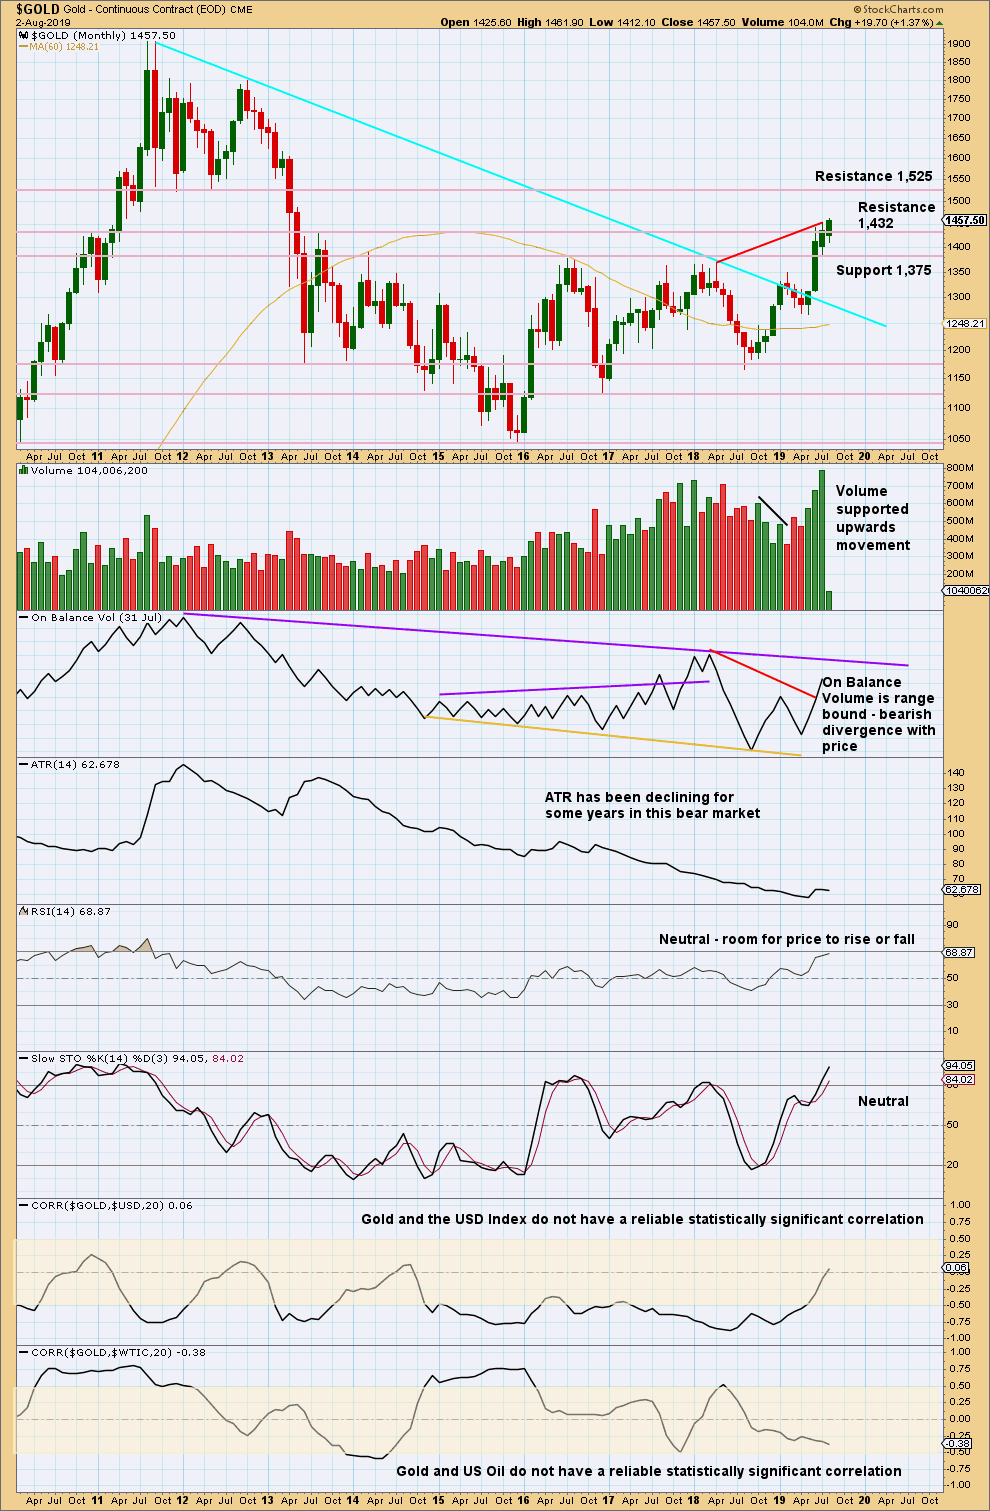
Gold has effected an upwards breakout above multi-year resistance and above the cyan bear market trend line. Look for next resistance identified on the chart.
The new high in price above prior highs for March / April 2018 have not been matched by new highs for On Balance Volume. This divergence is bearish and supports a bearish Elliott wave count. This divergence may be given a little weight because it is strong and evident on the monthly chart.
WEEKLY CHART
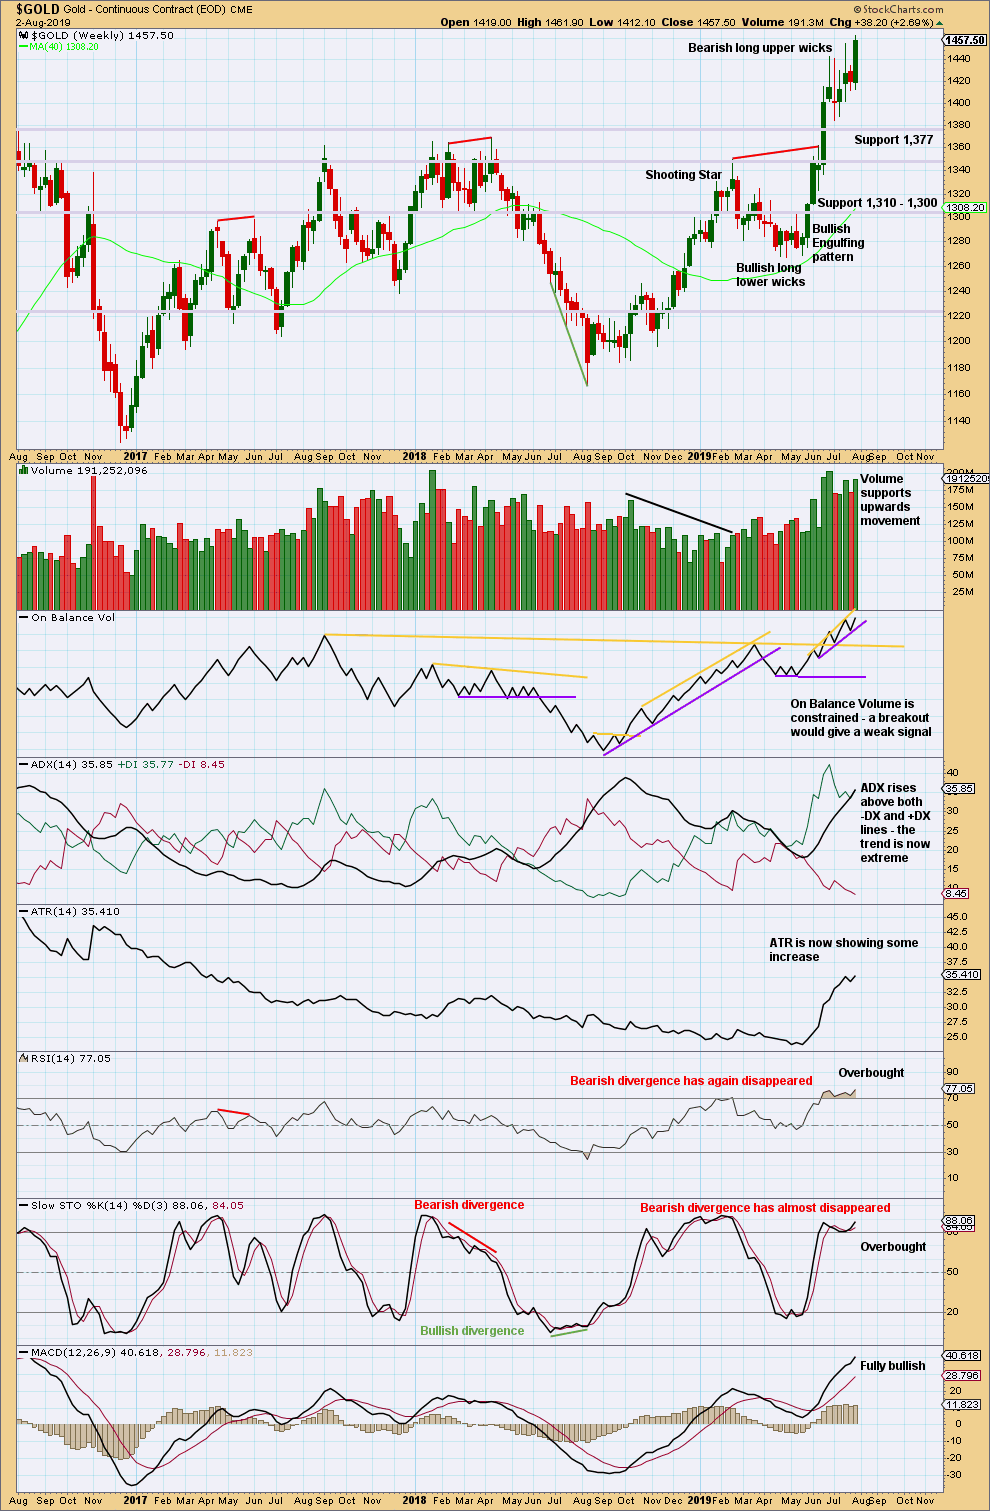
Click chart to enlarge. Chart courtesy of StockCharts.com.
The bottom line remains that a multi year breakout occurred a few weeks ago, and it occurred with strength in volume. ADX is now extreme and conditions are overbought. Some consolidation or pullback may reasonably be expected here to relieve extreme conditions.
This weekly candlestick closes strong with support from volume. This is not however matched by strength on the daily chart.
DAILY CHART
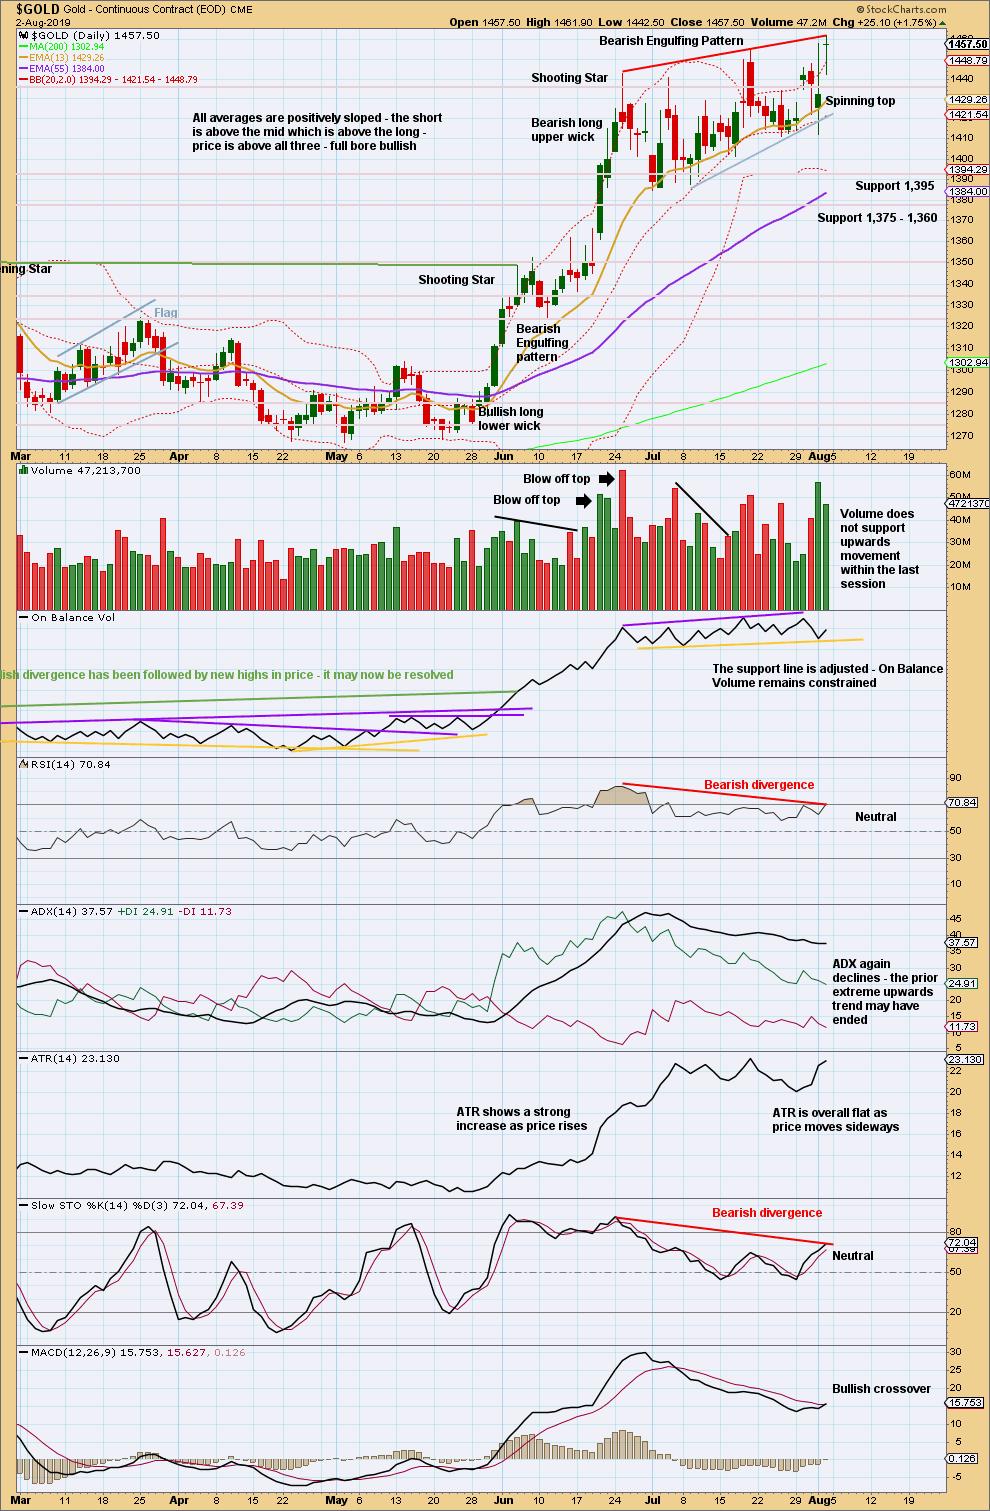
Click chart to enlarge. Chart courtesy of StockCharts.com.
Another new high lacks support from volume and the Doji candlestick indicates indecision.
The prior upward trend reached very extreme, and thereafter there is strong mid-term divergence between price and both of RSI and Stochastics. Some pullback or consolidation to relieve extreme conditions is reasonably strongly indicated as most likely by this chart.
Strongest support is about 1,375.
GDX WEEKLY CHART
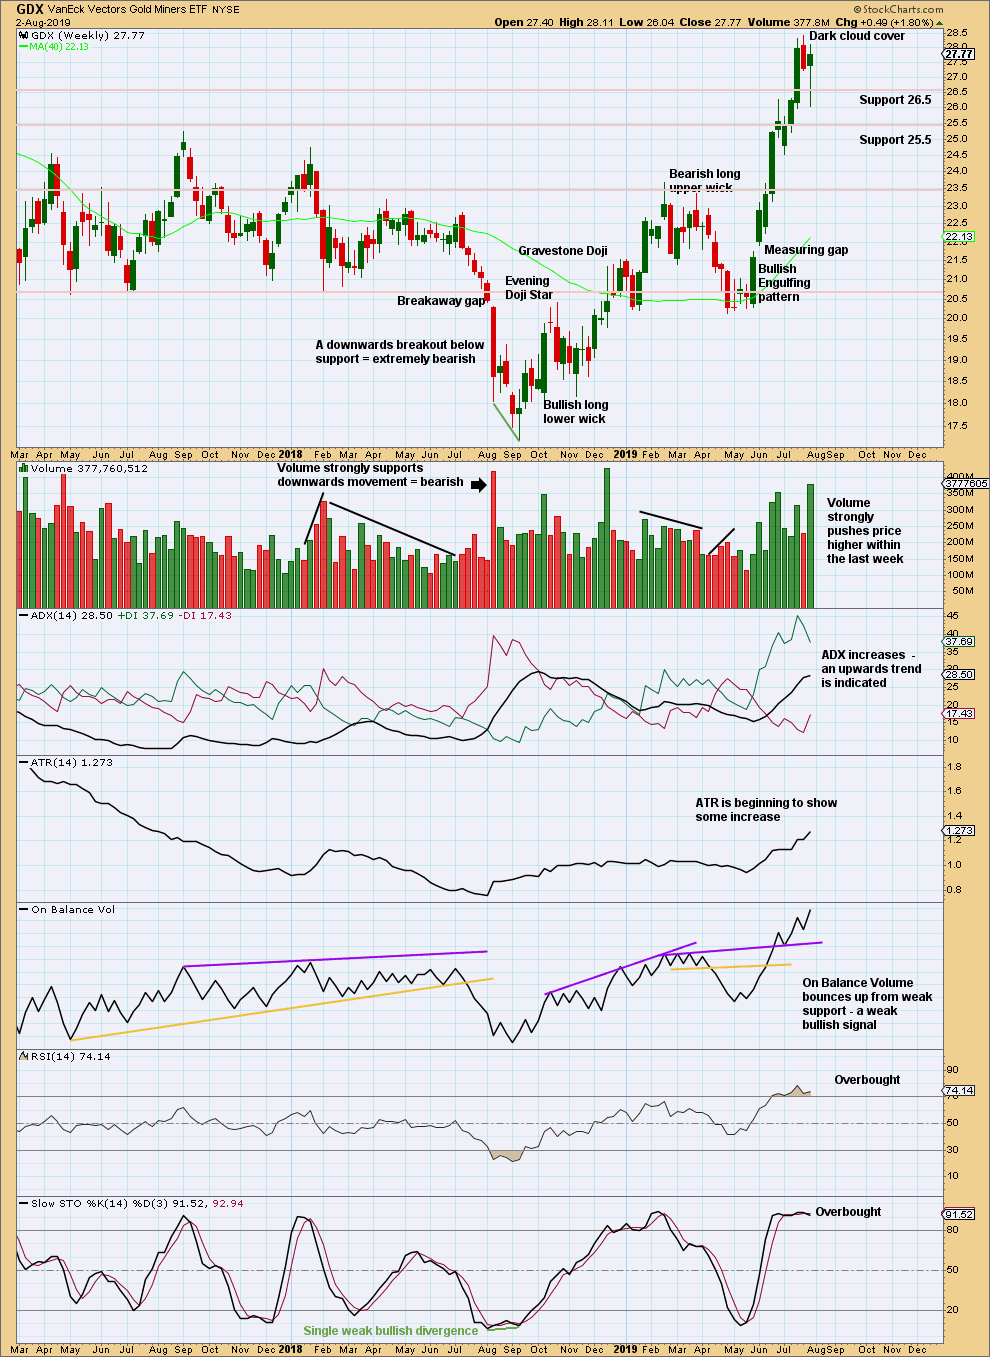
Click chart to enlarge. Chart courtesy of StockCharts.com.
This week completes a lower low and lower high, but the candlestick has closed green and the balance of volume was upwards. Upwards movement within the week may have support from volume, but daily volume bars would better be analysed to draw a conclusion here.
The upwards trend is not yet extreme. A long lower wick on this weekly candlestick is bullish.
GDX DAILY CHART
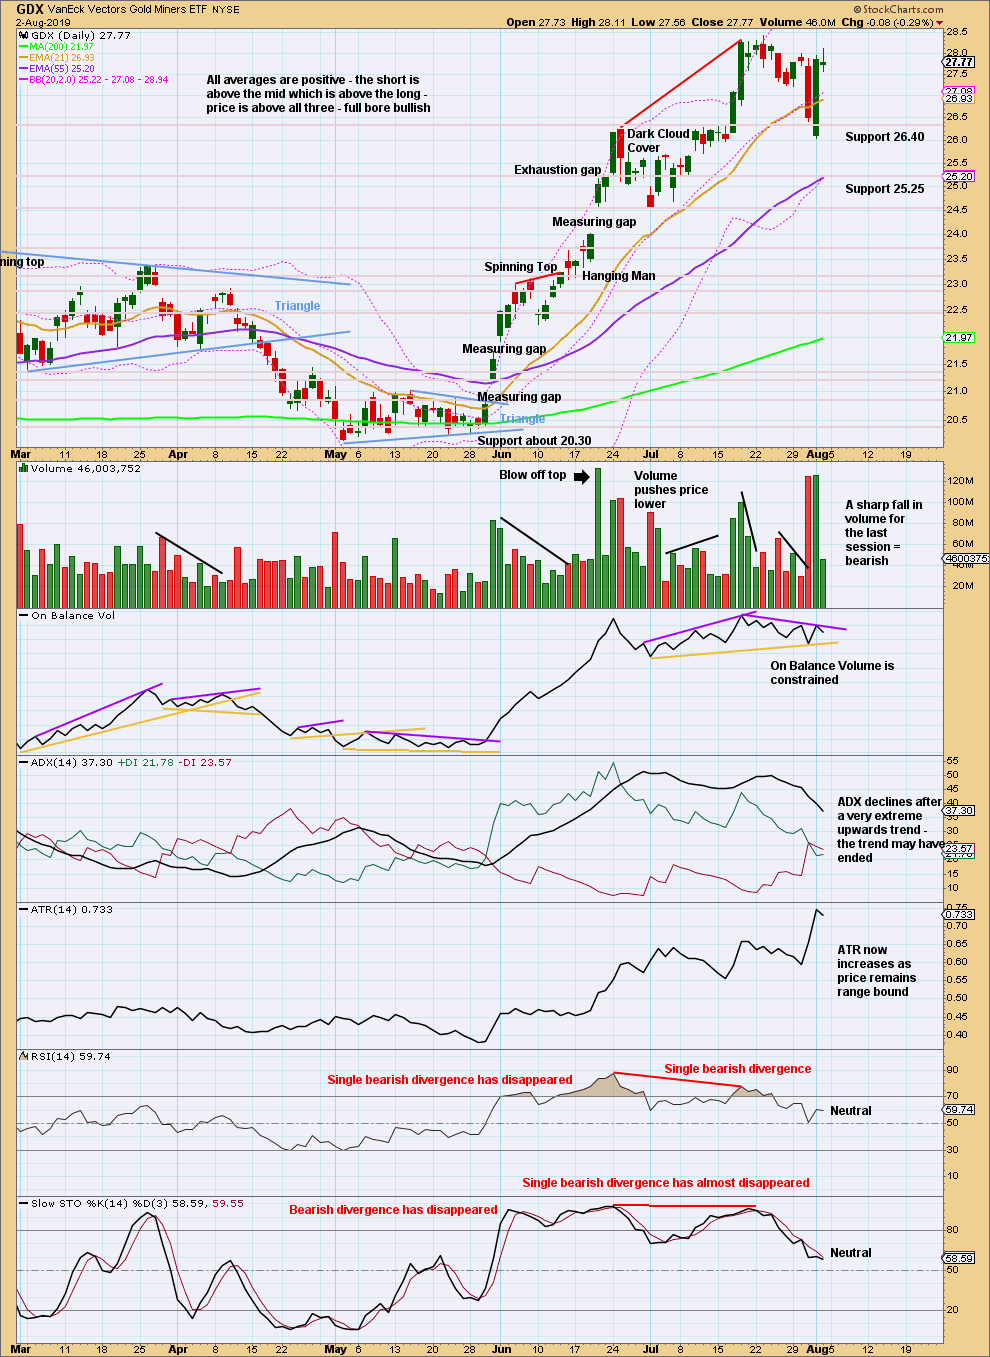
Click chart to enlarge. Chart courtesy of StockCharts.com.
Price remains range bound and is whipsawing within a consolidation zone. Resistance is about 28.50 and support about 26.40. A close outside of this zone is required to indicate the next direction.
A new swing low below 24.53 would confirm a trend change.
US OIL
Downwards movement was expected for the week. An outside week closes red.
This week On Balance Volume gives a reasonable signal at the weekly chart level, and the short-term volume profile supports the main Elliott wave count.
Summary: A new mid-term target is now at 35.25 for a third wave down. This may exhibit an increase in momentum, and may end with a capitulation spike.
The final target is calculated at 10.72. Confidence in this target may be had if price makes a new low below 50.61.
The bullish alternate wave count would have confidence above 66.59. At that stage, a target for a third wave to end would be at 89.80.
MAIN ELLIOTT WAVE COUNT
MONTHLY CHART
Click chart to enlarge.
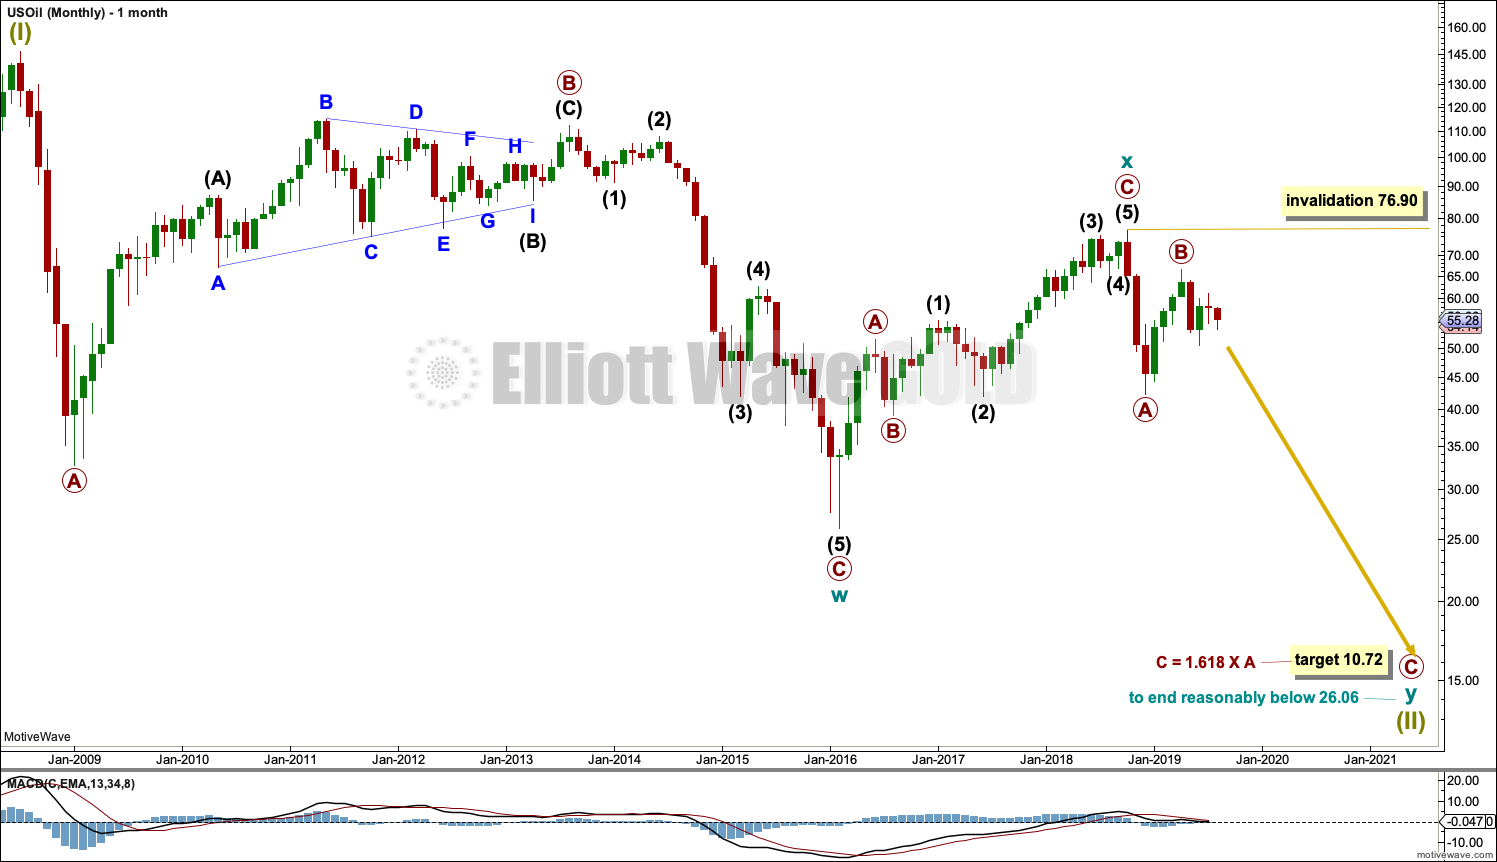
The basic Elliott wave structure is five steps forward and three steps back. This Elliott wave count expects that US Oil is still within a three steps back pattern, which began in July 2008. The Elliott wave count expects that the bear market for US Oil continues.
This Elliott wave corrective structure is a double zigzag, which is a fairly common structure. The correction is labelled Super Cycle wave (II).
The first zigzag in the double is complete and labelled cycle wave y. The double is joined by a three in the opposite direction labelled cycle wave x, which subdivides as a zigzag. The second zigzag in the double may now have begun, labelled cycle wave w.
The purpose of a second zigzag in a double zigzag is to deepen the correction when the first zigzag does not move price deep enough. To achieve this purpose cycle wave y may be expected to move reasonably below the end of cycle wave w at 26.06. The target calculated would see this expectation met.
Cycle wave y is expected to subdivide as a zigzag, which subdivides 5-3-5.
Cycle wave w lasted 7.6 years and cycle wave x lasted 2.7 years. Cycle wave y may be expected to last possibly about a Fibonacci 5 or 8 years.
If it continues higher, then primary wave B may not move beyond the start of primary wave A above 76.90.
WEEKLY CHART
Click chart to enlarge.
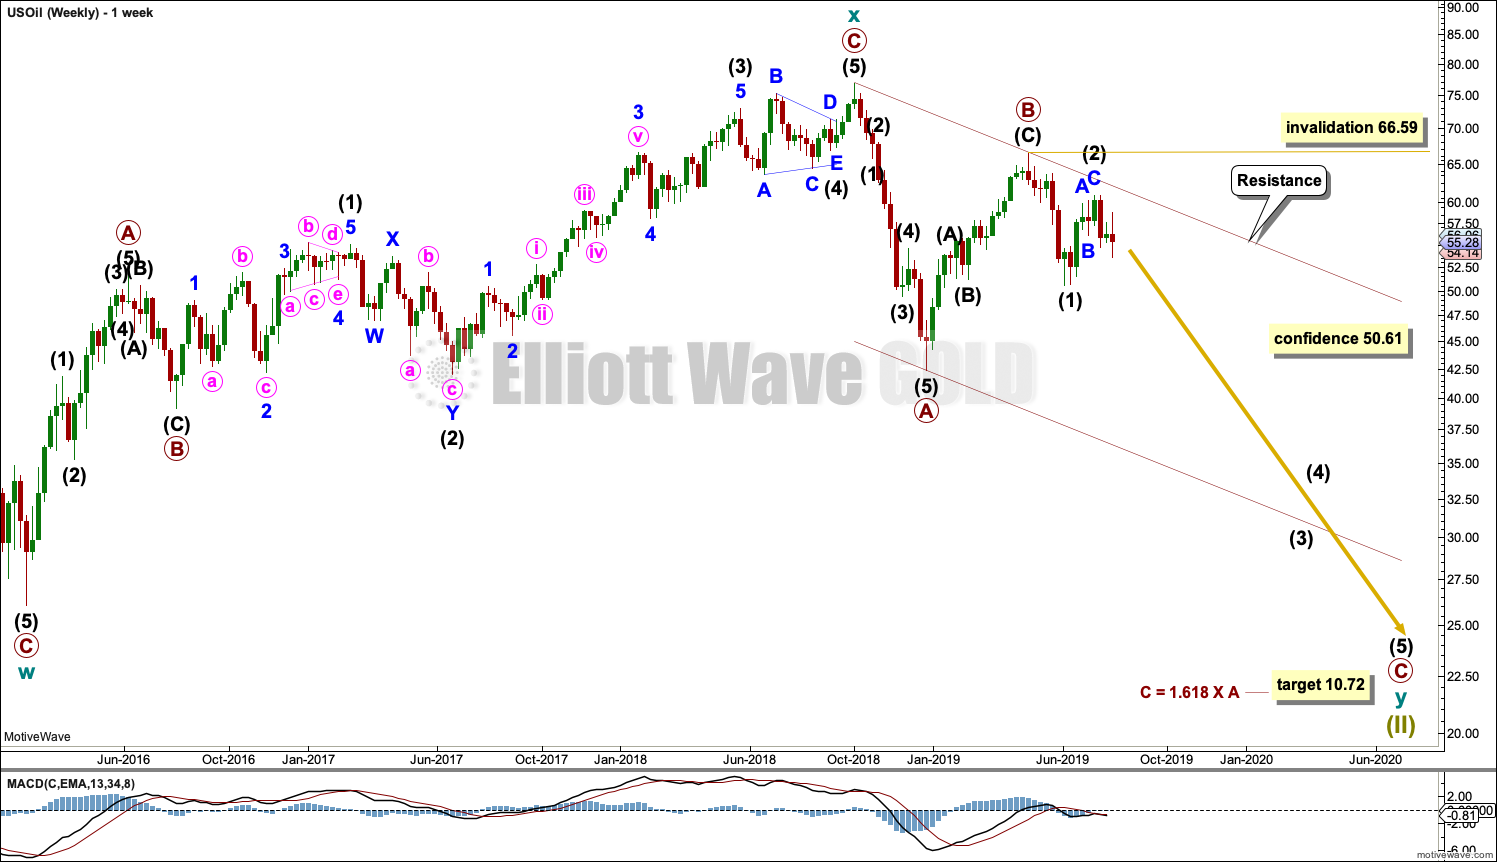
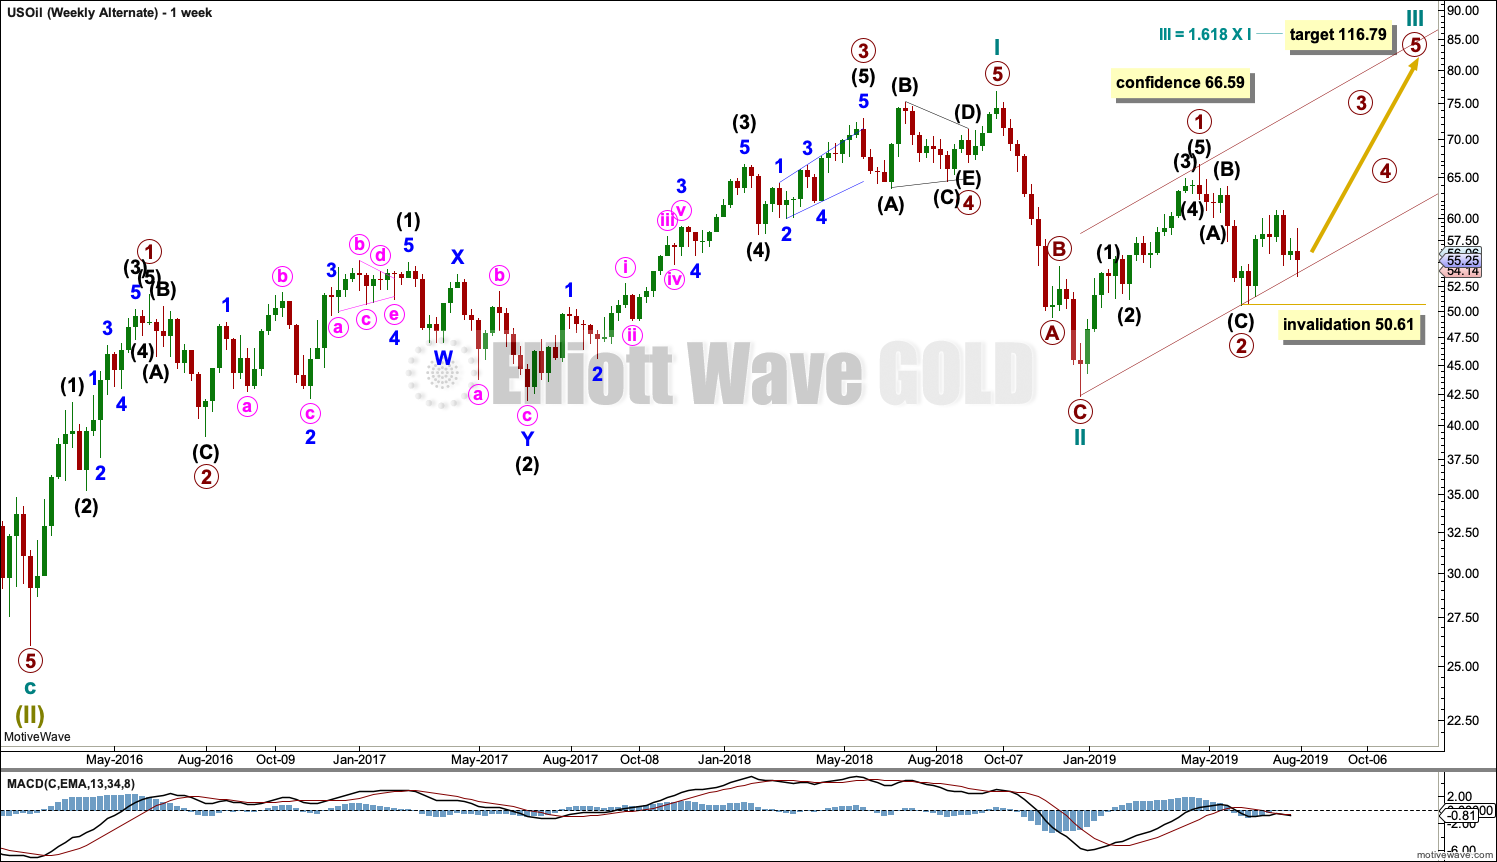
This weekly chart shows all of cycle waves x and y so far.
Cycle wave y is expected to subdivide as a zigzag. A zigzag subdivides 5-3-5. Primary wave A must subdivide as a five wave structure if this wave count is correct.
Primary wave A may be a complete five wave impulse at the last low.
Primary wave B may now be a complete single zigzag at the last high.
Primary wave C may have just begun. Primary wave C must subdivide as a five wave structure.
Primary wave A lasted 12 weeks, just one short of a Fibonacci 13.
Primary wave C may be longer in time as well as price. If cycle wave y lasts a Fibonacci 5 years, then primary wave C within it may take as long as a Fibonacci 233 weeks.
Intermediate wave (1) within primary wave C may be a complete impulse. Intermediate wave (2) may not move beyond the start of intermediate wave (1) above 66.59.
Draw a channel about the zigzag of primary wave y using Elliott’s technique for a correction. Draw the first trend line from the start of primary wave A to the end of primary wave B, then place a parallel copy on the end of primary wave A. The upper edge of this channel may show where bounces along the way down find resistance. The lower edge of the channel may provide support.
DAILY CHART
Click chart to enlarge.
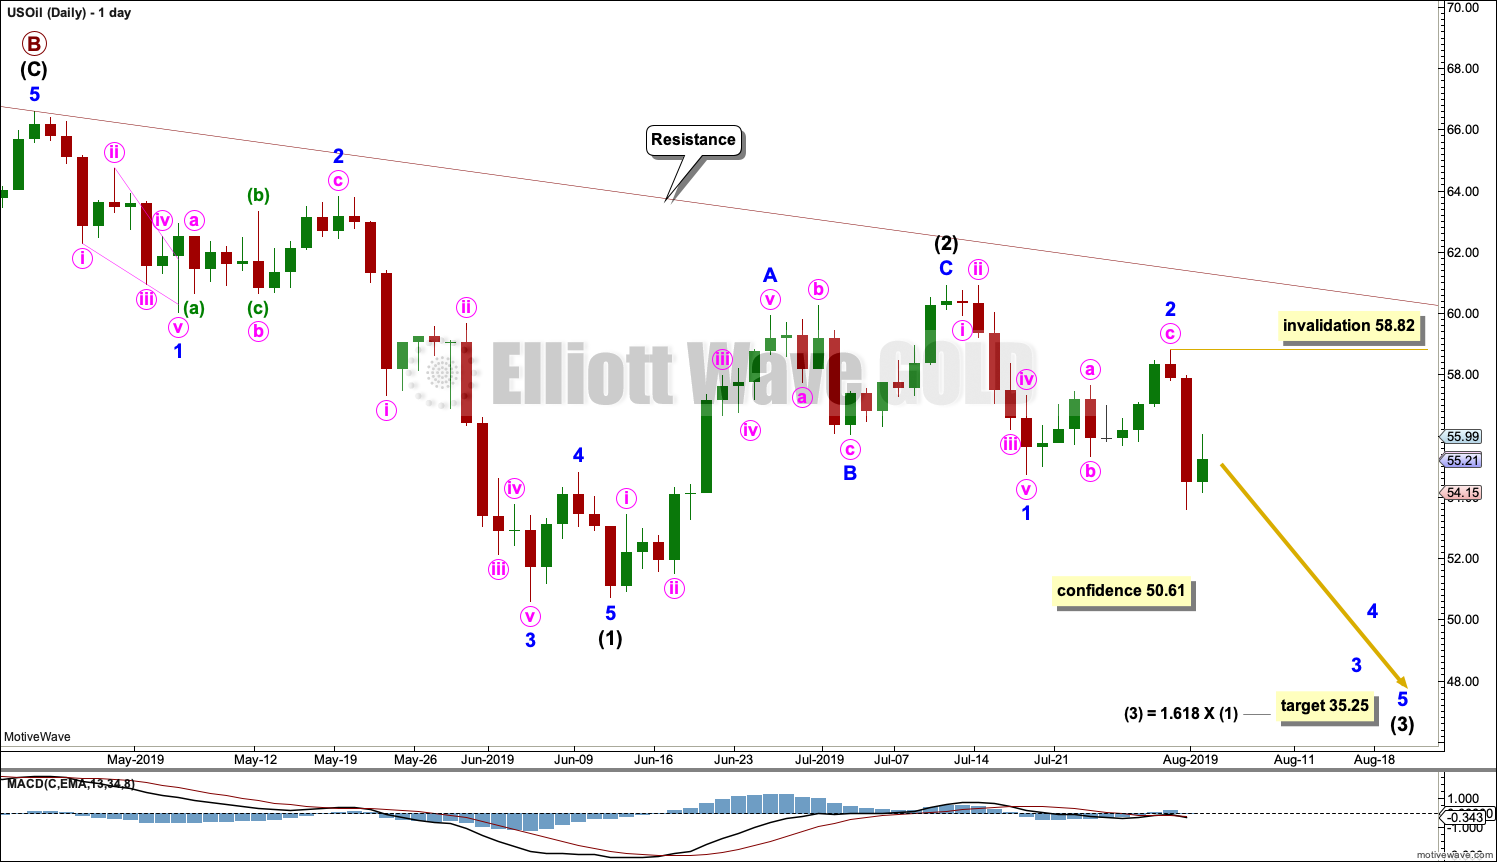
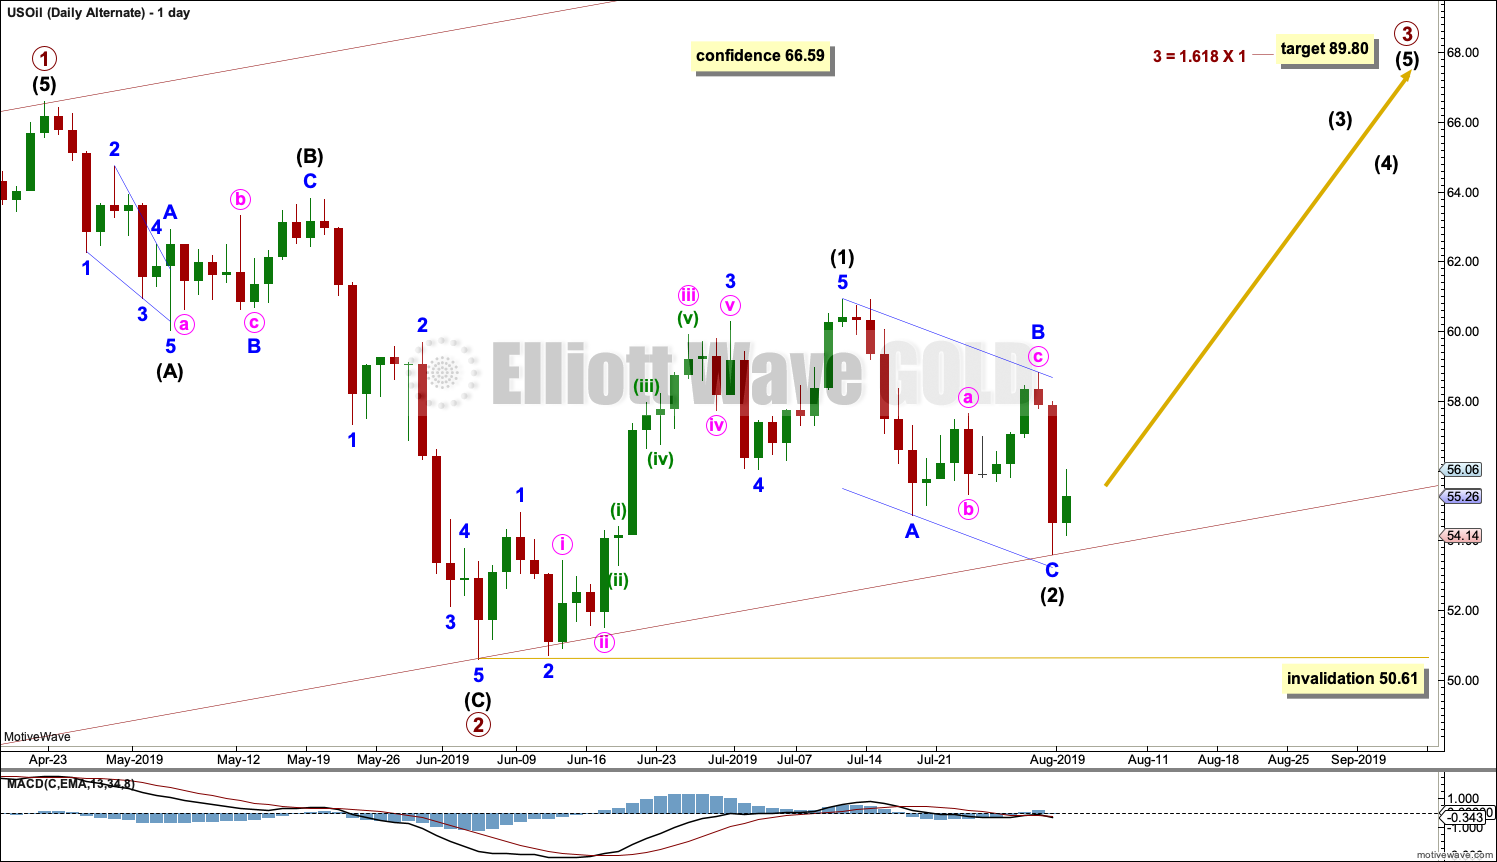
Note that monthly and weekly charts are on a semi-log scale, but this daily chart is on an arithmetic scale. This makes a slight difference to trend channels.
It is possible that intermediate wave (1) is complete. Minor wave 4 for this wave count exhibits some alternation to minor wave 2; minor wave 2 may be a relatively deep zigzag or flat, and minor wave 4 may be a more shallow zigzag.
Minor wave 5 ends with a slight 0.11 truncation.
Intermediate wave (2) may also now be complete as a zigzag.
Intermediate wave (3) may only subdivide as an impulse, and it must move below the end of intermediate wave (1). Within intermediate wave (3), minor wave 2 moved higher this week to complete a more obvious three wave structure. It is now more likely to be complete. Within minor wave 3, no second wave correction may move beyond the start of its first wave above 58.82.
The next downwards wave of minor wave 3 within intermediate wave (3) may be expected to exhibit an increase in momentum and an increase in ATR. It may have support from volume pushing price lower.
ALTERNATE ELLIOTT WAVE COUNT
MONTHLY CHART
Click chart to enlarge.
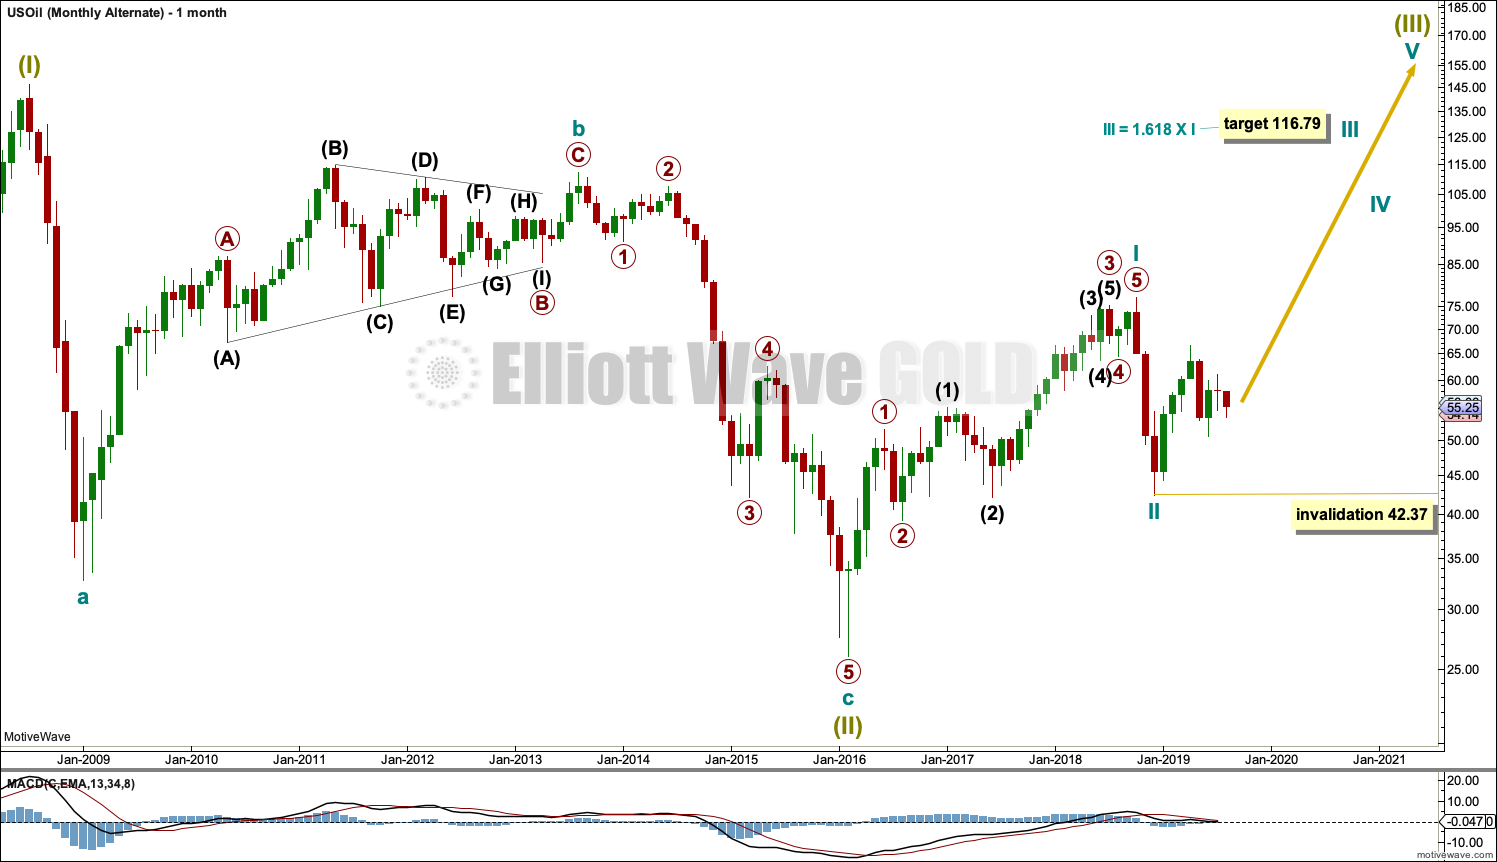
It is possible that the bear market is over for Oil and a new bull market has begun.
For a bullish wave count for Oil, the upwards wave from the major low at 26.06 in February 2016 must be seen as a complete five wave impulse. This is labelled cycle wave I.
Cycle wave II may be a complete zigzag at 0.679 the depth of cycle wave I.
A target is calculated for cycle wave III to reach a common Fibonacci ratio to cycle wave I.
Within cycle wave III, no second wave correction may move beyond the start of its first wave below 42.37.
WEEKLY CHART
Click chart to enlarge.
This weekly chart shows detail of cycle wave I as a five wave impulse.
Cycle wave II does look best as a three. This is the only part of this wave count that has a better look than the main wave count, which sees this downwards wave as a five.
Cycle wave III may only subdivide as an impulse. Within cycle wave III, so far primary waves 1 and 2 may be complete.
Draw a base channel about primary waves 1 and 2. Draw the first trend line from the start of primary wave 1 to the end of primary wave 2, then place a parallel copy on the end of primary wave 1. The lower edge of this base channel has so far provided support for lower degree second wave corrections along the way up.
DAILY CHART
Click chart to enlarge.
Primary wave 3 may only subdivide as an impulse. Within the impulse, intermediate wave (1) may be complete.
Intermediate wave (2) may now be a complete zigzag, which perfectly found support at the lower edge of the base channel copied over from the weekly chart.
If it continues any lower as a double zigzag, then intermediate wave (2) may not move beyond the start of intermediate wave (1) below 50.61.
This wave count would reduce in probability if the lower edge of the base channel is breached by downward movement.
TECHNICAL ANALYSIS
MONTHLY CHART
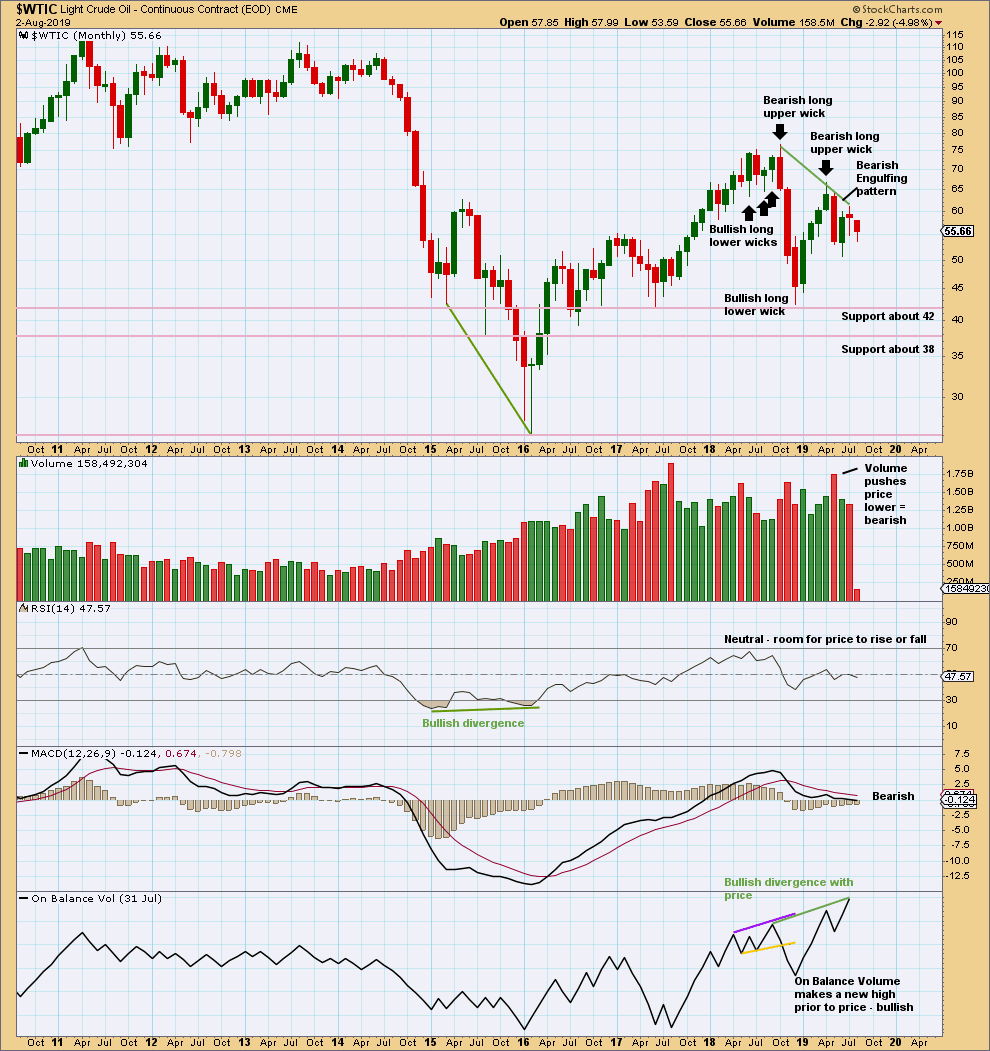
Click chart to enlarge. Chart courtesy of StockCharts.com.
May has closed with a strong Bearish Engulfing candlestick pattern, which has strong support from volume. This supports the main Elliott wave count.
June moved price lower with a lower low and a lower high, but the candlestick closed green and the balance of volume was upwards. Upwards movement within the month did not have support from volume. This also supports the main Elliott wave count.
There is now double bullish divergence between price and On Balance Volume. This supports the alternate Elliott wave count.
WEEKLY CHART
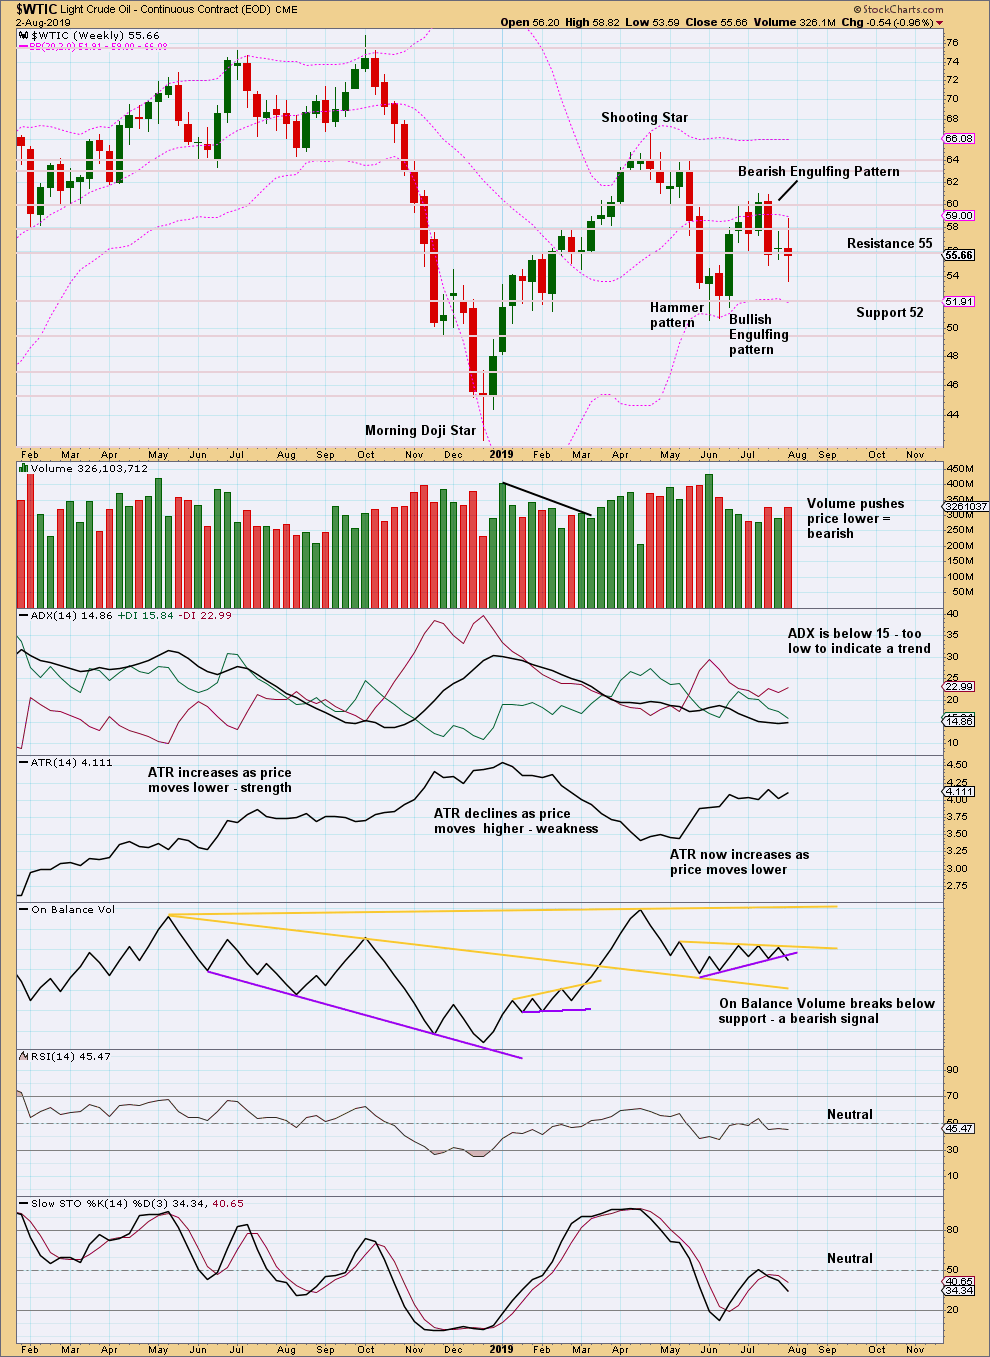
Click chart to enlarge. Chart courtesy of StockCharts.com.
This week completes an outside week, which has closed red with the balance of volume downwards. Volume within the week has actively pushed price lower. This supports the main Elliott wave count.
The bearish signal this week from On Balance Volume is reasonable: the trend line is not too brief and has been tested three times prior to this week’s breach. This supports the main Elliott wave count.
DAILY CHART
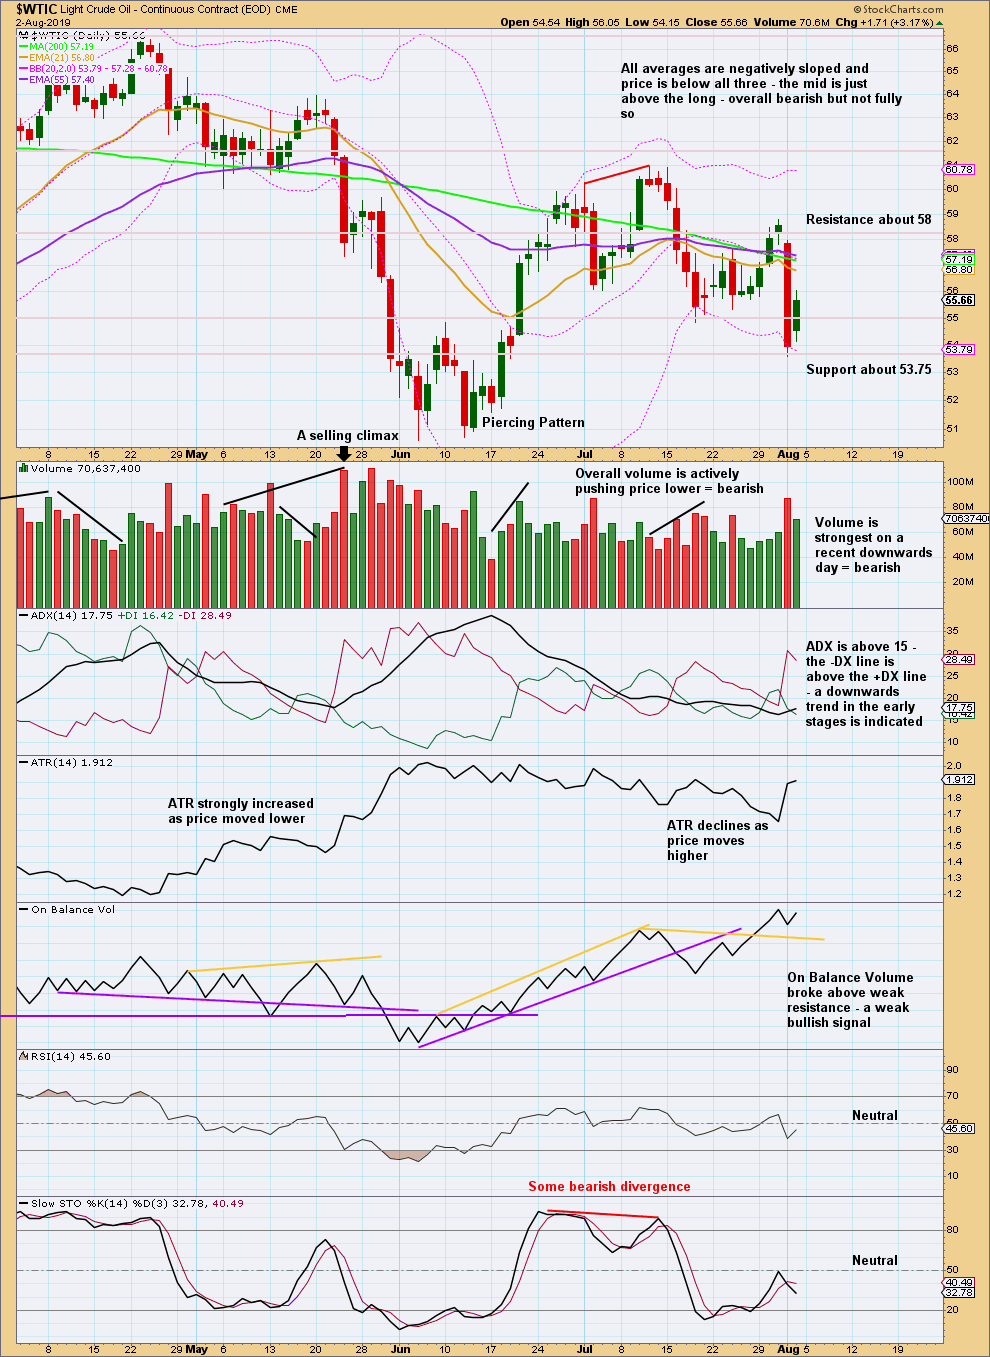
Click chart to enlarge. Chart courtesy of StockCharts.com.
The strongest volume, since the 20th of June, has occurred on downwards days. This supports the main Elliott wave count. Volume is actively pushing price lower. Downwards days also have stronger ATR.
—
Always practice good risk management as the most important aspect of trading. Always trade with stops and invest only 1-5% of equity on any one trade. Failure to manage risk is the most common mistake new traders make.
I know members here like it when I give intra-week updates. And if a main wave count is invalidated sometimes that may be necessary. But that’s not what this service is about and I don’t want to make it a habit.
I developed this once a week service to get members to step back and ignore the noise of little movements, to focus on the larger picture, the trend. This is best done if not watching the markets every day, only every few days to once a week IMO.
This week has been a really good example. For the S&P daily members a new alternate was published, which then was swapped over with the main mid week, and then swapped back yesterday. While Lara’s Weekly members have avoided your view being whipsawed and we end on the same wave count for you, but just with a new alternate to consider at the end of the week.
This is not the first time that has happened. And it probably won’t be the last.
Lara’s Weekly members have the benefit of each analysis including a weekly candlestick, which adds so much depth to the technical analysis.
And so if members here make the occasional request for me to provide an intra-week chart I may decline the request. Please understand there is a very good reason for this approach.
Quick comment on the S&P500:
The fall down was strong, ending in a 90% down day.
The bounce of the last two sessions was weak, looked like a counter trend movement. However, today looks stronger.
Now, normally this market likes to form nice V bottoms. It’s lows are an event. Where it’s highs are a process.
At its V bottoms it will often see a 90% down day (or close to it) immediately followed by a 90% (or close to it) up day. That illustrates a quick 180 degree shift in sentiment. I was looking for the strength / weakness in the bounce, and I see weakness. So far.
The alternate idea published below is valid. But right now I cannot tell you which count is correct. Be aware either may yet play out. Will be back later when I can judge technicals of todays session.
Lara
When you provide more clarity later can you provide all current valid S&P wave alternates?
Rich
Sure.
Although, I don’t know if I want to publish the ending diagonal idea in the end of week analysis. Maybe I’ll reduce the degree of labelling to a leading diagonal.
Lara,
We are still eagerly waiting for your book. How is it progressing, please?
Thanks
Slowly.
Sorry.
I’ve made a decision today on this. I’m going to publish the completed book (it’s been done already) as soon as Cesar can proof and format it for publication.
I’ll then continue with my research and publish a second edition when the research has been published, and update the book with more information.
I too am tired of this taking so long. The research has been holding it up (amongst other things) because it is so much more time consuming than I anticipated.
Hi Lara
Any thoughts on where we are at with the sub divisions of wave 3 for oil?
Not really. Minute i and ii could be over, or minute i may be continuing lower.
The invalidation point has to remain the same. Look out for some increase in downwards momentum particularly if support about 50.61 is breached on a closing basis.
Hi Lara,
Is it possible to use the channel drawn on the oil alternate as upwards resistance for the time being? Price bounced off that channel a few times this week before breaking through it late Tuesday.
I’m not sure what you mean… the alternate for Oil is now invalidated at the daily chart level. The lower support line on the daily and weekly chart is breached.
On the main daily and weekly charts for Oil, then yes, the upper edge of the maroon channel should provide resistance.
New (old, resuscitated) alternate idea for the S&P500:
It is possible that primary wave 2 may not be over and continue further as an expanded flat correction. Within the expanded flat, intermediate wave (B) is a 1.33 length of intermediate wave (A), within the most common range of up to 1.38.
Intermediate wave (C) for this wave count should now move below the end of intermediate wave (A) to avoid a truncation. The target calculated would expect this.
If price falls through the first target, then the next target may be the 0.618 Fibonacci Ratio about 2,579.
Strong and final support may be expected at the lower edge of the teal Elliott channel.
Note that overall this count remains bullish. After P2 may be over, a third wave up at primary degree would be expected.
Here is an interesting article on a possible $30 drop in oil prices —
https://www.cnbc.com/2019/08/05/brent-and-wti-price-could-crash-if-china-buys-iranian-oil.html
Thanks for the link William. I enjoyed reading it.
Lara
Is another possibility that Primary 3 ended at the last high and we are in primary 4 whether its a contracting diagonal or not? It seems this pullback is too deep to be at intermediate degree as it matches the depth of Primary 2. If this is so then all we have left is Primary 5 which would significantly shorten whats left of Cycle V.
Comments?
Rich
No, because where would the high of P1 be? And now P4 would probably be overlapping it.
Hi Lara,
For S&P, is the main wave count daily alternate still valid with the S&P moving below 2842 today?
Tia,
Jiten
The main wave count is invalidated, the daily alternate remains valid.
That count has its invalidation point at 2,728.81.
Hi Lara,
I’m seriously considering that Cycle Wave 5 is mapping out an ending contracting diagonal. I know this potentially flies in the face of the A/D & Breadth strength argument, since this count sees an end to the bull market in about 2-3 weeks.
I can see this on the SPX and Dow (and maybe the Nasdaq, but I’m not sure it matches Super Cycle count).
Within Cycle 5, I can count Primary 1, 2 (double zig zag?), 3 and 4 (zigzag) now (or nearly) complete. Picture of Dow weekly attached. The time frames for this cycle are smaller than the other cycle counts 1-4, but I think this is ok since the end might be abrupt.
In regards to breadth, I can only think that the central bank’s distortion of the markets has caused speculation everywhere, and that there is actually no industry leading this market (hence no real laggards). Everything is going up because of speculation induced by the Fed, and nothing is a clear loser – everyone is winning with the psychology of yield chasing.
If that’s the case, then I believe the wave count takes precedence over traditional technical markers. The everything bubble may lead to an “everything crash”.
Thanks and good luck everyone. I think things are about to get a bit crazy over the next few weeks.
Corey
I would rather not be publishing a wave count which expects that the bull market may be very close to ending with a diagonal, when that would see breadth barely diverge from price. If price makes a new all time high and then breadth begins to diverge, then I’ll include the idea in the analysis. But while there is zero divergence I’m not willing to do that.
It would look like this now. There is a limit to primary wave 4, because the diagonal would be contracting so primary 4 may not be longer than primary 2. The trend lines must converge. A new low below 2,800.29 by any amount at any time frame firm invalidates this count.
Just so you know, I do have a chart for this idea which I update daily. If it improves in probability I may include the idea in the main analysis. For now, it too needs new all time highs in coming weeks / months, so there is no divergence in that expectation.
Thank you very much!
It may be moot if the futures don’t rebound in time for the index open!
Lara
Is another possibility that Primary 3 ended at the last high and we are in primary 4 whether its a contracting diagonal or not? It seems this pullback is too deep to be at intermediate degree as it matches the depth of Primary 2. If this is so then all we have left is Primary 5 which would significantly shorten whats left of Cycle V.
Comments?
Rich
No, because P4 would now be overlapping P1 price territory.
I do have a new alternate idea (actually a resuscitated old alternate idea) which I’ll publish above.
I wanted to mention that the COT report for gold showed a 10% contraction in open interest (over 50,000 contracts) from the previous week, and this was the highest price on a Tuesday close (7/30) since the breakout. Typically, if you’re bullish, you’d like to see open interest expanding as price increases – lower open interest as price increase portends, potentially, higher volatility. It seems 1375 will be tested eventually, and I think this definitely supports the bear case. Stay vigilant if gold gets a little wild here and makes a new high – could simply be the B wave.
GLTA
Lara
In this weeks analysis for the S&P, you talk about four conditions that if one or more happened it would support the main Elliot Wave count. One condition is a new all time high for price with support from volume. That would imply a price above 3027 which is still about 100 points away.
On the alternate wave count at the daily chart level, if it is a double zigzag, is there any guidelines for the length of an X wave?
Thanks for your guidance
Rich
Yes, a new ATH for price is some distance away.
Guidelines for X waves:
Within double zigzags they are normally brief and shallow, almost always subdividing as a zigzag but may be any corrective structure.
Within double combinations they are usually deep, almost always a zigzag but may be any corrective structure. These a bit more likely to be a flat also.
There is no rule stating a limit for X waves unfortunately. But like B waves they should exhibit weakness.
Lara,
Here is what I was thinking about oil instead of wave circle 2 being so short in time maybe it’s a much larger flat? So my target is around 48 for this minor wave c down before Intermediate wave C starts. If we start dropping much below 75% of wave (A) then odds go up this isn’t correct.
We are going to know very soon. Feel free to correct me as I’m still learning at this degree thing.
That’s possible, yes. (B) would need to retrace the minimum 0.9 length of (A) first. Which may invalidate the bearish count. So by that stage we’d have a reasonable idea.
(B) should also exhibit weakness.
Another great weekly analysis and commentary Lara. Thank you.
It appears oil has just begun it’s 3rd wave of a C wave desent into the 30’s. This is an Elliott Wave trader’s set up we wait for with great patience. As of today, I am 50% short using OILD as a 3X leveraged position. Early next week I will complete the position, 100% short.
Great discussion last week. I appreciate the fact Lara relies only upon price and some TA to derive here EW charts. Pure EW analysis fully avoids any and all fundamentals or other ‘white noise’. That is one big reason I am here and what separates Lara from the rest of the pack of EW analysts. With 45 years in the markets, 30 years following / learning EW, and almost 8 years following Lara, I am convinced Lara is the best by a large margin.
Have a great weekend evey one.
25 years in market but only been on here since Feb…..and I concur…..ty.
Hi Ron,
Why do you play OILD for oil? I also recall you play DUST for Gold. What s your rational for the two instruments?
Both are 3X leverage. I look for liquidity. If there is acceptable volume each day, I am satisfied. One ETF is as good as the next. In the case of OILD, it is based on oil price, WTI. Other ETFs are based on the energy sector. I wanted an ETF based on the price of oil not one based on the energy sector.
DUST is based on senior gold miners which often moves more than the price of gold itself.
BTW, any plans I lay out hete can change without notice here. Also, I do not give advice. I just report what I am doing.
Thank you very much Rodney.
Rodney,
I’m surprised you don’t trade futures. Once I have more confidence in general trading I’ll probably switch. I’m as old as you’ve been trading so time I have.
I’d like to see happens in a few hours once futures market opens. I see weakness in price and DMI when looking at SCO. Look back at July 18th and than look at the large volume spike on the 1st. Our leveraged etf’s look to be trailing CL. I think these leveraged etf traders are the first to exit once they smell something.
I totally agree with you Rodney…. That’s I am here as well… Lara is the best EW analyst in the market IMO. Even though I have my own way of doing my analysis, I rely on Lara to give me her opinion on her weekly EW analysis.
Best regards,
Mathieu
I echo your guys’ thoughts on this.
I use Lara’s analysis as a pathway, gut check, alternative views, entry points, exit points, etc.
Nobody can predict the future, but its nice to have some good guidance.
Thank you very much guys ☺️