

S&P 500
A sideways inside day to end the trading week leaves both Elliott wave counts essentially the same.
Classic analysis favours the main Elliott wave count.
Summary: An 80% up day, a long lower wick on the weekly candlestick, closure of the last gap, and bullish divergence between price and both of the AD line and inverted VIX indicate it is likely a low was in place on Monday. The next target is at 3,336.
A new low below 2,873.61 would indicate the alternate may be correct. At that stage, a target for downwards movement to end would be at 2,663.
The biggest picture, Grand Super Cycle analysis, is here.
Monthly charts were last published here, with video here. There are two further alternate monthly charts here. Video is here.
ELLIOTT WAVE COUNTS
The two weekly Elliott wave counts below will be labelled First and Second. They may be about of even probability. When the fifth wave currently unfolding on weekly charts may be complete, then these two wave counts will diverge on the severity of the expected following bear market. To see an illustration of this future divergence monthly charts should be viewed.
FIRST WAVE COUNT
WEEKLY CHART
Click chart to enlarge.
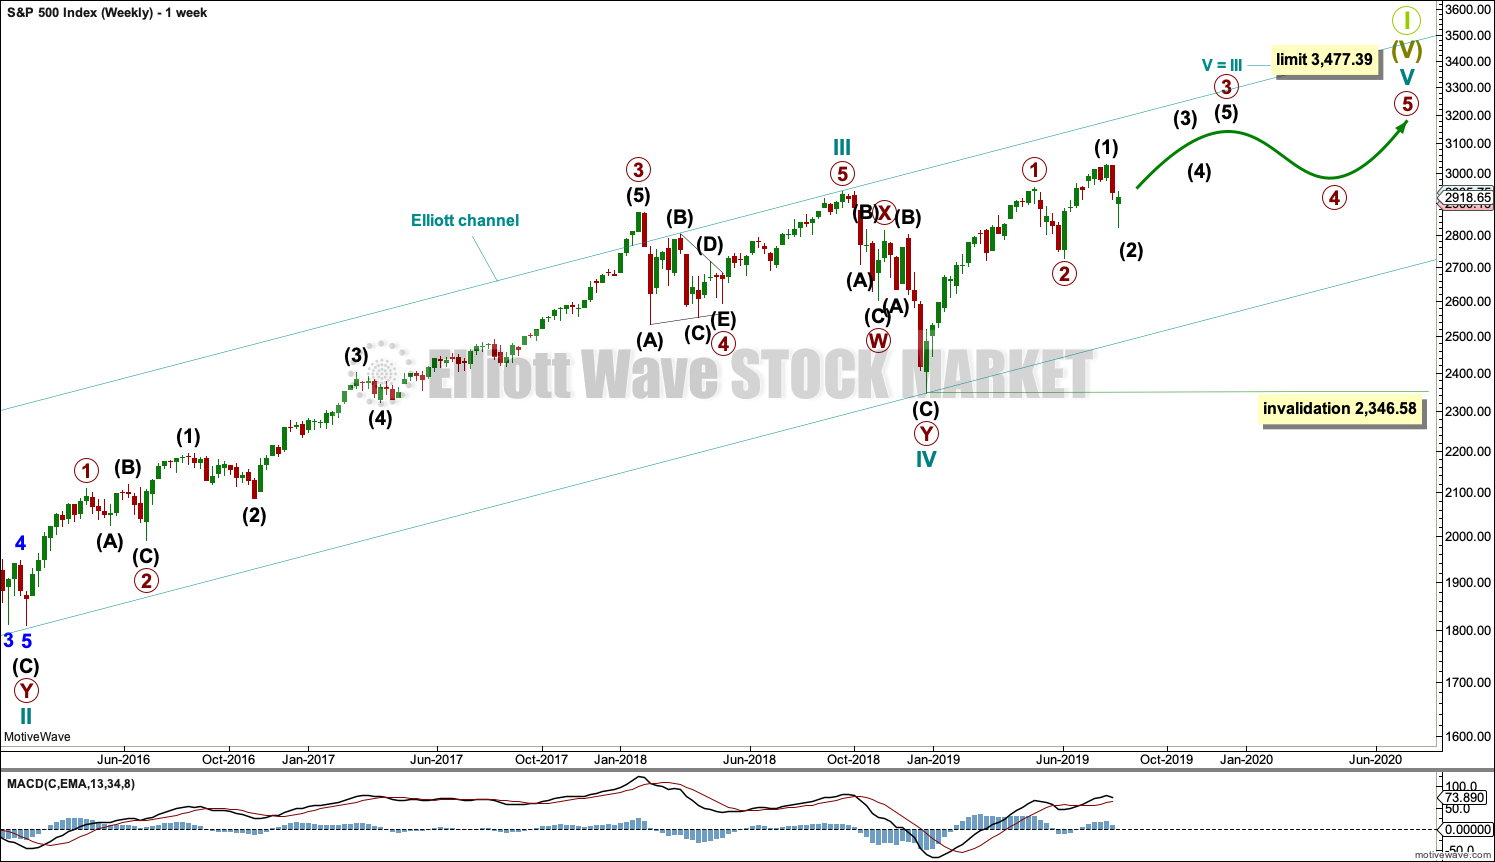
The basic Elliott wave structure consists of a five wave structure up followed by a three wave structure down (for a bull market). This wave count sees the bull market beginning in March 2009 as an incomplete five wave impulse and now within the last fifth wave, which is labelled cycle wave V. This impulse is best viewed on monthly charts. The weekly chart focusses on the end of it.
Elliott wave is fractal. This fifth wave labelled cycle wave V may end a larger fifth wave labelled Super Cycle wave (V), which may end a larger first wave labelled Grand Super Cycle wave I.
The teal Elliott channel is drawn using Elliott’s first technique about the impulse of Super Cycle wave (V). Draw the first trend line from the end of cycle wave I (off to the left of the chart, the weekly candlestick beginning 30th November 2014) to the end of cycle wave III, then place a parallel copy on the end of cycle wave II. This channel perfectly shows where cycle wave IV ended at support. The strongest portion of cycle wave III, the end of primary wave 3, overshoots the upper edge of the channel. This is a typical look for a third wave and suggests the channel is drawn correctly and the way the impulse is counted is correct.
Within Super Cycle wave (V), cycle wave III is shorter than cycle wave I. A core Elliott wave rule states that a third wave may never be the shortest. For this rule to be met in this instance, cycle wave V may not be longer in length than cycle wave III. This limit is at 3,477.39.
Cycle wave V may subdivide either as an impulse or an ending diagonal. Impulses are much more common. I have charted the possibility of an ending diagonal and will keep it updated, but the probability at this stage is too low for daily publication. It too needs new all time highs and so with no divergence at this stage it shall not be published.
The daily charts below will now focus on all of cycle wave V.
In historic analysis, two further monthly charts have been published that do not have a limit to upwards movement and are more bullish than this wave count. Members are encouraged to consider those possibilities (links below summary) alongside the wave counts presented on a daily and weekly basis.
MAIN DAILY CHART
Click chart to enlarge.
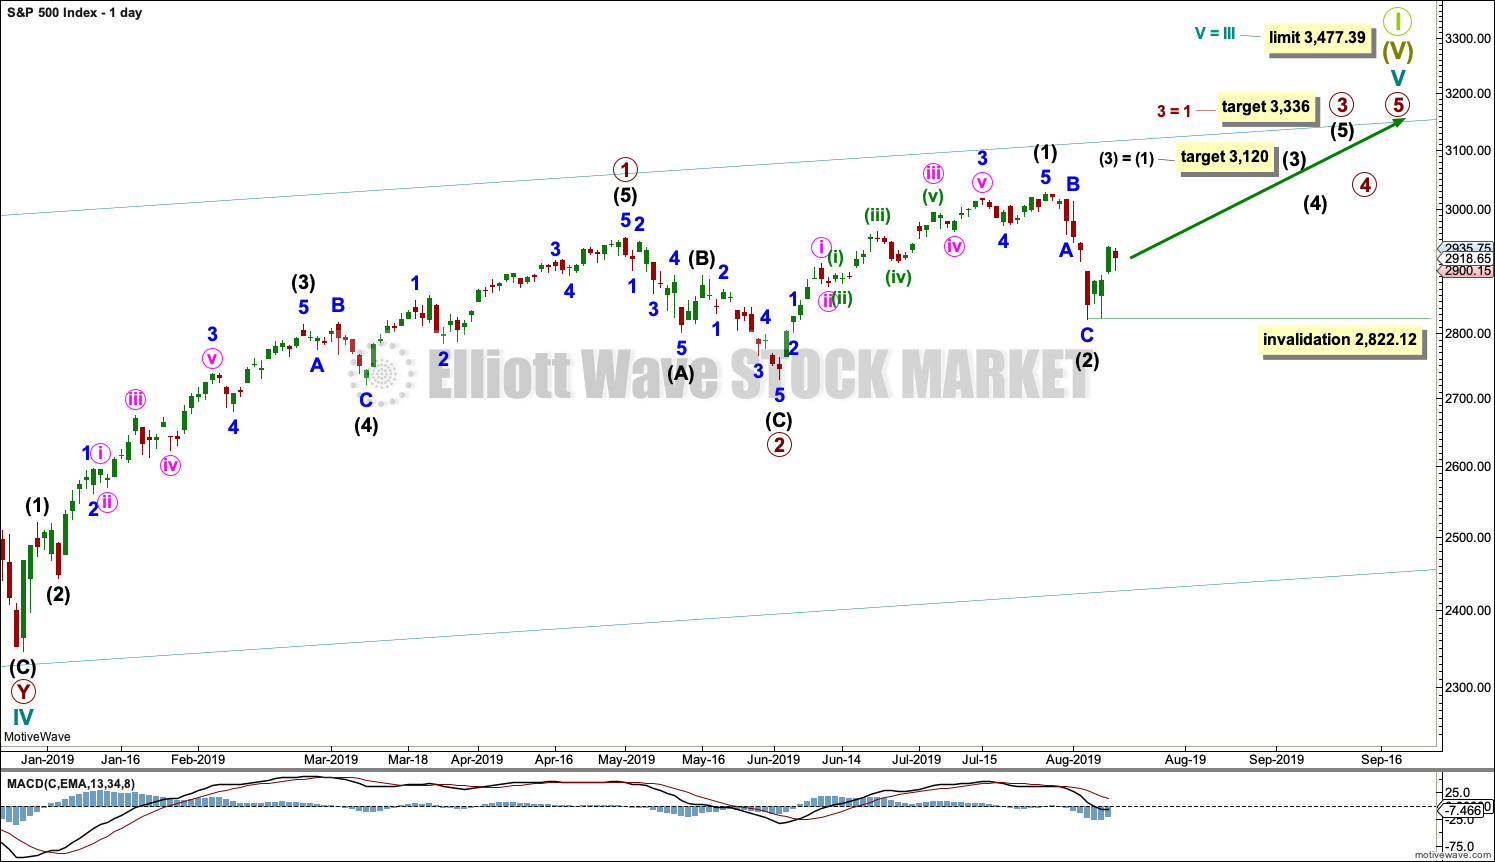
Cycle wave V must subdivide as a five wave motive structure. Within that five wave structure, primary waves 1 and 2 may be complete.
Primary wave 3 may only subdivide as an impulse. Within primary wave 3, intermediate waves (1) and (2) may now be complete. Intermediate wave (2) may have ended close to the 0.618 Fibonacci ratio of intermediate wave (1). Within intermediate wave (3), no second wave correction may move beyond its start below 2,822.12.
A target is calculated for intermediate wave (3) that fits with the higher target for primary wave 3.
A target is calculated for primary wave 3 that fits with the higher limit for cycle wave V.
ALTERNATE DAILY CHART
Click chart to enlarge.
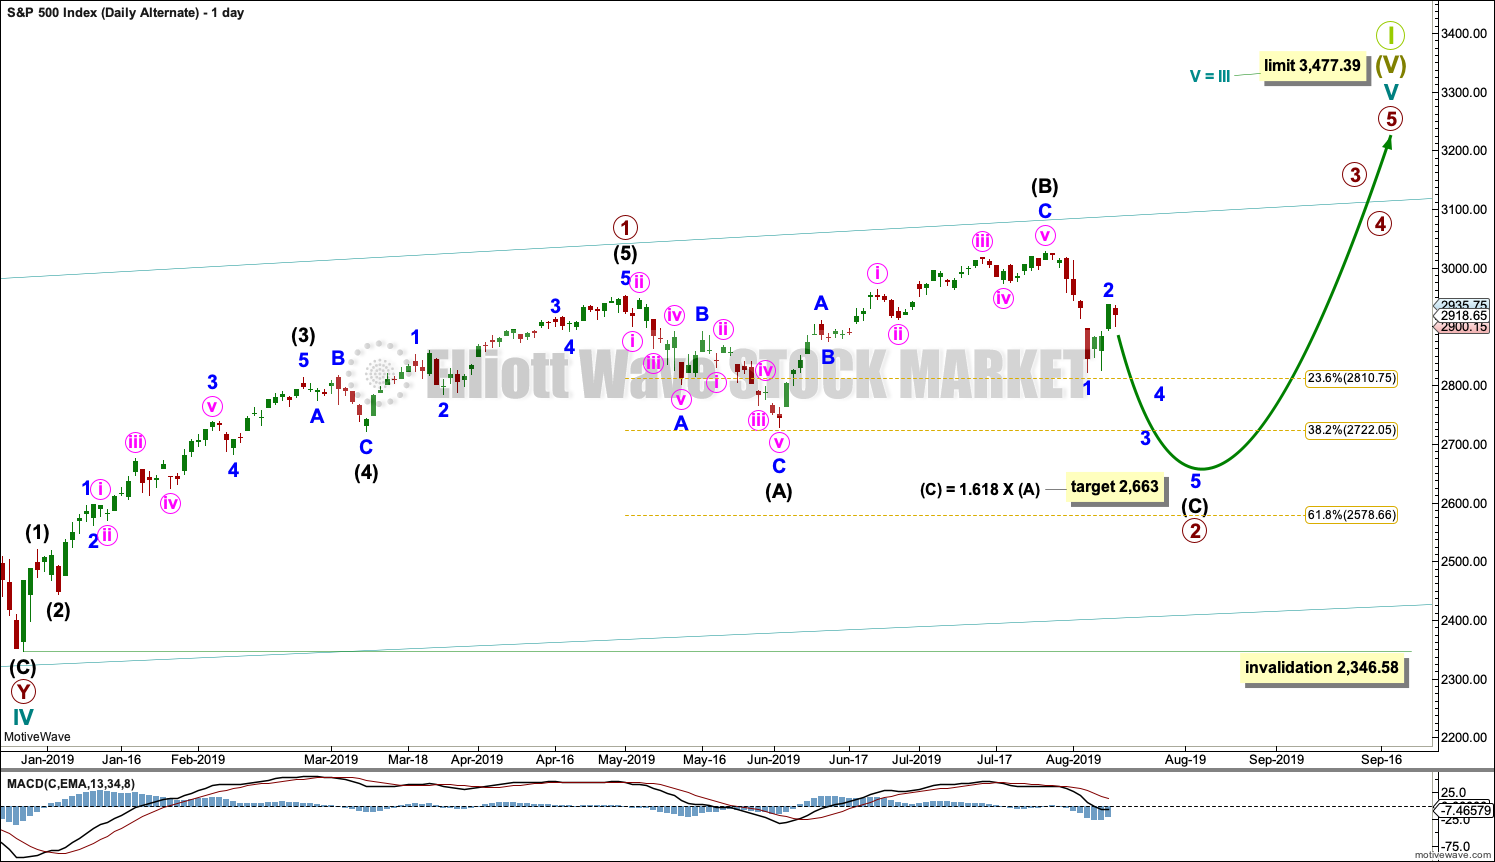
It is possible that primary wave 2 may not be over and continue further as an expanded flat correction. Within the expanded flat, intermediate wave (B) is a 1.33 length of intermediate wave (A), within the most common range of up to 1.38.
Intermediate wave (C) for this wave count should now move below the end of intermediate wave (A) to avoid a truncation. The target calculated would expect this.
If price falls through the first target, then the next target may be the 0.618 Fibonacci Ratio about 2,579.
Strong and final support may be expected at the lower edge of the teal Elliott channel.
SECOND WAVE COUNT
WEEKLY CHART
Click chart to enlarge.
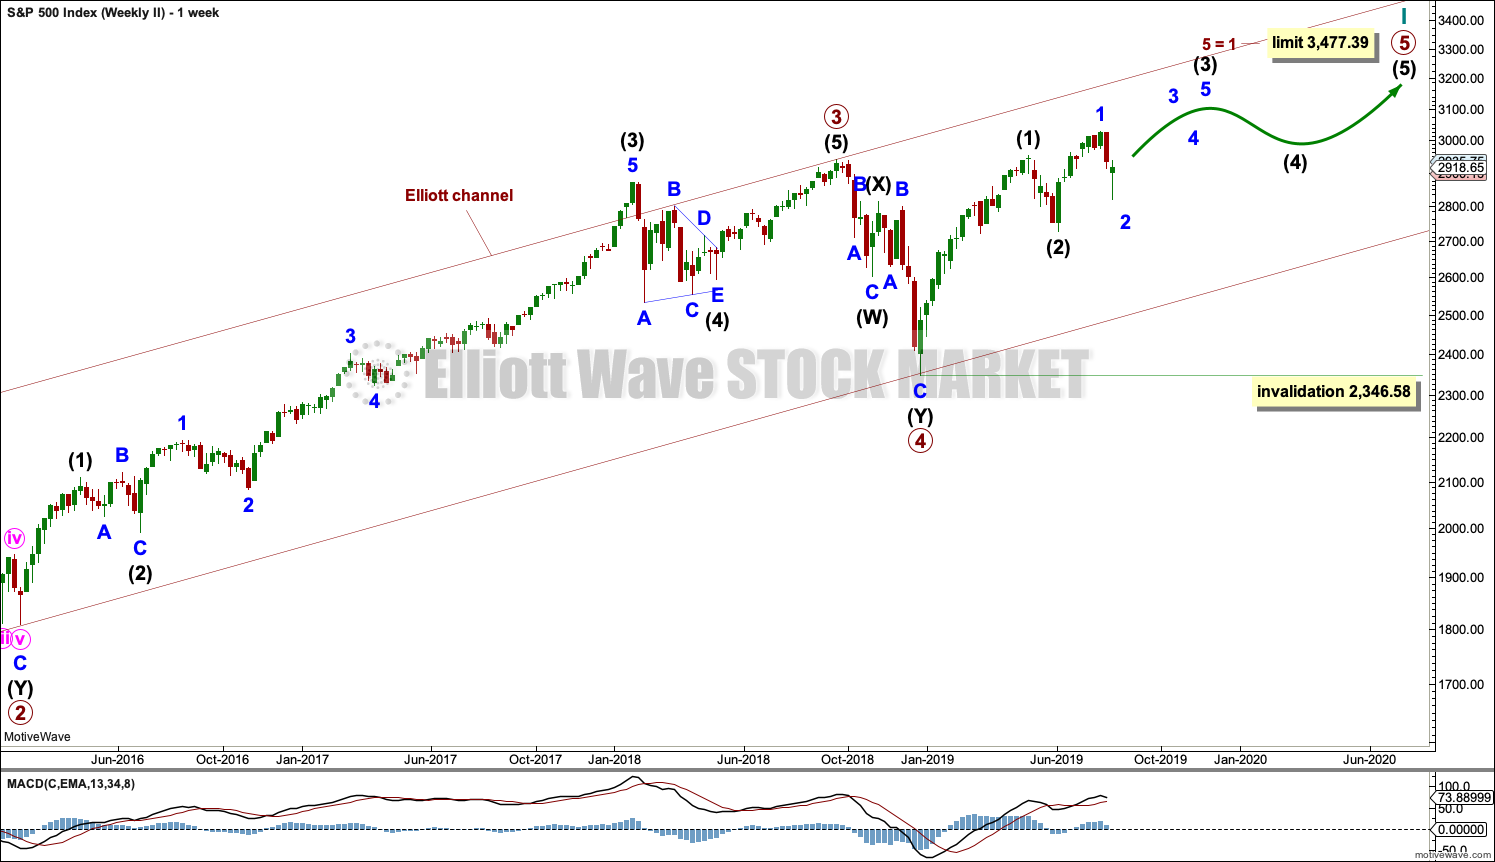
This weekly chart is almost identical to the first weekly chart, with the sole exception being the degree of labelling.
This weekly chart moves the degree of labelling for the impulse beginning in March 2009 all down one degree. This difference is best viewed on monthly charts.
The impulse is still viewed as nearing an end; a fifth wave is still seen as needing to complete higher. This wave count labels it primary wave 5.
TECHNICAL ANALYSIS
WEEKLY CHART
Click chart to enlarge. Chart courtesy of StockCharts.com.
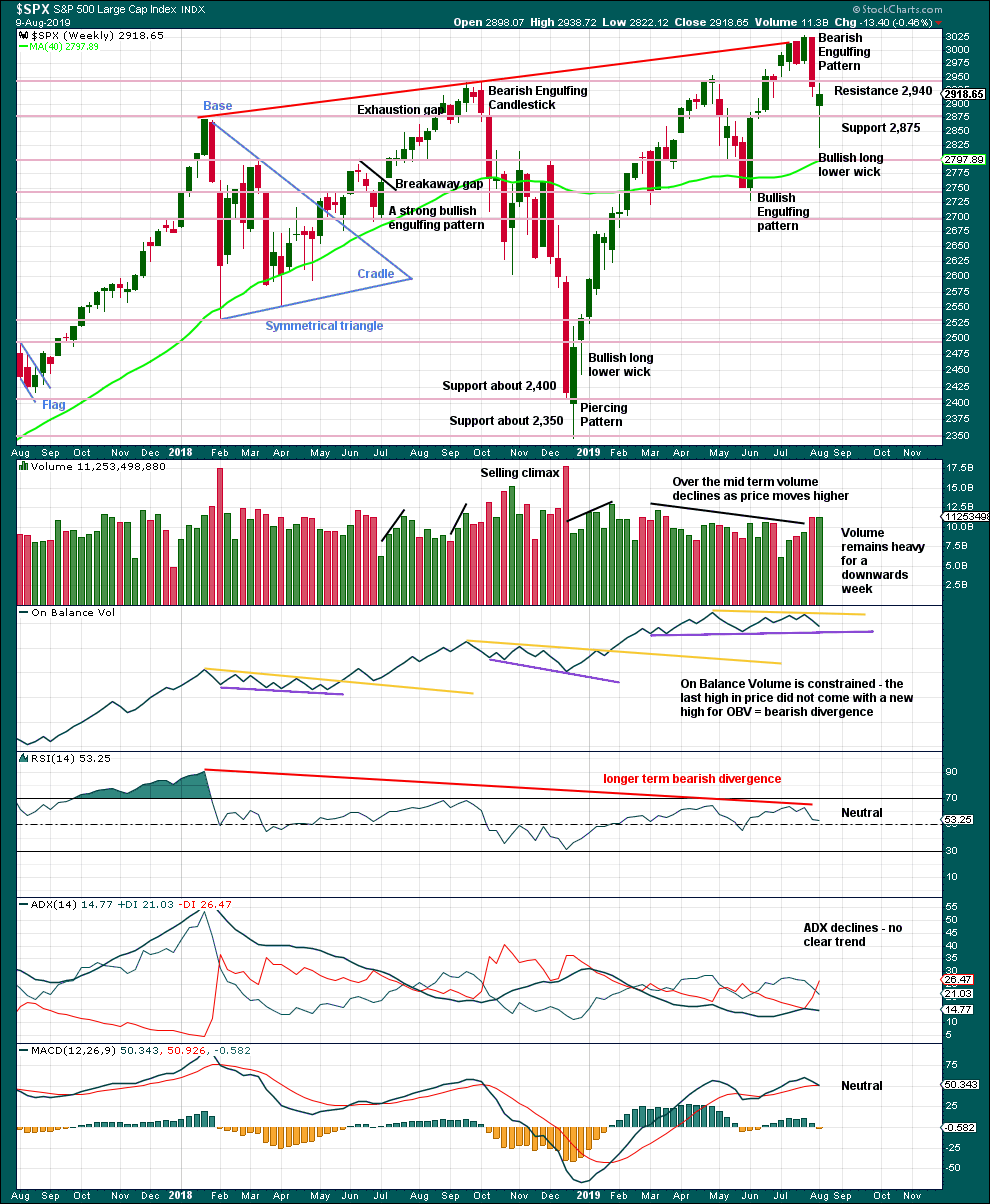
A Bearish Engulfing candlestick pattern has now been followed by a downwards week. It is possible now that the bearish reversal pattern may be resolved.
This weekly candlestick has a bullish long lower wick. This suggests upwards movement next week.
DAILY CHART
Click chart to enlarge. Chart courtesy of StockCharts.com.
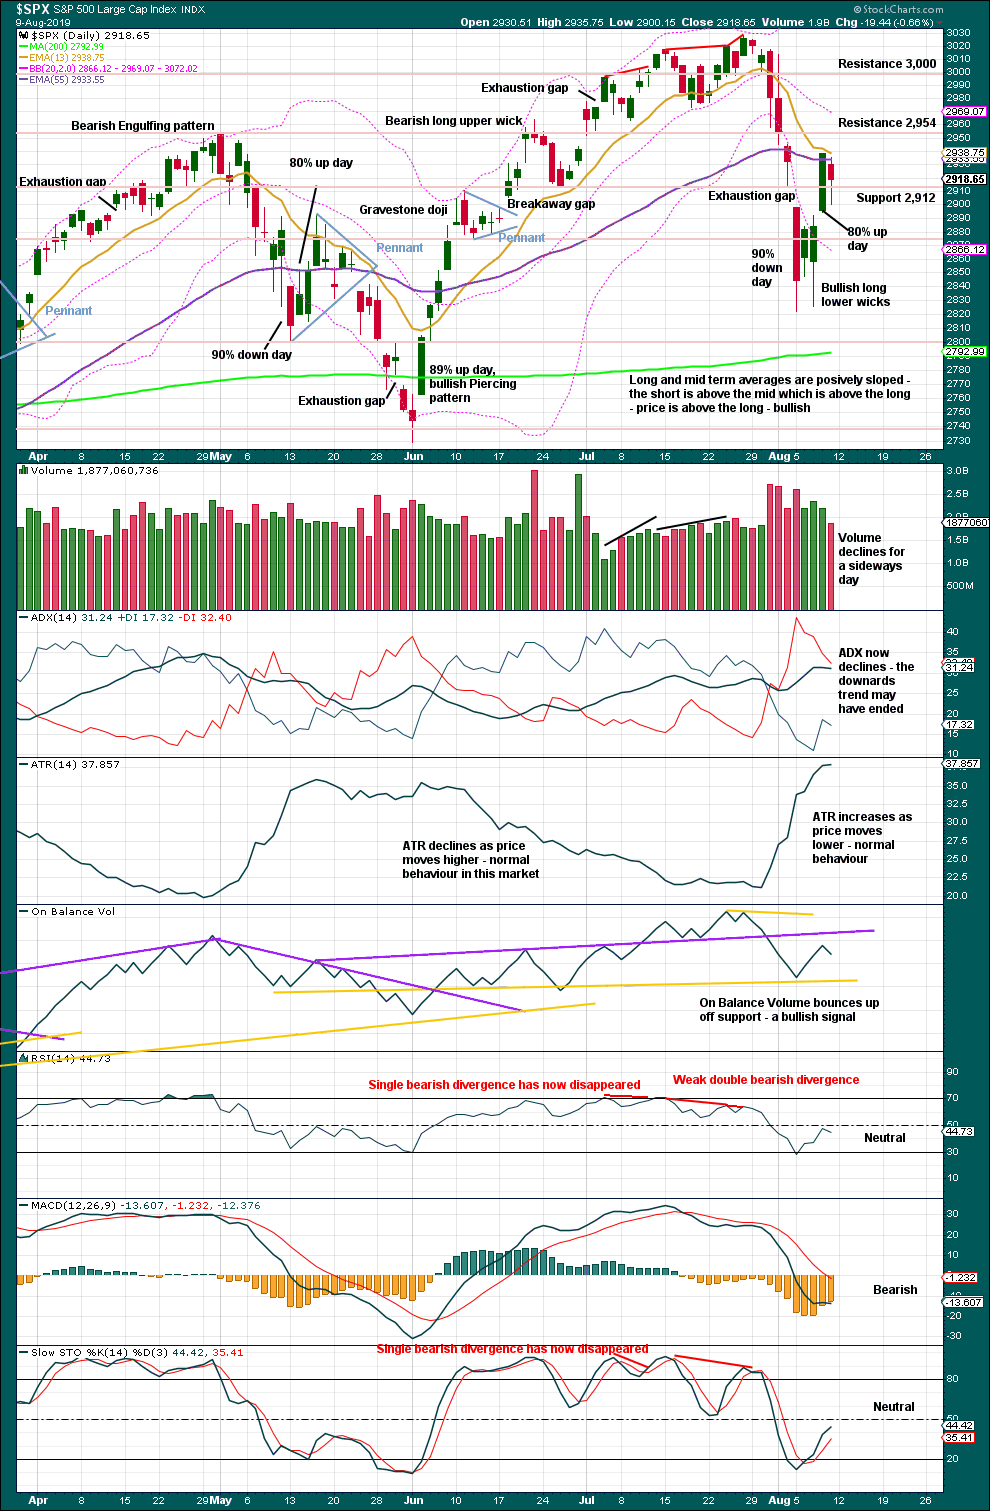
Support for the view that a low is now in place:
– An 80% up day.
– A close of the last gap (it is renamed an exhaustion gap).
– ADX declines.
– RSI reached oversold at the low.
Support for a bearish outlook:
– Weak volume for this last upwards day (but this support is slight because declining volume on rising price has been a feature of this bull market now for years).
– The lack of a 90% up day.
BREADTH – AD LINE
WEEKLY CHART
Click chart to enlarge. Chart courtesy of StockCharts.com. So that colour blind members are included, bearish signals
will be noted with blue and bullish signals with yellow.
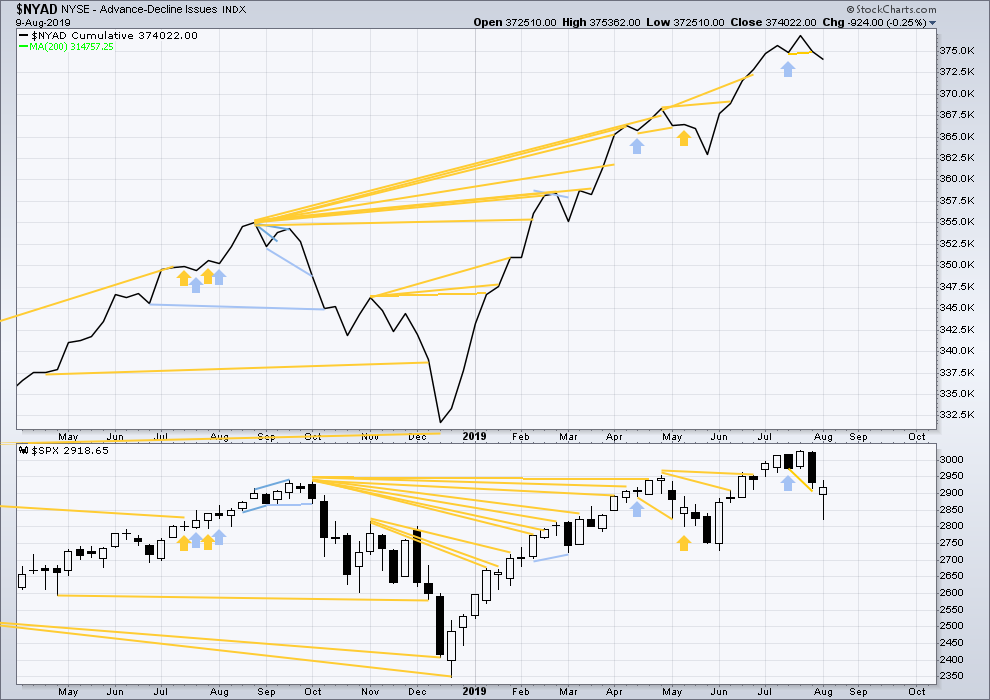
Bear markets from the Great Depression and onwards have been preceded by an average minimum of 4 months divergence between price and the AD line with only two exceptions in 1946 and 1976. With the AD line making new all time highs again this week, the end of this bull market and the start of a new bear market is very likely a minimum of 4 months away, which is mid November 2019.
In all bear markets in the last 90 years there is some positive correlation (0.6022) between the length of bearish divergence and the depth of the following bear market. No to little divergence is correlated with more shallow bear markets. Longer divergence is correlated with deeper bear markets.
If a bear market does develop here, it comes after no bearish divergence. It would therefore more likely be shallow.
This week both price and the AD line move lower. Short-term bullish divergence noted in last weekly analysis has not been followed by upwards movement. It may have failed.
There is no new short-term divergence.
DAILY CHART
Click chart to enlarge. Chart courtesy of StockCharts.com. So that colour blind members are included, bearish signals
will be noted with blue and bullish signals with yellow.
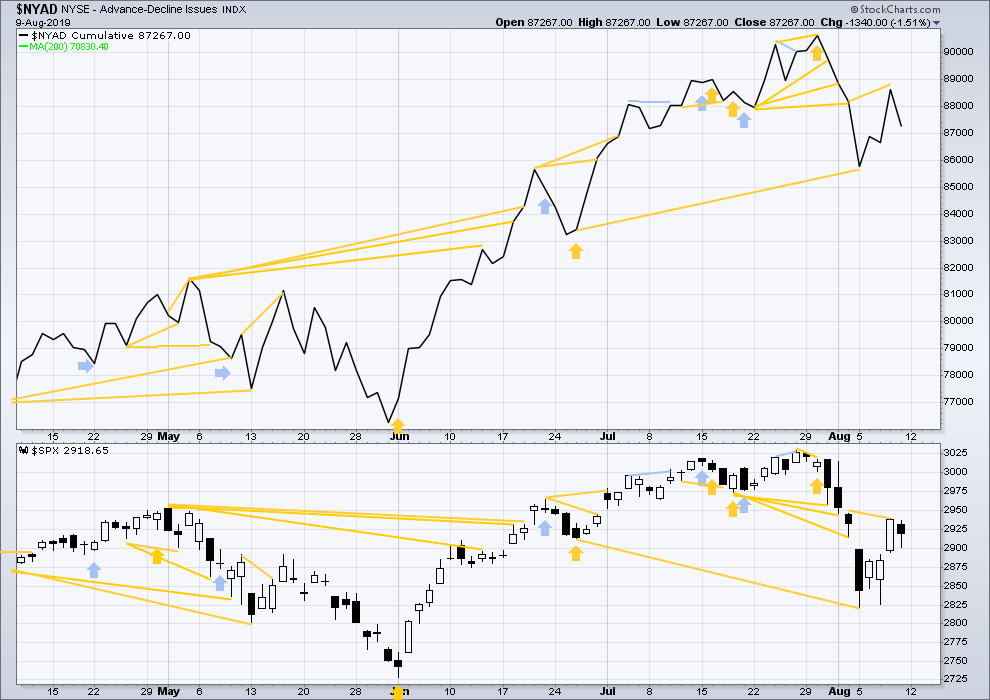
Breadth should be read as a leading indicator.
There remains short-term bullish divergence. The AD line has made a new high above the prior high of the 2nd of August, but price has not. This supports the main Elliott wave count.
For Friday both price and the AD line moved lower within the session. There is no new short-term divergence.
All of large, mid and small caps have rebounded strongly off Monday’s lows. There is breadth in upwards movement this week.
VOLATILITY – INVERTED VIX CHART
WEEKLY CHART
Click chart to enlarge. Chart courtesy of StockCharts.com. So that colour blind members are included, bearish signals
will be noted with blue and bullish signals with yellow.
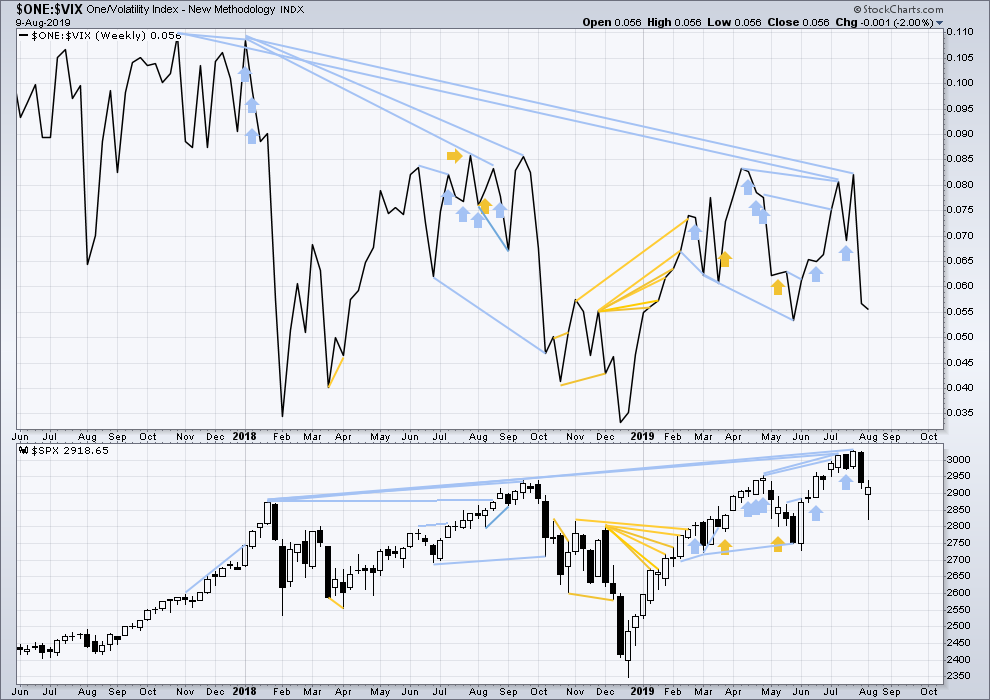
The all time high for inverted VIX (which is the same as the low for VIX) was on 30th October 2017. There is now nearly one year and nine months of bearish divergence between price and inverted VIX.
The rise in price is not coming with a normal corresponding decline in VIX; VIX remains elevated. This long-term divergence is bearish and may yet develop further as the bull market matures.
This divergence may be an early warning, a part of the process of a top developing that may take years. It may not be useful in timing a trend change.
This week both price and inverted VIX have moved lower. There is no new short-term divergence.
DAILY CHART
Click chart to enlarge. Chart courtesy of StockCharts.com. So that colour blind members are included, bearish signals
will be noted with blue and bullish signals with yellow.
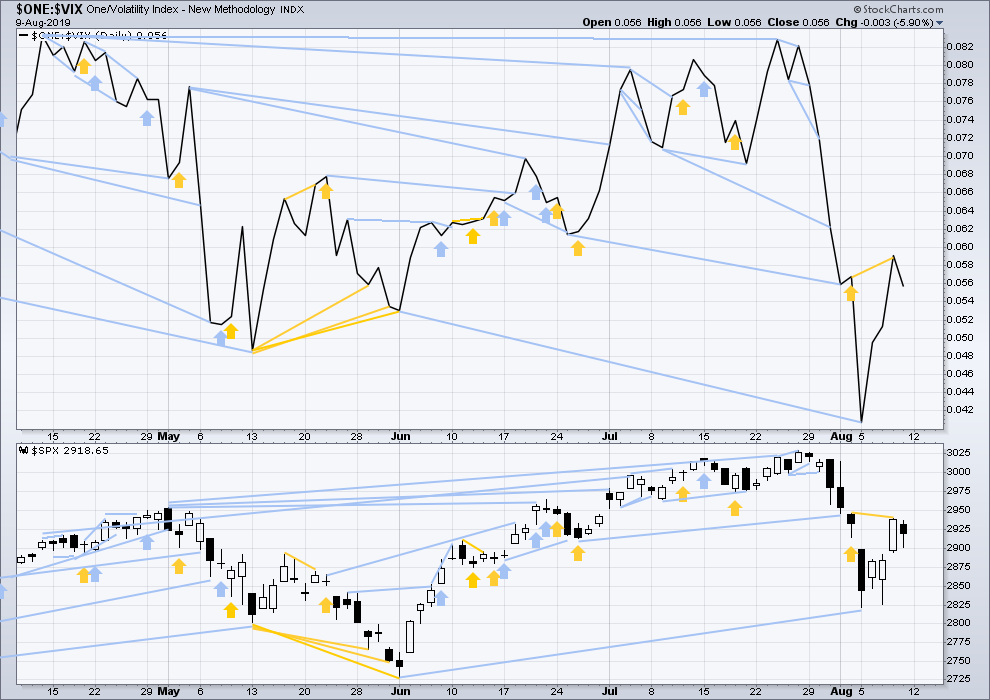
Thursday’s high for inverted VIX was slightly higher than the high for the 2nd of August, but price was not. This divergence is bullish for the short term.
For Friday both price and inverted VIX moved lower within the session. There is no new short-term divergence.
DOW THEORY
Dow Theory confirmed a bear market in December 2018. This does not necessarily mean a bear market at Grand Super Cycle degree though; Dow Theory makes no comment on Elliott wave counts. On the 25th of August 2015 Dow Theory also confirmed a bear market. The Elliott wave count sees that as part of cycle wave II. After Dow Theory confirmation of a bear market in August 2015, price went on to make new all time highs and the bull market continued.
DJIA: 23,344.52 – a close on the 19th of December at 23,284.97 confirms a bear market.
DJT: 9,806.79 – price has closed below this point on the 13th of December.
S&P500: 2,532.69 – a close on the 19th of December at 2,506.96 provides support to a bear market conclusion.
Nasdaq: 6,630.67 – a close on the 19th of December at 6,618.86 provides support to a bear market conclusion.
With all the indices having moved higher following a Dow Theory bear market confirmation, Dow Theory would confirm a bull market if the following highs are made:
DJIA: 26,951.81 – a close above this point has been made on the 3rd of July 2019.
DJT: 11,623.58 – to date DJT has failed to confirm an ongoing bull market.
S&P500: 2,940.91 – a close above this point was made on the 29th of April 2019.
Nasdaq: 8,133.30 – a close above this point was made on the 26th of April 2019.
GOLD
At the end of the week, two small sideways days do not change the overall expectation from both Elliott wave counts.
Summary: There is an upwards trend in place that is very extreme. Conditions are overbought. This can continue while price moves a considerable distance further, or a trend change may occur at any time now. Caution is warranted. Risk management is essential.
The bullish Elliott wave count expects a large interruption to the trend to begin about 1,565.
The bearish Elliott wave count expects the upwards trend to end about 1,582 to 1,586.
Grand SuperCycle analysis is here.
Monthly charts were last published here with video here.
BEARISH ELLIOTT WAVE COUNT
WEEKLY CHART
Click chart to enlarge.
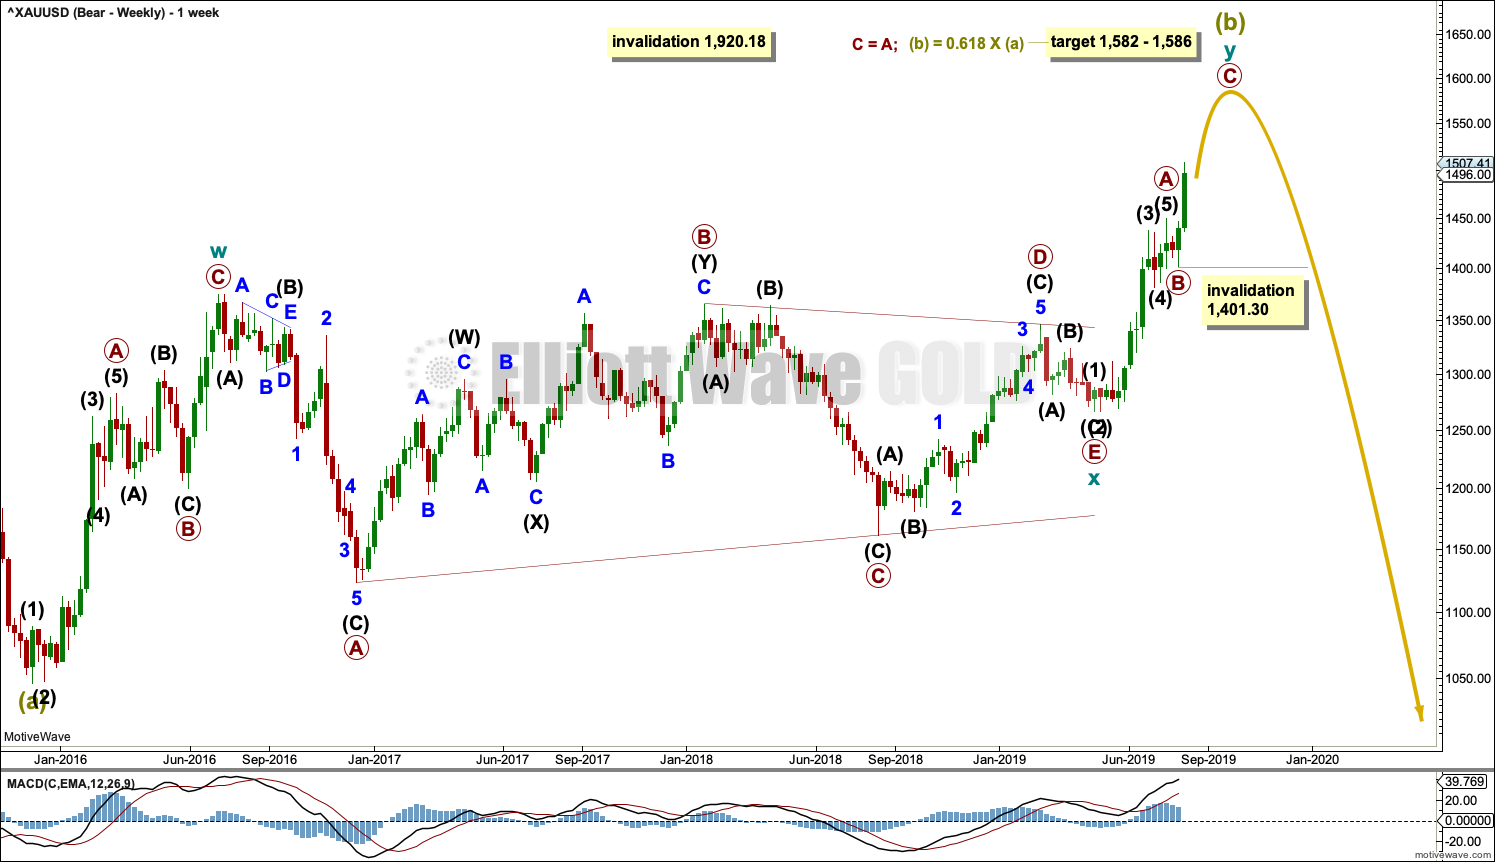
This is now the sole remaining bearish Elliott wave count.
It remains possible that Super Cycle wave (b) is an incomplete double zigzag.
The first zigzag in the double is labelled cycle wave w. The double is joined now by a three in the opposite direction, a triangle labelled cycle wave x. The second zigzag in the double is labelled cycle wave y.
Cycle wave y must subdivide as a zigzag if Super Cycle wave (b) is a double zigzag. Within cycle wave y, primary waves A and B may now be complete. No second wave correction within primary wave B may move beyond its start below 1,401.30.
The purpose of the second zigzag in a double is to deepen the correction. So far cycle wave y has already achieved this purpose.
The 0.618 Fibonacci Ratio of Super Cycle wave (a) is at 1,586.
Super Cycle wave (b) may not move beyond the start of Super Cycle wave (a) above 1,920.18.
DAILY CHART
Click chart to enlarge.
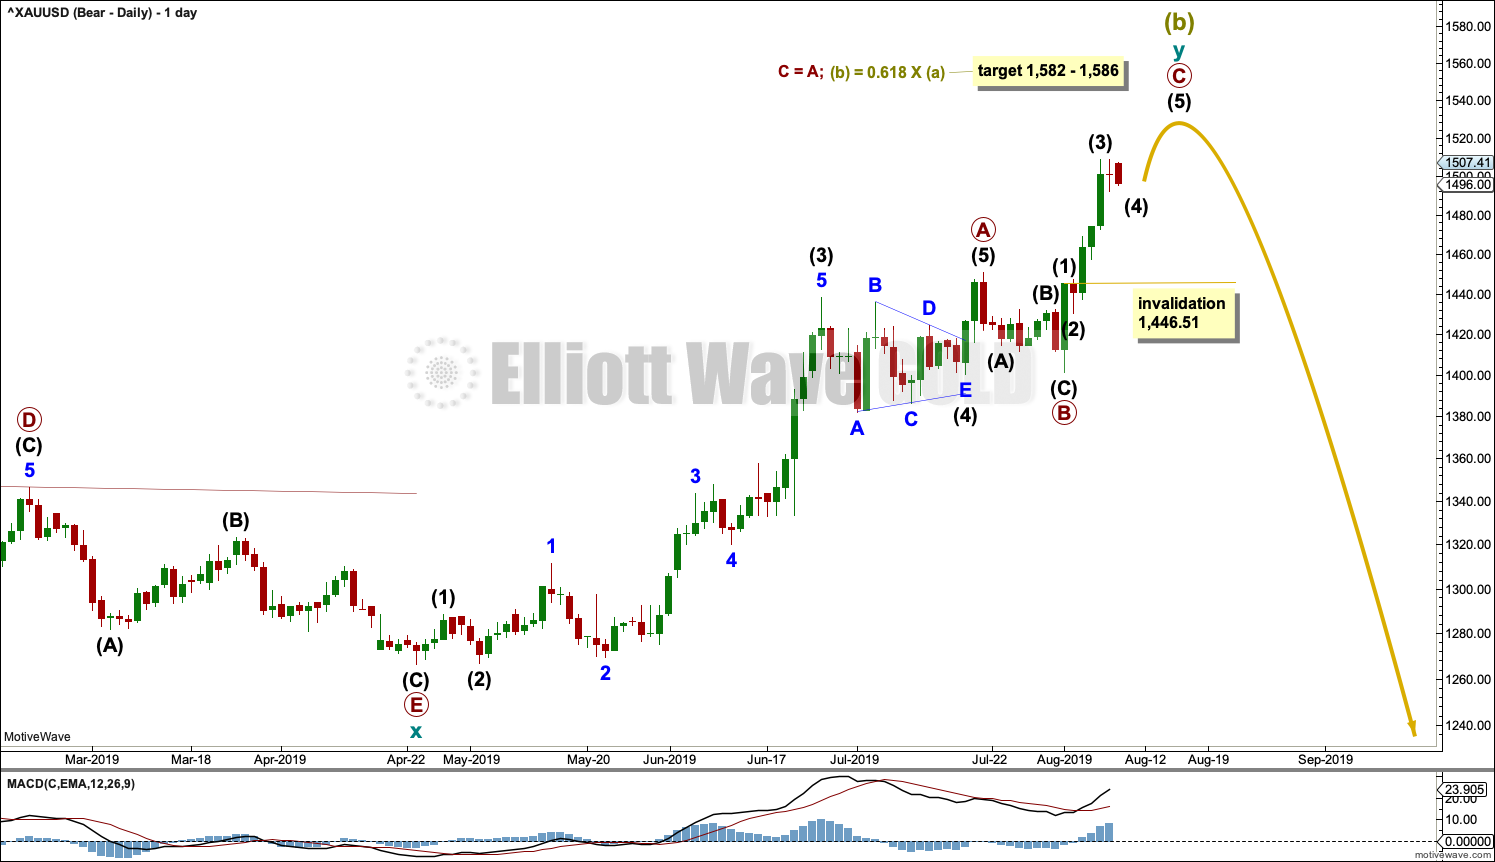
Primary wave C must complete as a five wave structure. So far intermediate waves (1) through to (3) may be complete. Intermediate wave (4) may not move into intermediate wave (1) price territory below 1,446.51.
When intermediate waves (3) and (4) may be complete, then the target calculation may be added to at intermediate degree. At that stage, it may change.
BULLISH ELLIOTT WAVE COUNT
WEEKLY CHART
Click chart to enlarge.
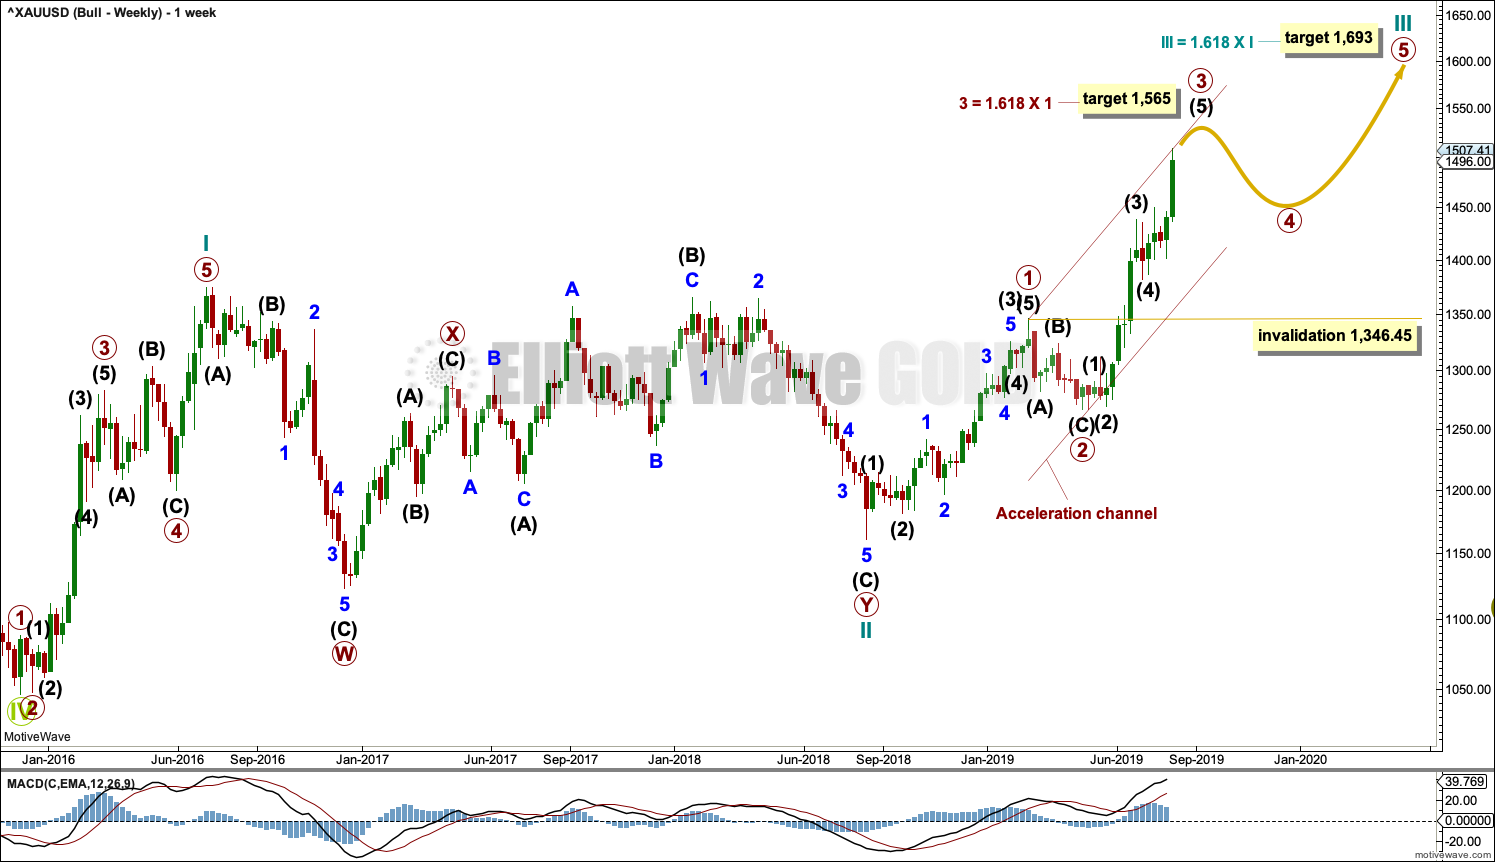
This wave count sees the the bear market complete at the last major low for Gold in November 2015.
If Gold is in a new bull market, then it should begin with a five wave structure upwards on the weekly chart. However, the biggest problem with this wave count is the structure labelled cycle wave I because this wave count must see it as a five wave structure, but it looks more like a three wave structure.
Commodities often exhibit swift strong fifth waves that force the fourth wave corrections coming just prior and just after to be more brief and shallow than their counterpart second waves. It is unusual for a commodity to exhibit a quick second wave and a more time consuming fourth wave, and this is how cycle wave I is labelled. This wave count still suffers from this very substantial problem, and for this reason the bearish wave count is still considered because it has a better fit in terms of Elliott wave structure.
Cycle wave II subdivides well as a double combination: zigzag – X – expanded flat.
Cycle wave III may have begun. Within cycle wave III, primary waves 1 and 2 may now be complete. Primary wave 3 has now moved above the end of primary wave 1 meeting a core Elliott wave rule. It has now moved far enough to allow room for primary wave 4 to unfold and remain above primary wave 1 price territory. Primary wave 4 may not move into primary wave 1 price territory below 1,346.45.
Cycle wave III so far for this wave count would have been underway now for 51 weeks. It is beginning to exhibit some support from volume and increasing ATR. This wave count now has some support from classic technical analysis.
Redraw an acceleration channel about primary waves 1 and 2: draw the first trend line from the end of primary wave 1 to the last high, then place a parallel copy on the low of primary wave 2. Keep redrawing the channel as price continues higher. When primary wave 3 is complete, then this channel would be drawn using Elliott’s first technique about the impulse. The lower edge may provide support.
DAILY CHART
Click chart to enlarge.
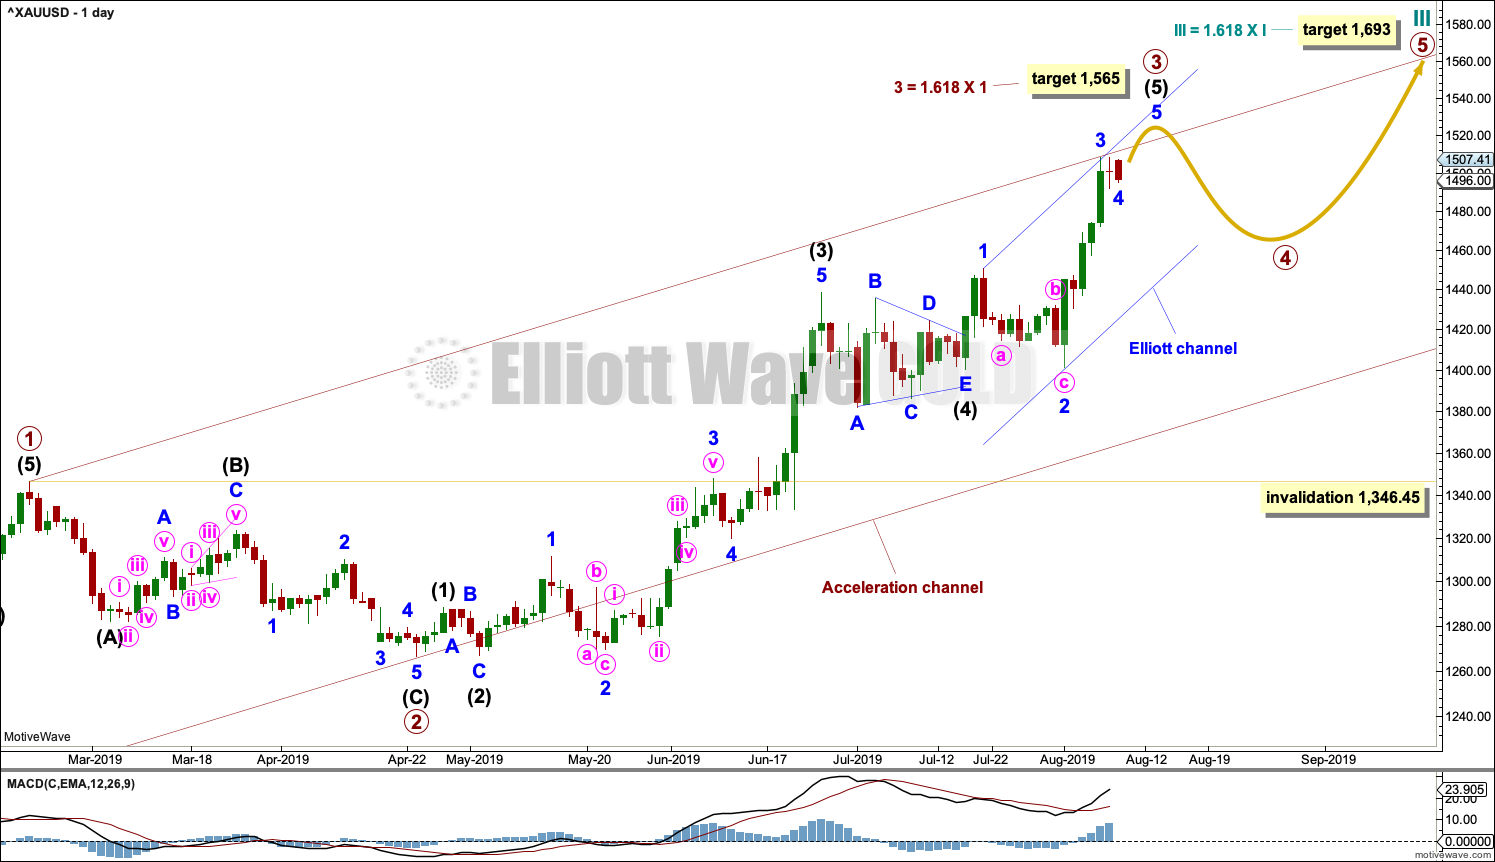
Primary wave 3 may only subdivide as an impulse. Within the impulse, intermediate waves (1) through to (4) are all now complete. The structure of intermediate wave (5) is now incomplete, so it needs to move higher.
When it arrives, then primary wave 4 may not move into primary wave 1 price territory below 1,346.45.
Because intermediate wave (5) is a fifth wave to end a third wave one degree higher, at primary degree, it may exhibit swift strong movement. It may end with a blow off top.
Draw a channel using Elliott’s technique about intermediate wave (5) as shown in blue. The upper edge may provide resistance for minor wave 5.
TECHNICAL ANALYSIS
MONTHLY CHART
Click chart to enlarge. Chart courtesy of StockCharts.com.
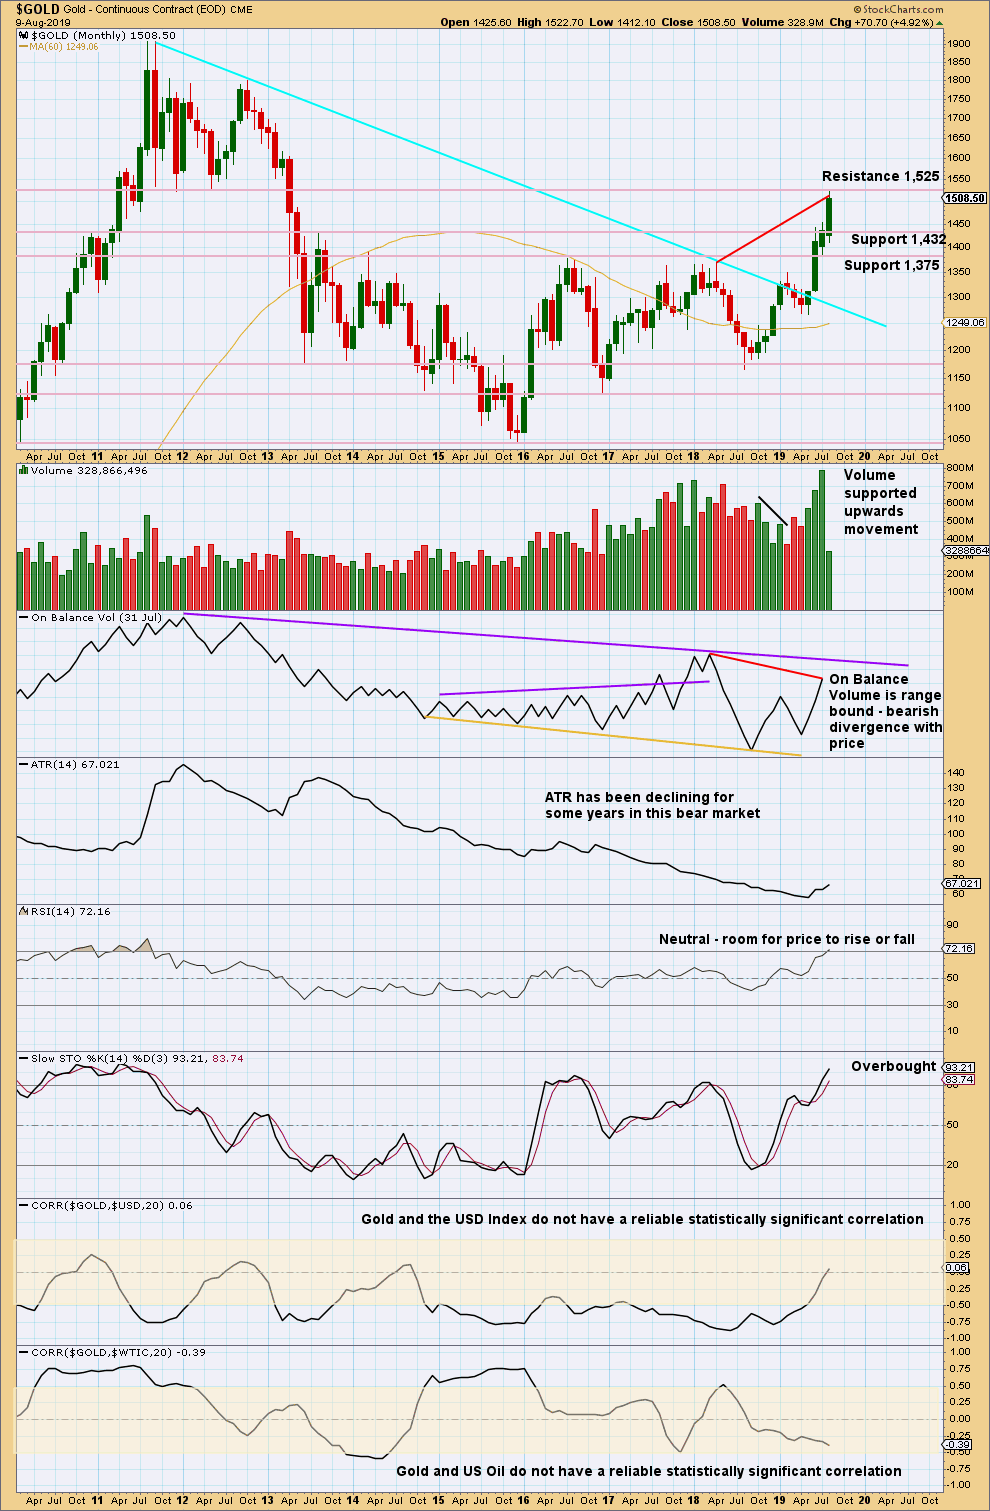
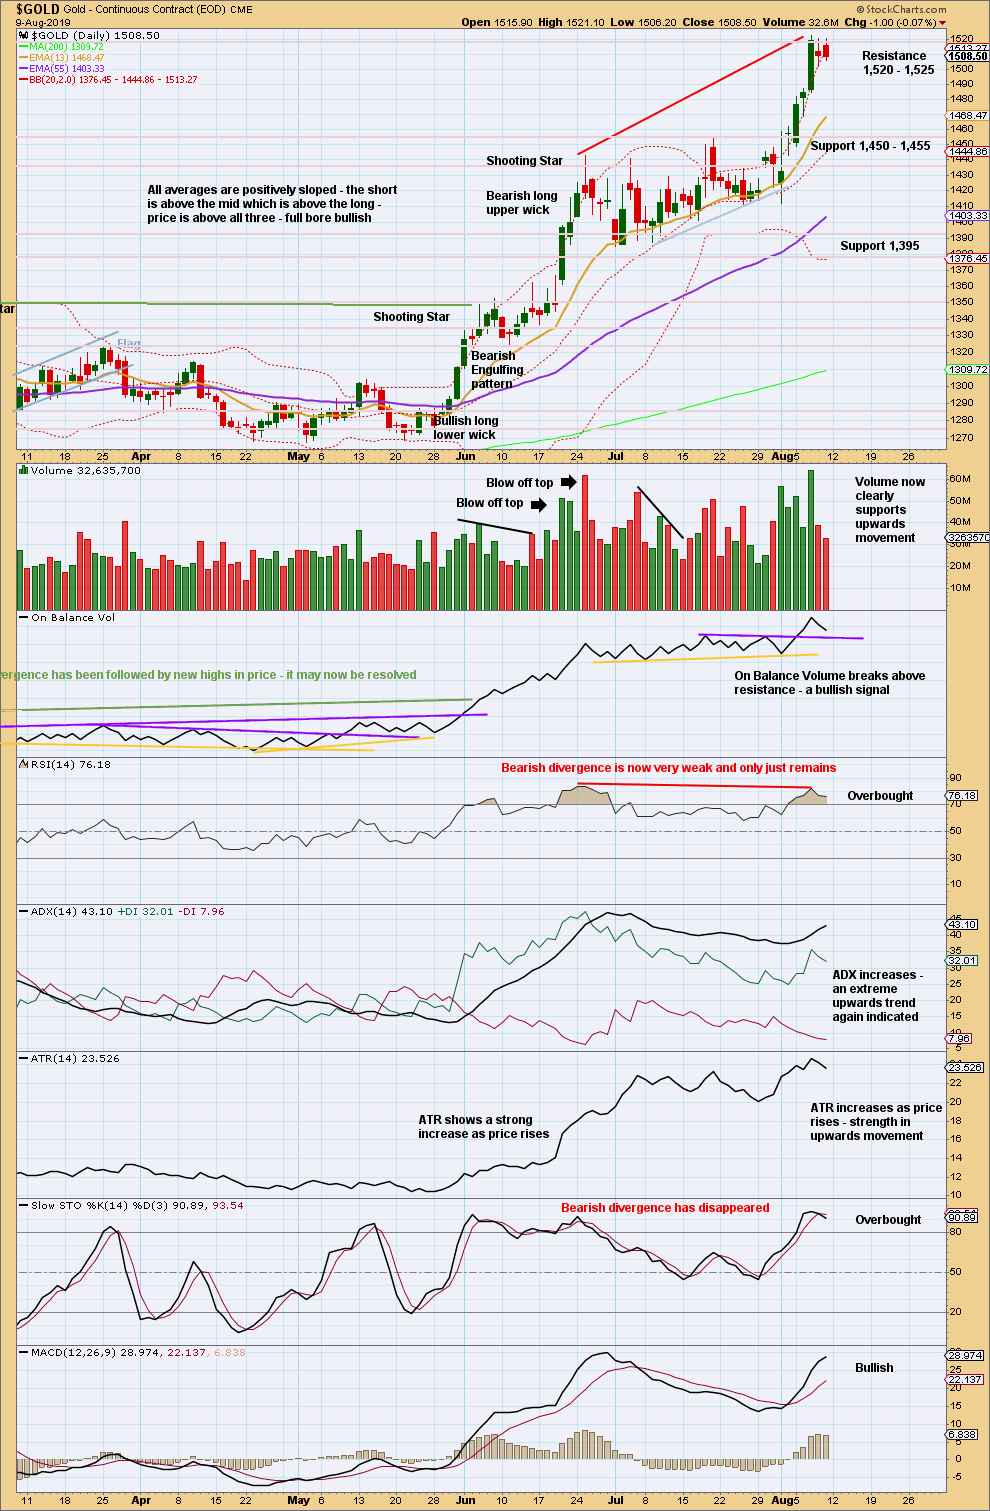
Gold has effected an upwards breakout above multi-year resistance and above the cyan bear market trend line. Price is now at strong resistance about 1,525.
The new high in price above prior highs for March / April 2018 have not been matched by new highs for On Balance Volume. This divergence is bearish and supports a bearish Elliott wave count. This divergence may be given a little weight because it is strong and evident on the monthly chart.
WEEKLY CHART
Click chart to enlarge. Chart courtesy of StockCharts.com.
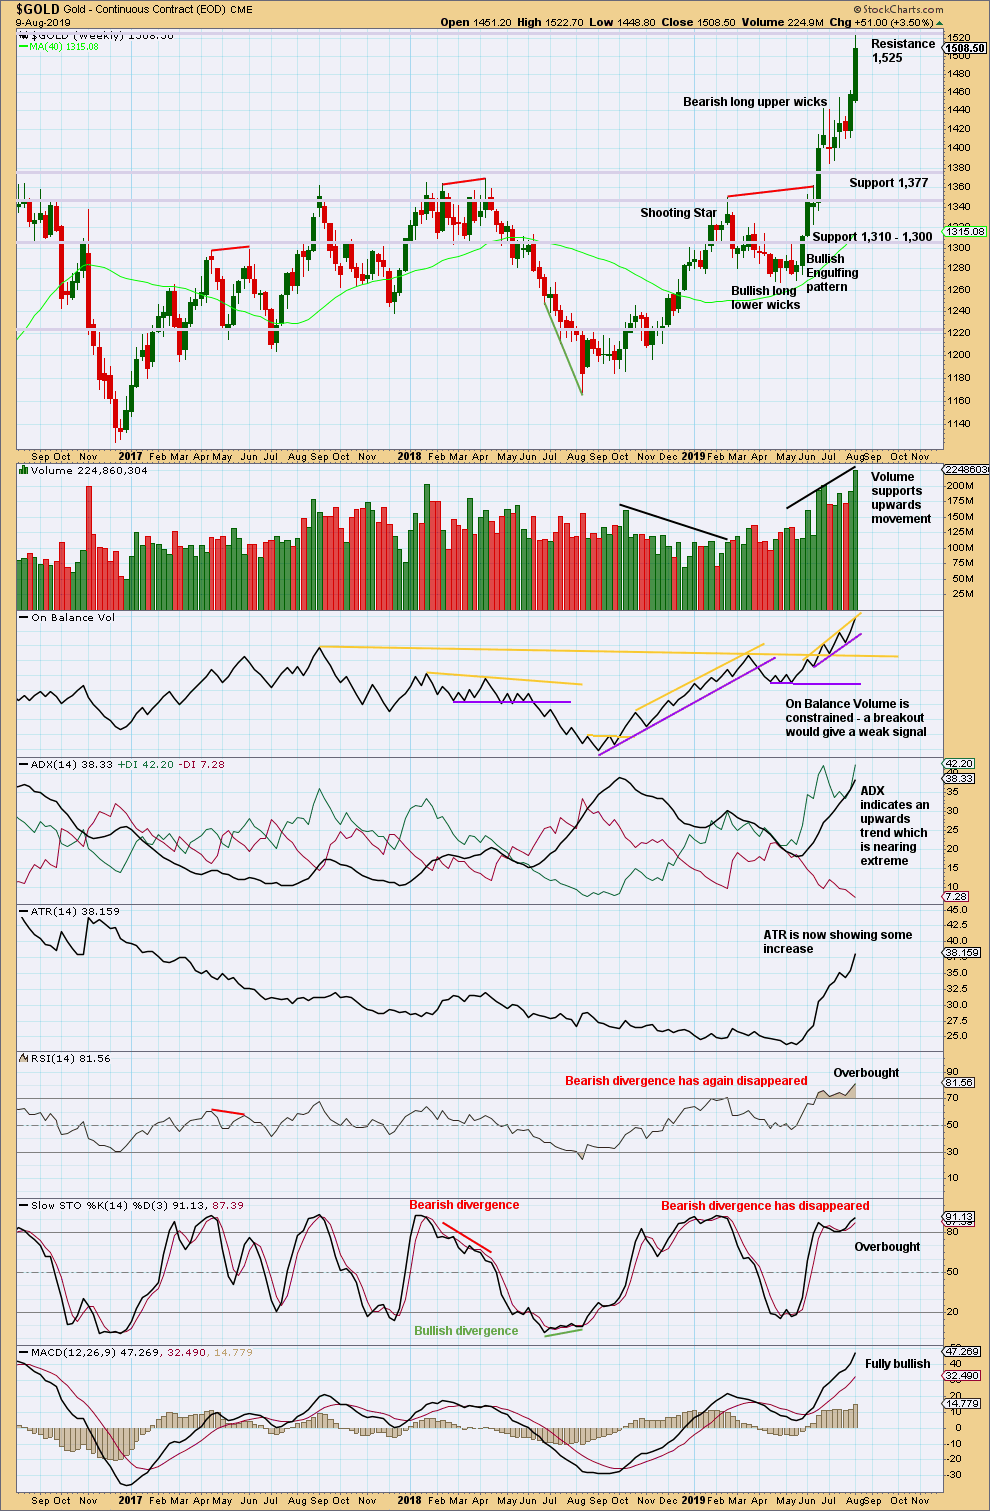
When trends for Gold reach extreme, they can continue still for a few weeks and price can continue for a considerable distance.
When both ADX and RSI reach extreme together, then that is sometimes where a trend ends.
RSI at overbought on the weekly chart is a warning to be cautious; the trend is overbought, but at this stage there is no evidence of a trend change.
DAILY CHART
Click chart to enlarge. Chart courtesy of StockCharts.com.
Look for support in the first instance at last resistance, which is now at 1,455.
There is resistance about here at 1,520 – 1,525. Next reasonable resistance above is about 1,600.
Assume the upwards trend remains in place until proven otherwise. Proven otherwise may be a strong bearish candlestick pattern, particularly if it comes after a blow off top. At this stage, there is no evidence of a trend change.
GDX WEEKLY CHART
Click chart to enlarge. Chart courtesy of StockCharts.com.
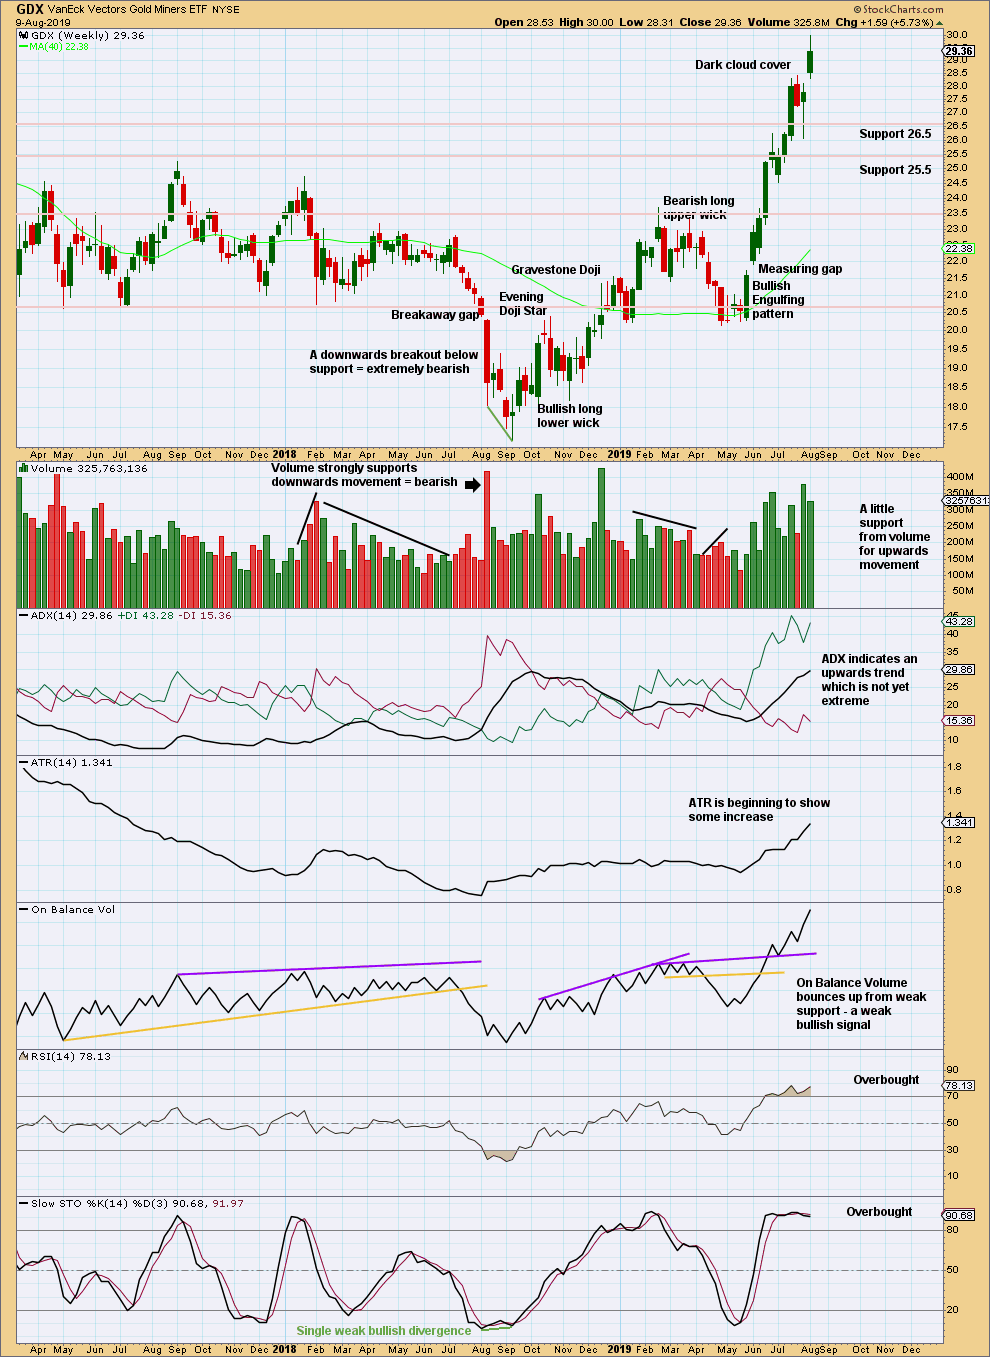
The Dark Cloud Cover reversal pattern was followed by downwards movement in the following week.
Now a new high indicates the last pullback should be over.
Volume this week has slightly declined, but overall volume is rising with price.
The trend has further to go before it reaches extreme at the weekly chart time frame.
GDX DAILY CHART
Click chart to enlarge. Chart courtesy of StockCharts.com.
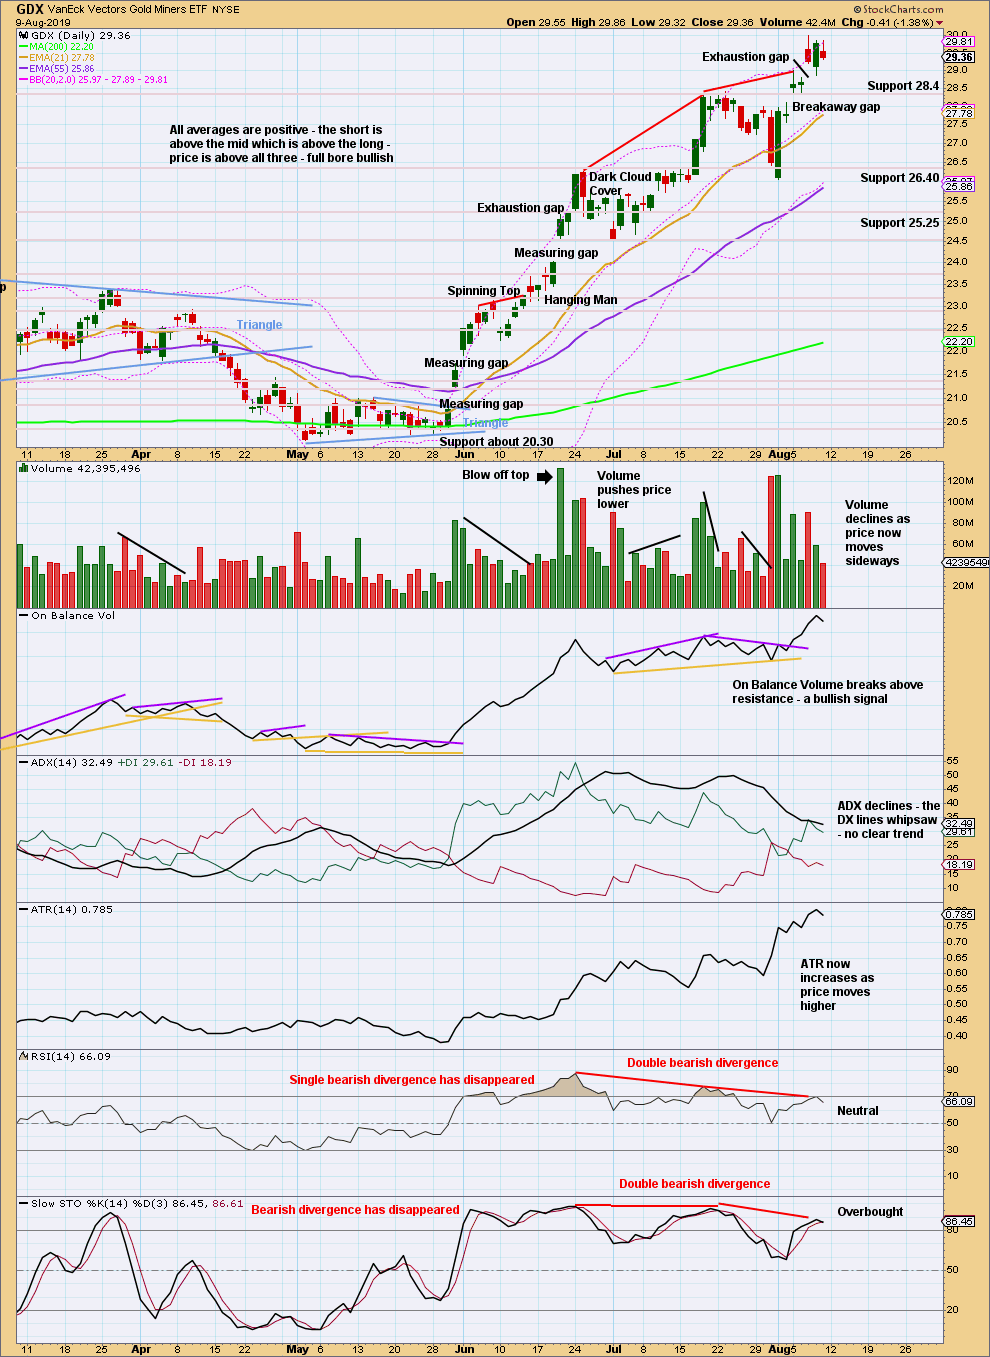
A consolidation may have begun. Look for support about 28.4.
US OIL
Downwards movement for Oil has unfolded as expected for the week.
The alternate Elliott wave count is adjusted slightly.
Summary: A new mid-term target is now at 35.25 for a third wave down. This may exhibit an increase in momentum, and may end with a capitulation spike.
The final target is calculated at 10.72. Confidence in this target may be had if price makes a new low below 50.61.
The bullish alternate wave count would have confidence above 66.59. At that stage, a target for a third wave to end would be at 89.80.
MAIN ELLIOTT WAVE COUNT
MONTHLY CHART
Click chart to enlarge.
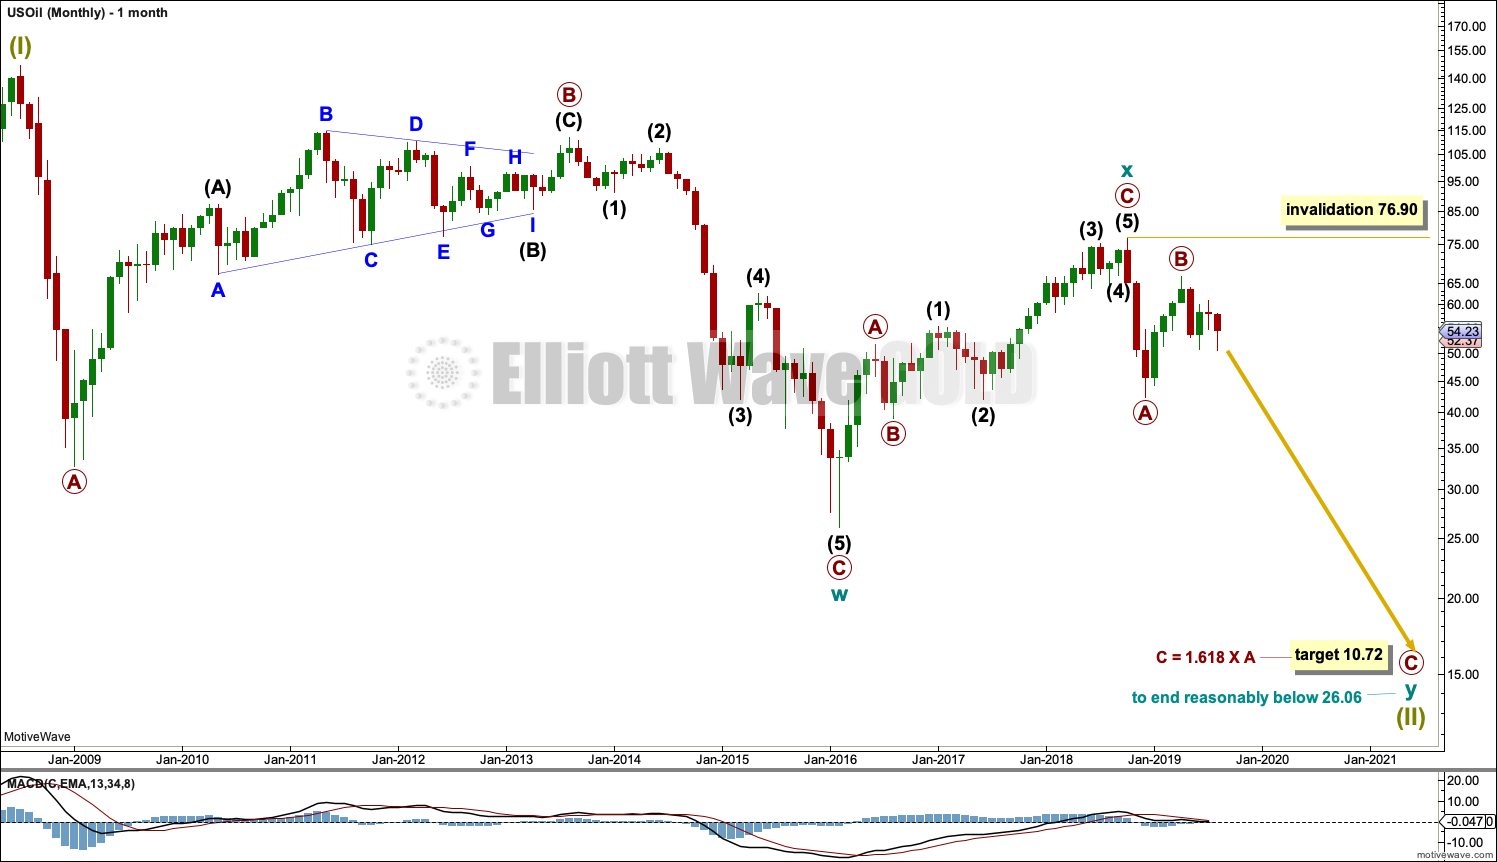
The basic Elliott wave structure is five steps forward and three steps back. This Elliott wave count expects that US Oil is still within a three steps back pattern, which began in July 2008. The Elliott wave count expects that the bear market for US Oil continues.
This Elliott wave corrective structure is a double zigzag, which is a fairly common structure. The correction is labelled Super Cycle wave (II).
The first zigzag in the double is complete and labelled cycle wave y. The double is joined by a three in the opposite direction labelled cycle wave x, which subdivides as a zigzag. The second zigzag in the double may now have begun, labelled cycle wave w.
The purpose of a second zigzag in a double zigzag is to deepen the correction when the first zigzag does not move price deep enough. To achieve this purpose cycle wave y may be expected to move reasonably below the end of cycle wave w at 26.06. The target calculated would see this expectation met.
Cycle wave y is expected to subdivide as a zigzag, which subdivides 5-3-5.
Cycle wave w lasted 7.6 years and cycle wave x lasted 2.7 years. Cycle wave y may be expected to last possibly about a Fibonacci 5 or 8 years.
If it continues higher, then primary wave B may not move beyond the start of primary wave A above 76.90.
WEEKLY CHART
Click chart to enlarge.
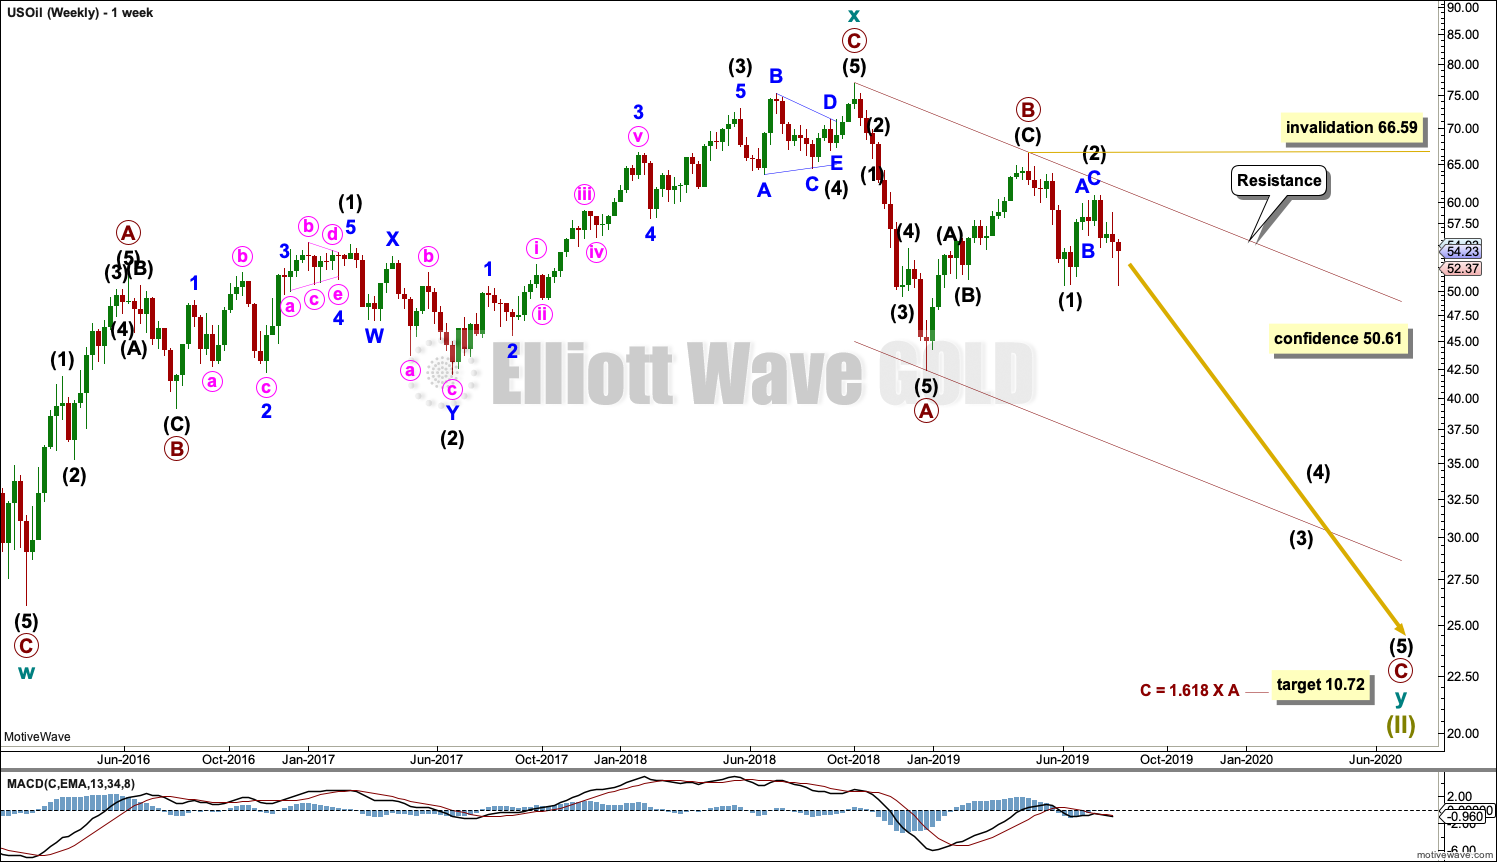
This weekly chart shows all of cycle waves x and y so far.
Cycle wave y is expected to subdivide as a zigzag. A zigzag subdivides 5-3-5. Primary wave A must subdivide as a five wave structure if this wave count is correct.
Primary wave A may be a complete five wave impulse at the last low.
Primary wave B may now be a complete single zigzag at the last high.
Primary wave C may have just begun. Primary wave C must subdivide as a five wave structure.
Primary wave A lasted 12 weeks, just one short of a Fibonacci 13.
Primary wave C may be longer in time as well as price. If cycle wave y lasts a Fibonacci 5 years, then primary wave C within it may take as long as a Fibonacci 233 weeks.
Intermediate wave (1) within primary wave C may be a complete impulse. Intermediate wave (2) may not move beyond the start of intermediate wave (1) above 66.59.
Draw a channel about the zigzag of primary wave y using Elliott’s technique for a correction. Draw the first trend line from the start of primary wave A to the end of primary wave B, then place a parallel copy on the end of primary wave A. The upper edge of this channel may show where bounces along the way down find resistance. The lower edge of the channel may provide support.
DAILY CHART
Click chart to enlarge.
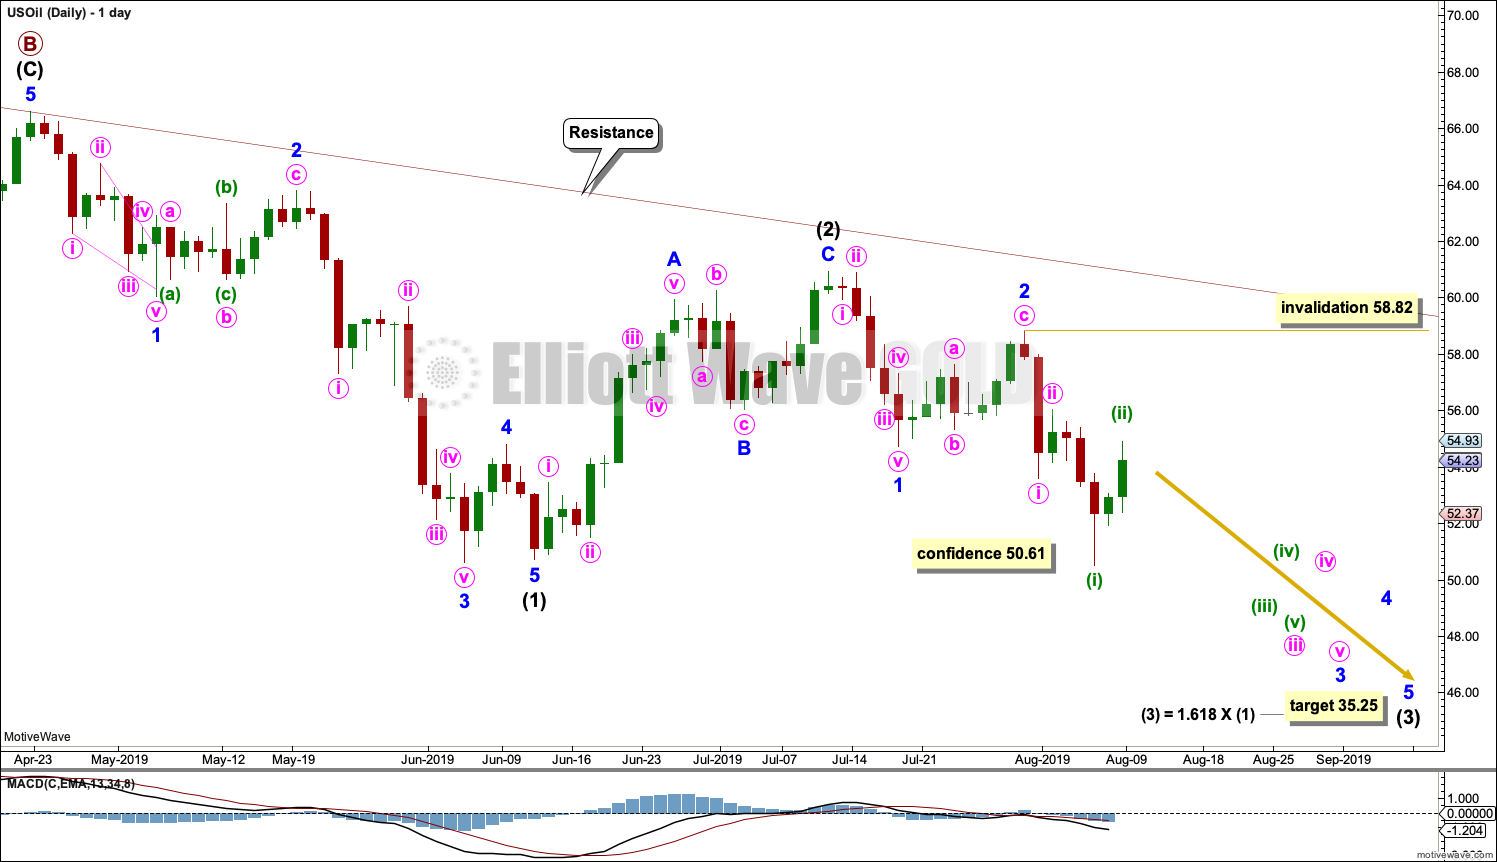
Note that monthly and weekly charts are on a semi-log scale, but this daily chart is on an arithmetic scale. This makes a slight difference to trend channels.
It is possible that intermediate wave (1) is complete. Minor wave 4 for this wave count exhibits some alternation to minor wave 2; minor wave 2 may be a relatively deep zigzag or flat, and minor wave 4 may be a more shallow zigzag.
Minor wave 5 ends with a slight 0.11 truncation. Both Elliott wave counts must now accept this small truncation.
Intermediate wave (2) may also now be complete as a zigzag.
Intermediate wave (3) may only subdivide as an impulse, and it must move below the end of intermediate wave (1). Within intermediate wave (3), minor waves 1 and 2 may now be complete. Within minor wave 3, no second wave correction may move beyond the start of its first wave above 58.82.
The next downwards wave of minor wave 3 within intermediate wave (3) may be expected to exhibit an increase in momentum and an increase in ATR. It may have support from volume pushing price lower. So far it does have some increase in ATR and volume for Wednesday strongly pushed price lower.
ALTERNATE ELLIOTT WAVE COUNT
MONTHLY CHART
Click chart to enlarge.
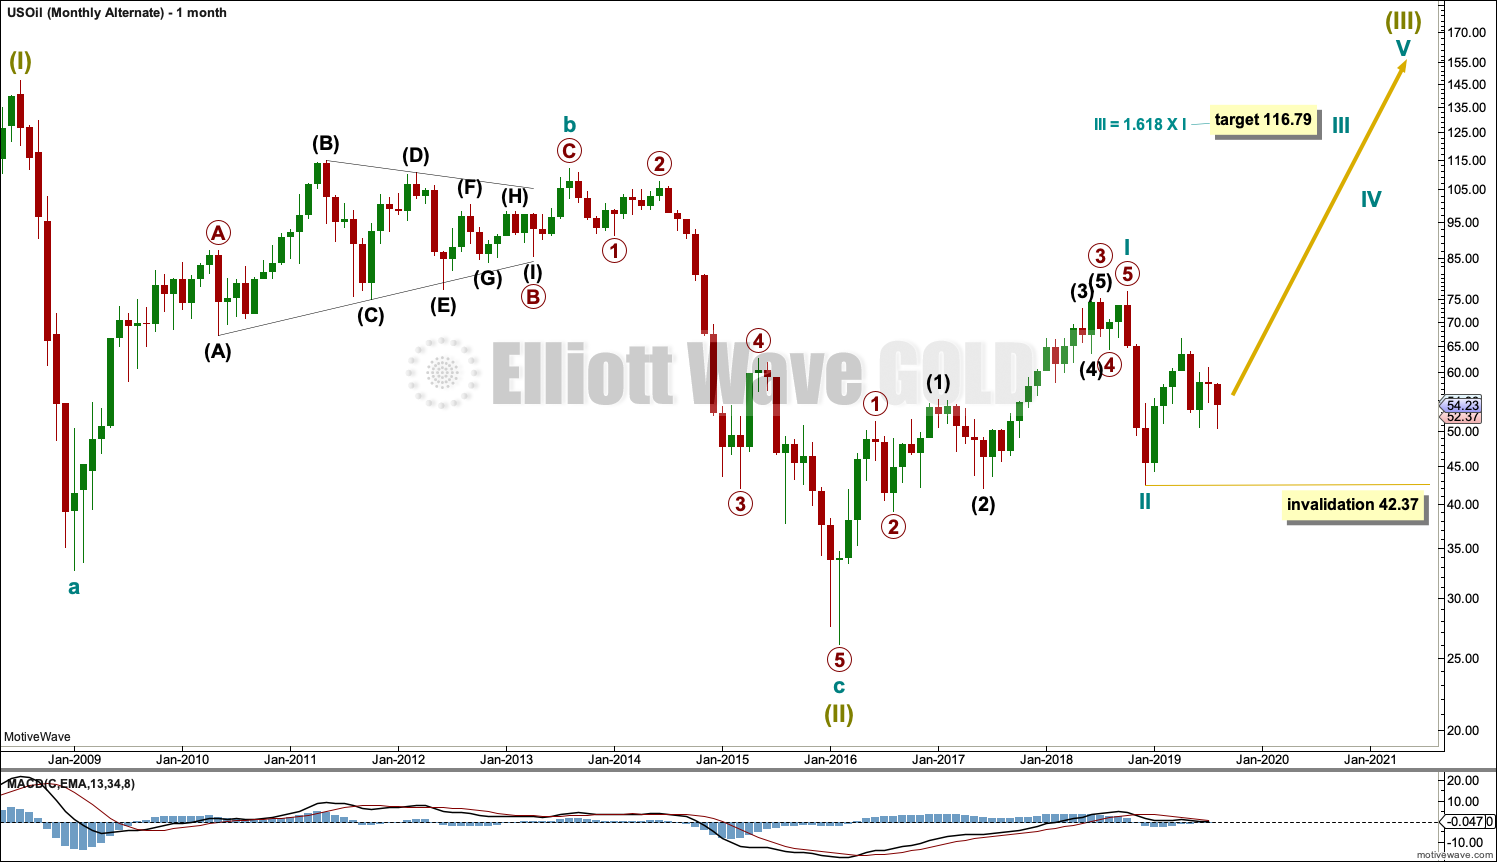
It is possible that the bear market is over for Oil and a new bull market has begun.
For a bullish wave count for Oil, the upwards wave from the major low at 26.06 in February 2016 must be seen as a complete five wave impulse. This is labelled cycle wave I.
Cycle wave II may be a complete zigzag at 0.679 the depth of cycle wave I.
A target is calculated for cycle wave III to reach a common Fibonacci ratio to cycle wave I.
Within cycle wave III, no second wave correction may move beyond the start of its first wave below 42.37.
WEEKLY CHART
Click chart to enlarge.
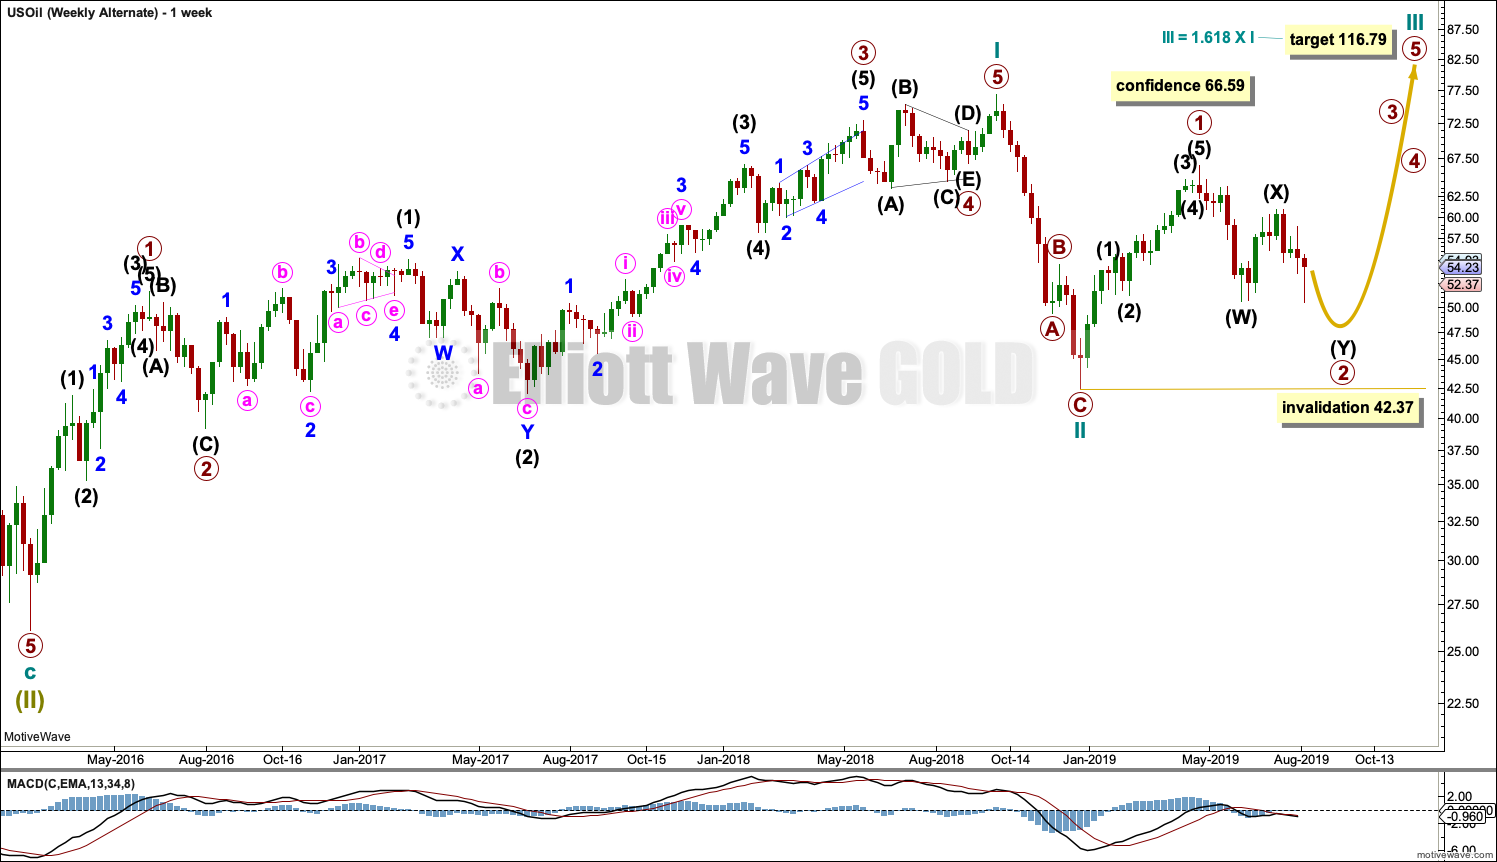
This weekly chart shows detail of cycle wave I as a five wave impulse.
Cycle wave II does look best as a three. This is the only part of this wave count that has a better look than the main wave count, which sees this downwards wave as a five.
Cycle wave III may only subdivide as an impulse. Within cycle wave III, so far primary wave 1 may be complete. Primary wave 2 may be moving lower as a double zigzag. Primary wave 2 may not move beyond the start of primary wave 1 below 42.37.
DAILY CHART
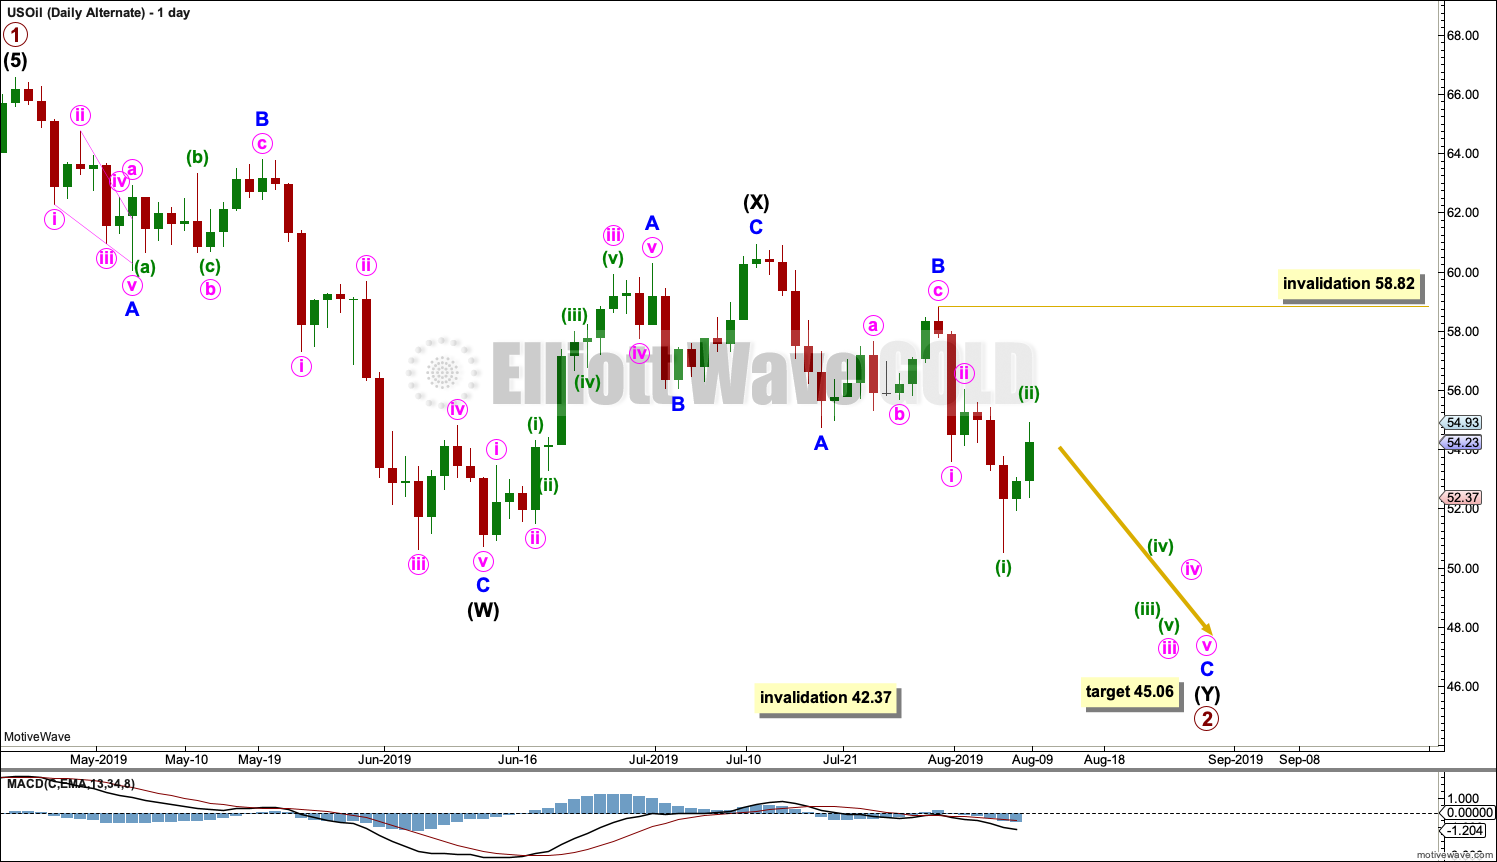
Click chart to enlarge.
Primary wave 2 may be continuing lower as a double zigzag.
The first zigzag in the double would be complete, labelled intermediate wave (W). Within intermediate wave (W), minor wave C ends with a slight truncation for minute wave v. This is acceptable.
The double may be now joined by a complete three in the opposite direction, a zigzag labelled intermediate wave (X).
A second zigzag may now unfold labelled intermediate wave (Y). Within intermediate wave (Y), minor waves A and B may be complete. Minor wave C must now complete lower as a five wave structure. Within minor wave C, no second wave correction may move beyond the start of its first wave above 58.82.
TECHNICAL ANALYSIS
MONTHLY CHART
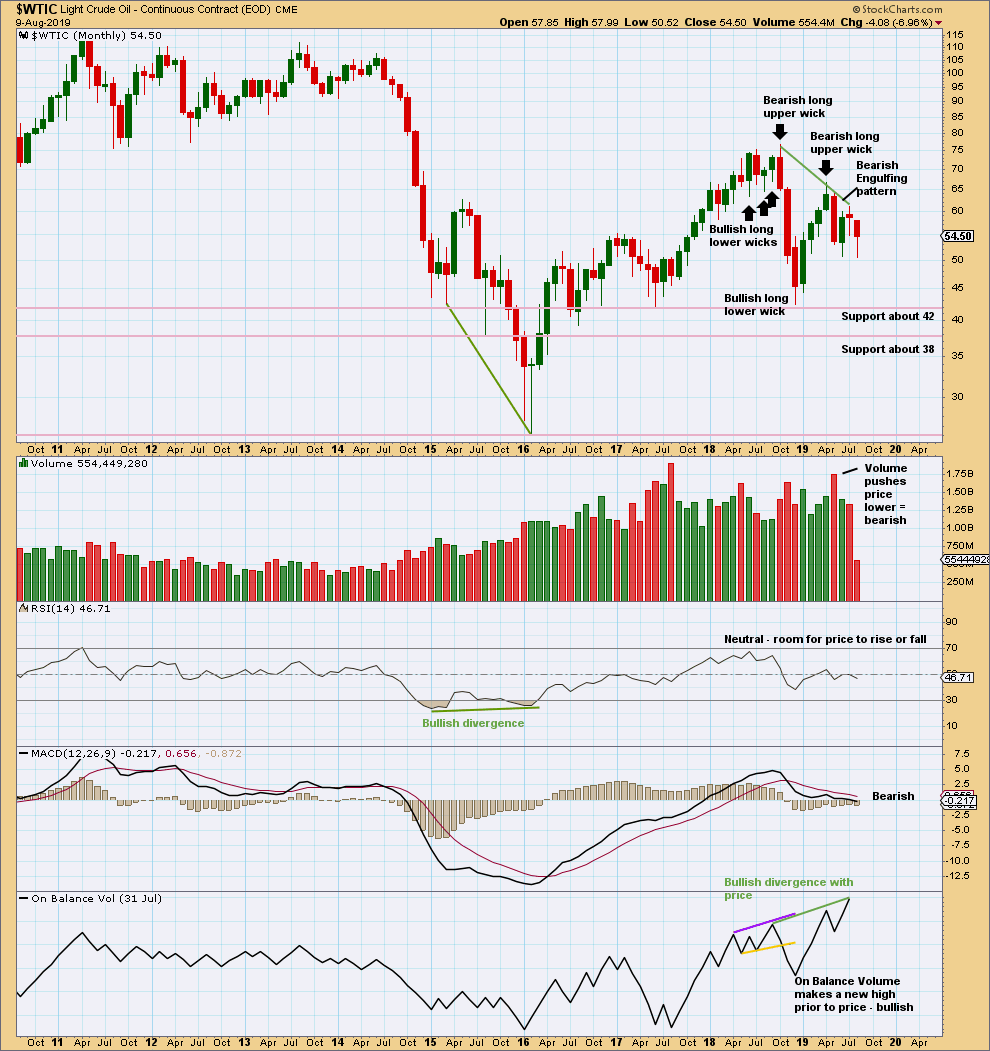
Click chart to enlarge. Chart courtesy of StockCharts.com.
May has closed with a strong Bearish Engulfing candlestick pattern, which has strong support from volume. This supports the main Elliott wave count.
June moved price lower with a lower low and a lower high, but the candlestick closed green and the balance of volume was upwards. Upwards movement within the month did not have support from volume. This also supports the main Elliott wave count.
There is now double bullish divergence between price and On Balance Volume. This supports the alternate Elliott wave count.
WEEKLY CHART
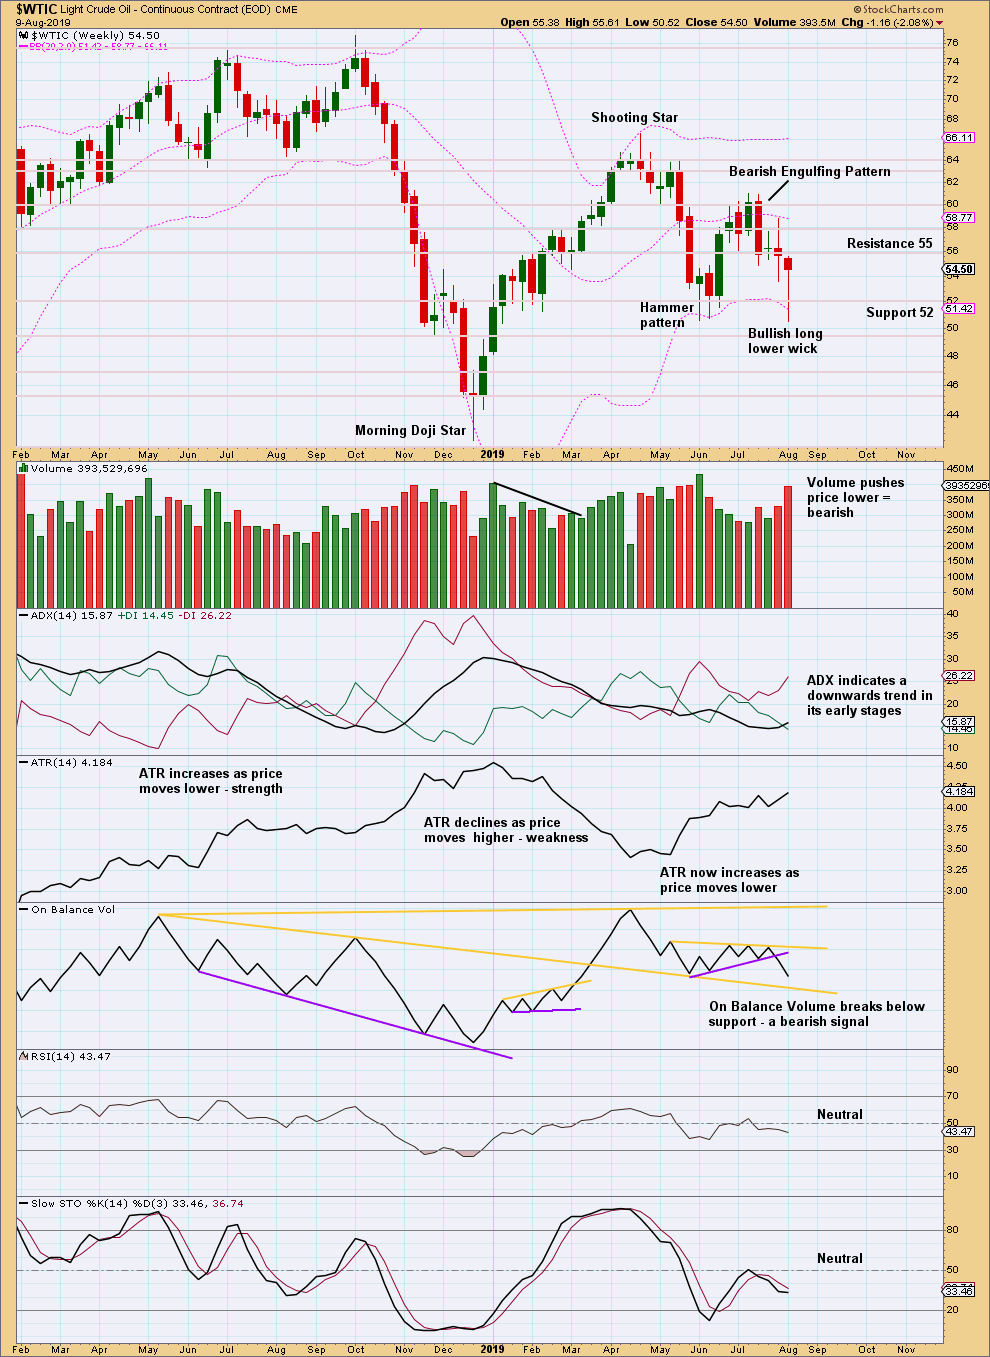
Click chart to enlarge. Chart courtesy of StockCharts.com.
This week has made a slight new low below the prior low of the week beginning 3rd of June. Downwards movement this week has a strong push from volume. The lower wick however is fairly bullish. Look for a possible bounce about here.
There is again a downwards trend in place. ADX is giving the strongest signal it can give.
DAILY CHART
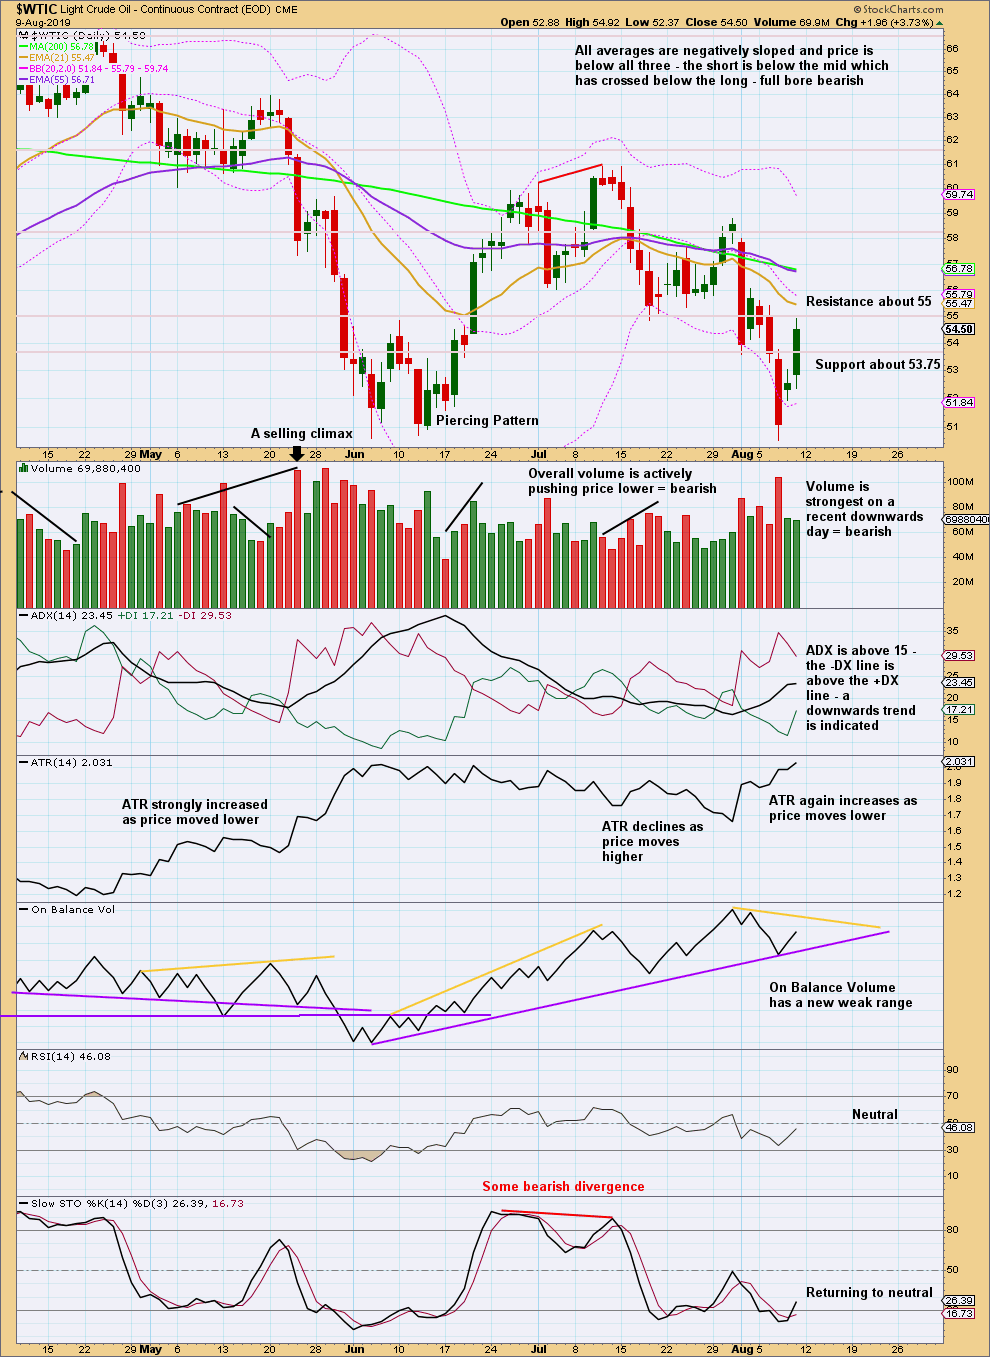
Click chart to enlarge. Chart courtesy of StockCharts.com.
The short-term volume profile remains bearish. ATR continues to support the main Elliott wave count. ADX indicates there is still a downwards trend in place at the daily chart level as well as weekly.
This chart is bearish and supports the main Elliott wave count.
—
Always practice good risk management as the most important aspect of trading. Always trade with stops and invest only 1-5% of equity on any one trade. Failure to manage risk is the most common mistake new traders make.
Lara
In your weekly update this weekend, I wonder if you could address the possibility that the more bearish daily wave count for the S&P where primary 2 is incomplete, could primary 2 be a combination with two corrective structures where the first corrective structure is a zigzag or a double zigzag and the second corrective structure is a contracting triangle. I know from your previous analyses over the last few months that triangles are hard to call but market action since late July to now sure looks like a contracting triangle.
Thanks for all you do
Rich
I’m looking at the possibility it just doesn’t look right. Wave X would be unusually long in duration and length to wave W, and the triangle looks way too brief for wave Y. Wave Y as a triangle would be almost complete and much quicker than the zigzag for wave W. Triangles are almost always more time consuming structures than zigzags.
I know that technically it fits. But it just looks all kinds of wrong. I don’t want to publish a chart like that.
Hi Lara!!!
When you mention confidence target on your chart analysis. Does it simply need to break the target, or do we have to have a full Candlestick below that figure?
Thanks,
Larry
It simply needs to make a new high or low below the price point. Any amount at any time frame.
Hi Lara
Can you calculate the target of blue 3 below? (I’m thinking approx 46)
A first target where 3 = 1.618 X 1 would be at 58.80
If price keeps falling through that, the next target would be where 3 = 2.618 X 1 at 42.61
Hi Lara, I assume you mean 48.80 for the first target. If you can please include with the weakly update.
Best regards
Baron
I’m sorry, you’re right. That’s a typo.
I mean 48.80 for minor 3 to = 1.618 X minor 1.
Price is currently still within minor 1 territory. Minor 3 has to move below the end of minor 1. When minor 4 arrives it would very likely be shallow and brief, and it may not move back above 54.74. And so providing a target for minor 3 on the chart may possibly not be the best idea. It may prompt an exit within a profitable trend, focussing too much on smaller noise than the larger picture.
Minor 2 lasted 9 sessions. Minor 4 may be quicker, fourth waves in commodities tend to be quicker than second particularly fourth waves within a third wave impulse one degree higher as this one may be.
US Oil daily chart updated:
Stronger volume for the last downwards day of 14th August supports this wave count.
If this plays out today, then based on the count we are about to head into what looks like 4 embedded 3rd waves. Unleash the Kraken!
S&P500:
Today’s downwards day was another 90% down day. This strongly supports the alternate daily Elliott wave count for the S&P500.
The alternate wave count is now the main wave count. Expect more downwards movement for this market. A new low 2,822.12 would add substantial confidence to this view. The target is 2,663
Hi Lara,
Thanks for the update…
For the S&P 500, is it possible that we are forming an ending diagonal for Cycle wave V and we are finishing Primary wave 4 now with this 90% down day? Does a 90% down day usually ends a leg down?
Thanks in advance and greatly appreciated ,
Mathieu
It’s extremely unlikely that a diagonal would be now within the fourth wave.
The diagonal would have to be contracting because the third wave would be shorter than the first. So that means the fourth wave needs to be shorter than the second and the trend lines need to converge.
At this time the trend lines would barely converge, they’d be very close to parallel. That looks wrong.
The limit for the fourth wave is at 2,802.66. A new low below this price point by any amount at any time frame invalidates the idea.
But…. a diagonal for cycle V could be unfolding. Wave 1 could be a complete zigzag over at the last high. The current downwards movement could be wave 2 and it would be incomplete. There is no divergence with the alternate wave count published in the analysis above in terms of direction or invalidation point, but the target is lower. The chart looks like this:
Thanks Lara, I appreciate it…
Some technical analyst came on CNBC this morning and proposed that we are in an expanded triangle since the top of January 2018…. It make sense since we can see all the nice 3 wave subdivisions in between the A, B, C and D waves…
Did you notice this expanded triangle?
Thanks,
Mathieu
This idea has been suggested by a few members.
I’m not going to publish that because it has an exceptionally low probability.
In my research and now over 11 years of daily experience with EW and this market in particular, expanding triangles are one of the rarest EW structures. I think I have seen only one, once, on the hourly chart for the USD Index.
There are plenty of other EW structures which fit this movement much better. I am bemused as to why people who have a loose understanding of Elliott wave are interviewed and have their wave counts seriously considered. I mean… there’s much better work out there.
MathieuLapensee,
Lara’s monthly chart is the highest probability right now. I look at a chart with between 100 to 160 bars and look for an impulsive look. One example is wave 3 of 3 usually has the highest RSI.
I think the 2nd highest probability is that we are still in wave 4.
If your up for some intensive reading just me know.
Hi Lara,
With regards to oil, this elliott wave count came up on a search. Could it be valid considering yesterdays relatively strong up day?
Cheers,
Jiten
Yes, that’s a valid count. The triangle would be primary wave B on my main Elliott wave count for Oil, and it would be incomplete. It would be a regular barrier triangle.
That idea would see a little more upwards movement to complete wave E of the triangle (as the arrow on your chart posted illustrates). The invalidation point for the count would be at 60.93.
The count would also be invalidated if price makes a new low below 50.53 without moving upwards prior.
Lara
On the S&P the interday low was 2873.14 which was below the level you indicated would support the more bearish alternate. It didn’t close there though.
Can you comment on this? I assume both wave counts at the daily level are still valid
Rganks
Rich
Downwards movement today was fairly weak.
Both wave counts remain valid. For the main wave count for the S&P it remains the main wave count. The bounce up from last weeks low may now be seen as a complete five, that doesn’t have as good a look (it looks more like a three) but it will fit as a five.
So although we have a new low below 2,873.61 indicating the alternate may be correct, it remains an alternate.
The next and stronger price point to differentiate the two ideas is 2,822.12. A new low now below this point would be a stronger indication that the alternate may be correct.
Looks like oil is ready for a spill. I will complete my short oil positions this Monday.
Thanks Lara and have a great week ahead everyone.
Hi Rodney, don’t you find the long lower wick from the week a bit concerning?
Yes and no. How is that for a definitive answer? Yes, in that it might indicate some more upwards movement to start the week. But, no, in that the price of oil is following the expected movement of the main count. We currently have oil in a 1-2 movement at four different degrees. This is what EW traders look for and wait patiently to execute their trades. There is a lot of reward if the count is correct and there is limited risk as a stop can be placed relatively close. This of course is all just my humble opinion and strategy. If I am wrong, I should be out of the position relatively quickly. If correct, I should be able to this position for quite some time (weeks to months) to the $35 per barrel target for a highly profitable trade.
Fair answer, thanks. Gonna spend the morning thinking long and hard about my stops – I find them very hard to place with 3x ETFs.
I closed all my short oil positions this morning because this very strong upwards movement is not what the primary count expected. My stops were not hit. So I got out a bit better than if I waited for the stops. This trade was closed with about a 10% loss. I will be watching for another entry point for a short of oil.
Have a great day every one.
It could just mean that minute ii is going to move higher as an expanded flat. That’s one reason why I left the invalidation point up at the start of minute i.
I’m looking now through a strong move down for Oil back in 2014. I can see a few long lower wicks, particularly early on in a third wave (eg. 30th Jun 2014, 21st July 2014) and yet price fell really hard.
Most of those long lower wicks were “resolved” (when I use that word I’m meaning the bearish implication was followed through by at least a little upwards movement) in one to a very few days.
Lara,
You said “It could just mean that minute ii is going to move higher as an expanded flat. That’s one reason why I left the invalidation point up at the start of minute i.” So, if that plays out then what is now marked Minute ii will become a, what is now marked Minuette i will become b and the other end (if it does not go above 58.82 will become c. Am I correct? In that case will the a,b,c be marked in green as Minuette (a), (b) and (c)?
Thank you.
That is correct.