

S&P 500
For the short term, a small amount of upwards movement to either 2,871 or 2,898 was expected for Friday. Upwards movement reached 2,893.63.
Summary: Two short to mid-term bearish wave counts (main daily chart and alternate daily chart) expect a very little upwards movement to 2,898 but not above 2,943.31 on Monday. Thereafter, the downwards trend may resume with strength. The target is now at 2,663 or within a zone 2,578 to 2,476.
A bullish wave count (second alternate daily chart) requires price to not move below 2,822.12. This bullish wave count expects strong upwards movement to a target at 3,120. This bullish wave count, at the time of publication of this report, now has a little support from classic technical analysis. If Monday completes as an 80% up day, it would become the main wave count again.
The biggest picture, Grand Super Cycle analysis, is here.
Monthly charts were last published here. There are two further alternate monthly charts here.
ELLIOTT WAVE COUNTS
The two weekly Elliott wave counts below will be labelled First and Second. They may be about of even probability. When the fifth wave currently unfolding on weekly charts may be complete, then these two wave counts will diverge on the severity of the expected following bear market. To see an illustration of this future divergence monthly charts should be viewed.
FIRST WAVE COUNT
WEEKLY CHART
Click chart to enlarge.
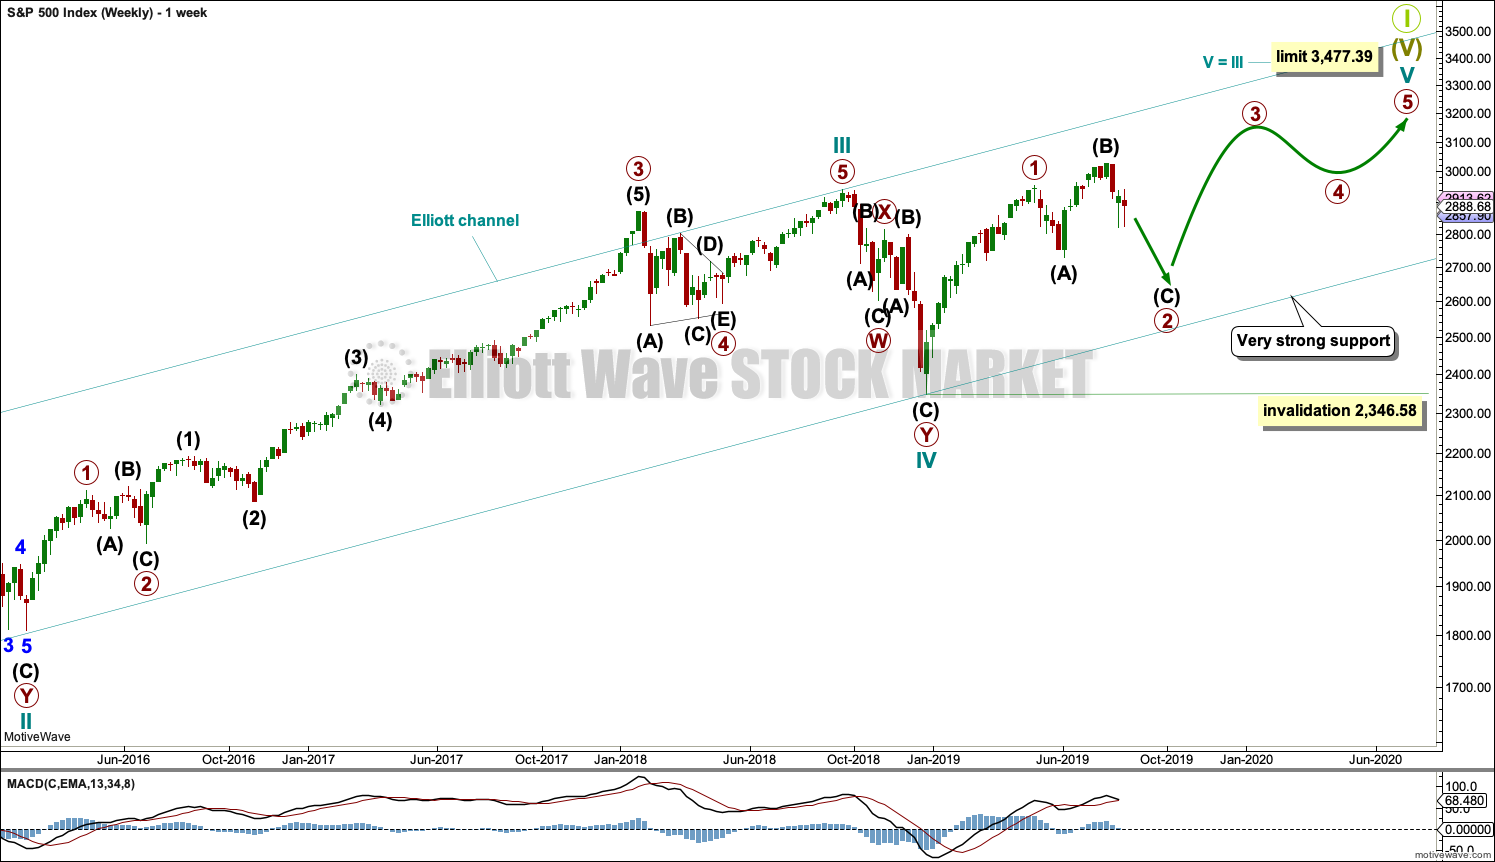
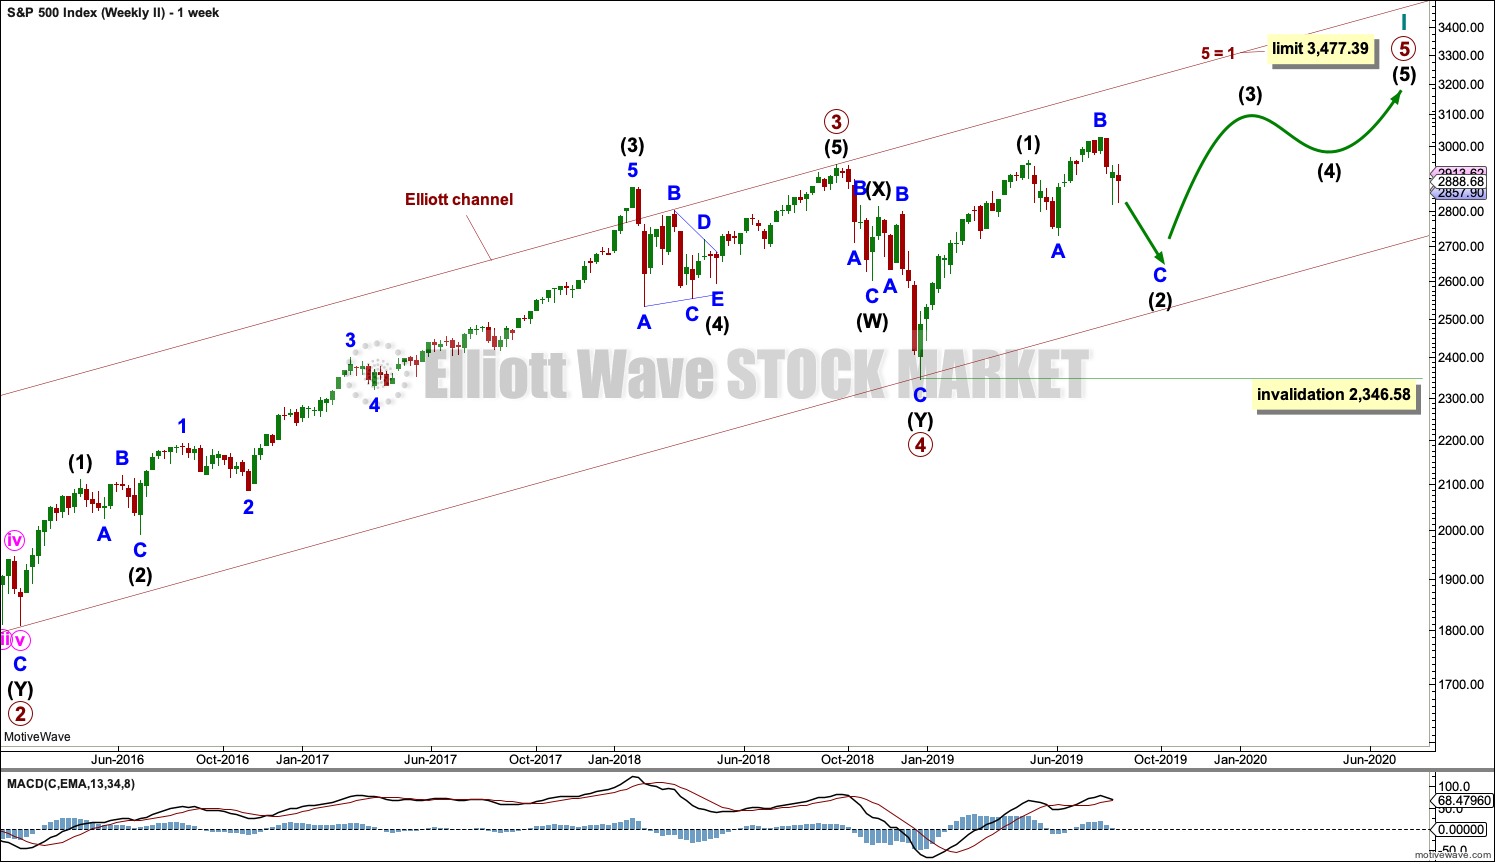
The basic Elliott wave structure consists of a five wave structure up followed by a three wave structure down (for a bull market). This wave count sees the bull market beginning in March 2009 as an incomplete five wave impulse and now within the last fifth wave, which is labelled cycle wave V. This impulse is best viewed on monthly charts. The weekly chart focusses on the end of it.
Elliott wave is fractal. This fifth wave labelled cycle wave V may end a larger fifth wave labelled Super Cycle wave (V), which may end a larger first wave labelled Grand Super Cycle wave I.
The teal Elliott channel is drawn using Elliott’s first technique about the impulse of Super Cycle wave (V). Draw the first trend line from the end of cycle wave I (off to the left of the chart, the weekly candlestick beginning 30th November 2014) to the end of cycle wave III, then place a parallel copy on the end of cycle wave II. This channel perfectly shows where cycle wave IV ended at support. The strongest portion of cycle wave III, the end of primary wave 3, overshoots the upper edge of the channel. This is a typical look for a third wave and suggests the channel is drawn correctly and the way the impulse is counted is correct.
Within Super Cycle wave (V), cycle wave III is shorter than cycle wave I. A core Elliott wave rule states that a third wave may never be the shortest. For this rule to be met in this instance, cycle wave V may not be longer in length than cycle wave III. This limit is at 3,477.39.
Cycle wave V may subdivide either as an impulse or an ending diagonal. Impulses are much more common. This main wave count expects that cycle wave V may be unfolding as an impulse.
The daily charts below will now focus on all of cycle wave V.
In historic analysis, two further monthly charts have been published that do not have a limit to upwards movement and are more bullish than this wave count. Members are encouraged to consider those possibilities (links below summary) alongside the wave counts presented on a daily and weekly basis.
MAIN DAILY CHART
Click chart to enlarge.
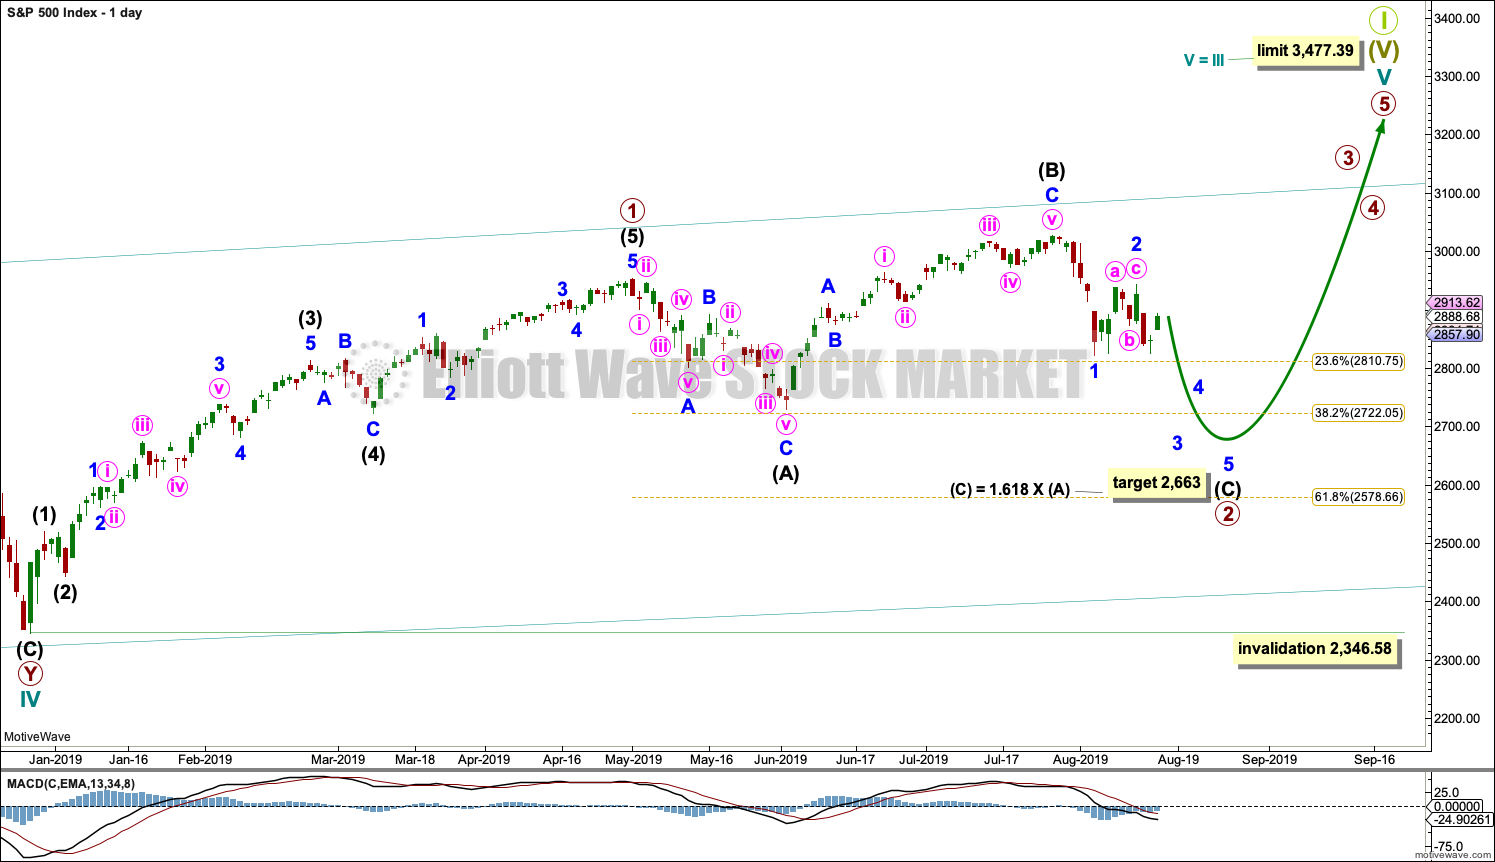
Cycle wave V must subdivide as a five wave motive structure. Within that five wave structure, primary wave 1 only may be complete.
Primary wave 2 may be unfolding as an expanded flat correction. These are reasonably common Elliott wave corrective structures. Flat corrections subdivide 3-3-5. Expanded flats have B waves which are 1.05 or more the length of their A waves. In this example for primary wave 2, intermediate wave (B) is a 1.33 length of intermediate wave (A). The target for intermediate wave (C) expects it to exhibit the most common Fibonacci Ratio to intermediate wave (A) within an expanded flat.
If price reaches the target at 2,663 and keeps falling, then the next target would be the 0.618 Fibonacci Ratio of primary wave 1 at 2,578.66.
Primary wave 2 may not move beyond the start of primary wave 1 below 2,346.58.
ALTERNATE DAILY CHART
Click chart to enlarge.
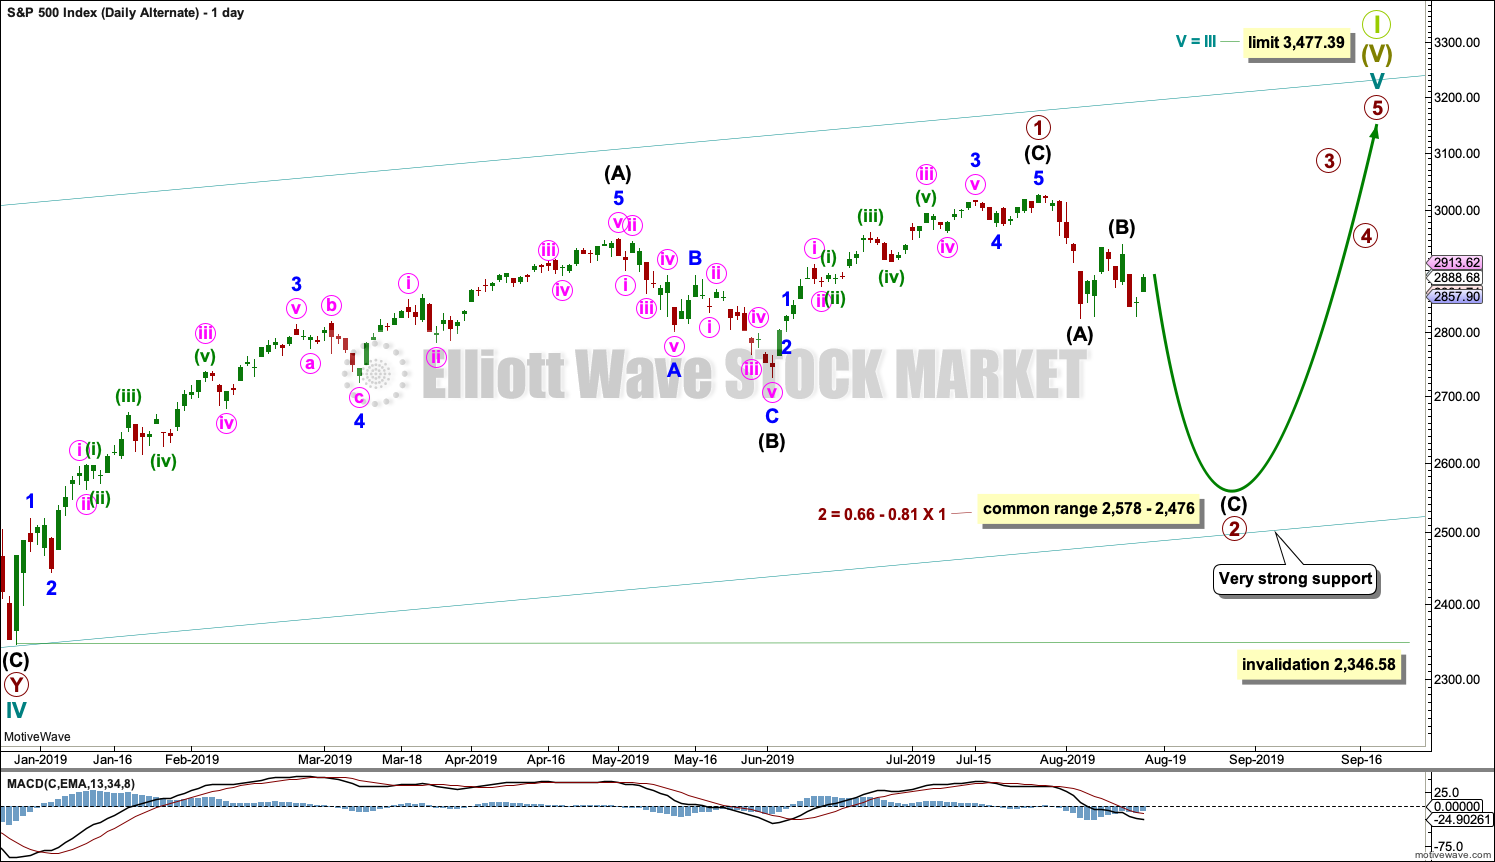
This first alternate daily chart considers the other structural possibility for cycle wave V, that of an ending diagonal.
All sub-waves within an ending diagonal must subdivide as zigzags. Primary wave 1 may have been complete as a zigzag at the last all time high on the 26th of July.
Primary wave 2 may be continuing lower as a zigzag.
Within diagonals, sub-waves 2 and 4 are normally very deep, ending within a range of 0.66 to 0.81 the prior wave. This range for primary wave 2 is from 2,578 to 2,476. Primary wave 2 may possibly come as low as the lower edge of the teal channel, which is copied over from the weekly chart.
Primary wave 2 may not move beyond the start of primary wave 1 below 2,346.58.
SECOND ALTERNATE DAILY CHART
Click chart to enlarge.
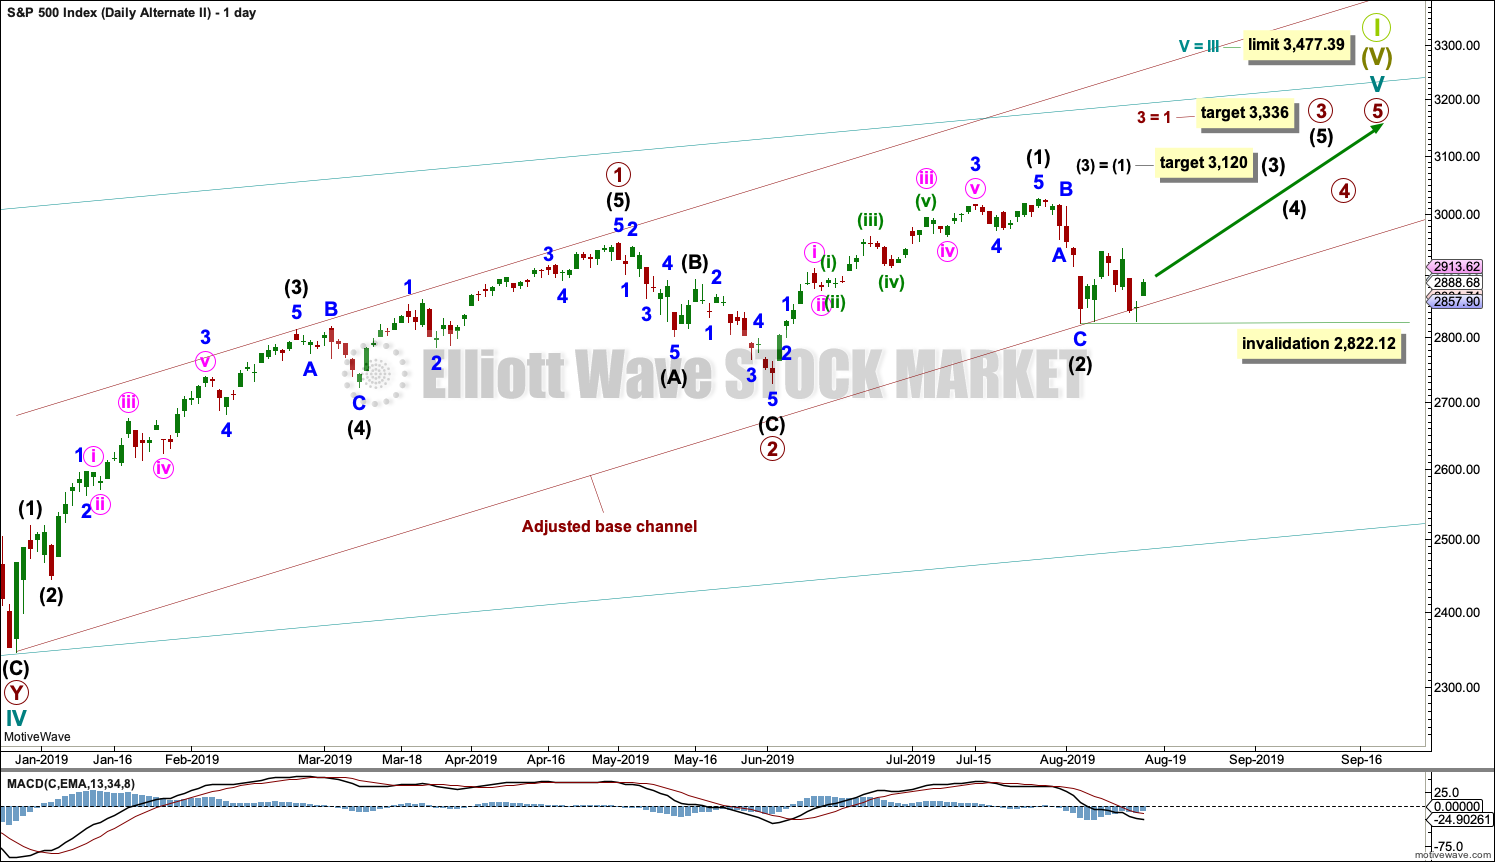
There is now at the end of this week a little support from classic technical analysis for this wave count. If Monday completes an 80% upside day, then it would again become the main wave count.
Cycle wave V is seen as an impulse for this wave count.
Within cycle wave V, primary waves 1 and 2 may be complete. Primary wave 3 may have begun.
Primary wave 3 may only subdivide as an impulse. Within primary wave 3, intermediate waves (1) and (2) may be complete.
Intermediate wave (3) may have begun. Intermediate wave (3) may only subdivide as an impulse. Within the impulse of intermediate wave (3), minor wave 2 may not move beyond the start of minor wave 1 below 2,822.12.
SECOND WAVE COUNT
WEEKLY CHART
Click chart to enlarge.
This weekly chart is almost identical to the first weekly chart, with the sole exception being the degree of labelling.
This weekly chart moves the degree of labelling for the impulse beginning in March 2009 all down one degree. This difference is best viewed on monthly charts.
The impulse is still viewed as nearing an end; a fifth wave is still seen as needing to complete higher. This wave count labels it primary wave 5.
TECHNICAL ANALYSIS
WEEKLY CHART
Click chart to enlarge. Chart courtesy of StockCharts.com.
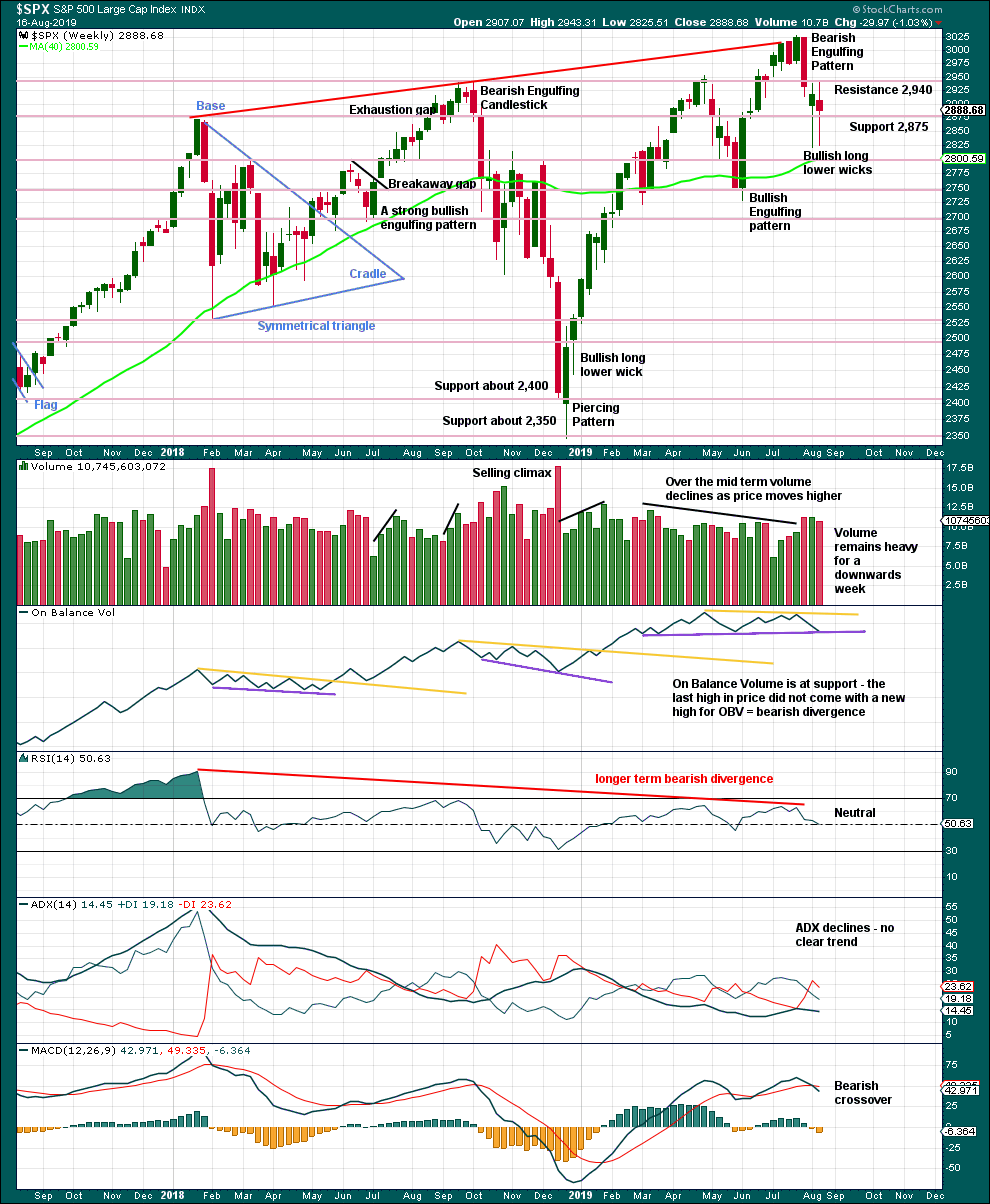
This weekly candlestick completes an upwards week with a slightly higher high and a slightly higher low, but the balance of volume is down and the candlestick is red. Long lower wicks and On Balance Volume at support suggest the downside here may now be limited.
DAILY CHART
Click chart to enlarge. Chart courtesy of StockCharts.com.
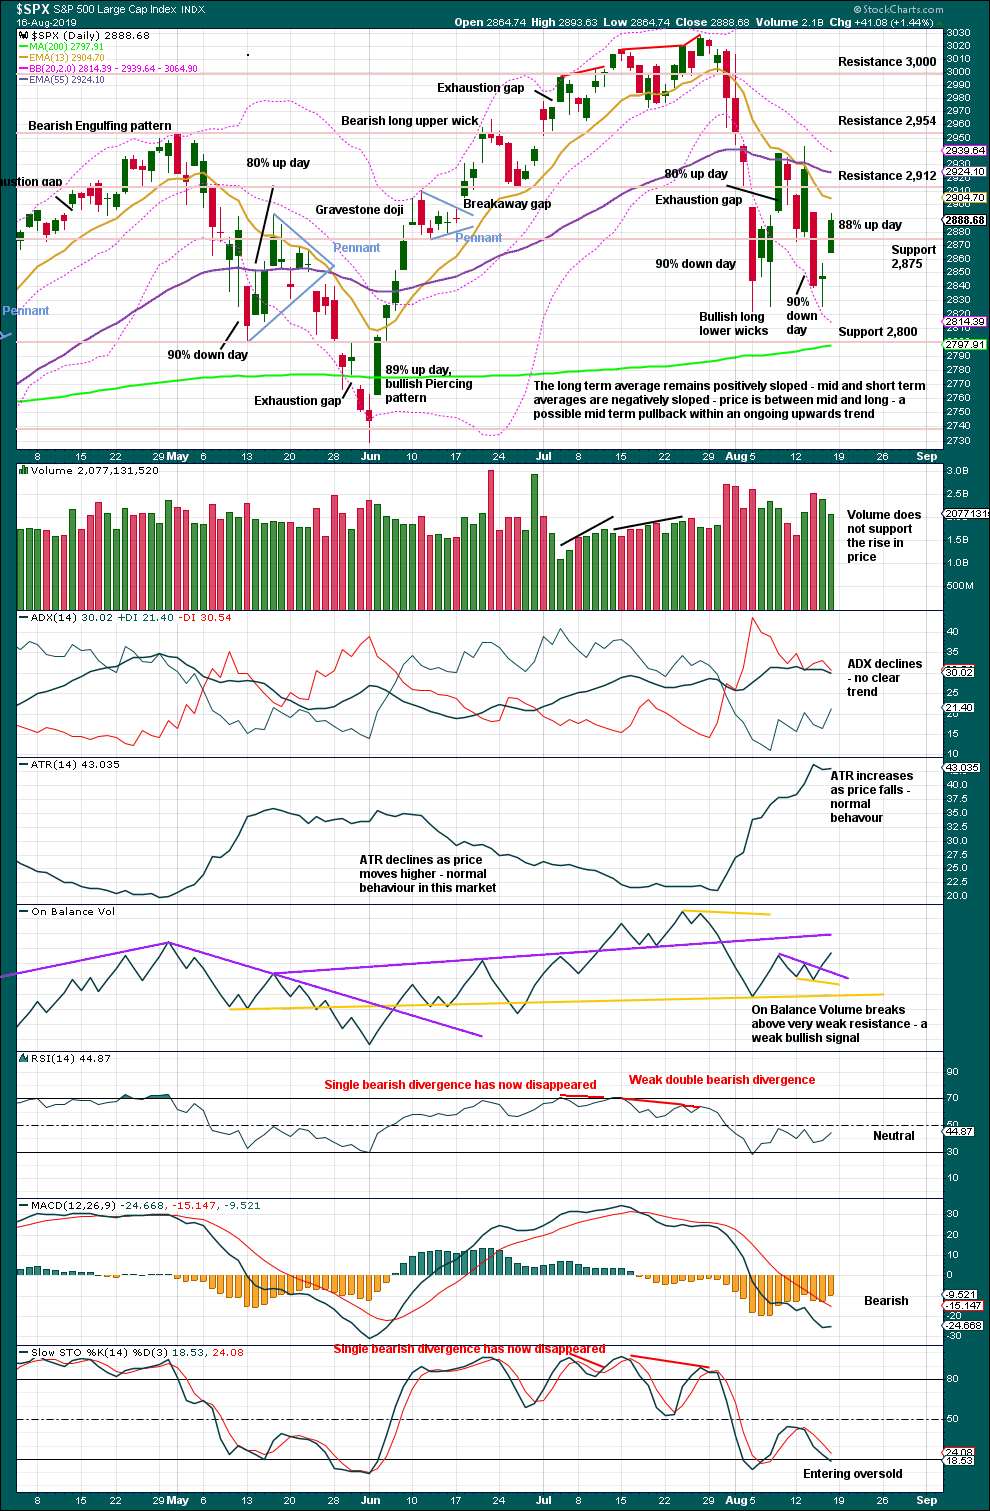
Two 90% down days are now followed by an 88% up day. To see a shift of sentiment from bearish to bullish, and a bottom event, either one 90% up day or two back to back 80% up days within five days of the last 90% down day should be seen.
Thus, if Monday prints an 80% up day (or better), then this condition would be met and a bullish outlook would be warranted.
However, with the data in hand at the close of the week, the condition is not yet met and a bearish outlook prevails.
Neither RSI nor Stochastics are oversold. There is room for price to continue falling. Look for next support about 2,800.
The signal from On Balance Volume is very weak because the resistance line breached is only just able to be drawn, is not long held, not often tested and has some slope.
BREADTH – AD LINE
WEEKLY CHART
Click chart to enlarge. Chart courtesy of StockCharts.com. So that colour blind members are included, bearish signals
will be noted with blue and bullish signals with yellow.
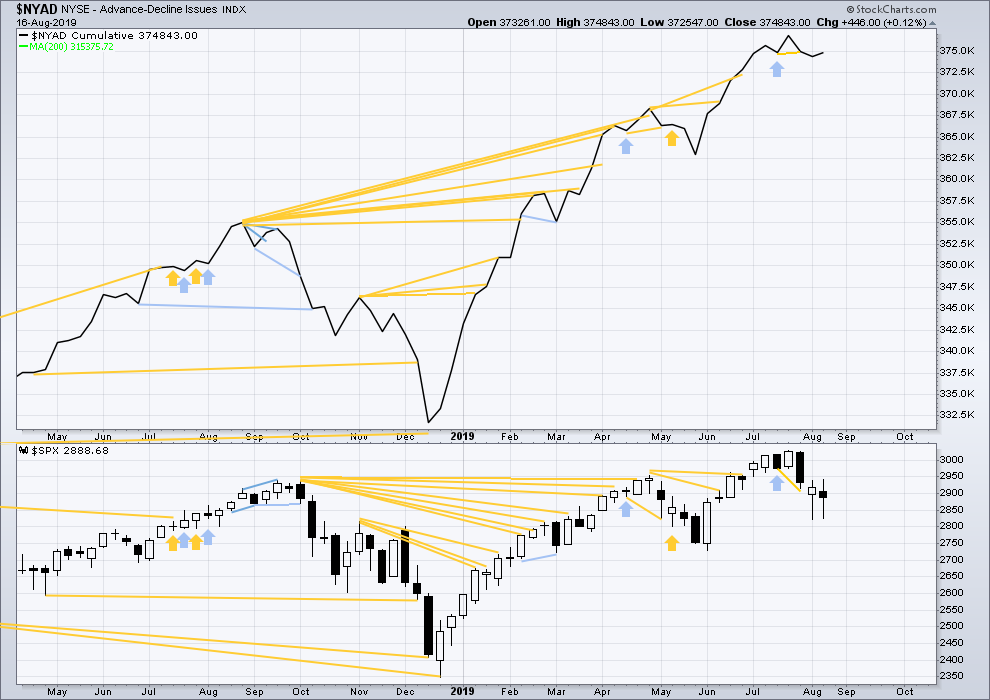
Bear markets from the Great Depression and onwards have been preceded by an average minimum of 4 months divergence between price and the AD line with only two exceptions in 1946 and 1976. With the AD line making new all time highs again this week, the end of this bull market and the start of a new bear market is very likely a minimum of 4 months away, which is mid November 2019.
In all bear markets in the last 90 years there is some positive correlation (0.6022) between the length of bearish divergence and the depth of the following bear market. No to little divergence is correlated with more shallow bear markets. Longer divergence is correlated with deeper bear markets.
If a bear market does develop here, it comes after no bearish divergence. It would therefore more likely be shallow.
This week both the AD line and price have moved slightly higher. There is no new short-term divergence.
DAILY CHART
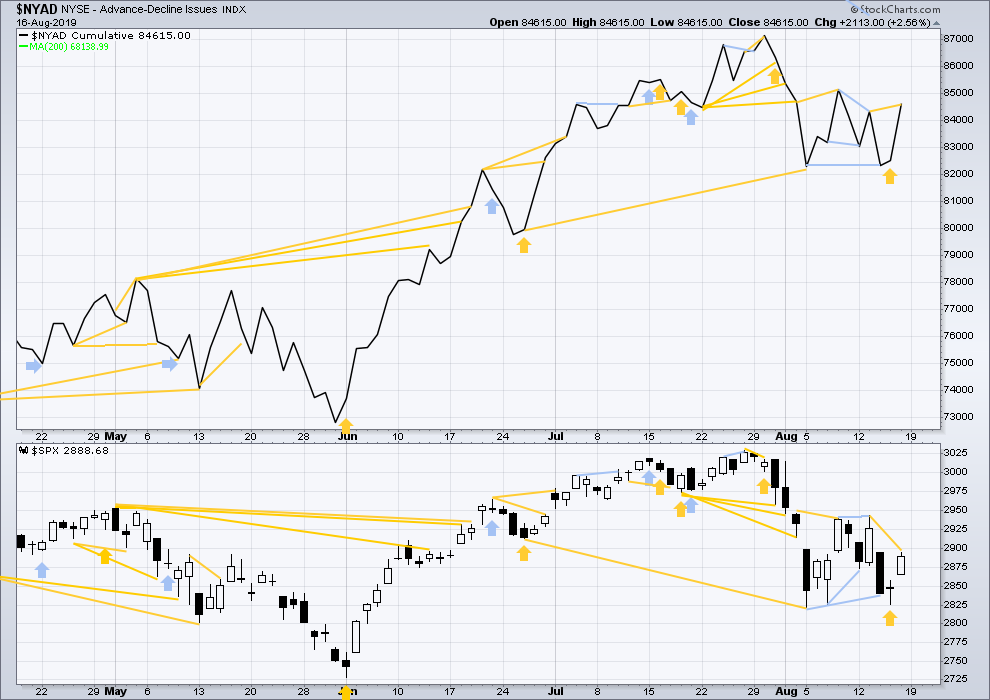
Click chart to enlarge. Chart courtesy of StockCharts.com. So that colour blind members are included, bearish signals
will be noted with blue and bullish signals with yellow.
Breadth should be read as a leading indicator.
On Friday the AD line has made a new short-term swing high above the prior high three sessions prior, but price has not. This divergence is bullish for the short term and offers a little support to the second alternate Elliott wave count.
VOLATILITY – INVERTED VIX CHART
WEEKLY CHART
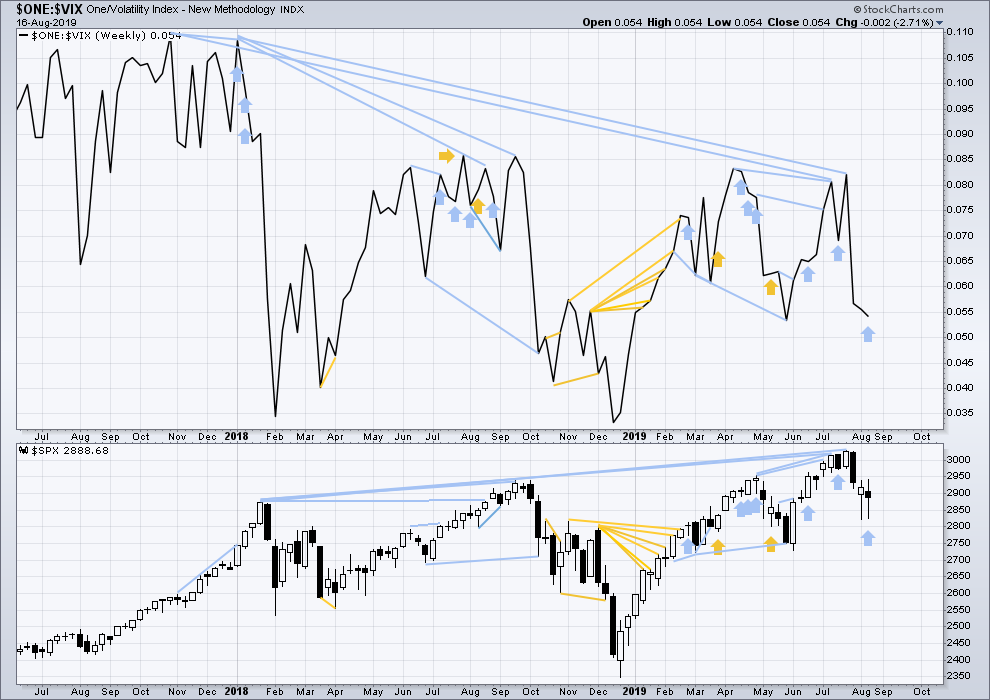
Click chart to enlarge. Chart courtesy of StockCharts.com. So that colour blind members are included, bearish signals
will be noted with blue and bullish signals with yellow.
The all time high for inverted VIX (which is the same as the low for VIX) was on 30th October 2017. There is now nearly one year and nine months of bearish divergence between price and inverted VIX.
The rise in price is not coming with a normal corresponding decline in VIX; VIX remains elevated. This long-term divergence is bearish and may yet develop further as the bull market matures.
This divergence may be an early warning, a part of the process of a top developing that may take years. It may not be useful in timing a trend change.
This week price has moved very slightly higher although the candlestick closed red, but inverted VIX has moved a little lower. This divergence is bearish, but it is contrary to the AD line and shall not be given weight in this analysis.
DAILY CHART
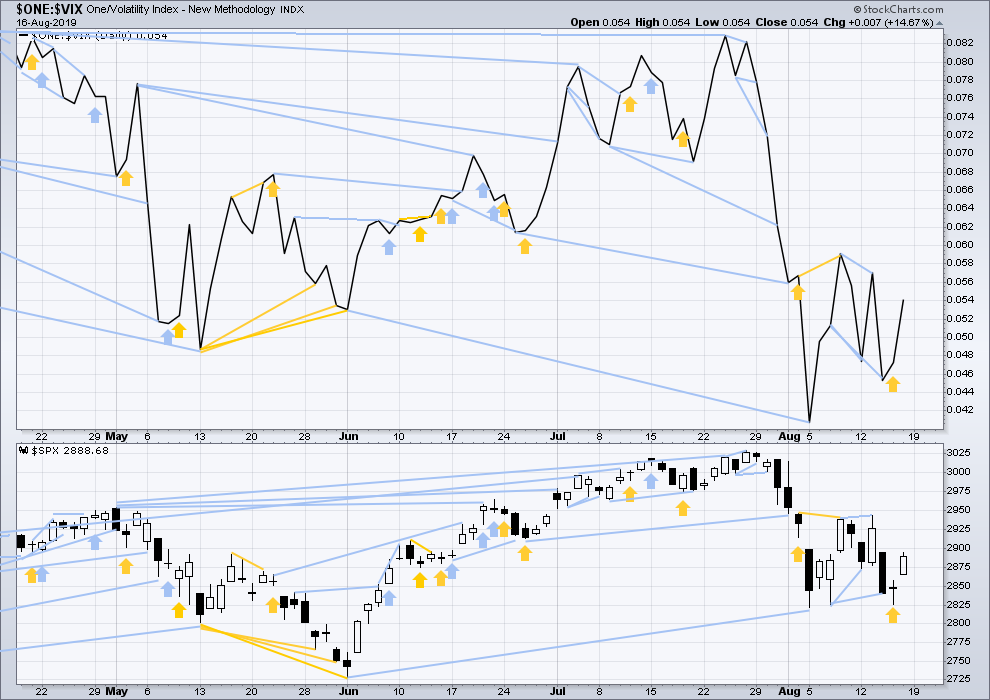
Click chart to enlarge. Chart courtesy of StockCharts.com. So that colour blind members are included, bearish signals
will be noted with blue and bullish signals with yellow.
On Friday both inverted VIX and price have moved higher. There is no new short-term divergence.
DOW THEORY
Dow Theory confirmed a bear market in December 2018. This does not necessarily mean a bear market at Grand Super Cycle degree though; Dow Theory makes no comment on Elliott wave counts. On the 25th of August 2015 Dow Theory also confirmed a bear market. The Elliott wave count sees that as part of cycle wave II. After Dow Theory confirmation of a bear market in August 2015, price went on to make new all time highs and the bull market continued.
DJIA: 23,344.52 – a close on the 19th of December at 23,284.97 confirms a bear market.
DJT: 9,806.79 – price has closed below this point on the 13th of December.
S&P500: 2,532.69 – a close on the 19th of December at 2,506.96 provides support to a bear market conclusion.
Nasdaq: 6,630.67 – a close on the 19th of December at 6,618.86 provides support to a bear market conclusion.
With all the indices having moved higher following a Dow Theory bear market confirmation, Dow Theory would confirm a bull market if the following highs are made:
DJIA: 26,951.81 – a close above this point has been made on the 3rd of July 2019.
DJT: 11,623.58 – to date DJT has failed to confirm an ongoing bull market.
S&P500: 2,940.91 – a close above this point was made on the 29th of April 2019.
Nasdaq: 8,133.30 – a close above this point was made on the 26th of April 2019.
GOLD
Upwards movement for the week leaves three Elliott wave counts valid.
Summary: There is an upwards trend in place that is very extreme. Conditions are overbought. This can continue while price moves a considerable distance further, or a trend change may occur at any time now. Caution is warranted. Risk management is essential.
The bullish Elliott wave count expects a large interruption to the trend may now have begun. It may last about four to ten weeks and may end about 1,431.
The bearish Elliott wave count expects the upwards trend may now have ended. The first confidence point is at 1,401.30. Thereafter, a new low below 1,346.45 would see the bullish wave count discarded and a bearish wave count the only remaining count.
A new high above 1,533.34 would leave the new bearish alternate and the bullish wave counts valid.
Grand SuperCycle analysis is here.
Monthly charts were last published here with video here.
BEARISH ELLIOTT WAVE COUNT
WEEKLY CHART
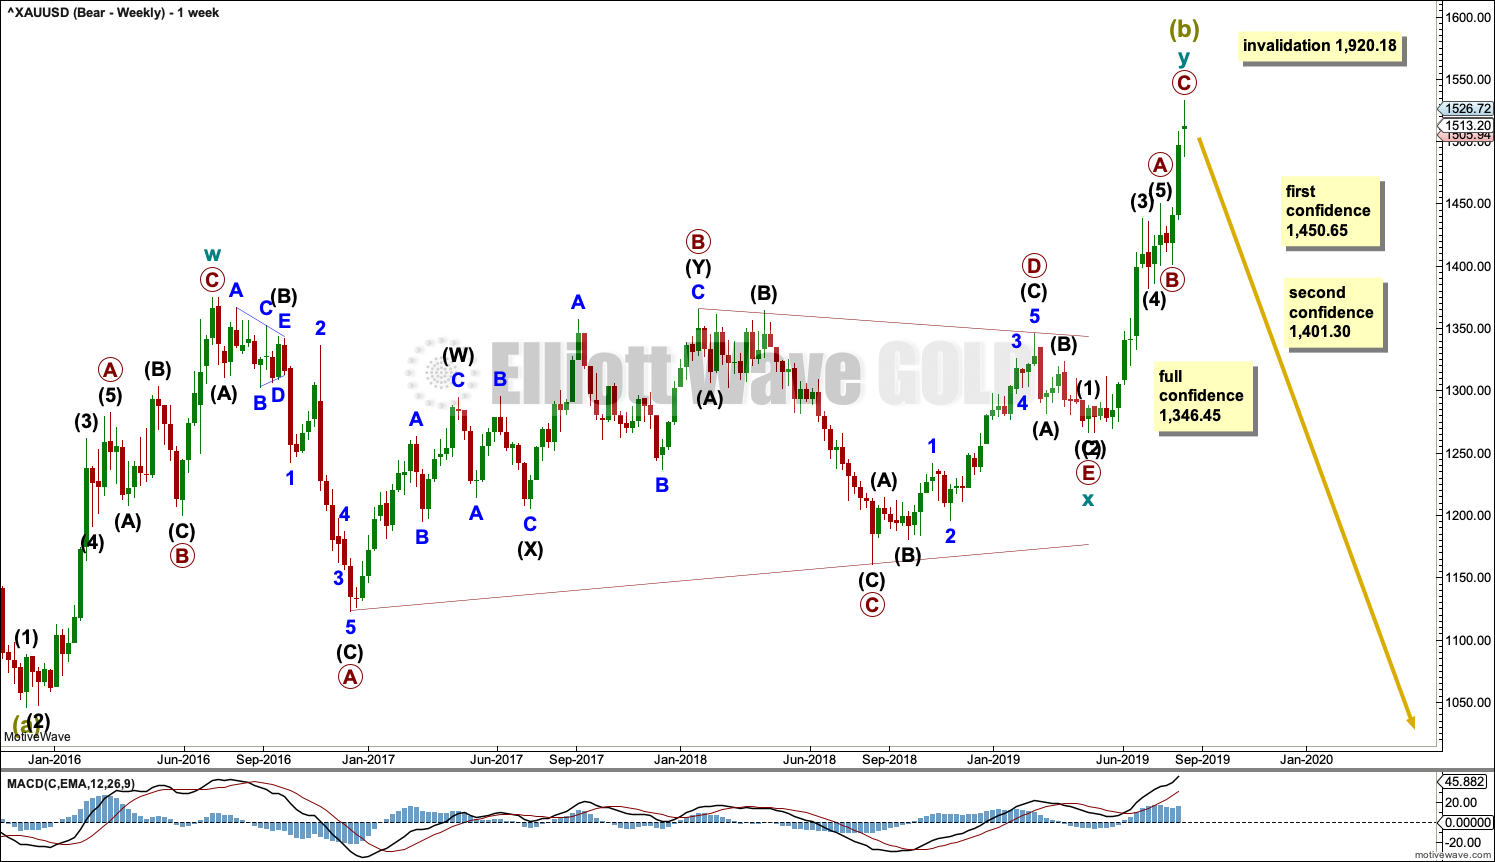
Click chart to enlarge.
It is now possible that Super Cycle wave (b) is a complete double zigzag.
The first zigzag in the double is labelled cycle wave w. The double is joined by a three in the opposite direction, a triangle labelled cycle wave x. The second zigzag in the double is labelled cycle wave y.
Cycle wave y now fits as a complete zigzag.
The purpose of the second zigzag in a double is to deepen the correction. Cycle wave y has achieved this purpose.
A new low below 1,450.65 would invalidate the new bearish alternate below and add a little confidence to this wave count.
1,401.30 is the start of primary wave C. A new low below this point could not be a second wave correction within primary wave C, so at that stage primary wave C would be confirmed as over.
A new low below 1,346.45 would invalidate the bullish wave count below and add confidence to a bearish wave count.
Two daily charts below look at the zigzag of cycle wave y in two different ways.
DAILY CHART
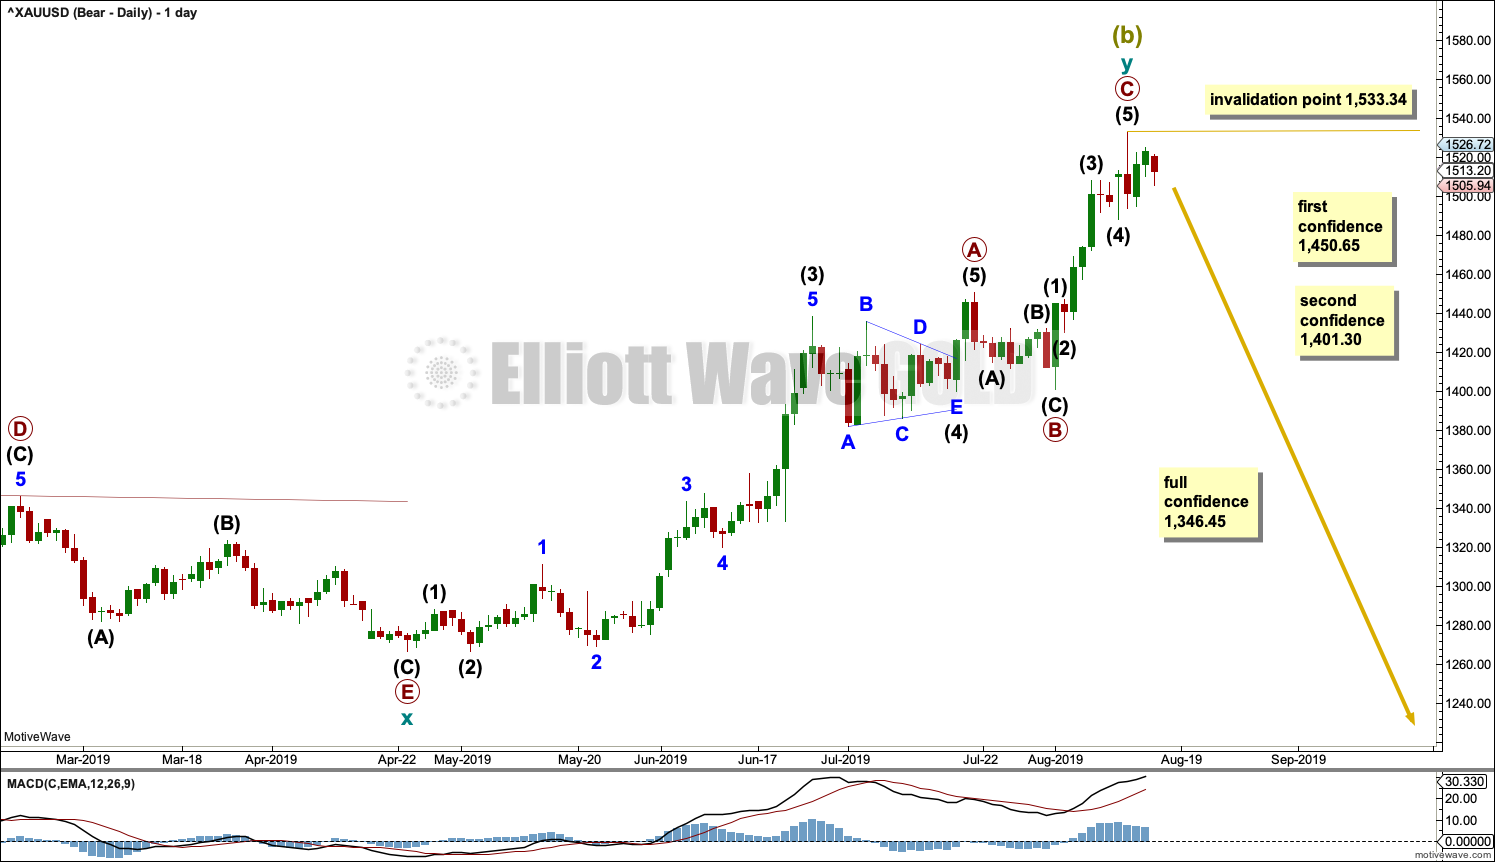
Click chart to enlarge.
Primary wave C may now be a complete five wave structure.
If there has been a trend change, then downwards movement should unfold as a five wave structure from the high. Downwards movement should exhibit strength in either rising ATR or volume.
No second wave correction within a new downwards trend may move beyond the start of its first wave above 1,533.34.
ALTERNATE DAILY CHART
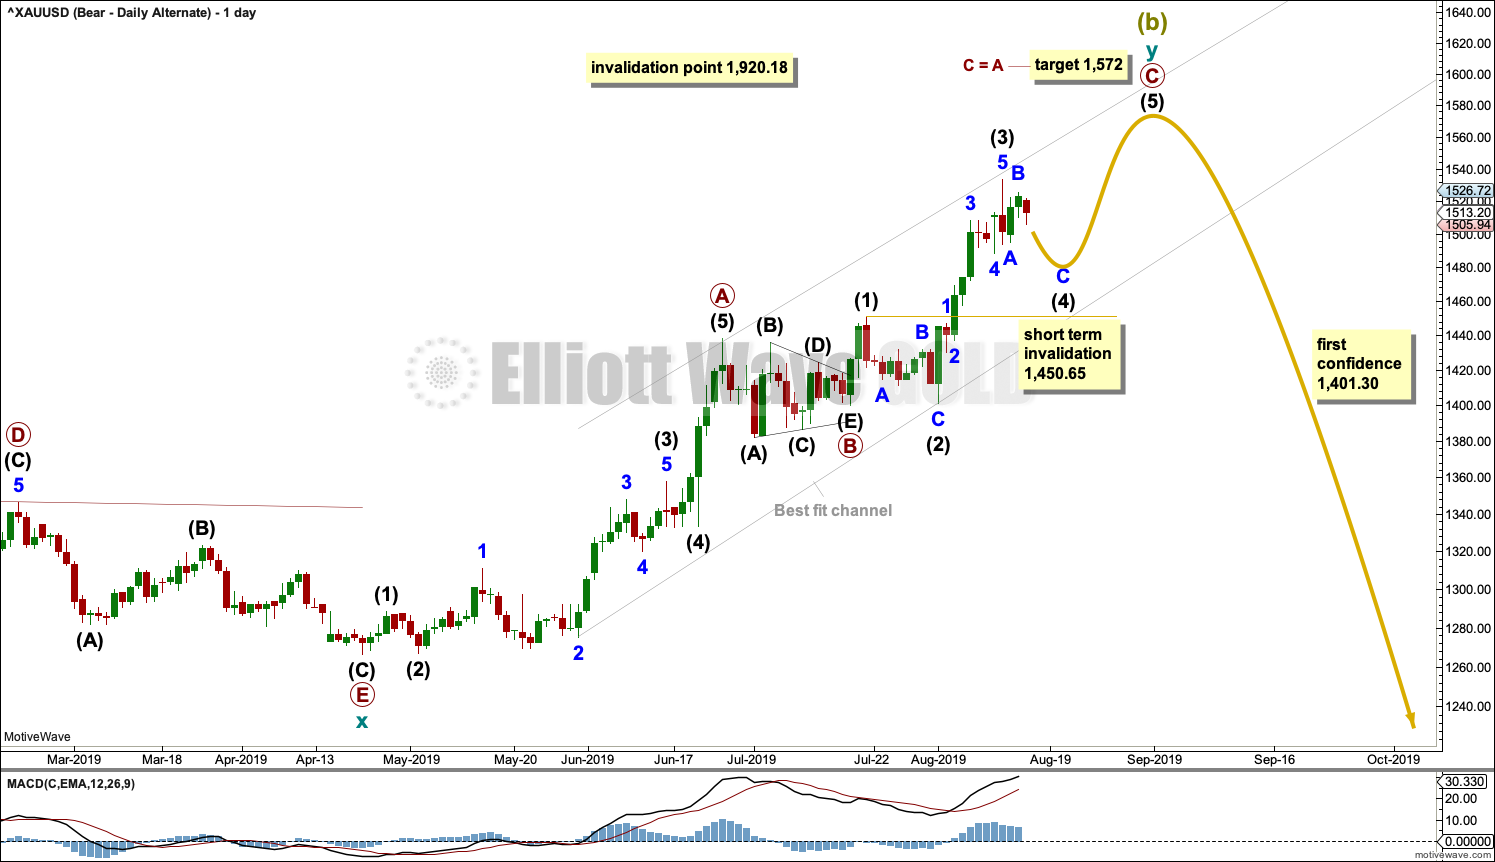
Click chart to enlarge.
Both bearish wave counts at the daily and weekly chart level today see cycle wave y beginning at the same point at 1,266.61 on the 24rd of April 2019. Thereafter, this alternate wave count looks at the zigzag of cycle wave y differently.
Within cycle wave y, the triangle that ended on the 17th of July may have been primary wave B. Primary wave C may have begun there. Primary wave C must subdivide as a five wave structure; it may be completing as an impulse.
Intermediate waves (1), (2) and (3) within the impulse of primary wave C may be complete. Intermediate wave (3) for this wave count is just 0.33 longer than 2.618 the length of intermediate wave (1).
Intermediate wave (4) may be unfolding sideways as a small consolidation to continue for a few more days. Intermediate wave (2) completed as a deep 0.98 zigzag lasting 9 sessions. Intermediate wave (4) may exhibit alternation as a flat, triangle or combination. Within those structural possibilities, any one of an expanded flat, running triangle or combination may include a new high above 1,533.34. A new high above 1,533.34 would invalidate the first bearish wave count and leave this alternate valid.
Intermediate wave (4) may not move into intermediate wave (1) price territory below 1,450.65.
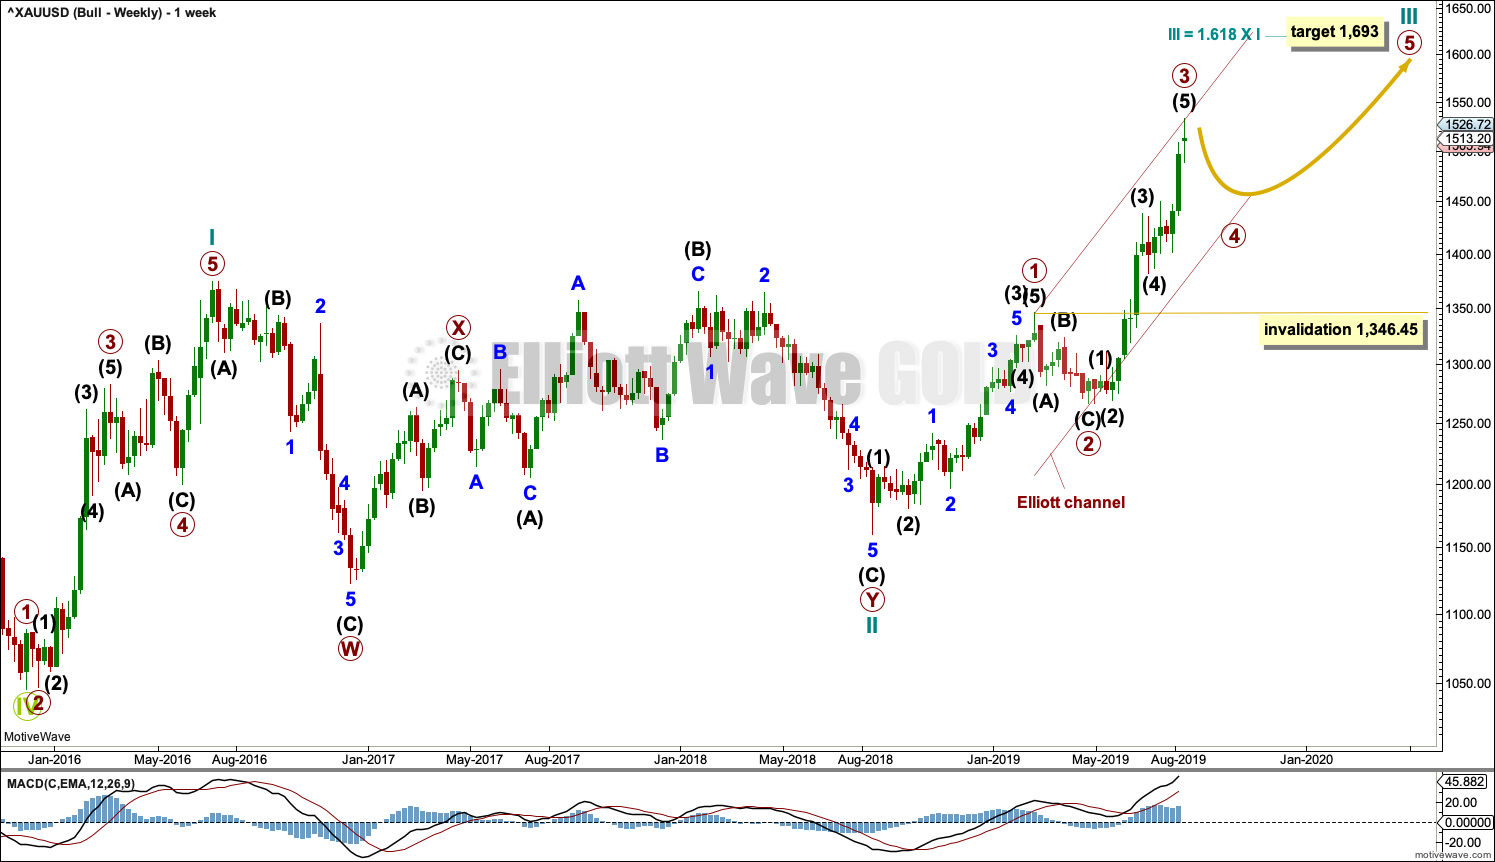
BULLISH ELLIOTT WAVE COUNT
WEEKLY CHART
Click chart to enlarge.
This wave count sees the the bear market complete at the last major low for Gold in November 2015.
If Gold is in a new bull market, then it should begin with a five wave structure upwards on the weekly chart. However, the biggest problem with this wave count is the structure labelled cycle wave I because this wave count must see it as a five wave structure, but it looks more like a three wave structure.
Commodities often exhibit swift strong fifth waves that force the fourth wave corrections coming just prior and just after to be more brief and shallow than their counterpart second waves. It is unusual for a commodity to exhibit a quick second wave and a more time consuming fourth wave, and this is how cycle wave I is labelled. This wave count still suffers from this very substantial problem, and for this reason the bearish wave count is still considered because it has a better fit in terms of Elliott wave structure.
Cycle wave II subdivides well as a double combination: zigzag – X – expanded flat.
Cycle wave III may have begun. Within cycle wave III, primary waves 1 and 2 may now be complete. Primary wave 3 has now moved above the end of primary wave 1 meeting a core Elliott wave rule. It has now moved far enough to allow room for primary wave 4 to unfold and remain above primary wave 1 price territory. Primary wave 4 may not move into primary wave 1 price territory below 1,346.45.
Cycle wave III so far for this wave count would have been underway now for 52 weeks. It is beginning to exhibit some support from volume and increasing ATR. This wave count now has some support from classic technical analysis.
The channel drawn about cycle wave III is an Elliott channel. Primary wave 4 may find support about the lower edge.
DAILY CHART
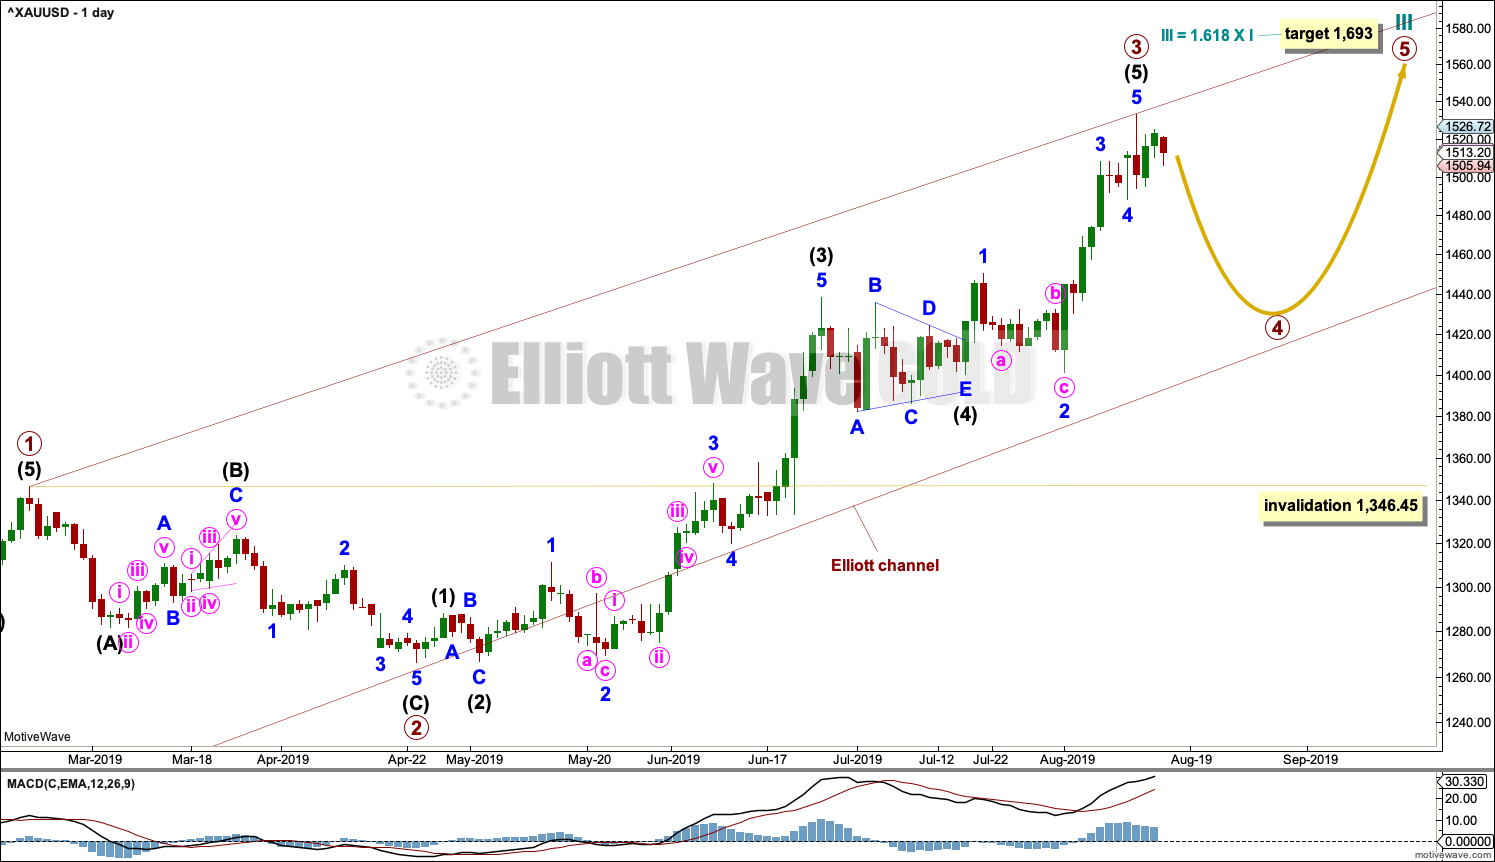
Click chart to enlarge.
Primary wave 3 may now be a complete impulse. The structure of intermediate wave (5) is now complete.
Primary wave 4 may not move into primary wave 1 price territory below 1,346.45.
Primary wave 4 may last about four to ten weeks. It may unfold as any one of more than 23 possible Elliott wave corrective structures. Primary wave 4 may end within the price territory of the fourth wave of one lesser degree; intermediate wave (4) has its range from 1,438.43 to 1,382.10.
Within the price territory of intermediate wave (4), from 1,438.43 to 1,382.10, lies the 0.382 Fibonacci Ratio of primary wave 3 at 1,431.45. This is the preferred target for primary wave 4.
TECHNICAL ANALYSIS
MONTHLY CHART
Click chart to enlarge. Chart courtesy of StockCharts.com.
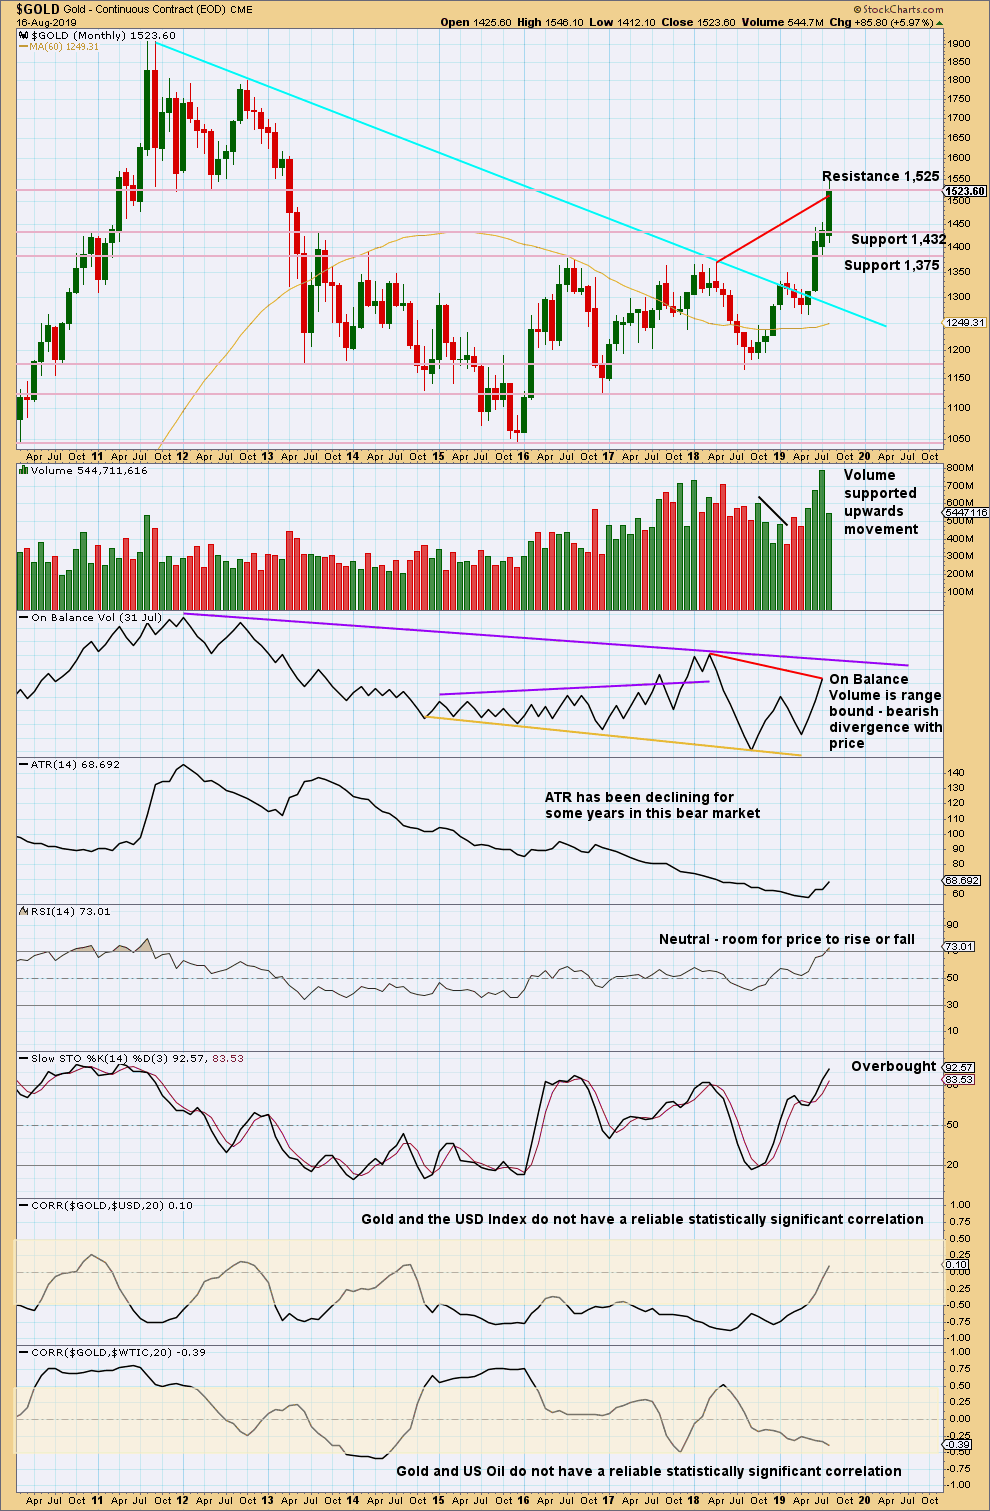
Gold has effected an upwards breakout above multi-year resistance and above the cyan bear market trend line. Price is now at strong resistance about 1,525.
The new high in price above prior highs for March / April 2018 have not been matched by new highs for On Balance Volume. This divergence is bearish and supports a bearish Elliott wave count. This divergence may be given a little weight because it is strong and evident on the monthly chart.
WEEKLY CHART
Click chart to enlarge. Chart courtesy of StockCharts.com.
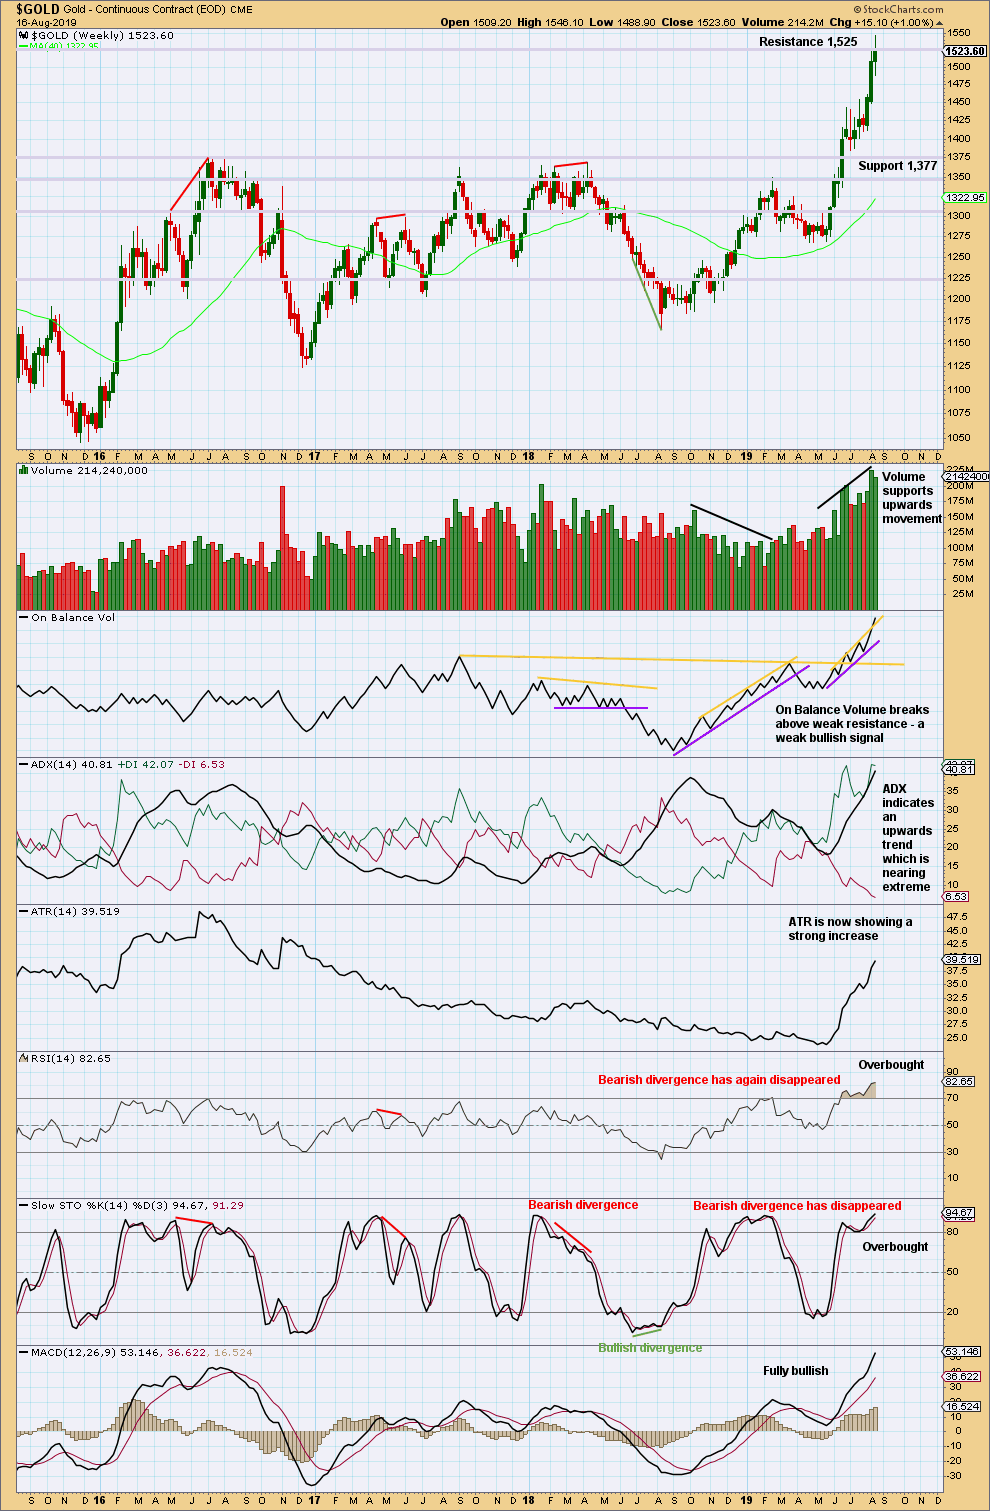
When trends for Gold reach extreme, they can continue still for a few weeks and price can continue for a considerable distance.
When both ADX and RSI reach extreme together, then that is sometimes where a trend ends.
RSI at overbought on the weekly chart is a warning to be cautious; the trend is overbought, but at this stage there is no evidence of a trend change.
The signal this week from On Balance Volume is weak because the resistance line breached has a strong slope and is not long held.
DAILY CHART
Click chart to enlarge. Chart courtesy of StockCharts.com.
Analysis of the last major bullish rise for Gold from November 2008 to September 2011:
There were several multi week consolidations or pullbacks along the way up. Below are listed the condition of technical indicators at the daily chart level at the start of each pullback which lasted more than four weeks:
On the 20th of February 2009: both an Evening Doji Star and a strong Bearish Engulfing candlestick appeared at the high, volume at the high was reasonable but not the strongest of prior days, ADX indicated an extreme upwards trend, RSI only just reached overbought and exhibited no bearish divergence with price, and On Balance Volume gave no signals.
On the 3rd of December 2009: both an Evening Doji Star and a very strong Bearish Engulfing candlestick appeared at the high with volume on the third downwards candlestick extremely strong, volume at the high was reasonable but weaker than 5 sessions prior, ADX was very extreme well over 50 both directional lines and had been extreme for a month, RSI was extremely overbought over 80 and exhibited no bearish divergence with price, and On Balance Volume gave no signals.
On the 21st of June 2010: a very strong Bearish Engulfing candlestick pattern appeared at the high with strong volume for the second bearish candlestick, volume at the high was not particularly strong in comparison to prior weeks, ADX only just indicated an upwards trend which was not extreme, RSI was not overbought, and On Balance Volume was at resistance.
On the 7th of December 2010: a strong Bearish Engulfing candlestick pattern at the high had support from volume for the bearish candlestick, volume had been declining up towards the high, ADX had been mostly declining for weeks and only just indicated an upwards trend at the high, RSI was not overbought and exhibited strong mid-term bearish divergence with price, and On Balance Volume gave no signals.
Within the very large consolidation from the low in November 2015, the major highs exhibited the following technical conditions:
On the 11th of March 2016: a strong bearish candlestick with a long upper wick at the high, the upwards day before the high had strong volume (not a blow off top) but at the high a red candlestick had weaker volume, ADX had reached very extreme and was declining, RSI was not overbought and exhibited weak bearish divergence with price, and On Balance Volume gave a weak bearish signal three days before the high.
On the 2nd of May 2016: a weak Evening Doji Star appeared at the high, up until the final day volume had been rising with price but remained weaker than seven sessions prior, on the final high volume was weak, neither ADX nor RSI were extreme, RSI exhibited no divergence with price, and On Balance Volume gave no signals.
On the 6th of July 2016: a strong Bearish Engulfing candlestick pattern occurred three days after the high, volume had been rising up until the last day of the high, a blow off top had appeared 7 sessions prior, ADX had reached extreme but only for a very few days, RSI was barely overbought and exhibited no divergence with price, and On Balance Volume gave a weak bearish signal.
On the 17th of April 2017: no candlestick reversal pattern appeared at the high, volume declined up to the high, ADX was not extreme and indicated an upwards trend, RSI was overbought and exhibited no bearish divergence with price, and On Balance Volume gave bullish signals after the high.
On the 8th of September 2017: there was no candlestick reversal pattern at the high, a blow off top appeared 3 sessions before the high, ADX only just reached extreme at the high, RSI was overbought and exhibited weak single bearish divergence with price, and On Balance Volume gave no signals.
On the 25th of January 2018: there was no candlestick reversal pattern at the high, a blow off top appeared at the high, ADX was extreme and had been so for weeks, RSI was overbought but exhibited no bearish divergence with price, and On Balance Volume gave no signals.
On the 11th of April 2018: there was a long upper wick at the high followed by a strong bearish candlestick the next day, there was a blow off top at the high, ADX only barely indicated an upwards trend, RSI was neutral and exhibited strong mid-term bearish divergence with price, and On Balance Volume exhibited mid-term bearish divergence with price.
On the 20th of February 2019: there was an Evening Star candlestick reversal pattern at the high, up until the day of the high volume had supported rising price, ADX only just exhibited an upwards trend which had previously reached extreme, RSI was overbought and exhibited no divergence with price, and On Balance Volume gave no signals.
The above analysis of 12 minor to major highs is summarised:
-7 of 12 cases exhibited a bearish candlestick pattern.
-Volume in 3 of 12 cases was reasonable but exhibited some decline from prior days or weeks.
-Volume in 3 of 12 cases had been rising with price up to the high or up to one session before.
-Volume in 2 of 12 cases had been declining up to the high.
-Blow off tops appeared in only 2 of 12 cases.
-Blow off tops appeared up to 7 sessions prior in 2 of 12 cases.
-ADX was extreme in 6 of 12 cases from a few days to a few weeks.
-RSI was overbought in 7 of 12 cases.
-RSI exhibited weak to strong bearish divergence in 4 of 12 cases.
-On Balance Volume gave bearish signals either at the high or up to 3 sessions after the high in 3 of 12 cases.
-On Balance Volume gave bullish signals in days immediately after the high in 1 of 12 cases.
Conclusions:
Evidence of a bearish candlestick pattern is a strong indicator of a minor or major high in place. The short to mid-term volume profile can be variable. Blow off tops are uncommon at minor to major highs, and are equally as likely to be either right at the high or up to a few sessions prior. RSI at overbought increases the probability of a minor to major high occurring, but it can persist for weeks before price turns. ADX likewise can persist at extreme for weeks before price turns and may not even reach extreme at minor or major highs. On Balance Volume is unlikely to exhibit a signal at a high but when it does it may increase the probability of a minor or major high having just occurred.
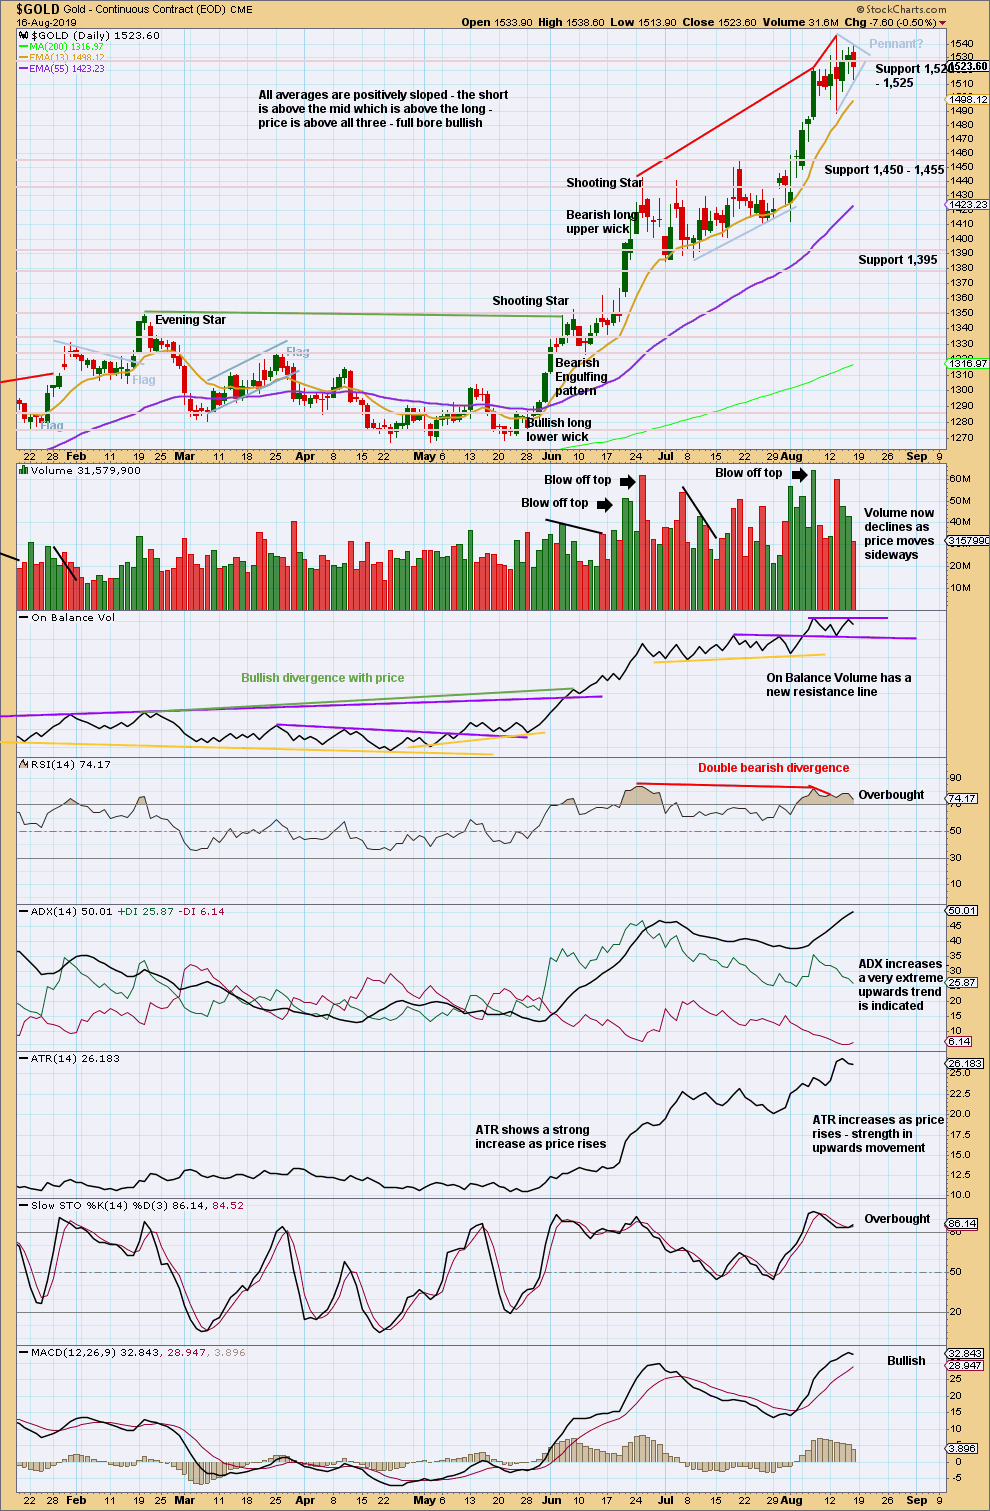
Currently, there is no bearish candlestick reversal pattern at the last high, there was a blow off top 4 sessions prior to the last high, ADX has reached very extreme, RSI also has reached overbought and exhibits bearish divergence with price, and On Balance Volume has given no signal. The probability that a major or minor high occurs here is heightened, but not certain. Extreme caution for long positions is warranted.
While price remains above the last swing low at 1,412.10, there is a series of higher highs and higher lows and an upwards trend in place. A new low below 1,412.10 would be a lower low and would confirm a trend change.
For the short term, a small pennant pattern may be forming. These are reasonably reliable continuation patterns. The target would be at 1,669.
On one day this week price has closed above prior strong resistance at 1,520 to 1,525, but it has not done so with support from volume. This potential upwards breakout is suspicious. For confidence an upwards breakout, support from volume is required.
GDX WEEKLY CHART
Click chart to enlarge. Chart courtesy of StockCharts.com.
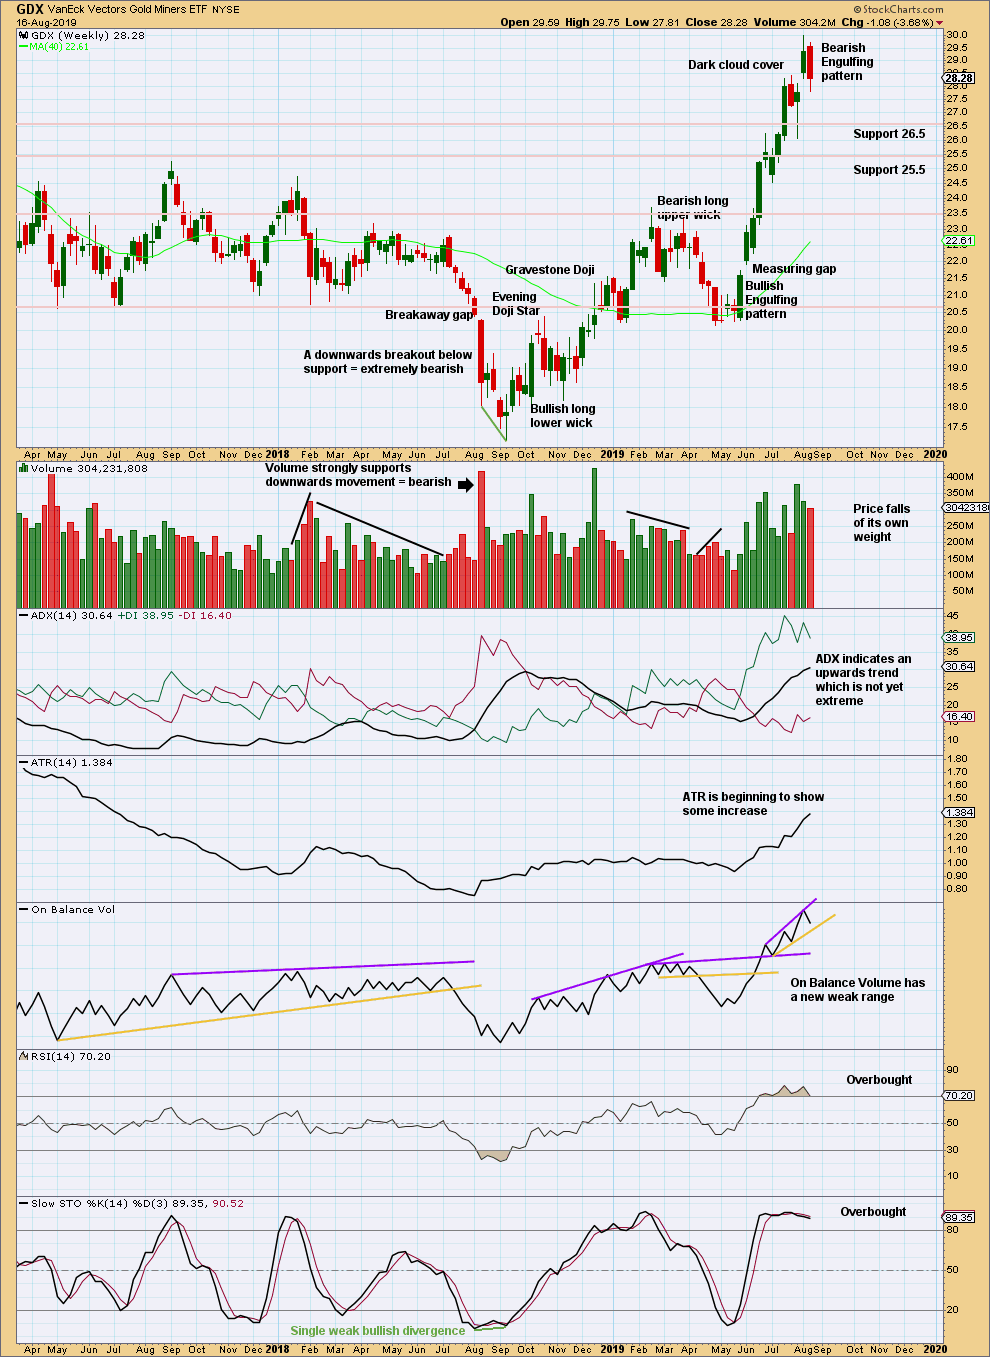
A strong Bearish Engulfing candlestick pattern is a strong warning that the upwards trend may now be over. A larger consolidation or a trend change may occur here.
GDX DAILY CHART
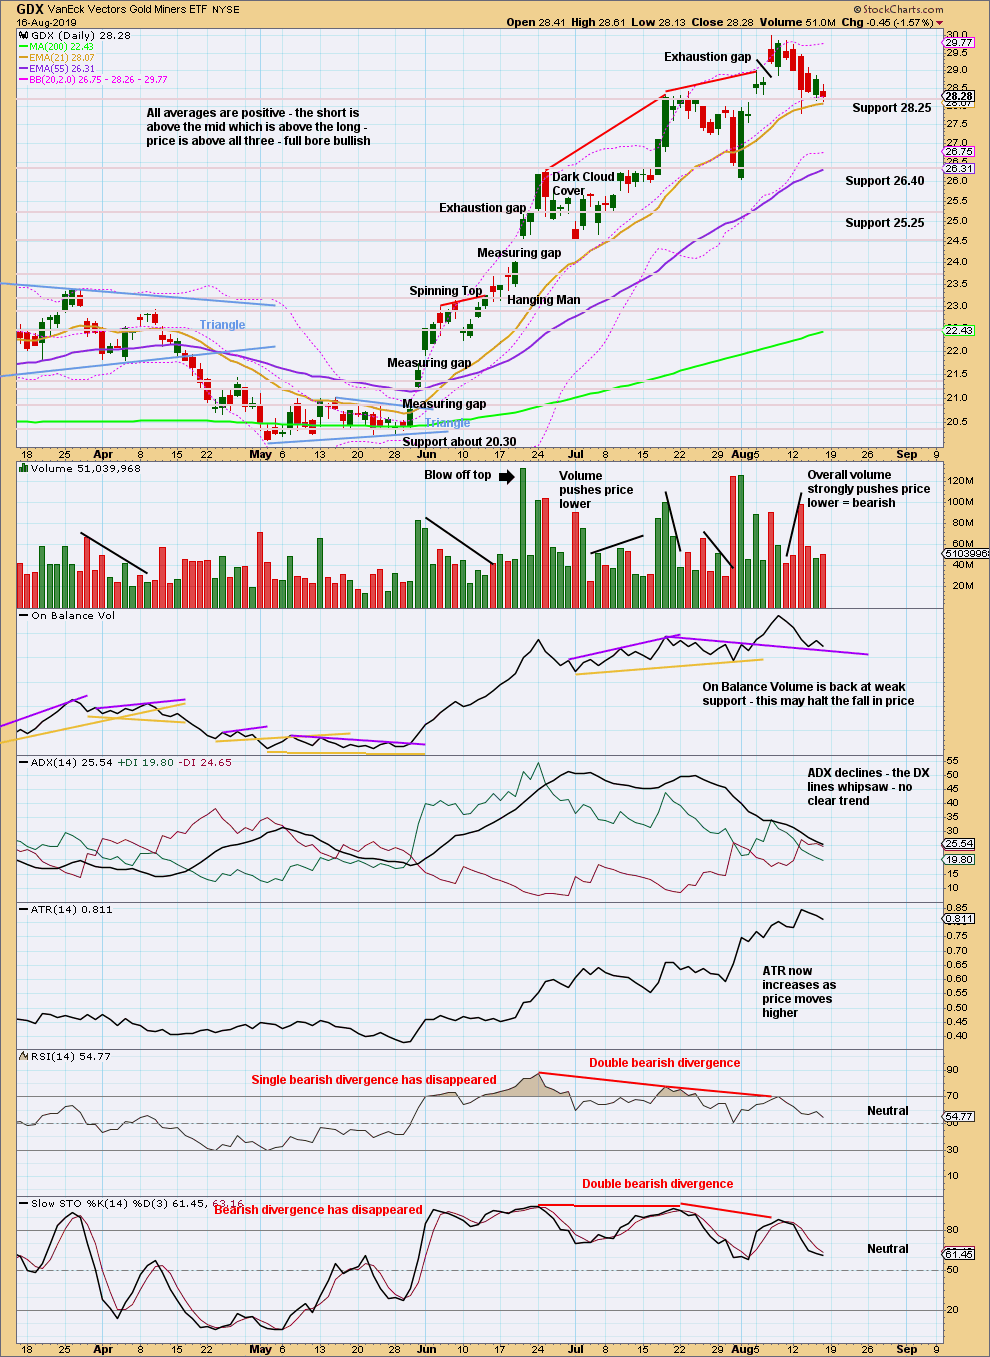
Click chart to enlarge. Chart courtesy of StockCharts.com.
A consolidation may have begun. Look for support about 28.4.
The last swing low was at 26.04. A new low below this point would confirm a trend change.
US OIL
Downwards movement has again continued as both Elliott wave counts expected for this week.
Summary: A new mid-term target is now at 35.25 for a third wave down. This may exhibit an increase in momentum, and may end with a capitulation spike.
The final target is calculated at 10.72. Confidence in this target may be had if price makes a new low below 50.61.
The bullish alternate wave count would have confidence above 66.59. At that stage, a target for a third wave to end would be at 89.80.
MAIN ELLIOTT WAVE COUNT
MONTHLY CHART
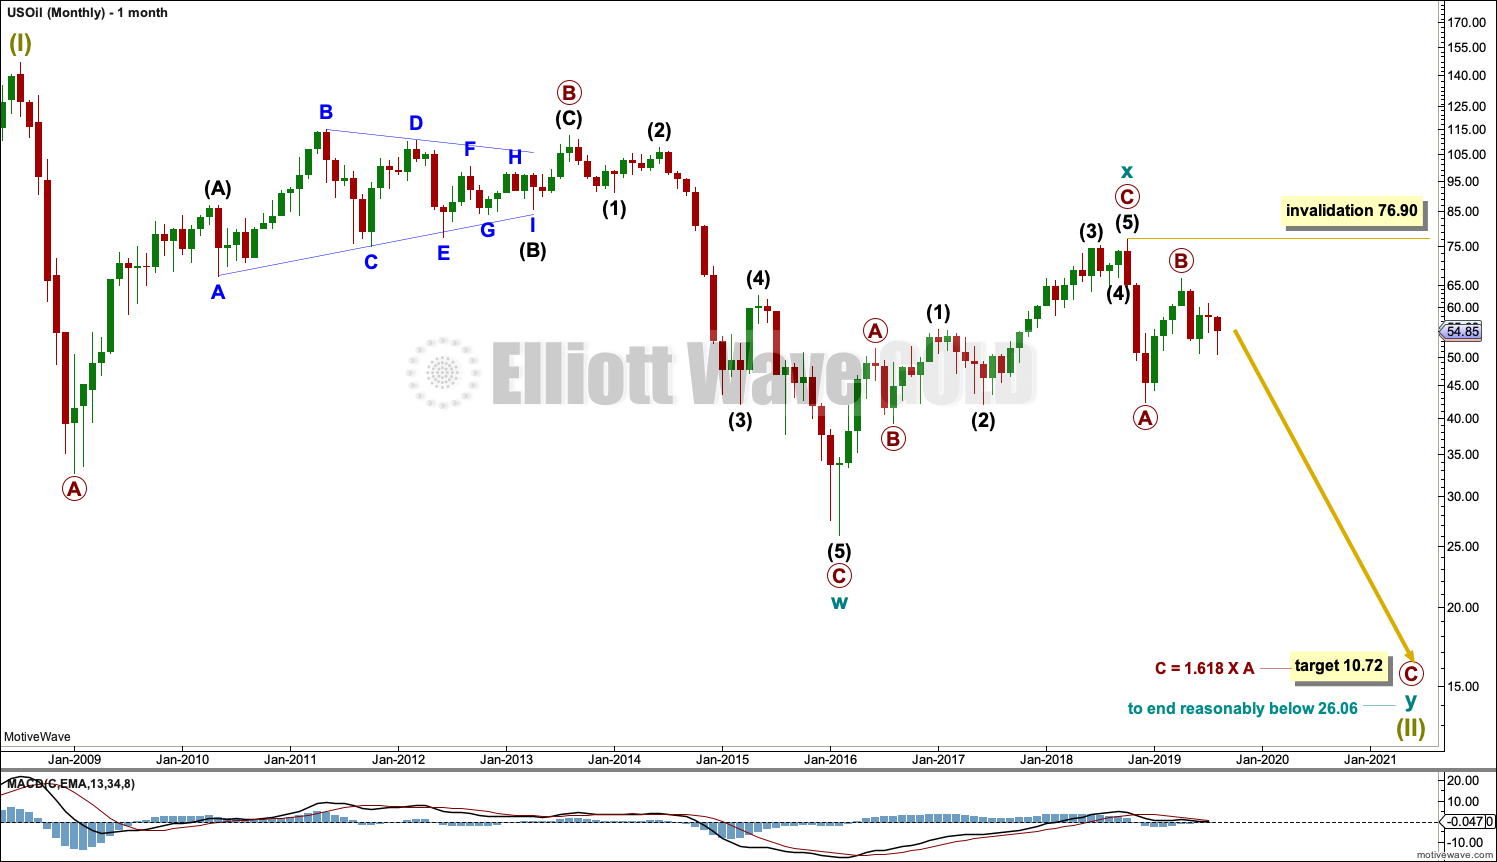
Click chart to enlarge.
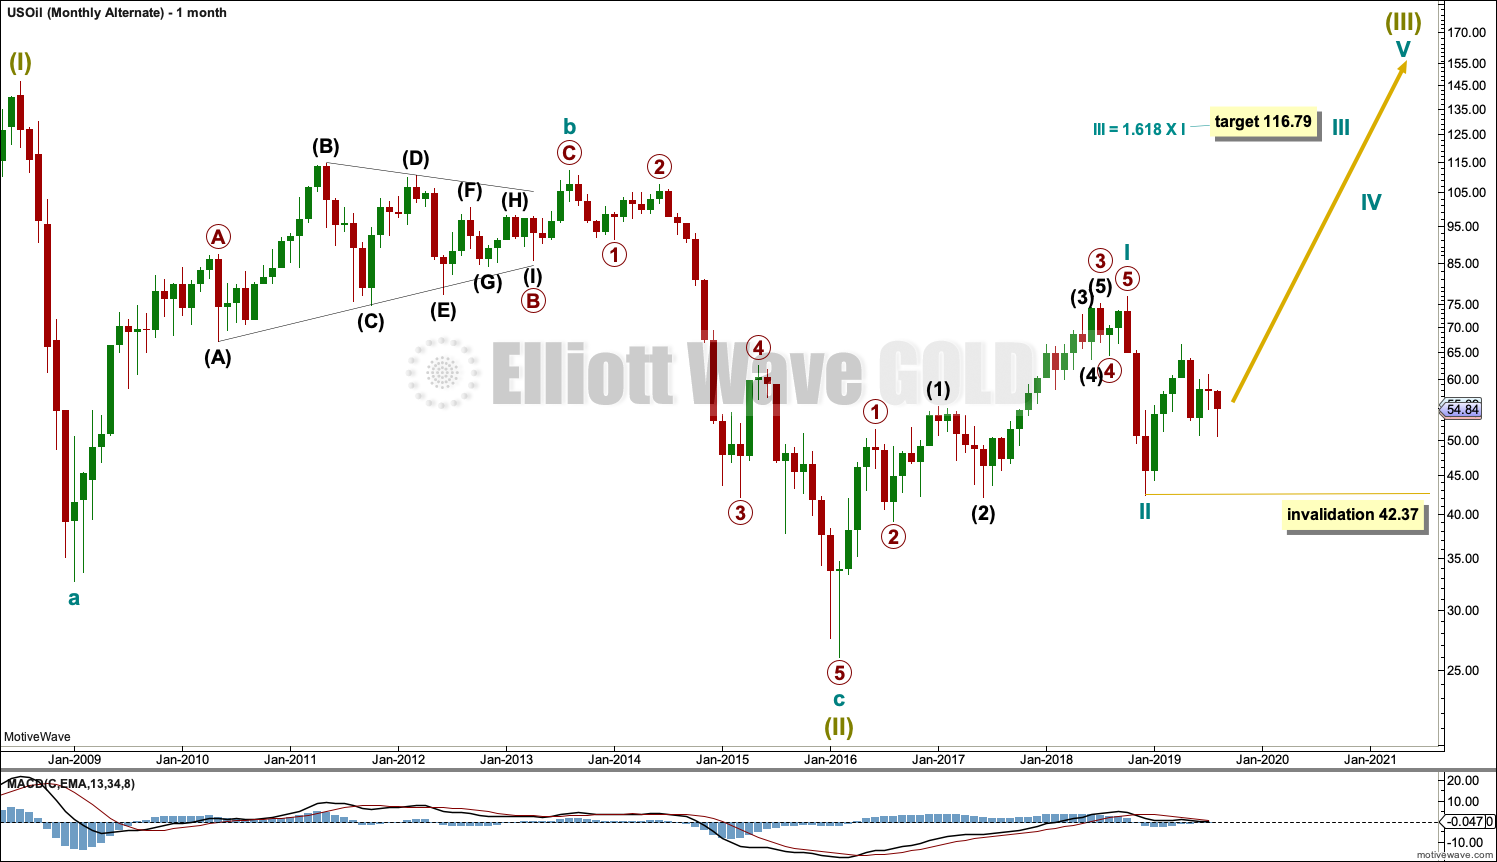
The basic Elliott wave structure is five steps forward and three steps back. This Elliott wave count expects that US Oil is still within a three steps back pattern, which began in July 2008. The Elliott wave count expects that the bear market for US Oil continues.
This Elliott wave corrective structure is a double zigzag, which is a fairly common structure. The correction is labelled Super Cycle wave (II).
The first zigzag in the double is complete and labelled cycle wave y. The double is joined by a three in the opposite direction labelled cycle wave x, which subdivides as a zigzag. The second zigzag in the double may now have begun, labelled cycle wave w.
The purpose of a second zigzag in a double zigzag is to deepen the correction when the first zigzag does not move price deep enough. To achieve this purpose cycle wave y may be expected to move reasonably below the end of cycle wave w at 26.06. The target calculated would see this expectation met.
Cycle wave y is expected to subdivide as a zigzag, which subdivides 5-3-5.
Cycle wave w lasted 7.6 years and cycle wave x lasted 2.7 years. Cycle wave y may be expected to last possibly about a Fibonacci 5 or 8 years.
If it continues higher, then primary wave B may not move beyond the start of primary wave A above 76.90.
WEEKLY CHART
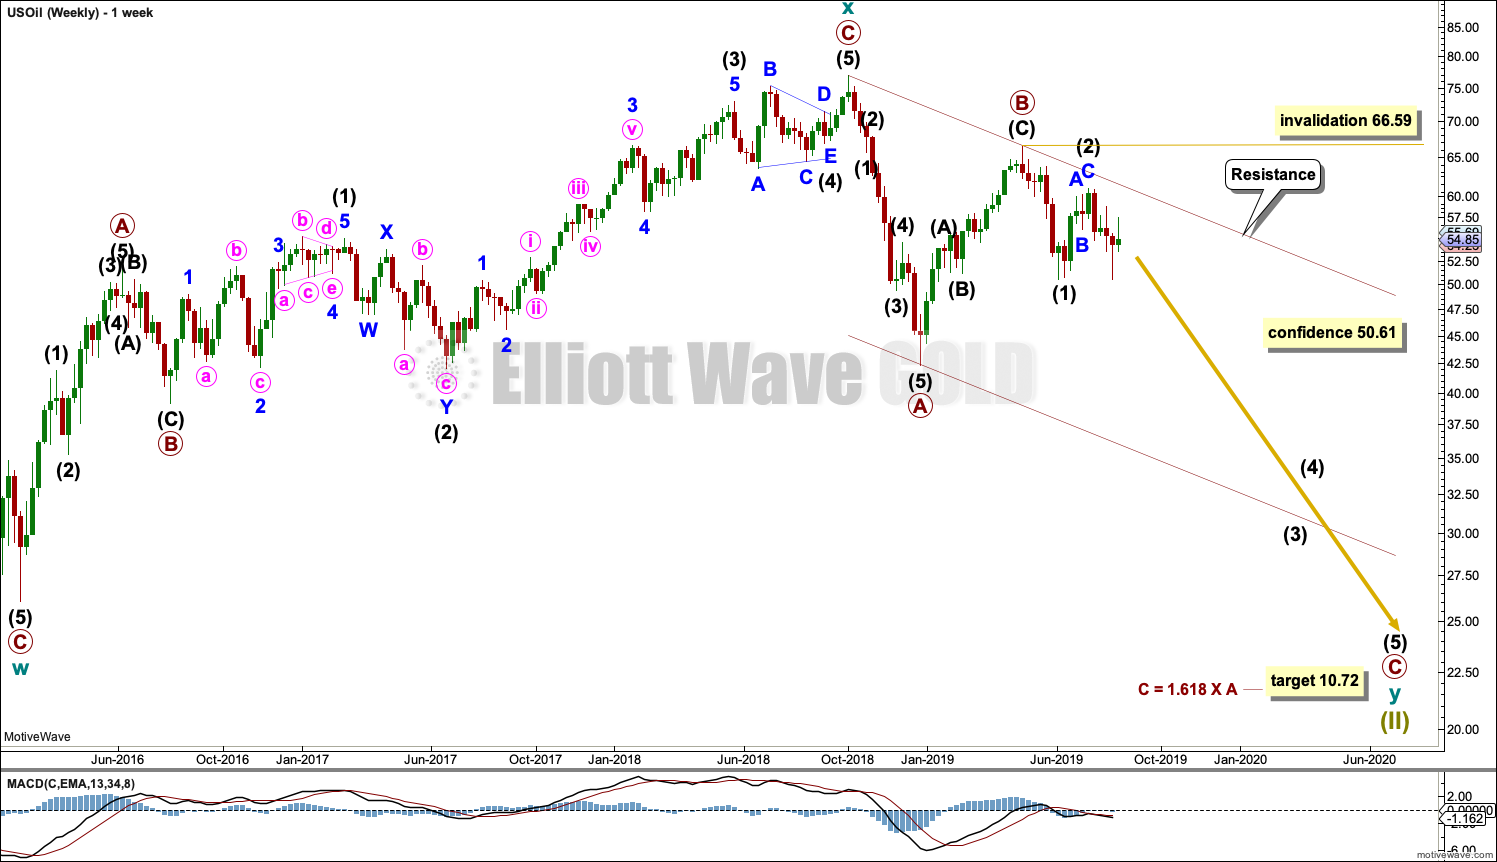
Click chart to enlarge.
This weekly chart shows all of cycle waves x and y so far.
Cycle wave y is expected to subdivide as a zigzag. A zigzag subdivides 5-3-5. Primary wave A must subdivide as a five wave structure if this wave count is correct.
Primary wave A may be a complete five wave impulse at the last low.
Primary wave B may now be a complete single zigzag at the last high.
Primary wave C may have just begun. Primary wave C must subdivide as a five wave structure.
Primary wave A lasted 12 weeks, just one short of a Fibonacci 13.
Primary wave C may be longer in time as well as price. If cycle wave y lasts a Fibonacci 5 years, then primary wave C within it may take as long as a Fibonacci 233 weeks.
Intermediate wave (1) within primary wave C may be a complete impulse. Intermediate wave (2) may not move beyond the start of intermediate wave (1) above 66.59.
Draw a channel about the zigzag of primary wave y using Elliott’s technique for a correction. Draw the first trend line from the start of primary wave A to the end of primary wave B, then place a parallel copy on the end of primary wave A. The upper edge of this channel may show where bounces along the way down find resistance. The lower edge of the channel may provide support.
DAILY CHART
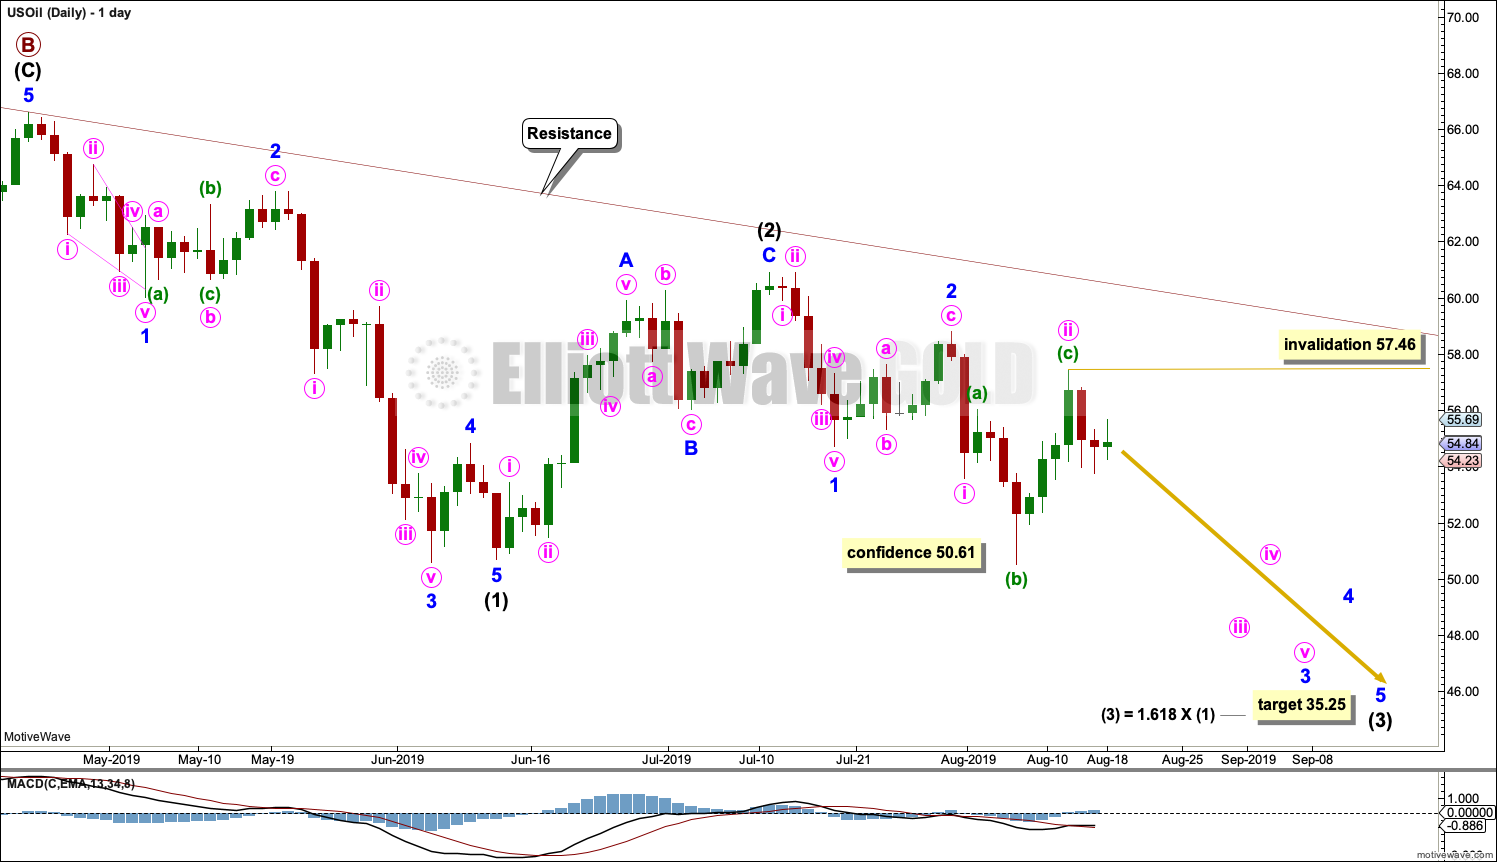
Click chart to enlarge.
Note that monthly and weekly charts are on a semi-log scale, but this daily chart is on an arithmetic scale. This makes a slight difference to trend channels.
It is possible that intermediate wave (1) is complete. Minor wave 4 for this wave count exhibits some alternation to minor wave 2; minor wave 2 may be a relatively deep zigzag or flat, and minor wave 4 may be a more shallow zigzag.
Minor wave 5 ends with a slight 0.11 truncation. Both Elliott wave counts must now accept this small truncation.
Intermediate wave (2) may also now be complete as a zigzag.
Intermediate wave (3) may only subdivide as an impulse, and it must move below the end of intermediate wave (1). Within intermediate wave (3), minor waves 1 and 2 may now be complete.
Minor wave 3 may only subdivide as an impulse. Within minor wave 3, minute waves i and ii may now be complete. Minute wave ii may have ended as an expanded flat correction.
Minute wave iii may only subdivide as an impulse. Within minute wave iii, no second wave correction may move beyond the start of its first wave above 57.46.
The next downwards wave of minute wave iii within minor wave 3 within intermediate wave (3) may be expected to exhibit an increase in momentum and an increase in ATR. It may have support from volume pushing price lower.
ALTERNATE ELLIOTT WAVE COUNT
MONTHLY CHART
Click chart to enlarge.
It is possible that the bear market is over for Oil and a new bull market has begun.
For a bullish wave count for Oil, the upwards wave from the major low at 26.06 in February 2016 must be seen as a complete five wave impulse. This is labelled cycle wave I.
Cycle wave II may be a complete zigzag at 0.679 the depth of cycle wave I.
A target is calculated for cycle wave III to reach a common Fibonacci ratio to cycle wave I.
Within cycle wave III, no second wave correction may move beyond the start of its first wave below 42.37.
WEEKLY CHART
Click chart to enlarge.
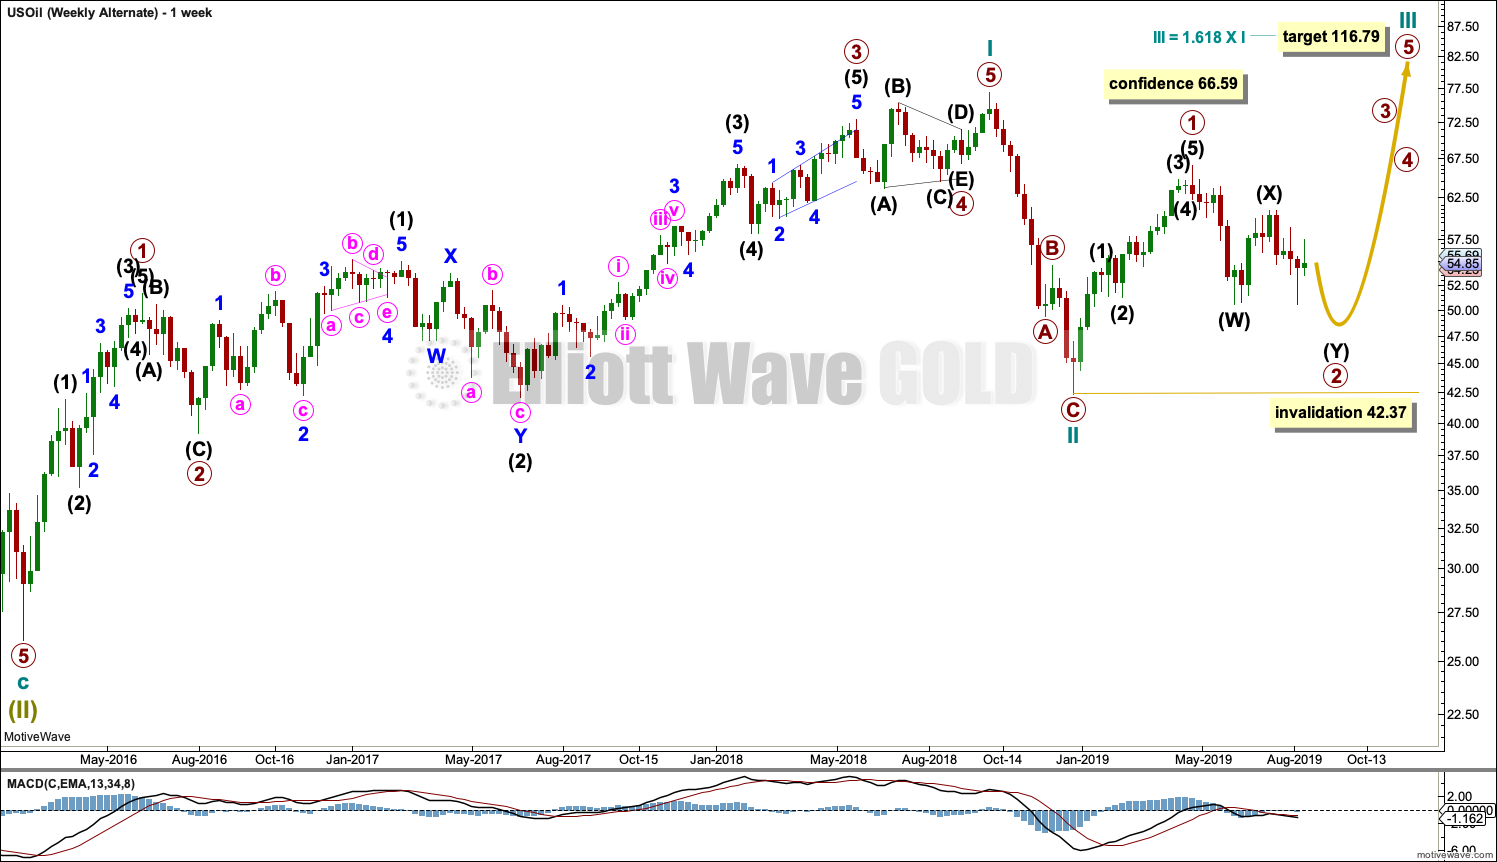
This weekly chart shows detail of cycle wave I as a five wave impulse.
Cycle wave II does look best as a three. This is the only part of this wave count that has a better look than the main wave count, which sees this downwards wave as a five.
Cycle wave III may only subdivide as an impulse. Within cycle wave III, so far primary wave 1 may be complete. Primary wave 2 may be moving lower as a double zigzag. Primary wave 2 may not move beyond the start of primary wave 1 below 42.37.
DAILY CHART
Click chart to enlarge.
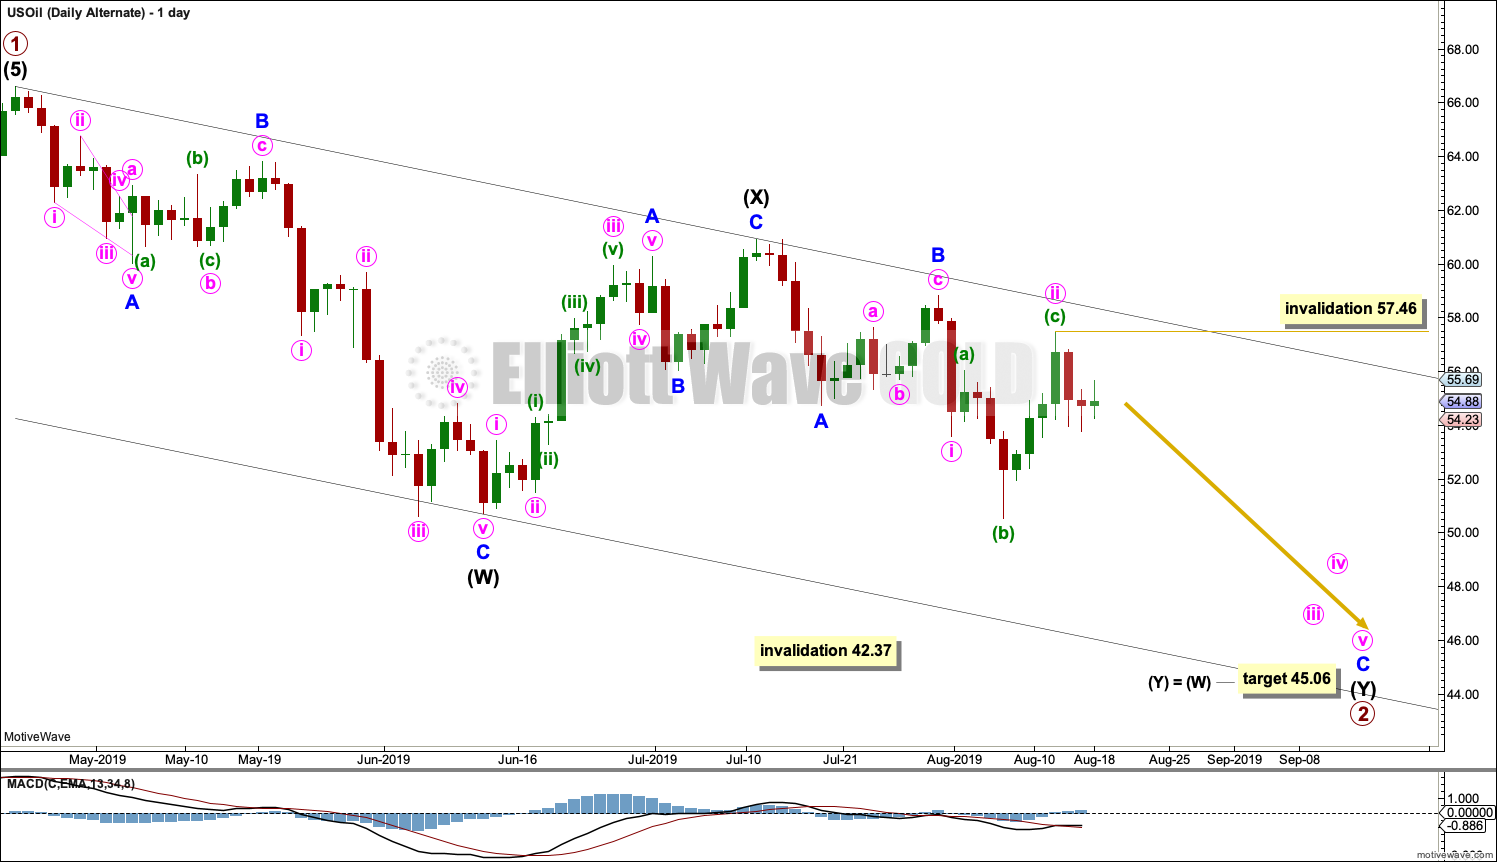
Primary wave 2 may be continuing lower as a double zigzag.
The first zigzag in the double would be complete, labelled intermediate wave (W). Within intermediate wave (W), minor wave C ends with a slight truncation for minute wave v. This is acceptable.
The double may be now joined by a complete three in the opposite direction, a zigzag labelled intermediate wave (X).
A second zigzag may now unfold labelled intermediate wave (Y). Within intermediate wave (Y), minor waves A and B may be complete. Minor wave C must now complete lower as a five wave structure. Within minor wave C, minute waves i and ii may now be complete.
Minute wave iii may only subdivide as an impulse. Within minute wave iii, no second wave correction may move beyond the start of its first wave above 57.46.
TECHNICAL ANALYSIS
MONTHLY CHART
Click chart to enlarge. Chart courtesy of StockCharts.com.
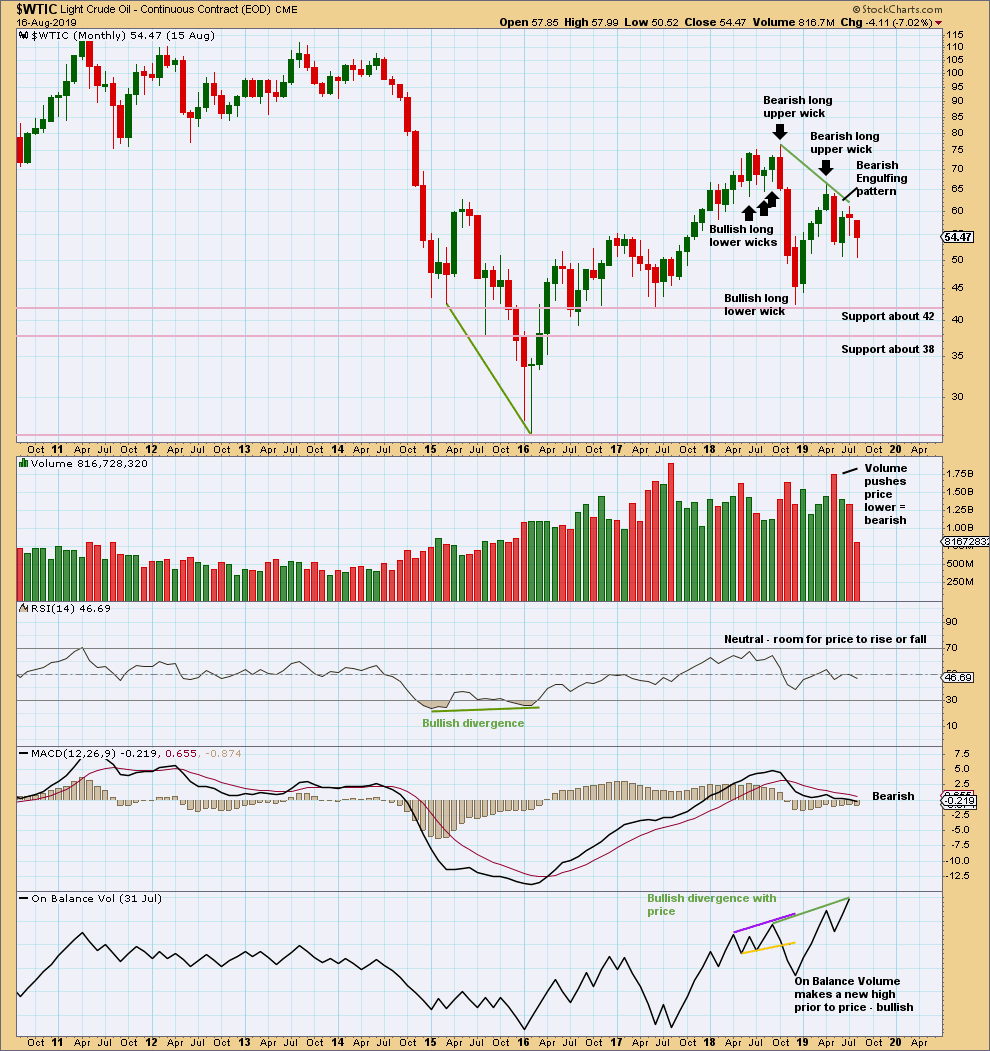
May has closed with a strong Bearish Engulfing candlestick pattern, which has strong support from volume. This supports the main Elliott wave count.
June moved price lower with a lower low and a lower high, but the candlestick closed green and the balance of volume was upwards. Upwards movement within the month did not have support from volume. This also supports the main Elliott wave count.
There is now double bullish divergence between price and On Balance Volume. This supports the alternate Elliott wave count.
WEEKLY CHART
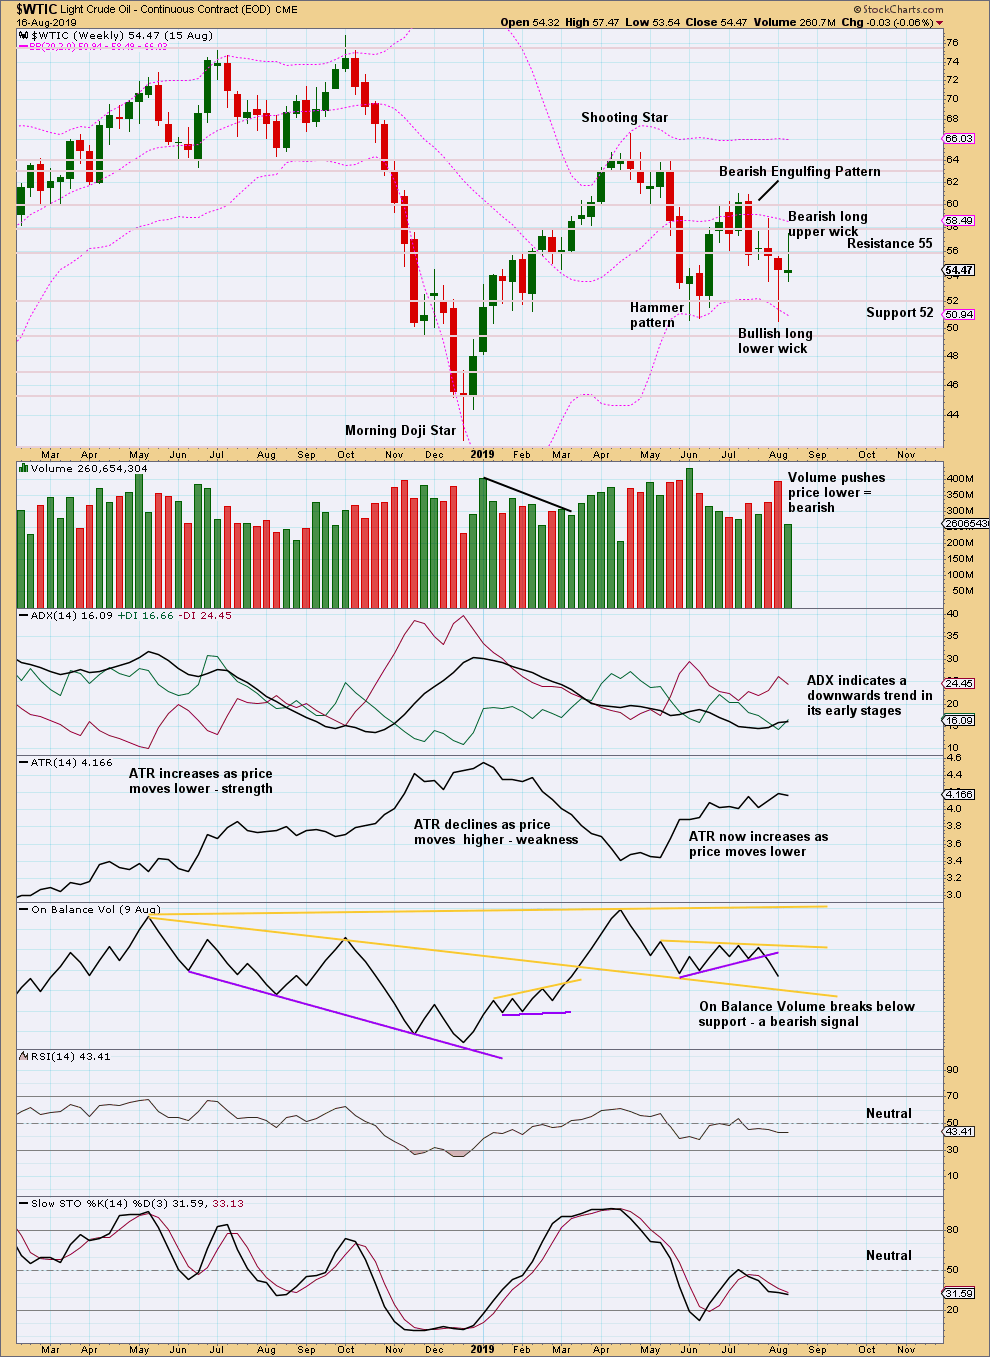
Click chart to enlarge. Chart courtesy of StockCharts.com.
After a long lower wick last week suggesting a bounce, that is what has happened for this week. Now a long upper wick suggests the bounce may be over and downwards movement may follow next week. Volume for upwards movement this week was weak, supporting this view.
There is again a downwards trend in place. ADX is giving the strongest signal it can give.
DAILY CHART
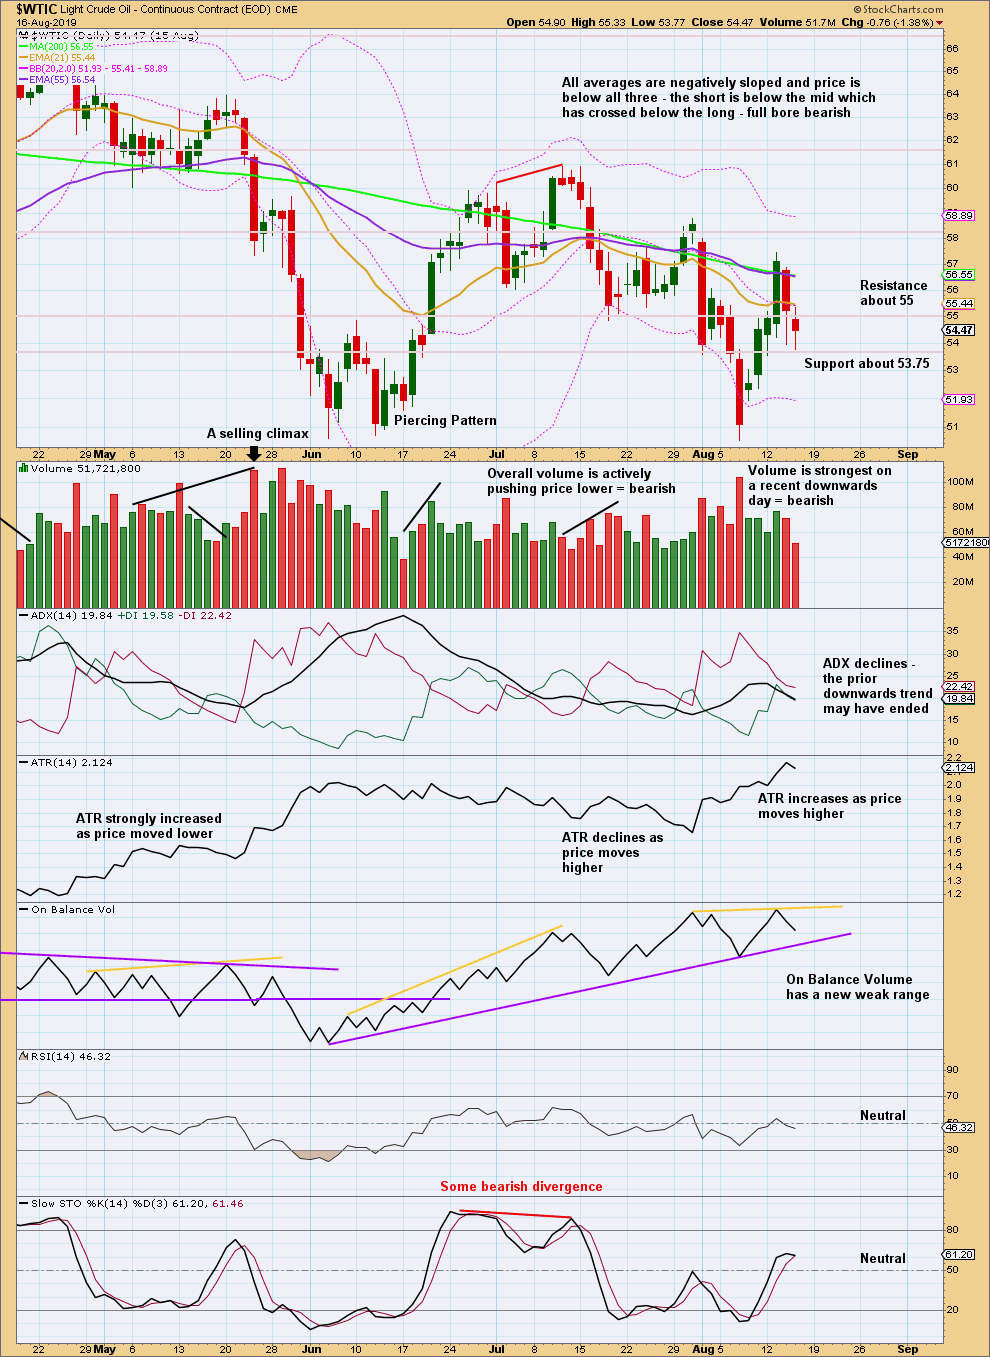
Click chart to enlarge. Chart courtesy of StockCharts.com.
While the strongest volume for recent days is the downwards day of the 7th of August, at the end of this week’s bounce on 13th of August volume supported that day’s upwards movement. Overall, the volume profile remains bearish but not fully so. It is possible that the bounce from last week may continue a little higher before the downwards trend resumes.
—
Always practice good risk management as the most important aspect of trading. Always trade with stops and invest only 1-5% of equity on any one trade. Failure to manage risk is the most common mistake new traders make.
Comment on the S&P500:
Lowrys data now shows that the 16th of August was a 90% OCO day (that’s operating companies only). This means there is enough strength in the bounce off the low to indicate it may likely be a sustainable low.
The second alternate daily chart for the S&P is now the main wave count.
Gold
Plus.
…breakouts of gold many currencies to new all time highs. Any pullbacks towards the breakout in these currencies will probably be bought.
…negative interest rates in many countries stealing money from base. People look to real assets to hold value
…general unrest in world with a few possible powder kegs…Hong Kong ..North Korea…
Negative
…Possible deflation as people become over indebted .
…huge short position by commercials. They are not buying these new highs and are expecting a sizeable pullback. If this pullback is not accompanied by the commercials switching there positions to being long then there is a good probability that we break below 1345.
…gold and silver stocks and silver lagging behind gold. Look at the Hui and silver prices when gold was at 1375 in 2016. Both were much higher. This is concerning but these can catch up in a hurry if we have another leg up.
Lara….any Silver analysis this week ?..great work on the bullish and bearish analysis for gold. Silver has a bit better commercial standing than gold and any small pullback would get it bullish in a hurry imo.
Fed meets Jackson hope Friday. Be on alert.
Thanks for the list Dgohanlon.
Silver analysis was published last this week I believe. It’s in the usual place, here.
Hey Dgohanlon,
Gold does well when REAL interest rates are negative…. What are real interest rates? nominal interest rates minus inflation….
Currently, inflation in Europe is higher than 0 but their interest rates are negative. Inflation in North America is higher than the interest rates….
Geopolitics is a side show for Gold and you should not invest in Gold because of unrest….
Gold is money and it is a function of real interest rates… It is going up when we have negative REAL interest rates because it discourages investors to own a currency/bond with a negative yield.
So real interest rates in the development world are negative…. It doesn’t matter if we have a lot of debt or not….
People have to spend on food and energy no matter how indebted they are…. and food and energy are going up…
In the 70s, Gold went from $32 to $850 in 10 years…. what stopped it? 20 % interest rates in the US….
But now, the Fed cannot raise interest rates because of the humungous debt…. This means that the Fed will be behind on inflation… This means the US dollar will depreciate against hard assets over the foreseeable future.
Other currencies like the Euro are weaker than the US dollar… Basically the race to 0 is now continuing after a pause since 2011….
Central Banks are now stuck…
I am adding to my gold stocks on this pull back.
Cheers,
Mathieu
Interesting analysis Mathieu, thank you.
Hi Lara,
For Oil it appears the labeling has changed slightly on the main count, would you have a revised target for your blue 3 based on the new count?
The placement of minor waves 1 and 2 has not changed this week for the main count for US Oil. And so the length of minor 1 is the same, and the starting point of minor 3 is the same. The target would still be for minor 3 to = 1.618 X minor 1 at 48.80.
But, have you watched the video this week for Oil? In it I explained my reasoning for not putting that target on the chart and in the analysis.
I expect minor 4 may be relatively brief and shallow. Which means focussing on when minor 3 ends as a possible point to exit short positions may miss out minor 5 of intermediate (3), which may be the swiftest strongest portion of intermediate (3).
I’m trying to get members of Lara’s Weekly to focus on the bigger picture, and avoid the smaller noise of smaller corrections.
I make mistakes on my charts and in my analysis sometimes, and sometimes members helpfully point these out to me. If it’s not a mistake, then there is reasoning behind my decisions on everything that goes into the charts, text and video.
Hi Lara,
There’s been a lot of movement with cryptos this week. BTC moved down almost $3k but it’s still not close to your previous ~ $7600 target for the downside. Does the target still stand?
Also, I really liked your AORD analysis on the other site. AORD closed the previous month at 6896, invalidating the first monthly count, though I’m unsure of the status of the second count. Monthly close ended outside the best fit channel and the elliott channel. How would you rate probability for the second and third counts at this point?
Thanks in advance,
Jiten
The target for BTC still stands, I still don’t think its done for its pullback. It is taking a lot longer than I anticipated though! It’s testing my patience. BTC has huge global volume now, and so it’s producing nice looking EW structures. My analysis today shows the structure may be incomplete for this pullback. I’m using this as a guide for the other cryptos I’m looking at, roughly.
XRP: it’s possible that it’s reached its low last week, but equally as likely that it has just one more low to make yet.
XMR: again, I think this one has one final low yet to make.
ETH: could have found its low last week
DASH: could have found its low, but equally as likely it may make one final low this week but for this one I expect it won’t be by much.
I haven’t looked at AORD for ages. I should probably update that analysis this week, someone did ask for it ages ago and I haven’t done it. Will post a message in comments here if I do find time to do that, but am also building a new website this week so may not get much else done.