

S&P 500
Price remains constrained within a small zone of support and resistance. The three Elliott wave counts remain the same.
Summary: Conditions are still suggesting a sustainable low may be in place. The next target is 3,120.
A new low below 2,822.12 would indicate a continuing deeper pullback as fairly likely. The first target would then be at 2,663.
The biggest picture, Grand Super Cycle analysis, is here.
Monthly charts were last published here. There are two further alternate monthly charts here.
ELLIOTT WAVE COUNTS
The two weekly Elliott wave counts below will be labelled First and Second. They may be about of even probability. When the fifth wave currently unfolding on weekly charts may be complete, then these two wave counts will diverge on the severity of the expected following bear market. To see an illustration of this future divergence monthly charts should be viewed.
FIRST WAVE COUNT
WEEKLY CHART
Click chart to enlarge.
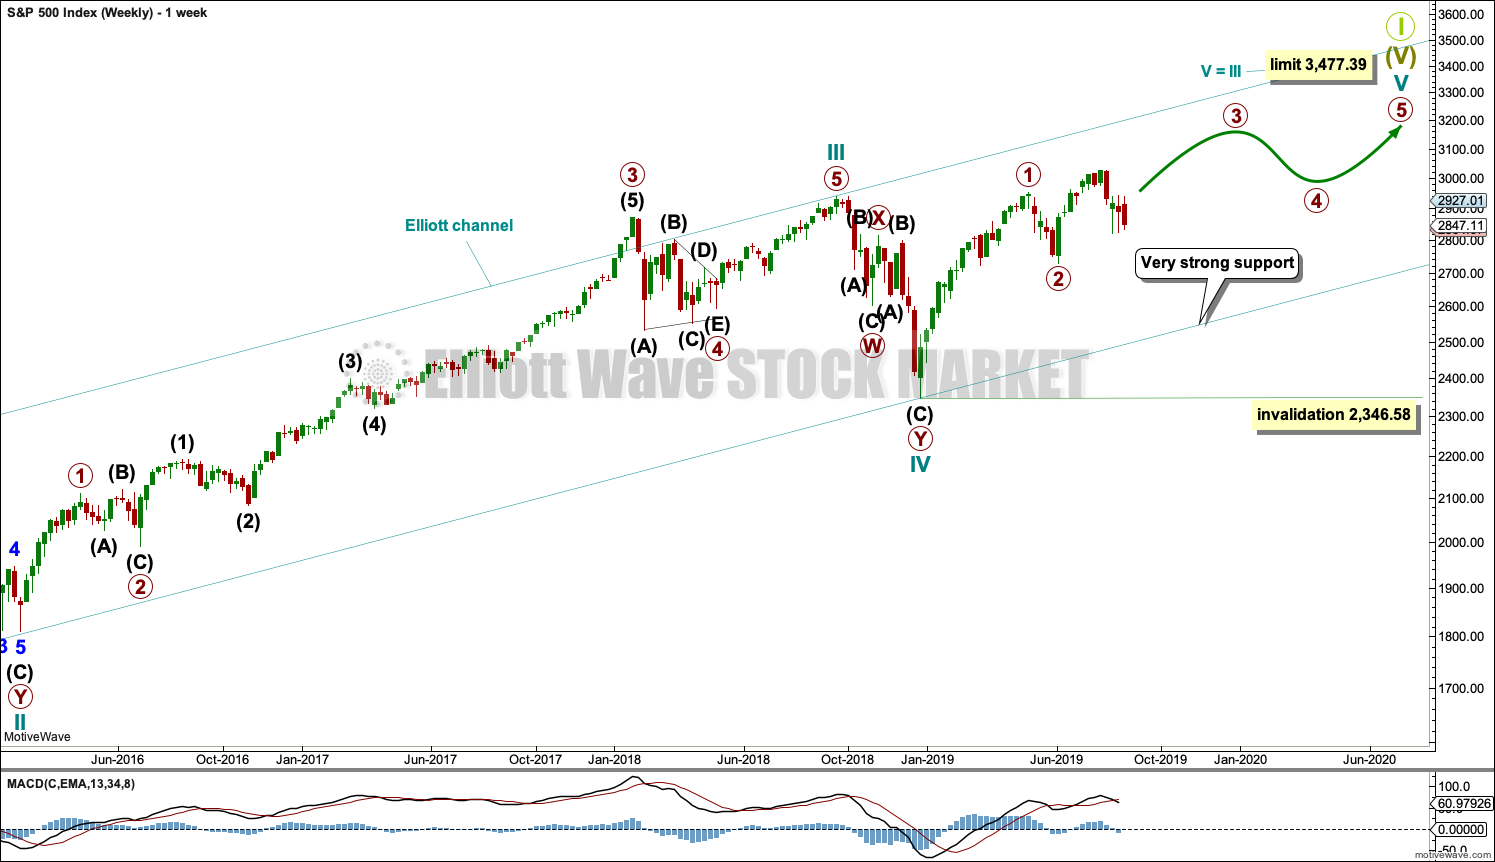
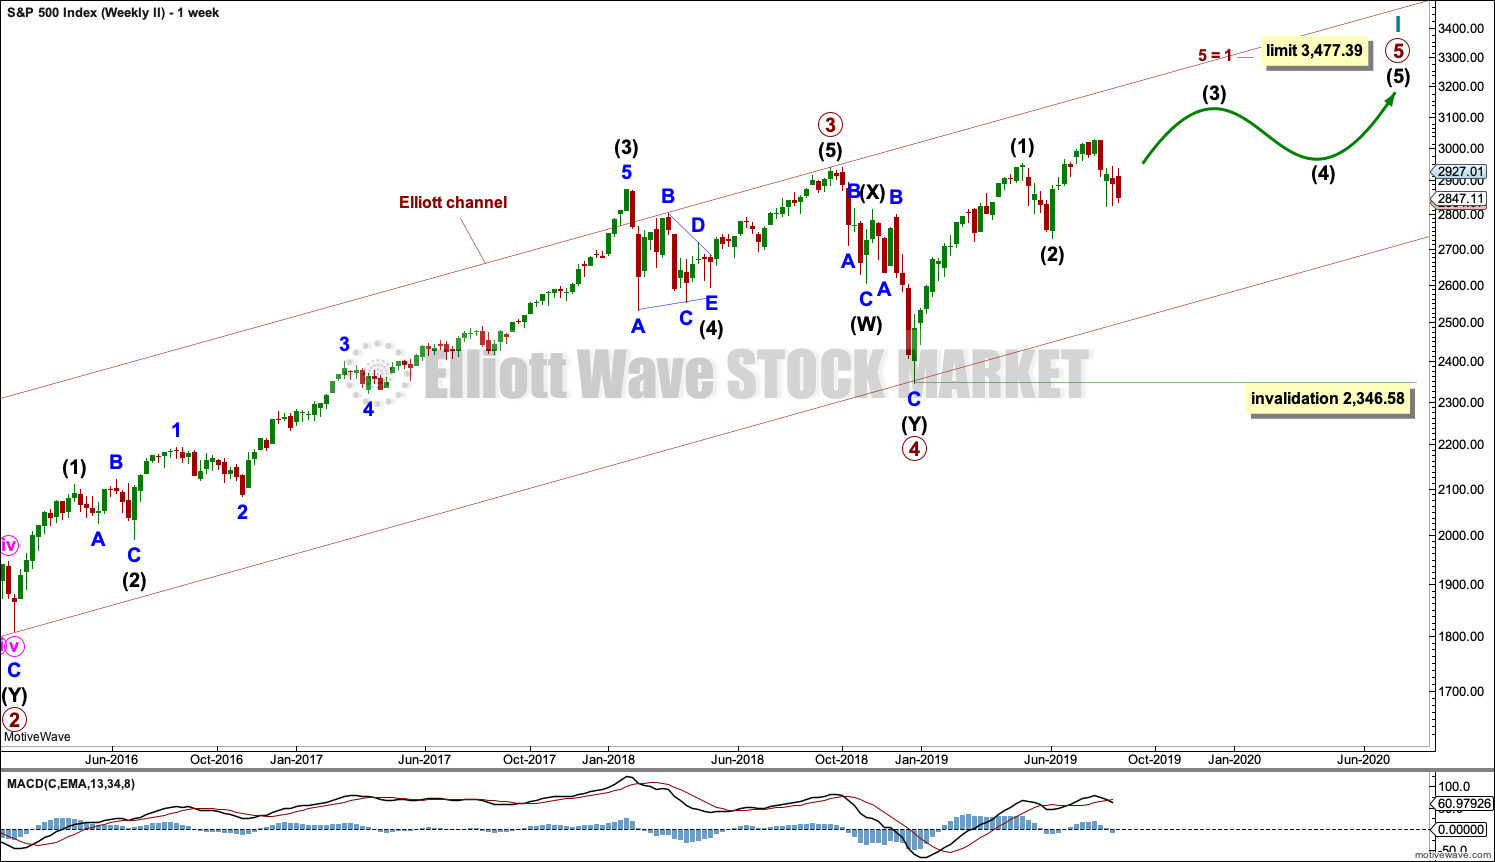
The basic Elliott wave structure consists of a five wave structure up followed by a three wave structure down (for a bull market). This wave count sees the bull market beginning in March 2009 as an incomplete five wave impulse and now within the last fifth wave, which is labelled cycle wave V. This impulse is best viewed on monthly charts. The weekly chart focusses on the end of it.
Elliott wave is fractal. This fifth wave labelled cycle wave V may end a larger fifth wave labelled Super Cycle wave (V), which may end a larger first wave labelled Grand Super Cycle wave I.
The teal Elliott channel is drawn using Elliott’s first technique about the impulse of Super Cycle wave (V). Draw the first trend line from the end of cycle wave I (off to the left of the chart, the weekly candlestick beginning 30th November 2014) to the end of cycle wave III, then place a parallel copy on the end of cycle wave II. This channel perfectly shows where cycle wave IV ended at support. The strongest portion of cycle wave III, the end of primary wave 3, overshoots the upper edge of the channel. This is a typical look for a third wave and suggests the channel is drawn correctly and the way the impulse is counted is correct.
Within Super Cycle wave (V), cycle wave III is shorter than cycle wave I. A core Elliott wave rule states that a third wave may never be the shortest. For this rule to be met in this instance, cycle wave V may not be longer in length than cycle wave III. This limit is at 3,477.39.
Cycle wave V may subdivide either as an impulse or an ending diagonal. Impulses are much more common. This main wave count expects that cycle wave V may be unfolding as an impulse.
The daily charts below will now focus on all of cycle wave V.
In historic analysis, two further monthly charts have been published that do not have a limit to upwards movement and are more bullish than this wave count. Members are encouraged to consider those possibilities (links below summary) alongside the wave counts presented on a daily and weekly basis.
MAIN DAILY CHART
Click chart to enlarge.
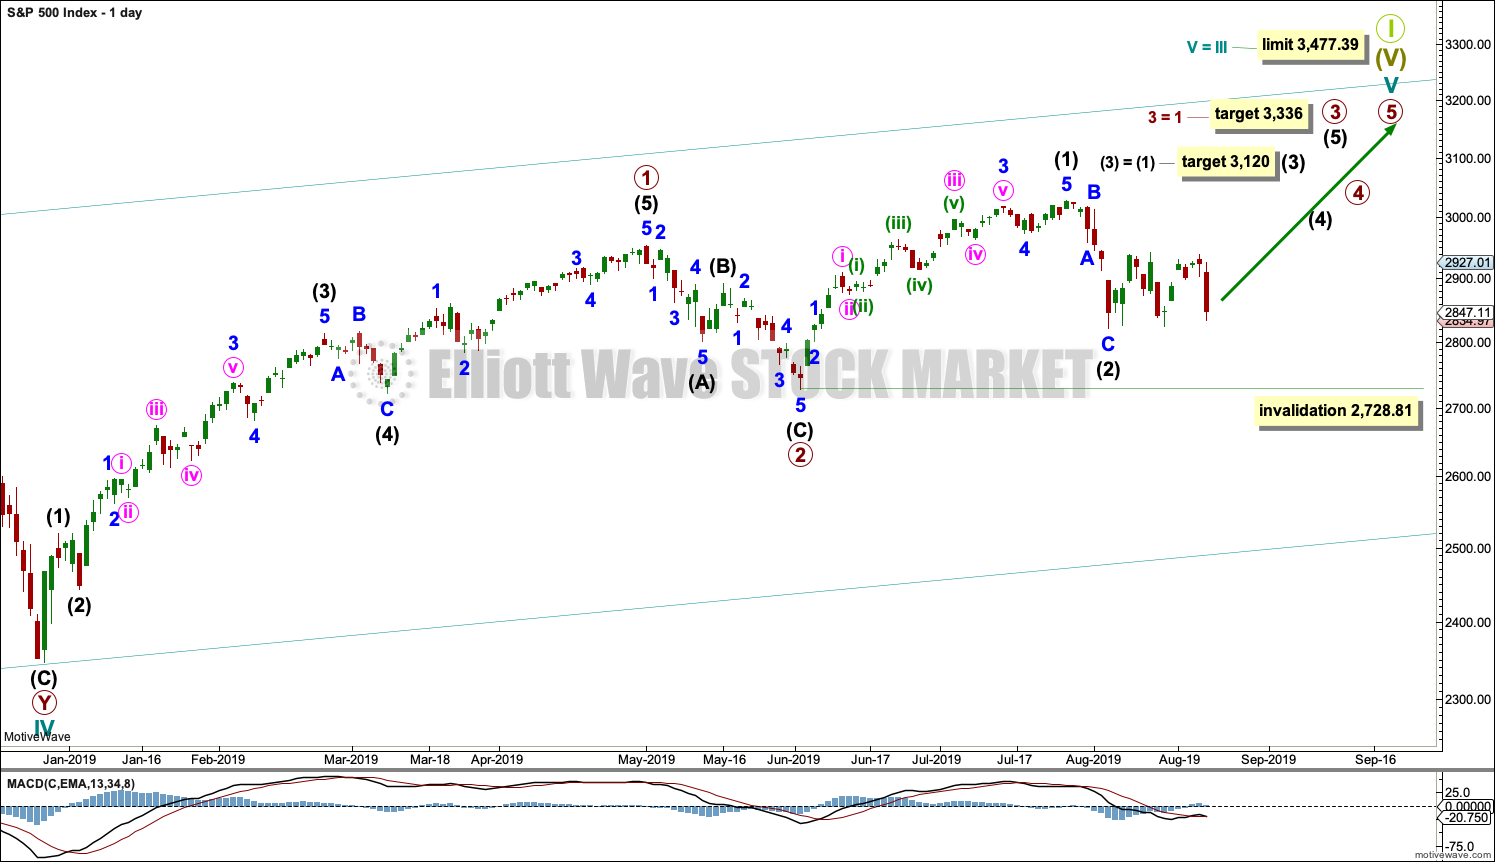
There is enough support from classic technical analysis to consider this the main wave count.
Cycle wave V is seen as an impulse for this wave count.
Within cycle wave V, primary waves 1 and 2 may be complete. Primary wave 3 may have begun.
Primary wave 3 may only subdivide as an impulse. Within primary wave 3, intermediate waves (1) and (2) may be complete.
It is also possible that intermediate wave (2) may be incomplete and sideways movement of the last 14 sessions may be minor wave B within a zigzag for intermediate wave (2). If intermediate wave (2) continues lower, then it may not move beyond the start of intermediate wave (1) below 2,728.81.
Intermediate wave (3) may have begun. Intermediate wave (3) may only subdivide as an impulse.
The adjusted base channel is now removed as it was not showing where price was finding support. The invalidation point remains the same.
ALTERNATE DAILY CHART
Click chart to enlarge.
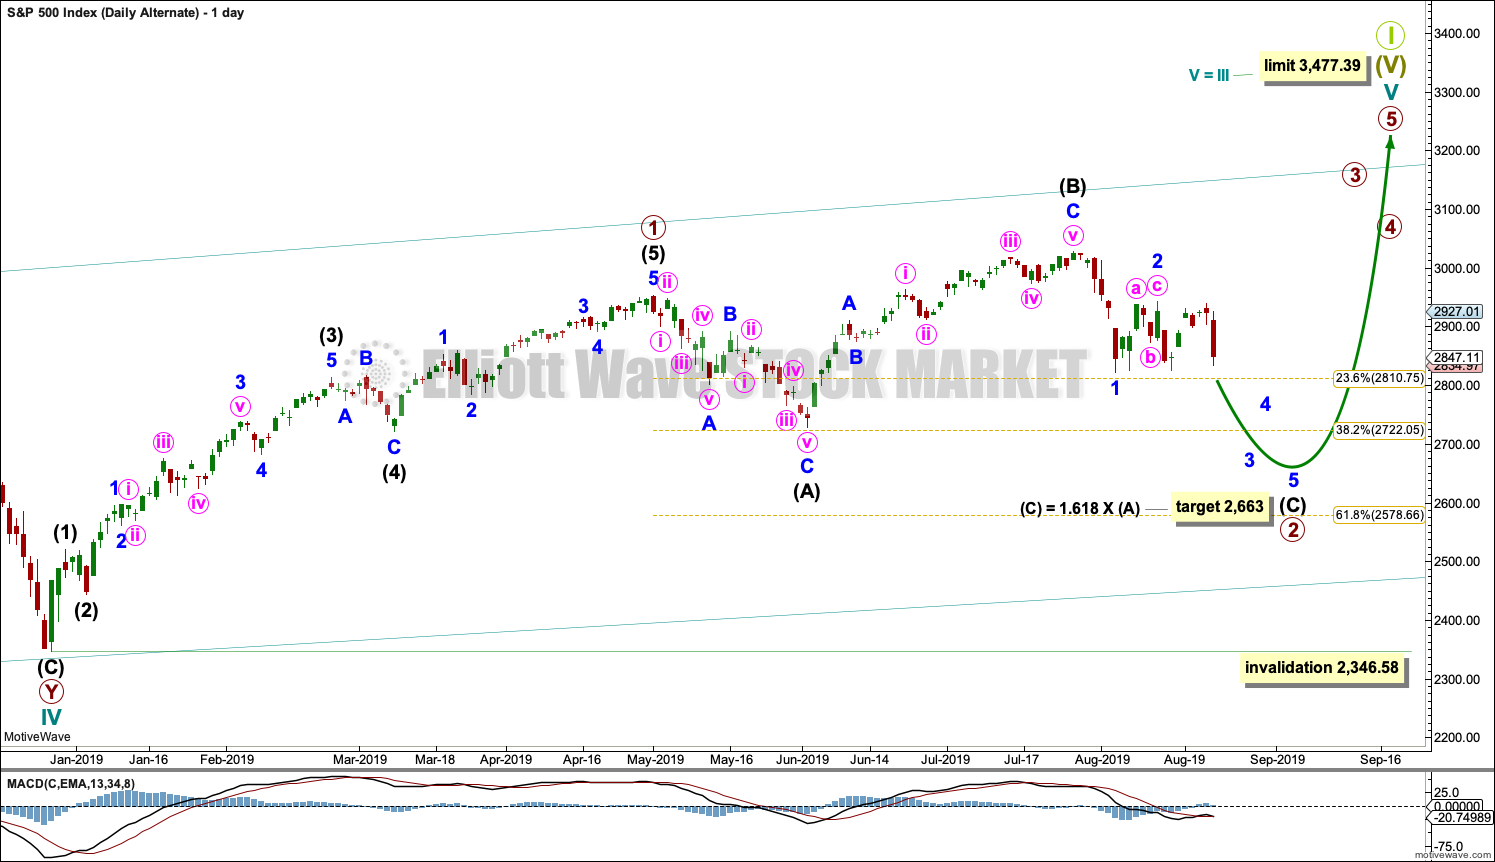
This first alternate wave count considers the possibility that cycle wave V may be unfolding as an impulse.
Cycle wave V must subdivide as a five wave motive structure. Within that five wave structure, primary wave 1 only may be complete.
Primary wave 2 may be unfolding as an expanded flat correction. These are reasonably common Elliott wave corrective structures. Flat corrections subdivide 3-3-5. Expanded flats have B waves which are 1.05 or more the length of their A waves. In this example for primary wave 2, intermediate wave (B) is a 1.33 length of intermediate wave (A). The target for intermediate wave (C) expects it to exhibit the most common Fibonacci Ratio to intermediate wave (A) within an expanded flat.
If price reaches the target at 2,663 and keeps falling, then the next target would be the 0.618 Fibonacci Ratio of primary wave 1 at 2,578.66.
Primary wave 2 may not move beyond the start of primary wave 1 below 2,346.58.
SECOND ALTERNATE DAILY CHART
Click chart to enlarge.
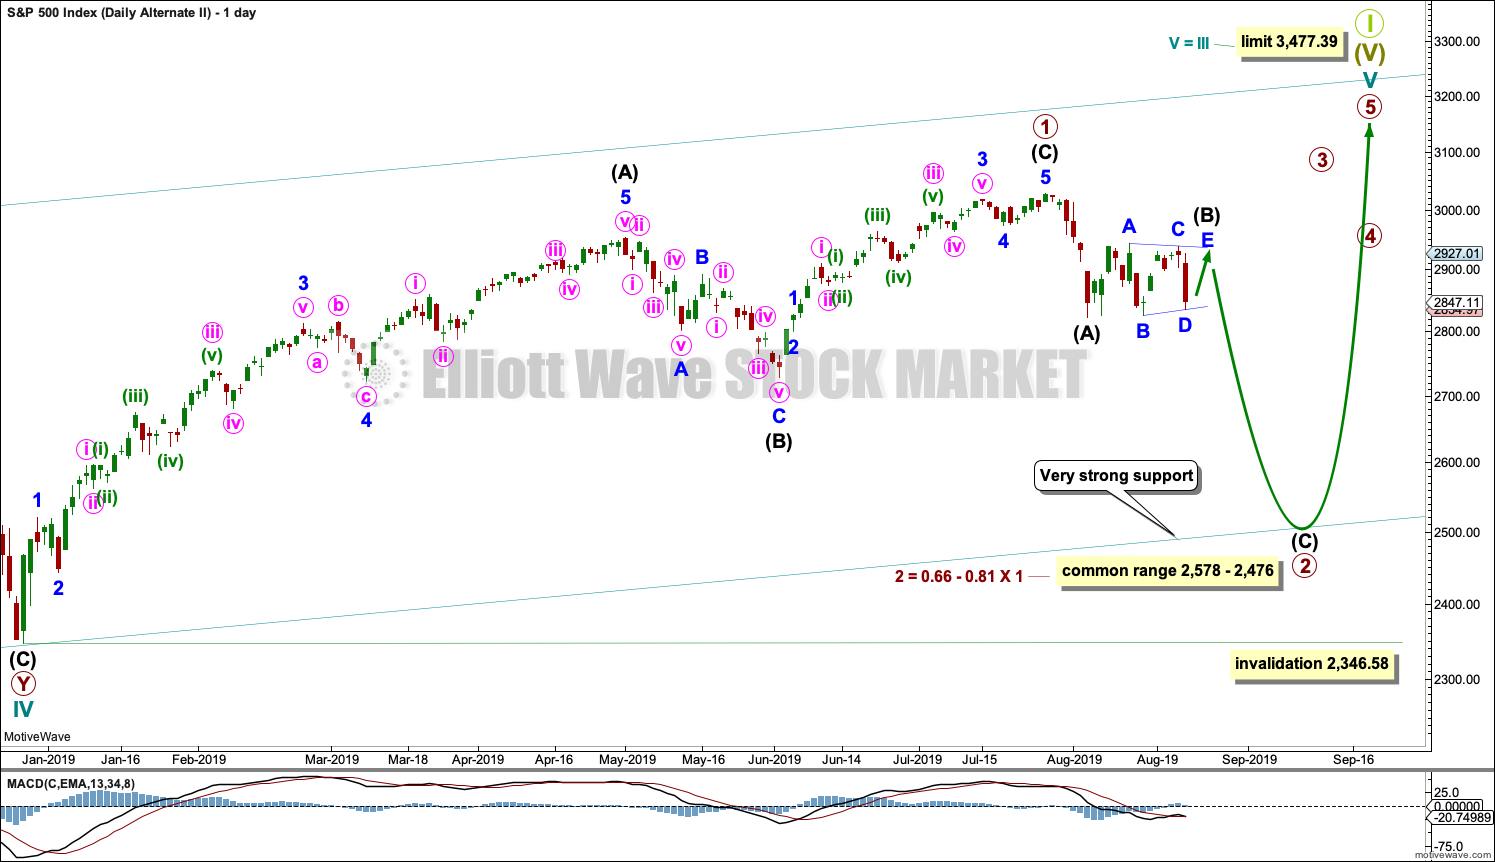
This second alternate daily chart considers the other structural possibility for cycle wave V, that of an ending diagonal.
All sub-waves within an ending diagonal must subdivide as zigzags. Primary wave 1 may have been complete as a zigzag at the last all time high on the 26th of July.
Primary wave 2 may be continuing lower as a zigzag. Within the zigzag, intermediate wave (B) may be completing as a sideways triangle.
Within diagonals, sub-waves 2 and 4 are normally very deep, ending within a range of 0.66 to 0.81 the prior wave. This range for primary wave 2 is from 2,578 to 2,476. Primary wave 2 may possibly come as low as the lower edge of the teal channel, which is copied over from the weekly chart.
Primary wave 2 may not move beyond the start of primary wave 1 below 2,346.58.
SECOND WAVE COUNT
WEEKLY CHART
Click chart to enlarge.
This weekly chart is almost identical to the first weekly chart, with the sole exception being the degree of labelling.
This weekly chart moves the degree of labelling for the impulse beginning in March 2009 all down one degree. This difference is best viewed on monthly charts.
The impulse is still viewed as nearing an end; a fifth wave is still seen as needing to complete higher. This wave count labels it primary wave 5.
TECHNICAL ANALYSIS
WEEKLY CHART
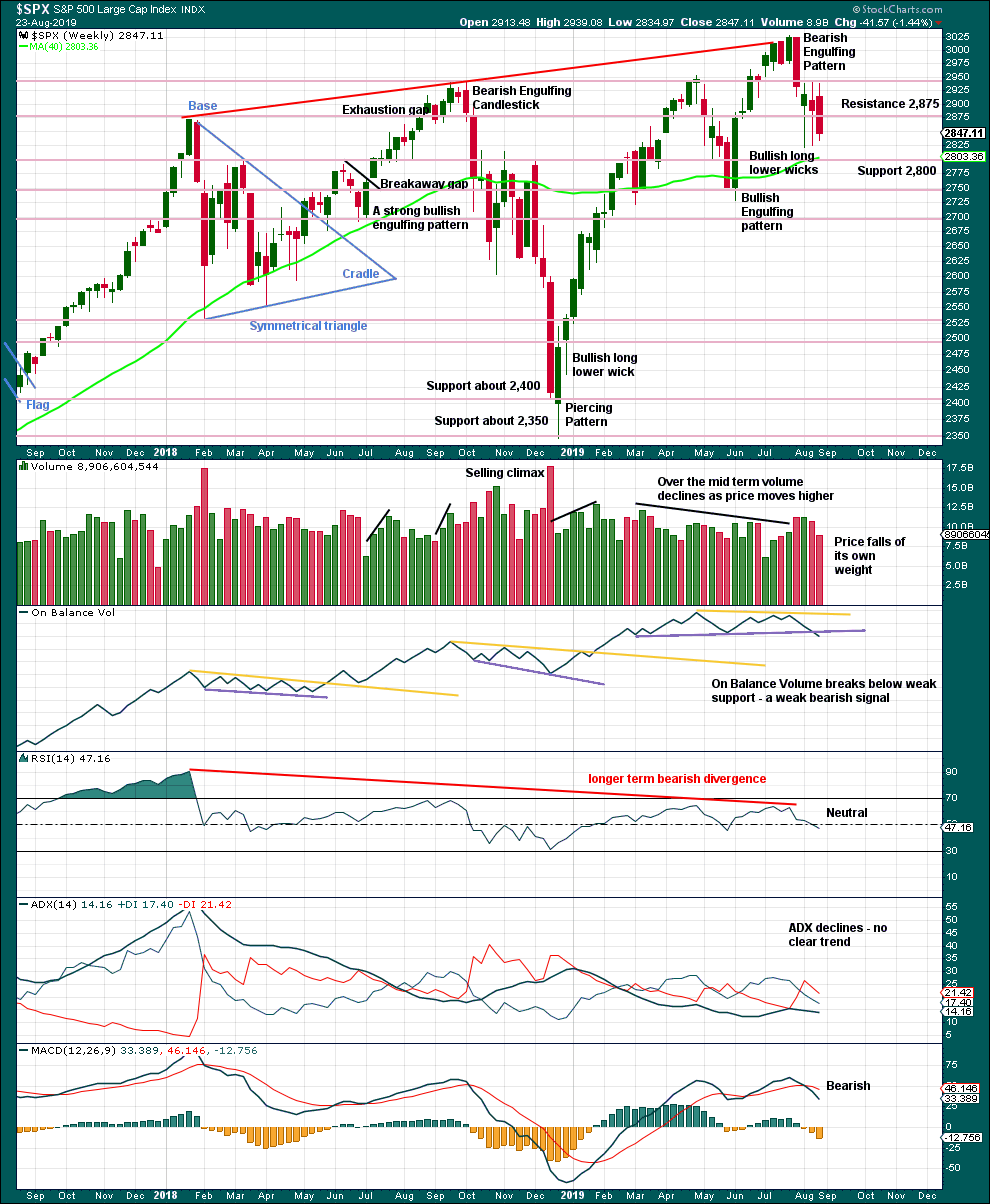
Click chart to enlarge. Chart courtesy of StockCharts.com.
Currently, price is range bound with resistance about 2,945 and support about 2,920.
The larger trend is up from the low in December 2018, with a series of higher highs and higher lows. This upwards trend should be assumed to remain while the last swing low at 2,728.81 remains intact.
The signal from On Balance Volume favours the alternate daily Elliott wave counts.
DAILY CHART
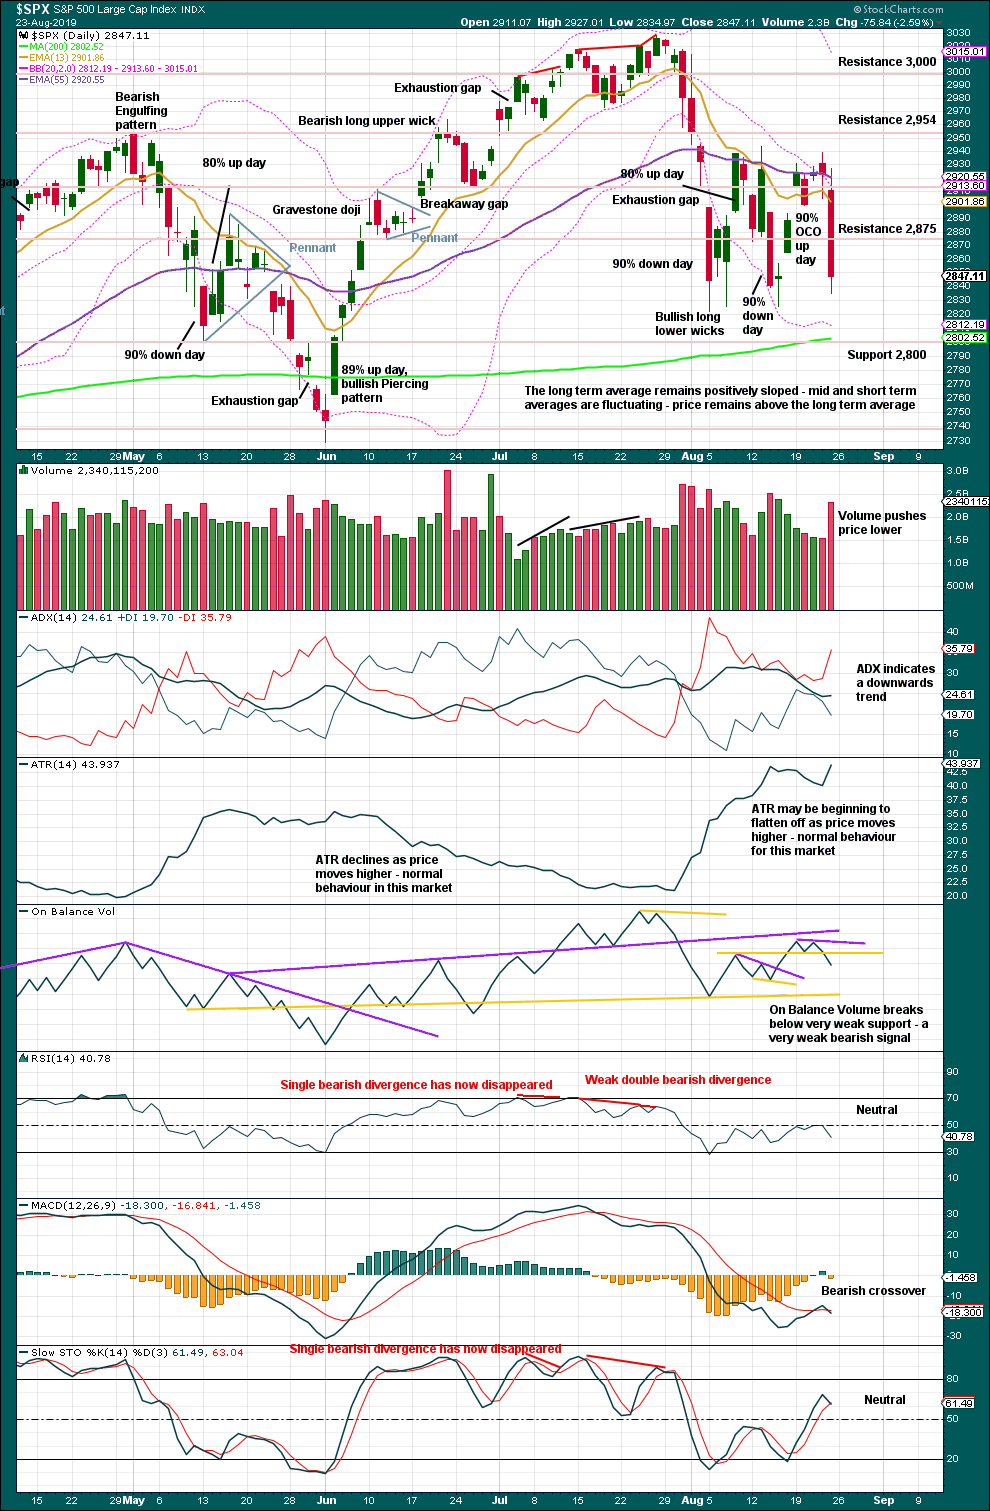
Click chart to enlarge. Chart courtesy of StockCharts.com.
The last low of the 15th of August was preceded immediately by a 90% downward day and followed immediately by a 90% OCO (Operating Companies Only) up day. This is a pattern commonly found at major lows, and it indicates a 180 degree shift in sentiment from bearish to bullish. This favours the main Elliott wave count.
BREADTH – AD LINE
WEEKLY CHART
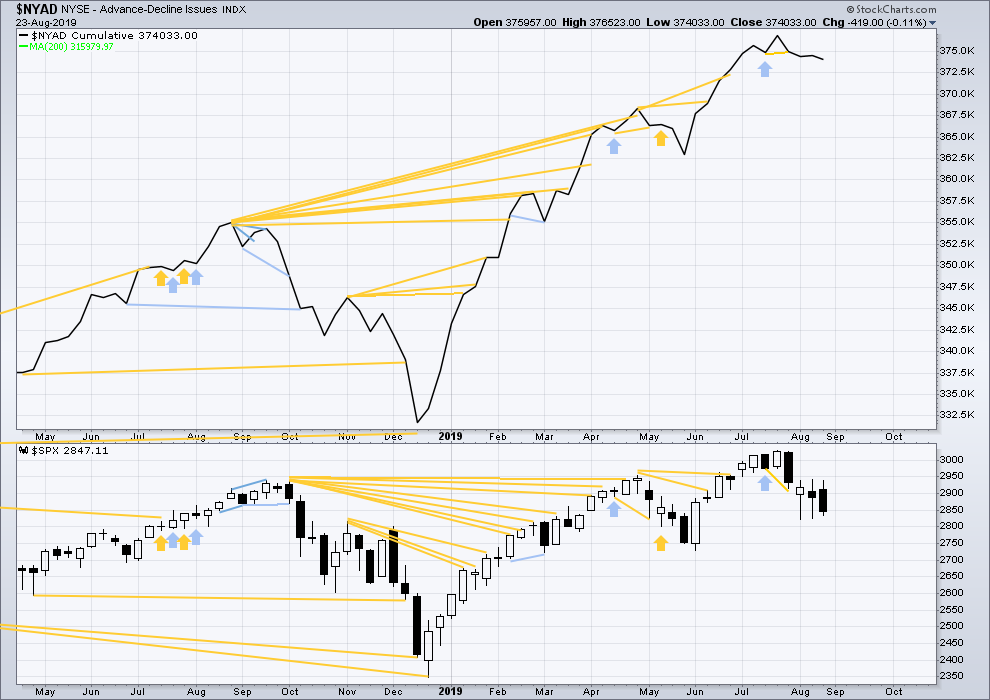
Click chart to enlarge. Chart courtesy of StockCharts.com. So that colour blind members are included, bearish signals
will be noted with blue and bullish signals with yellow.
Bear markets from the Great Depression and onwards have been preceded by an average minimum of 4 months divergence between price and the AD line with only two exceptions in 1946 and 1976. With the AD line making new all time highs again recently, the end of this bull market and the start of a new bear market is very likely a minimum of 4 months away, which is mid November 2019.
In all bear markets in the last 90 years there is some positive correlation (0.6022) between the length of bearish divergence and the depth of the following bear market. No to little divergence is correlated with more shallow bear markets. Longer divergence is correlated with deeper bear markets.
If a bear market does develop here, it comes after no bearish divergence. It would therefore more likely be shallow.
This week price moved sideways with a red candlestick and the balance of volume downwards. The AD line has slightly declined. There is no new short-term divergence.
DAILY CHART
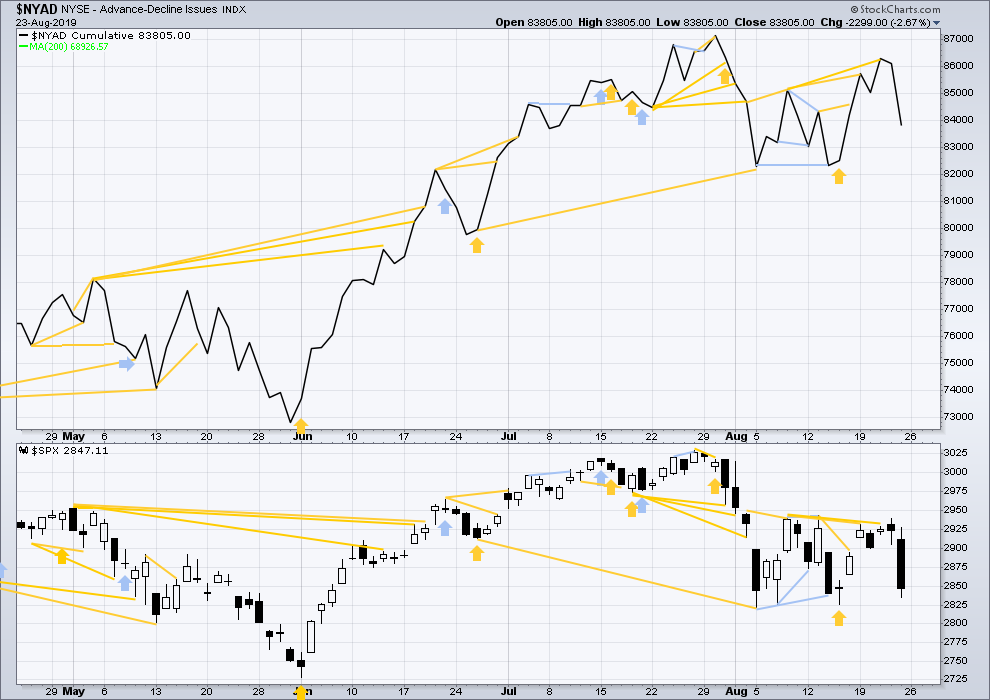
Click chart to enlarge. Chart courtesy of StockCharts.com. So that colour blind members are included, bearish signals
will be noted with blue and bullish signals with yellow.
Breadth should be read as a leading indicator.
The AD line has made another new high above the prior high of the 13th of August, but price has not. This divergence is bullish and still supports the main Elliott wave count.
Today both price and the AD line have moved lower but neither have made new short-term swing lows below the prior low of the 15th of August. There is no new short-term divergence.
VOLATILITY – INVERTED VIX CHART
WEEKLY CHART

Click chart to enlarge. Chart courtesy of StockCharts.com. So that colour blind members are included, bearish signals
will be noted with blue and bullish signals with yellow.
The all time high for inverted VIX (which is the same as the low for VIX) was on 30th October 2017. There is now nearly one year and nine months of bearish divergence between price and inverted VIX.
The rise in price is not coming with a normal corresponding decline in VIX; VIX remains elevated. This long-term divergence is bearish and may yet develop further as the bull market matures.
This divergence may be an early warning, a part of the process of a top developing that may take years. It may not be useful in timing a trend change.
This week price moved lower within the week. Inverted VIX has made a new swing low below the prior low of the week of the 28th of May, but price has not. This divergence is bearish and supports the alternate Elliott wave counts; but because it is not confirmed by the AD line, it is given little weight in this analysis. Note that this happened recently with prior divergence between swing lows, which was shortly after followed by upwards movement to the last all time high.
DAILY CHART
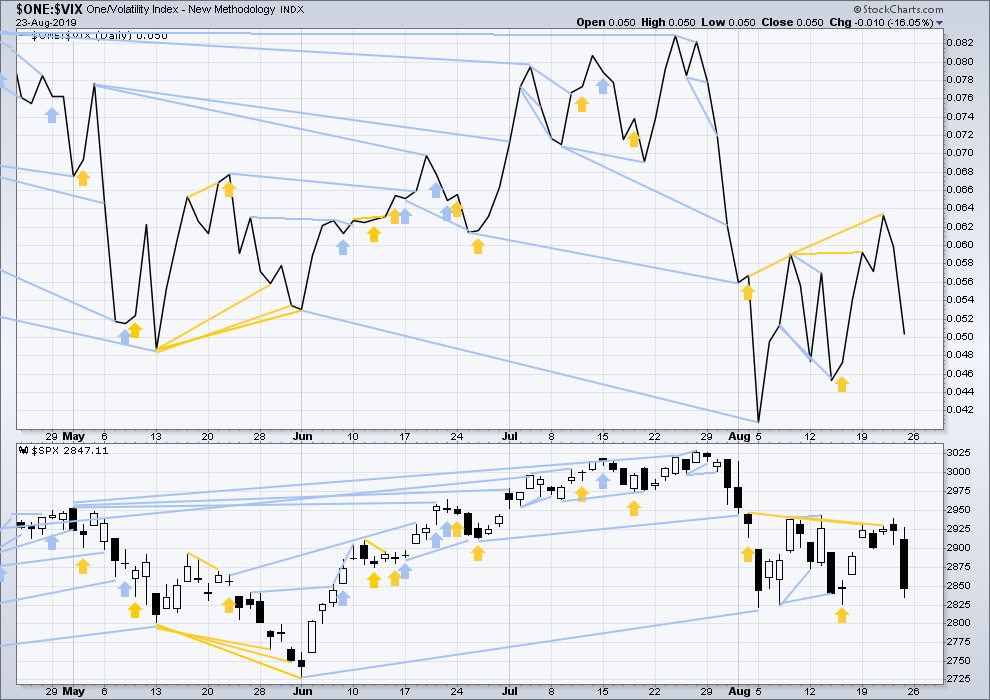
Click chart to enlarge. Chart courtesy of StockCharts.com. So that colour blind members are included, bearish signals
will be noted with blue and bullish signals with yellow.
Inverted VIX made a new high above the prior high of the 13th of August, but price has not. This divergence is still bullish and confirms the bullish signal from the AD line. This supports the main Elliott wave count.
For Friday both inverted VIX and price have moved lower. Neither have made new short-term swing lows below the prior lows of the 15th of August. There is no new divergence.
DOW THEORY
Dow Theory confirmed a bear market in December 2018. This does not necessarily mean a bear market at Grand Super Cycle degree though; Dow Theory makes no comment on Elliott wave counts. On the 25th of August 2015 Dow Theory also confirmed a bear market. The Elliott wave count sees that as part of cycle wave II. After Dow Theory confirmation of a bear market in August 2015, price went on to make new all time highs and the bull market continued.
DJIA: 23,344.52 – a close on the 19th of December at 23,284.97 confirms a bear market.
DJT: 9,806.79 – price has closed below this point on the 13th of December.
S&P500: 2,532.69 – a close on the 19th of December at 2,506.96 provides support to a bear market conclusion.
Nasdaq: 6,630.67 – a close on the 19th of December at 6,618.86 provides support to a bear market conclusion.
With all the indices having moved higher following a Dow Theory bear market confirmation, Dow Theory would confirm a bull market if the following highs are made:
DJIA: 26,951.81 – a close above this point has been made on the 3rd of July 2019.
DJT: 11,623.58 – to date DJT has failed to confirm an ongoing bull market.
S&P500: 2,940.91 – a close above this point was made on the 29th of April 2019.
Nasdaq: 8,133.30 – a close above this point was made on the 26th of April 2019.
GOLD
For the short term, upwards movement to at least 1,528.20 was expected. The high for Friday at 1,528.68 meets this expectation perfectly.
Summary: A classic analysis target using the pennant pattern is at 1,660. Friday broke above the upper edge of the pennant with support from volume. So far this looks like a classic upwards breakout.
The bearish Elliott wave count expects the consolidation is now over and a final fifth wave up has begun. The first target is new at 1,543. If price keeps rising through this first target, the next target is at 1,572.
The bullish Elliott wave count expects this consolidation may continue for another couple of weeks or so. It may be relatively shallow and may include a new high above 1,533.34. After an upwards breakout, the target would be at 1,693.
Grand SuperCycle analysis is here.
Monthly charts were last published here with video here.
BEARISH ELLIOTT WAVE COUNT
WEEKLY CHART
Click chart to enlarge.
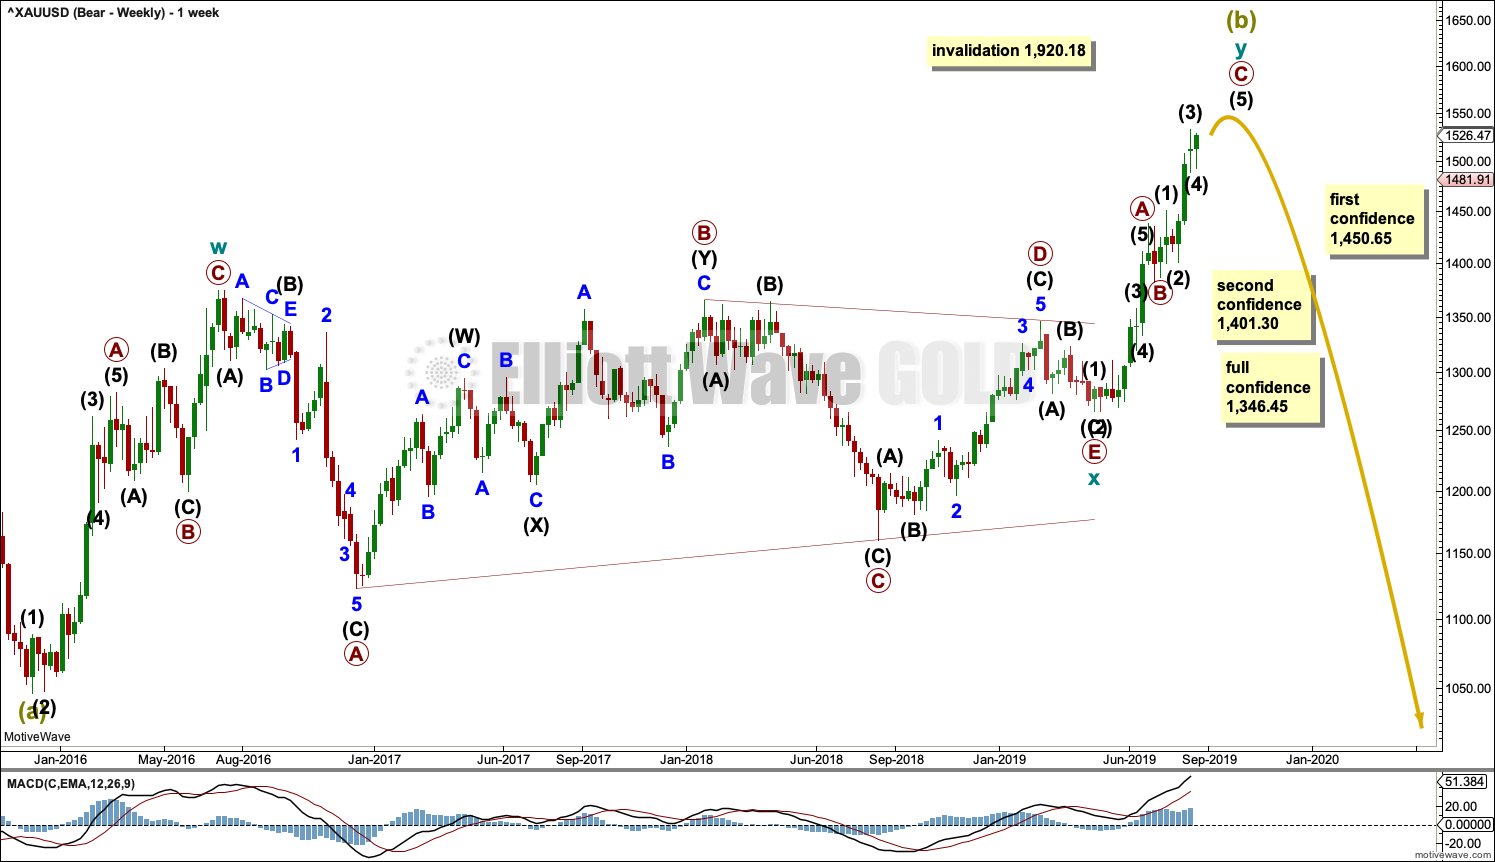
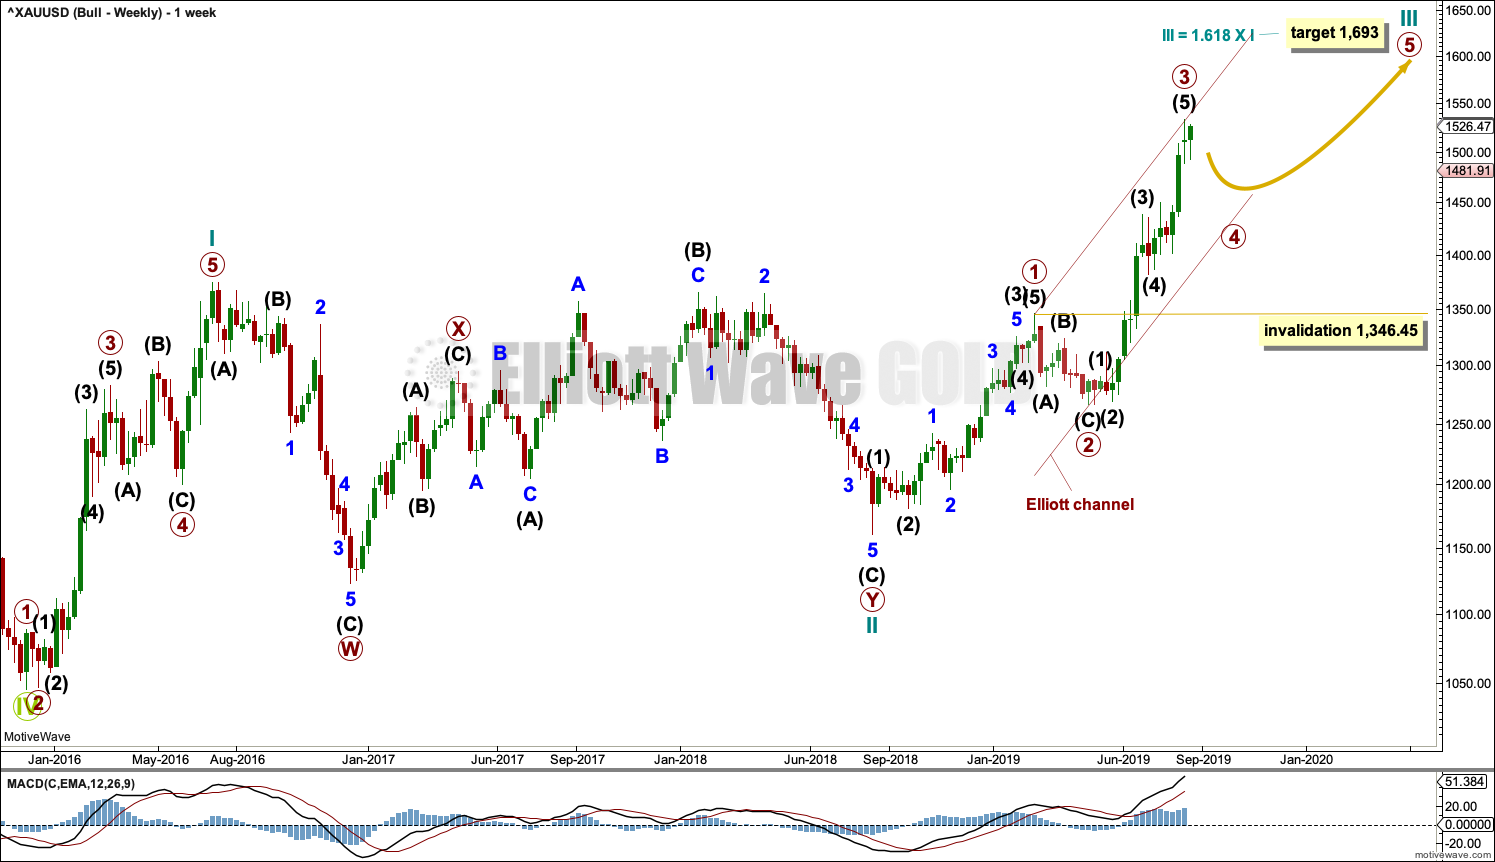
It is possible that Super Cycle wave (b) is completing as a double zigzag.
The first zigzag in the double is labelled cycle wave w. The double is joined by a three in the opposite direction, a triangle labelled cycle wave x. The second zigzag in the double is labelled cycle wave y.
Cycle wave y now fits best as an incomplete zigzag.
The purpose of the second zigzag in a double is to deepen the correction. Cycle wave y has achieved this purpose.
1,450.65 is the high of intermediate wave (1) within primary wave C. A new low below 1,450.65 could not be part of intermediate wave (4), so at that stage the structure of primary wave C would have to be compete. A new low below 1,450.65 would add some confidence in a trend change.
1,401.30 is the start of primary wave C. A new low below this point could not be a second wave correction within primary wave C, so at that stage primary wave C would be confirmed as over.
A new low below 1,346.45 would invalidate the bullish wave count below and add confidence to a bearish wave count.
Two daily charts below look at the zigzag of cycle wave y in two different ways.
DAILY CHART
Click chart to enlarge.
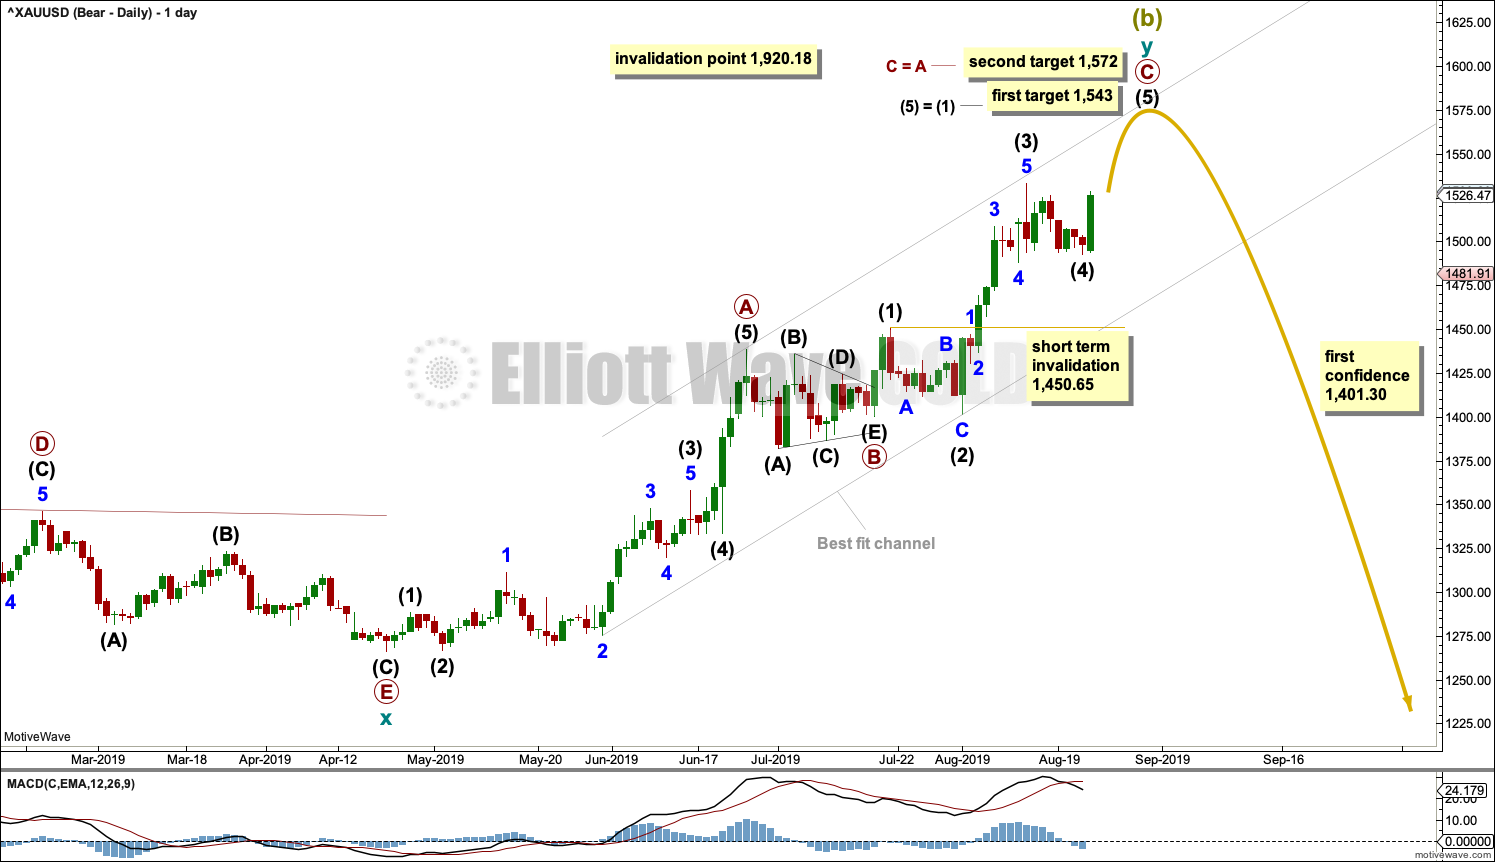
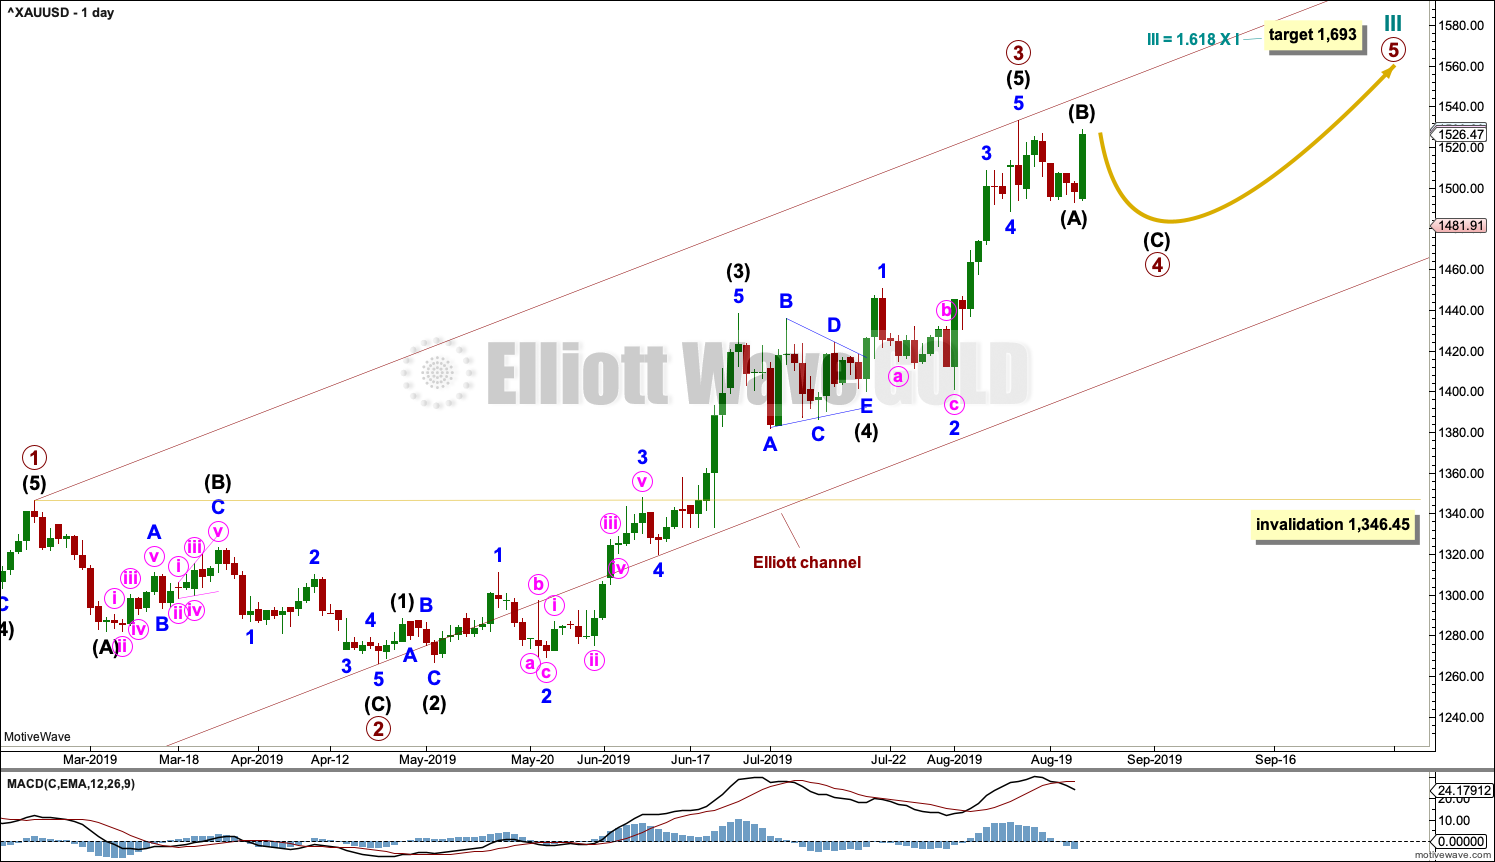
Within cycle wave y, the triangle that ended on the 17th of July may have been primary wave B. Primary wave C may have begun there. Primary wave C must subdivide as a five wave structure; it may be completing as an impulse.
Within primary wave C, intermediate waves (1) through to (4) may now all be complete. Intermediate wave (3) for this wave count is just 0.33 longer than 2.618 the length of intermediate wave (1).
There is now very good proportion between intermediate waves (2) and (4). Intermediate wave (2) is a very deep 0.98 zigzag lasting nine sessions, and intermediate wave (4) is a shallow 0.31 zigzag lasting seven sessions. Alternation in depth and not structure is acceptable. A zigzag is the most common corrective structure.
Two targets are now calculated for Super Cycle wave (b) to end. The first target expects intermediate wave (5) to exhibit the most common Fibonacci ratio to intermediate wave (1). If price gets to the first target and either the structure of intermediate wave (5) is incomplete or if price keeps rising, then the second target may be used. The second target expects primary wave C to exhibit the most common Fibonacci ratio to primary wave A.
ALTERNATE DAILY CHART
Today the alternate bearish wave count is discarded based upon a low probability.
BULLISH ELLIOTT WAVE COUNT
WEEKLY CHART
Click chart to enlarge.
This wave count sees the the bear market complete at the last major low for Gold in November 2015.
If Gold is in a new bull market, then it should begin with a five wave structure upwards on the weekly chart. However, the biggest problem with this wave count is the structure labelled cycle wave I because this wave count must see it as a five wave structure, but it looks more like a three wave structure.
Commodities often exhibit swift strong fifth waves that force the fourth wave corrections coming just prior and just after to be more brief and shallow than their counterpart second waves. It is unusual for a commodity to exhibit a quick second wave and a more time consuming fourth wave, and this is how cycle wave I is labelled. This wave count still suffers from this very substantial problem, and for this reason the bearish wave count is still considered because it has a better fit in terms of Elliott wave structure.
Cycle wave II subdivides well as a double combination: zigzag – X – expanded flat.
Cycle wave III may have begun. Within cycle wave III, primary waves 1 and 2 may now be complete. Primary wave 3 has now moved above the end of primary wave 1 meeting a core Elliott wave rule. It has now moved far enough to allow room for primary wave 4 to unfold and remain above primary wave 1 price territory. Primary wave 4 may not move into primary wave 1 price territory below 1,346.45.
Cycle wave III so far for this wave count would have been underway now for 53 weeks. It is beginning to exhibit some support from volume and increasing ATR. This wave count now has some support from classic technical analysis.
The channel drawn about cycle wave III is an Elliott channel. Primary wave 4 may find support about the lower edge if it is time consuming enough.
DAILY CHART
Click chart to enlarge.
Primary wave 3 may now be a complete impulse. The structure of intermediate wave (5) is now complete.
Primary wave 4 may not move into primary wave 1 price territory below 1,346.45.
Primary wave 4 may last about four to ten weeks. It may unfold as any one of more than 23 possible Elliott wave corrective structures. Primary wave 4 may end within the price territory of the fourth wave of one lesser degree; intermediate wave (4) has its range from 1,438.43 to 1,382.10. It is also possible that it may be more shallow than this.
Within the price territory of intermediate wave (4), from 1,438.43 to 1,382.10, lies the 0.382 Fibonacci Ratio of primary wave 3 at 1,431.45. This is still a possible target for primary wave 4.
Primary wave 4 would most likely continue further in order for it to have some reasonable proportion to primary wave 2.
TECHNICAL ANALYSIS
WEEKLY CHART
Click chart to enlarge. Chart courtesy of StockCharts.com.
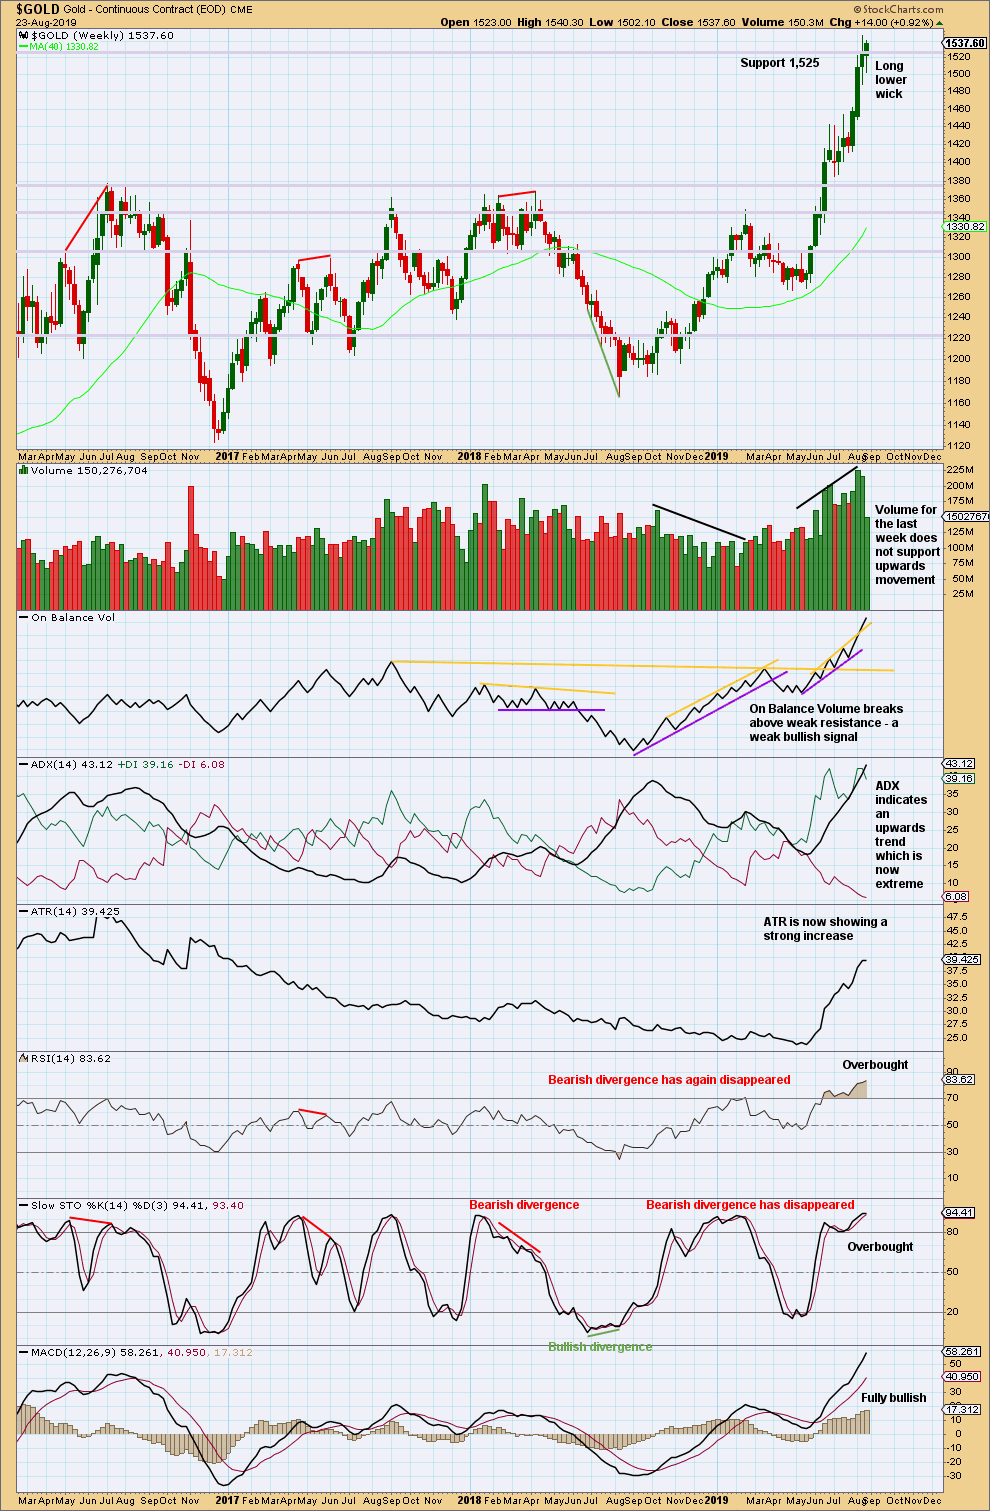
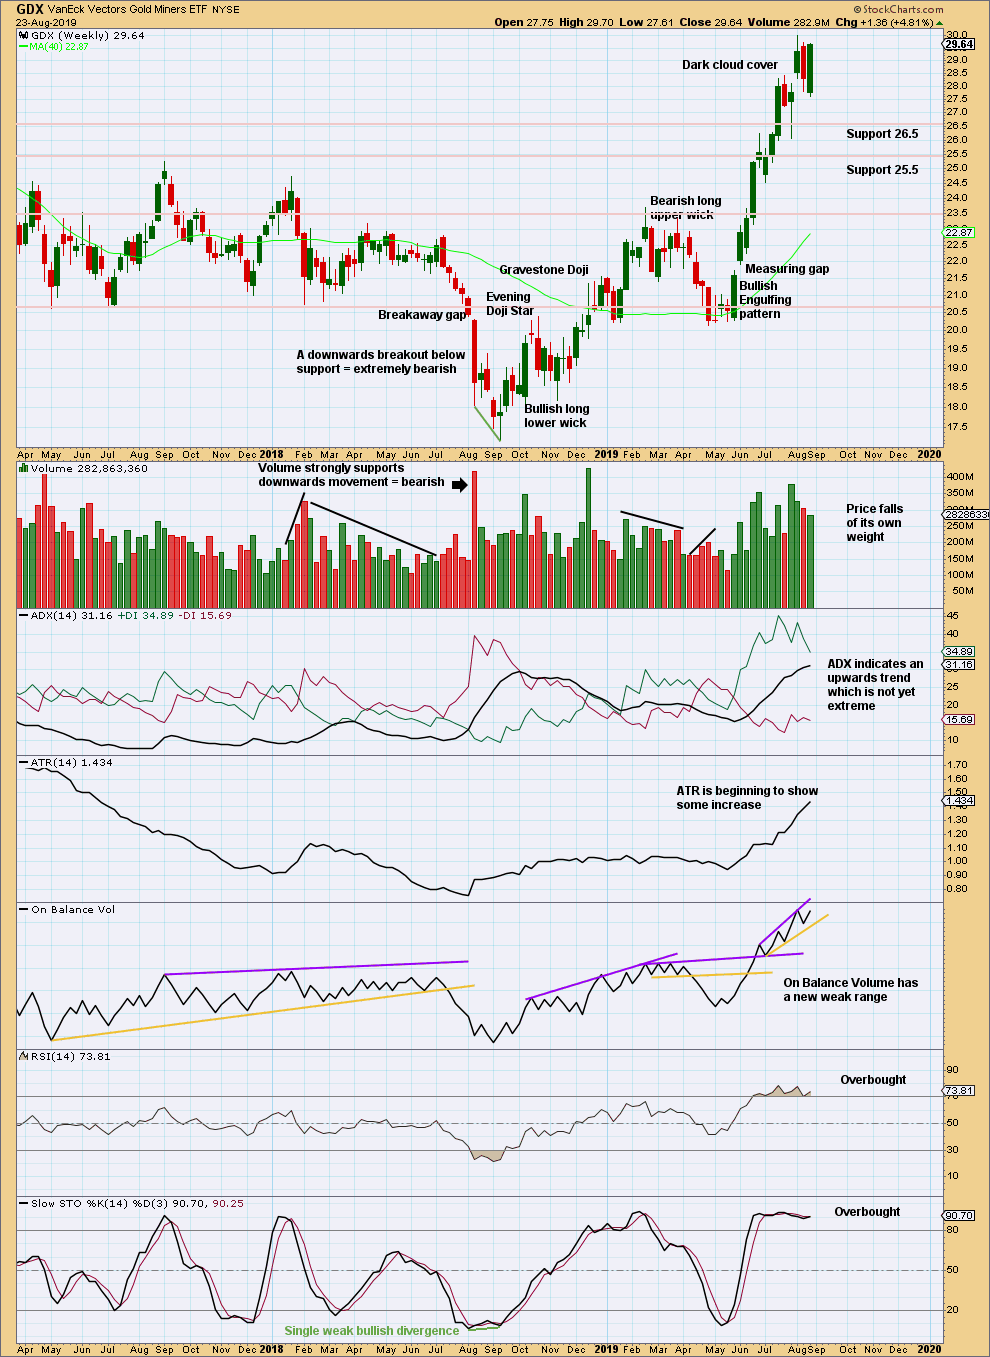
When trends for Gold reach extreme, they can continue still for a few weeks and price can continue for a considerable distance.
When both ADX and RSI reach extreme together, then that is sometimes where a trend ends.
RSI at overbought on the weekly chart is a warning to be cautious; the trend is overbought, but at this stage there is no evidence of a trend change.
The signal last week from On Balance Volume is weak because the resistance line breached has a strong slope and is not long held.
Although volume for the last week does not support upwards movement, this week it may be better to judge short-term volume at the daily chart level because much of the week was taken up by consolidation.
DAILY CHART
Click chart to enlarge. Chart courtesy of StockCharts.com.
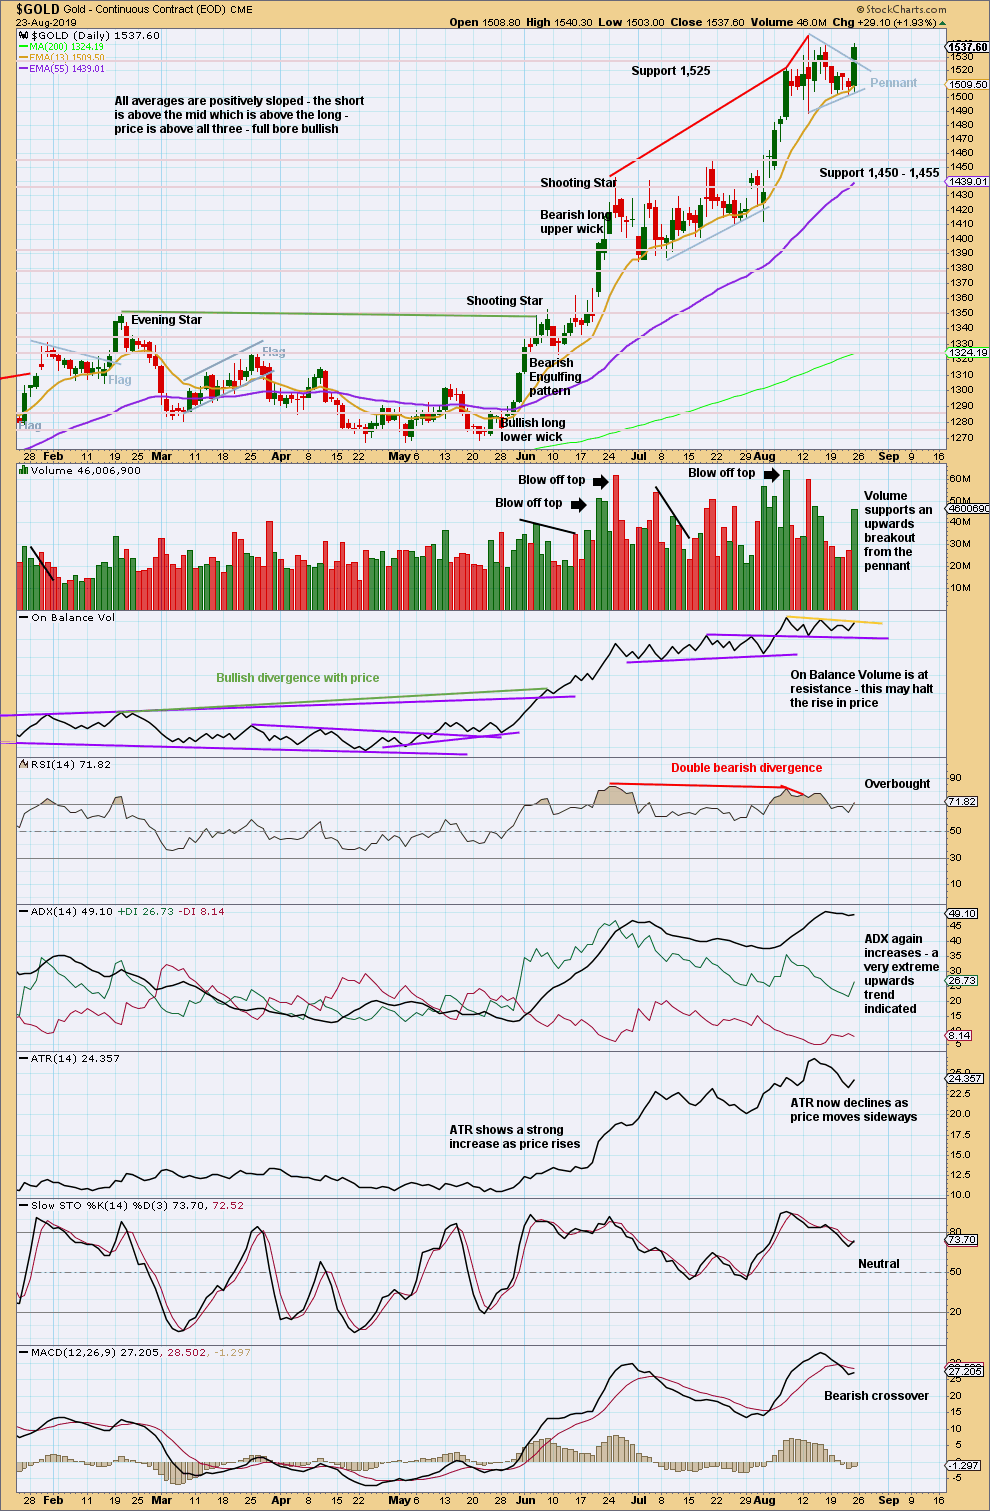
Friday has closed above the upper edge of the pennant pattern on an upwards day that has strong support from volume. This looks like a classic upwards breakout. The target from the flag pole of the pennant is 1,660.
The trend is very extreme, but there is still no evidence of a trend change. Extreme trends may continue for a reasonable distance and time before they end. But because conditions are very extreme it is absolutely essential that good risk management practices are followed. This trend may now end at any time.
GDX WEEKLY CHART
Click chart to enlarge. Chart courtesy of StockCharts.com.
The Bearish Engulfing pattern has been followed by what is technically a downwards week with a slightly lower low and lower high, but this last week has finished very strongly. It looks like the bearish implications of the engulfing pattern may be resolved. There is no evidence on this chart that there has been a trend change. An upwards trend remains intact.
GDX DAILY CHART
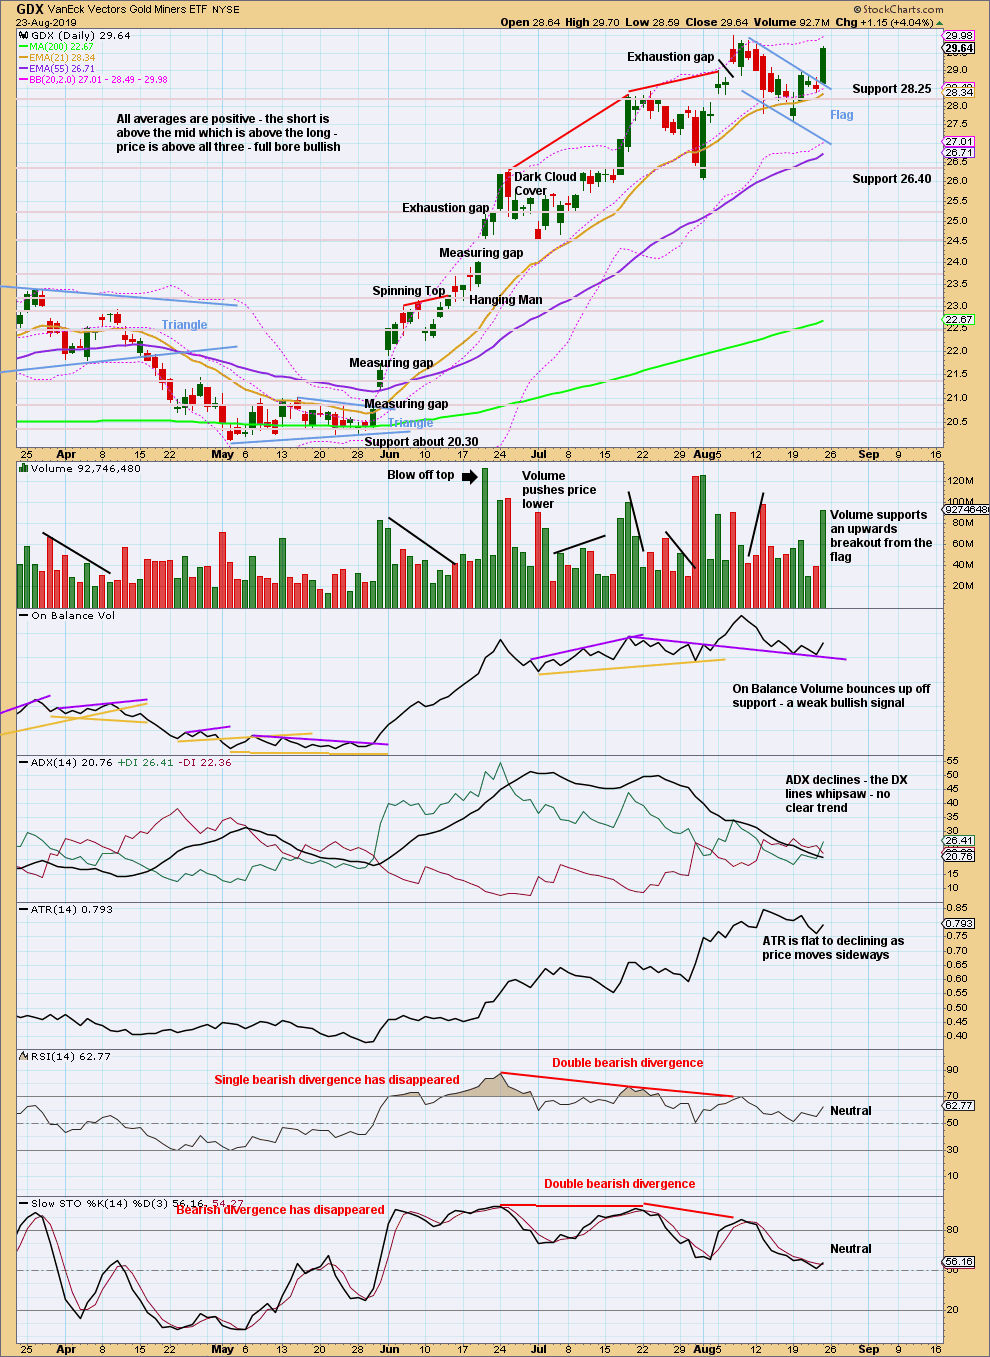
Click chart to enlarge. Chart courtesy of StockCharts.com.
The target using the flag pole is at 32.76.
US OIL
A small bounce within the week remained below the invalidation point and within the channel. Thereafter, downwards movement continued as expected.
Summary: A new mid-term target is now at 35.25 for a third wave down. This may exhibit an increase in momentum, and may end with a capitulation spike.
The final target is calculated at 10.72. Confidence in this target may be had if price makes a new low below 50.61.
The bullish alternate wave count would have confidence above 66.59. At that stage, a target for a third wave to end would be at 89.80.
MAIN ELLIOTT WAVE COUNT
MONTHLY CHART
Click chart to enlarge.
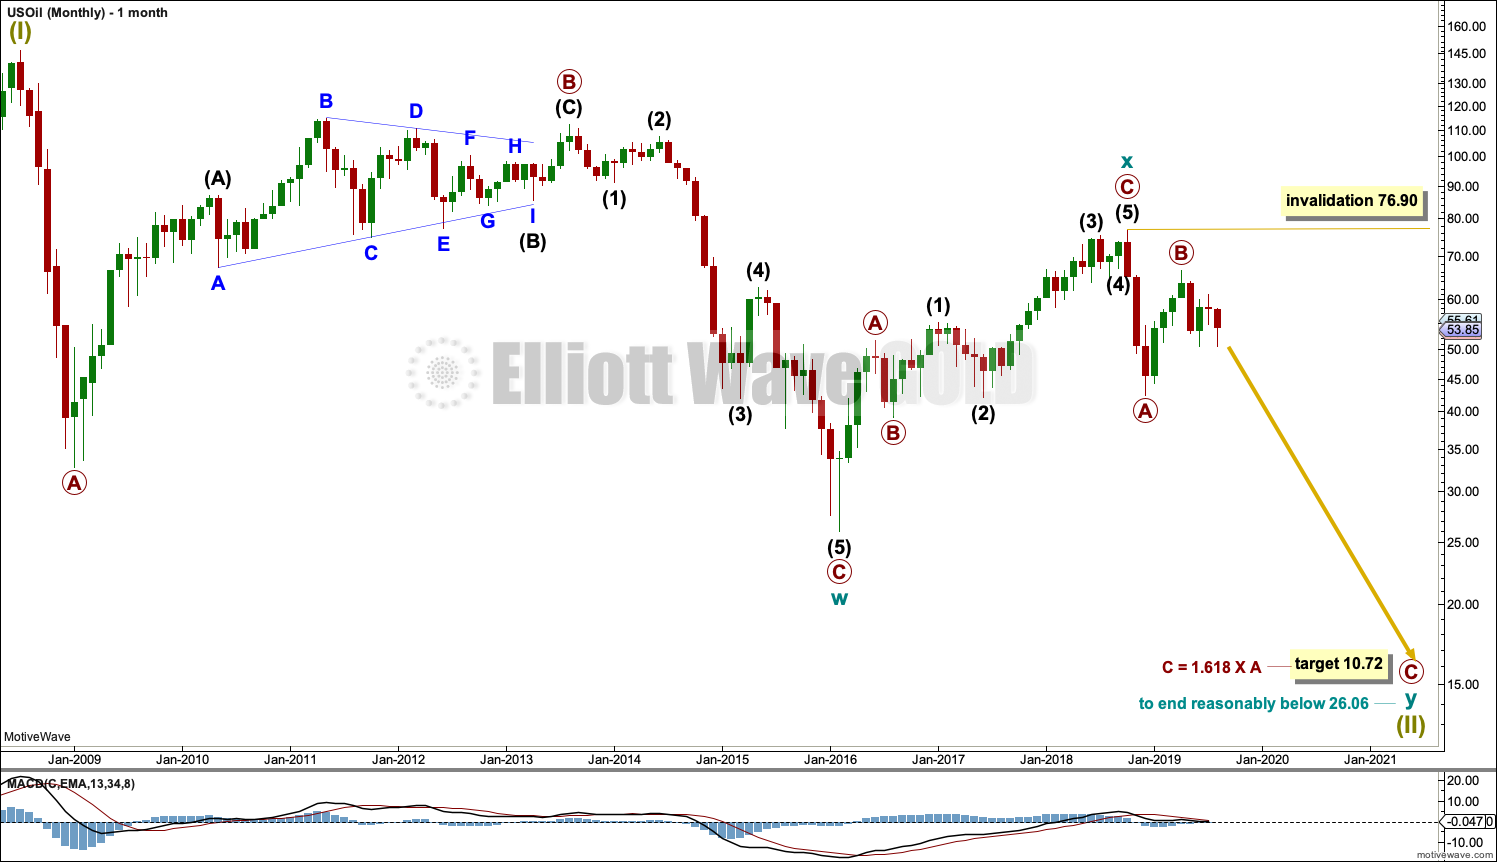
The basic Elliott wave structure is five steps forward and three steps back. This Elliott wave count expects that US Oil is still within a three steps back pattern, which began in July 2008. The Elliott wave count expects that the bear market for US Oil continues.
This Elliott wave corrective structure is a double zigzag, which is a fairly common structure. The correction is labelled Super Cycle wave (II).
The first zigzag in the double is complete and labelled cycle wave y. The double is joined by a three in the opposite direction labelled cycle wave x, which subdivides as a zigzag. The second zigzag in the double may now have begun, labelled cycle wave w.
The purpose of a second zigzag in a double zigzag is to deepen the correction when the first zigzag does not move price deep enough. To achieve this purpose cycle wave y may be expected to move reasonably below the end of cycle wave w at 26.06. The target calculated would see this expectation met.
Cycle wave y is expected to subdivide as a zigzag, which subdivides 5-3-5.
Cycle wave w lasted 7.6 years and cycle wave x lasted 2.7 years. Cycle wave y may be expected to last possibly about a Fibonacci 5 or 8 years.
If it continues higher, then primary wave B may not move beyond the start of primary wave A above 76.90.
WEEKLY CHART
Click chart to enlarge.
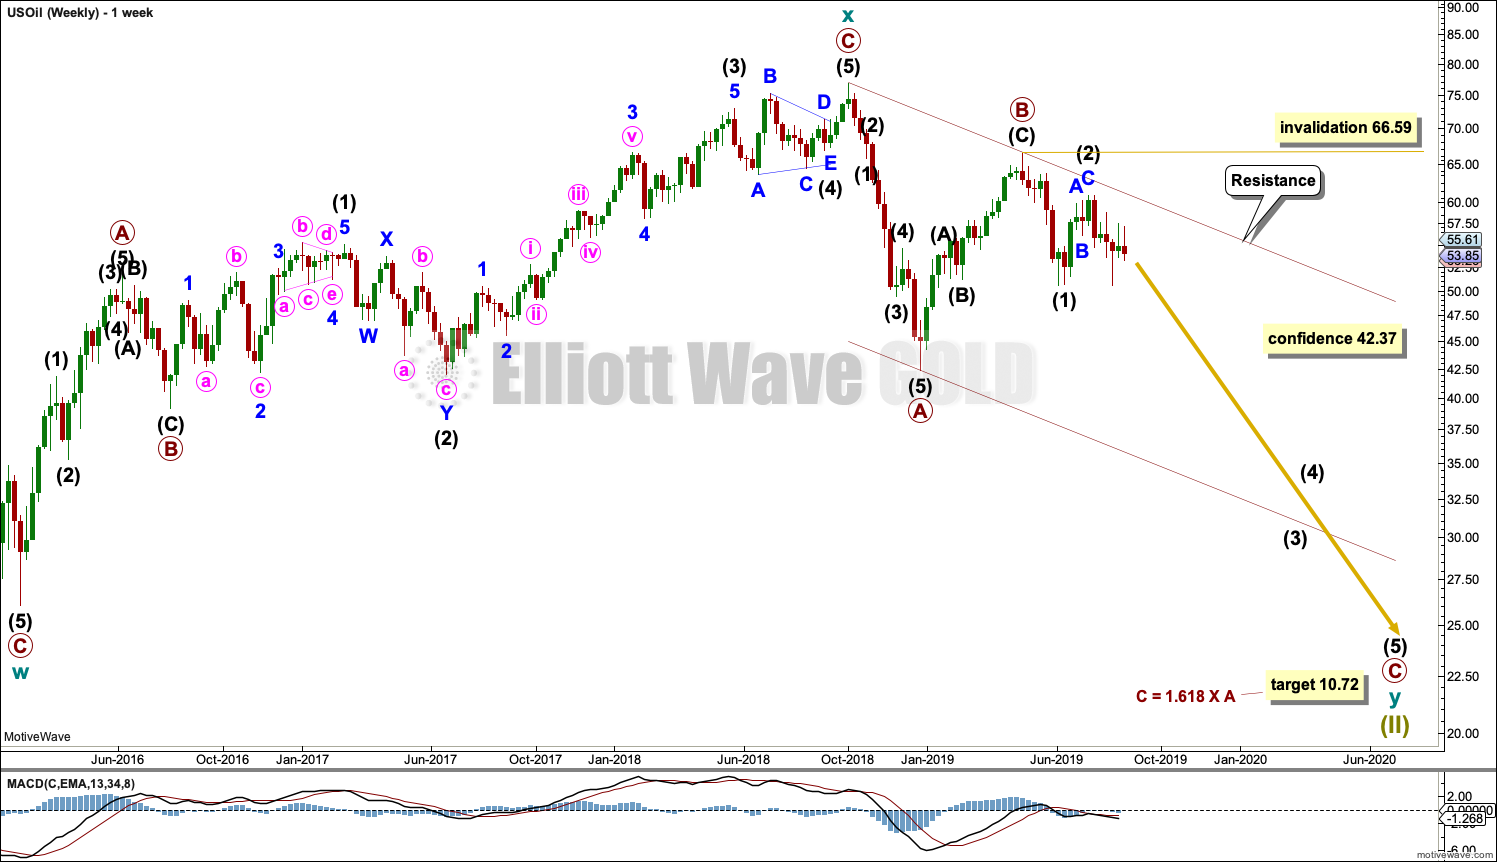
This weekly chart shows all of cycle waves x and y so far.
Cycle wave y is expected to subdivide as a zigzag. A zigzag subdivides 5-3-5. Primary wave A must subdivide as a five wave structure if this wave count is correct.
Primary wave A may be a complete five wave impulse at the last low.
Primary wave B may now be a complete single zigzag at the last high.
Primary wave C may have just begun. Primary wave C must subdivide as a five wave structure.
Primary wave A lasted 12 weeks, just one short of a Fibonacci 13.
Primary wave C may be longer in time as well as price. If cycle wave y lasts a Fibonacci 5 years, then primary wave C within it may take as long as a Fibonacci 233 weeks.
Intermediate wave (1) within primary wave C may be a complete impulse. Intermediate wave (2) may not move beyond the start of intermediate wave (1) above 66.59.
Draw a channel about the zigzag of primary wave y using Elliott’s technique for a correction. Draw the first trend line from the start of primary wave A to the end of primary wave B, then place a parallel copy on the end of primary wave A. The upper edge of this channel is so far showing where bounces along the way down find resistance. The lower edge of the channel may provide support.
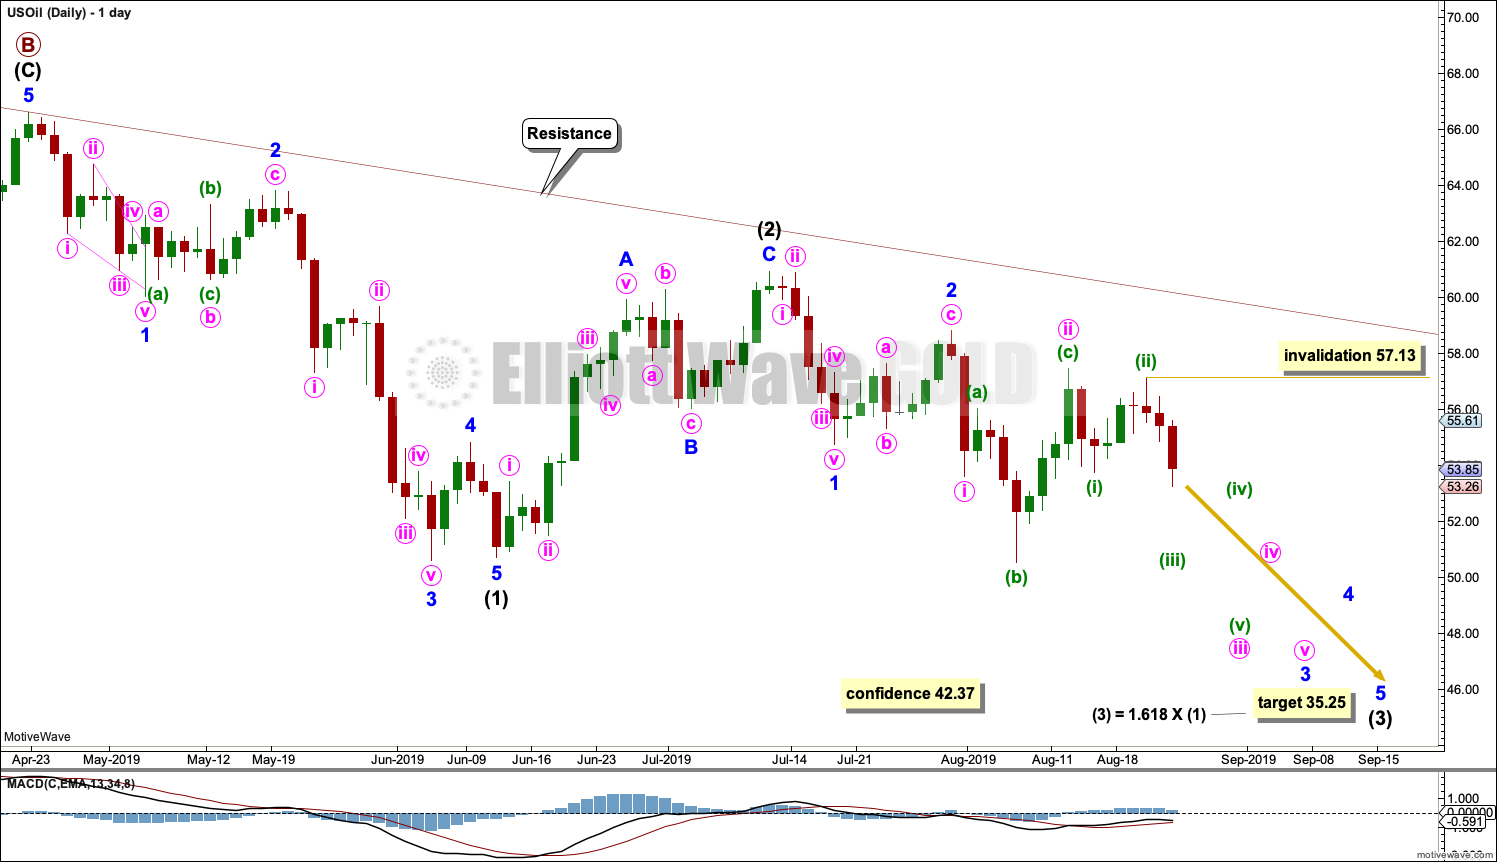
DAILY CHART
Click chart to enlarge.
Note that monthly and weekly charts are on a semi-log scale, but this daily chart is on an arithmetic scale. This makes a slight difference to trend channels.
It is possible that intermediate wave (1) is complete. Minor wave 4 for this wave count exhibits some alternation to minor wave 2; minor wave 2 may be a relatively deep zigzag or flat, and minor wave 4 may be a more shallow zigzag.
Minor wave 5 ends with a slight 0.11 truncation. Both Elliott wave counts must now accept this small truncation.
Intermediate wave (2) may also now be complete as a zigzag.
Intermediate wave (3) may only subdivide as an impulse, and it must move below the end of intermediate wave (1). Within intermediate wave (3), minor waves 1 and 2 may now be complete.
Minor wave 3 may only subdivide as an impulse. Within minor wave 3, minute waves i and ii may now be complete.
Minute wave iii may only subdivide as an impulse. Within minute wave iii, minuette waves (i) and (ii) may be complete. Within minuette wave (iii), no second wave correction may move beyond its start above 57.13.
The next downwards wave of minuette wave (iii) within minute wave iii within minor wave 3 within intermediate wave (3) may be expected to exhibit an increase in momentum and an increase in ATR. So far it has support this week from volume pushing price lower.
ALTERNATE ELLIOTT WAVE COUNT
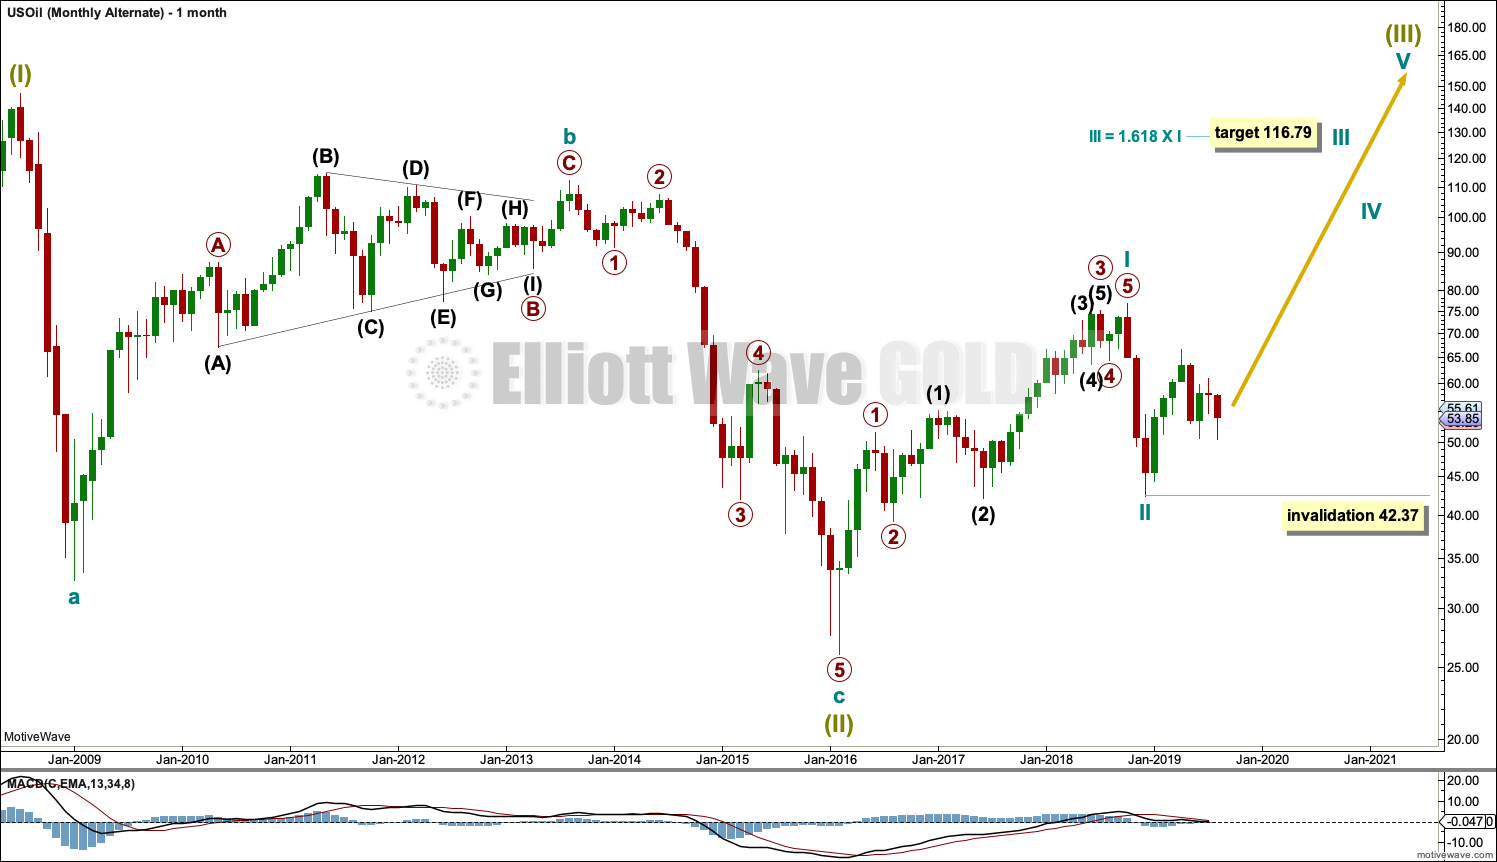
MONTHLY CHART
Click chart to enlarge.
It is possible that the bear market is over for Oil and a new bull market has begun.
For a bullish wave count for Oil, the upwards wave from the major low at 26.06 in February 2016 must be seen as a complete five wave impulse. This is labelled cycle wave I.
Cycle wave II may be a complete zigzag at 0.679 the depth of cycle wave I.
A target is calculated for cycle wave III to reach a common Fibonacci ratio to cycle wave I.
Within cycle wave III, no second wave correction may move beyond the start of its first wave below 42.37.
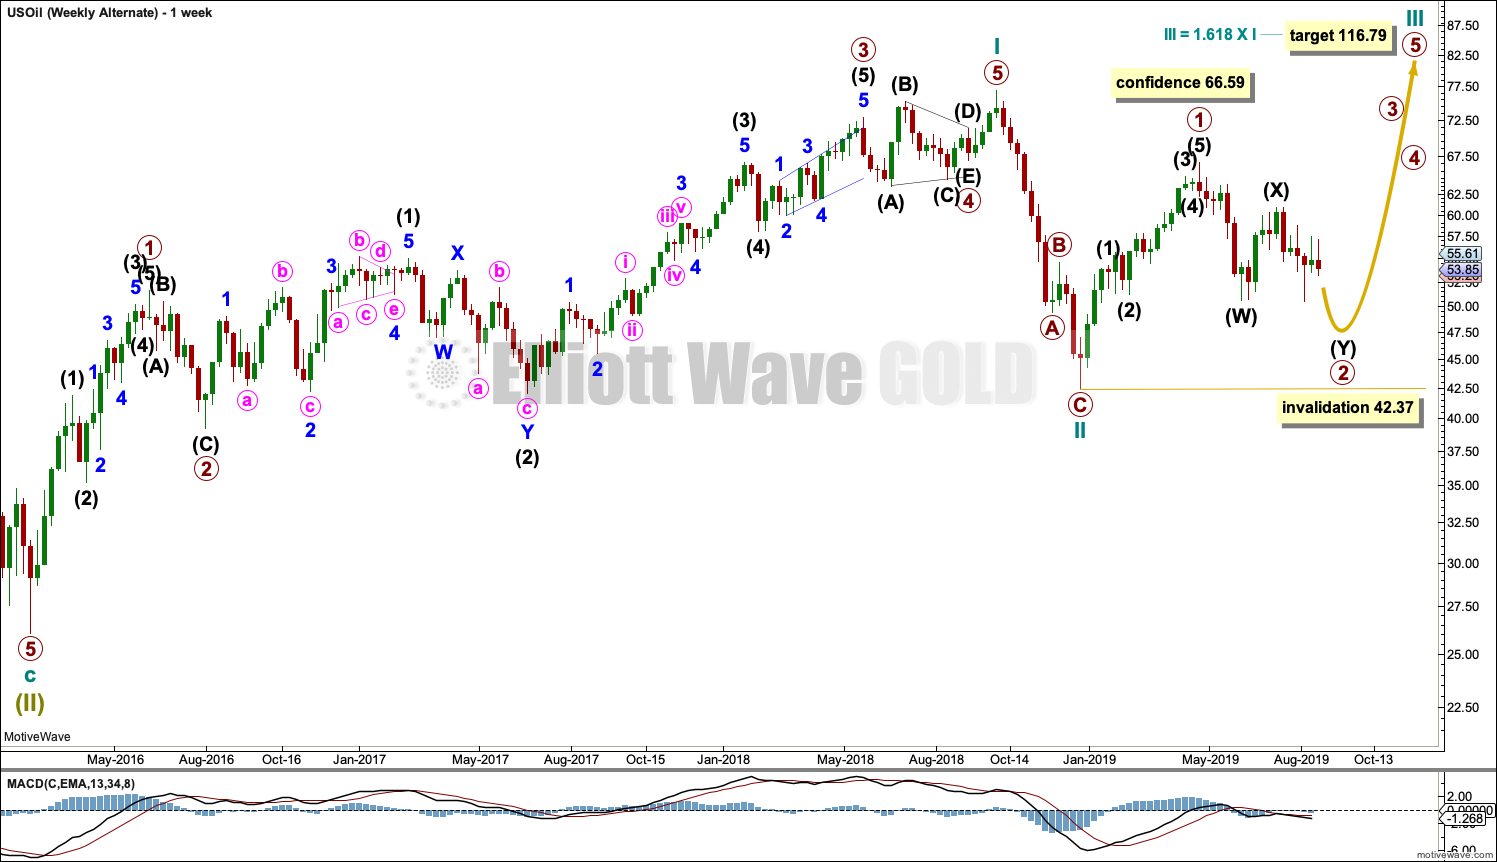
WEEKLY CHART
Click chart to enlarge.
This weekly chart shows detail of cycle wave I as a five wave impulse.
Cycle wave II does look best as a three. This is the only part of this wave count that has a better look than the main wave count, which sees this downwards wave as a five.
Cycle wave III may only subdivide as an impulse. Within cycle wave III, so far primary wave 1 may be complete. Primary wave 2 may be moving lower as a double zigzag. Primary wave 2 may not move beyond the start of primary wave 1 below 42.37.
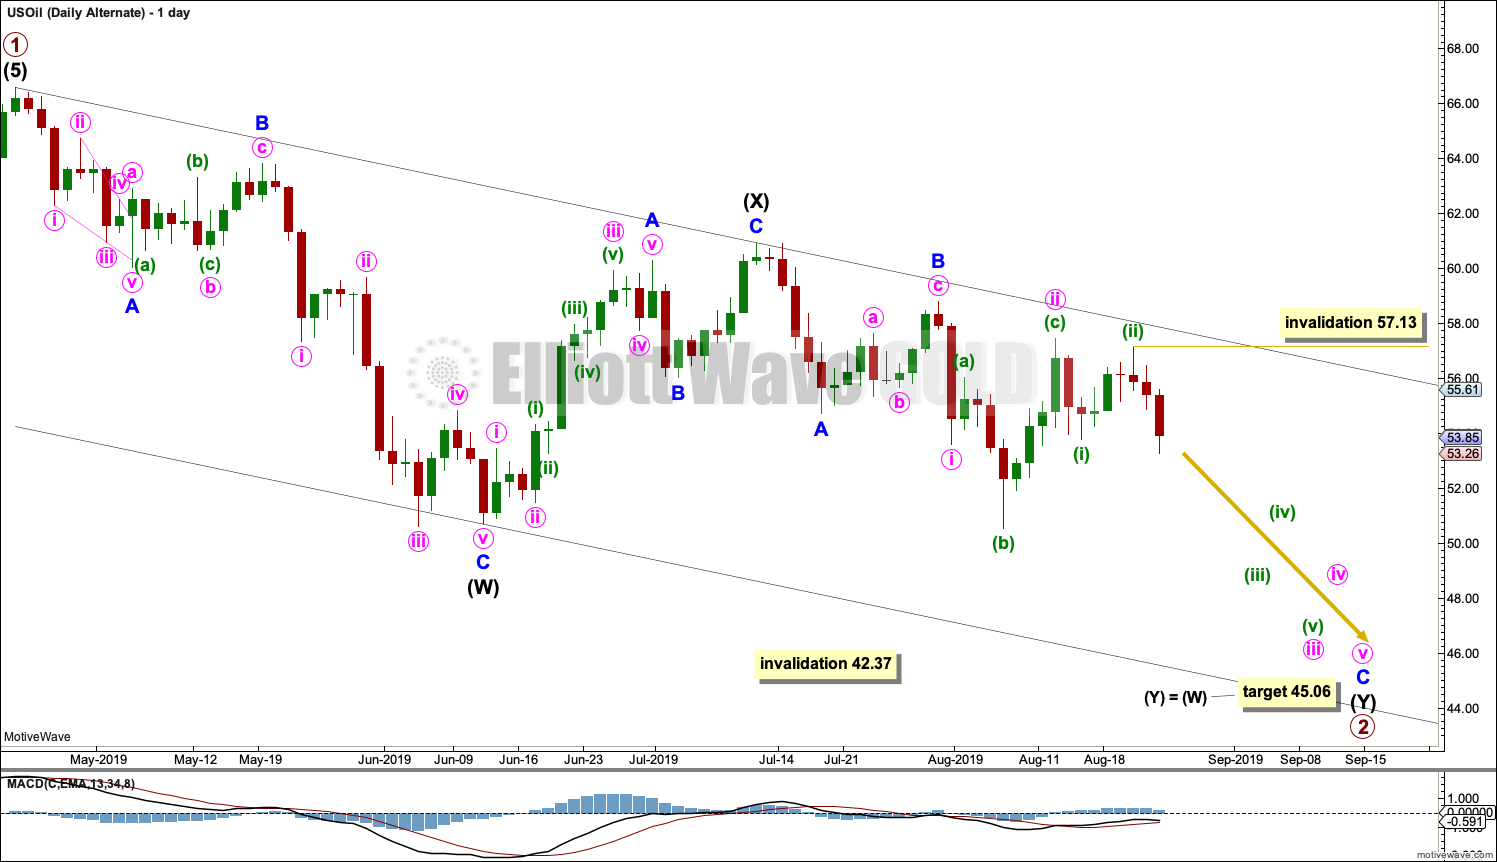
DAILY CHART
Click chart to enlarge.
Primary wave 2 may be continuing lower as a double zigzag.
The first zigzag in the double would be complete, labelled intermediate wave (W). Within intermediate wave (W), minor wave C ends with a slight truncation for minute wave v. This is acceptable.
The double may be now joined by a complete three in the opposite direction, a zigzag labelled intermediate wave (X).
A second zigzag may now unfold labelled intermediate wave (Y). Within intermediate wave (Y), minor waves A and B may be complete. Minor wave C must now complete lower as a five wave structure. Within minor wave C, minute waves i and ii may now be complete.
Minute wave iii may only subdivide as an impulse. Within minute wave iii, minuette waves (i) and (ii) may be complete. Within minuette wave (iii), no second wave correction may move beyond the start of its first wave above 57.13.
TECHNICAL ANALYSIS
MONTHLY CHART
Click chart to enlarge. Chart courtesy of StockCharts.com.
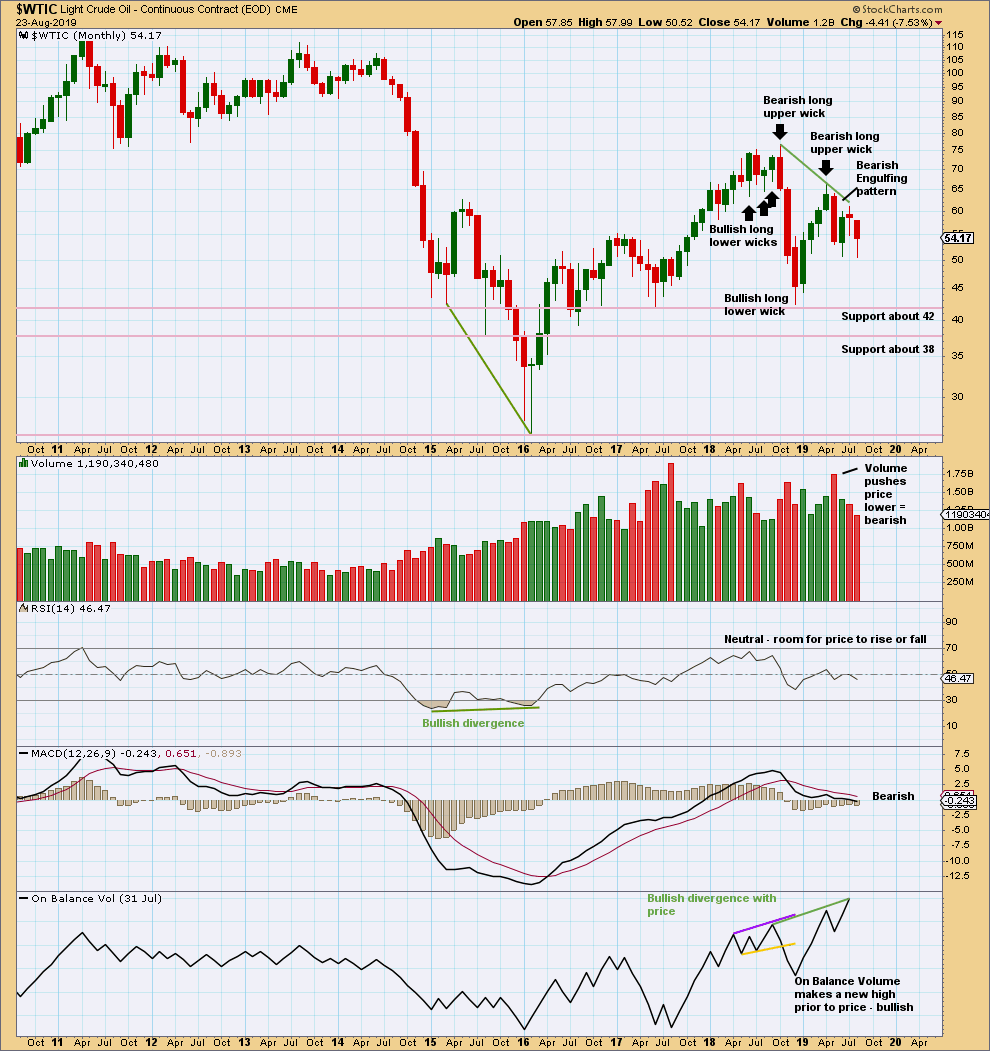
May has closed with a strong Bearish Engulfing candlestick pattern, which has strong support from volume. This supports the main Elliott wave count.
June moved price lower with a lower low and a lower high, but the candlestick closed green and the balance of volume was upwards. Upwards movement within the month did not have support from volume. This also supports the main Elliott wave count.
There is now double bullish divergence between price and On Balance Volume. This supports the alternate Elliott wave count.
WEEKLY CHART
Click chart to enlarge. Chart courtesy of StockCharts.com.
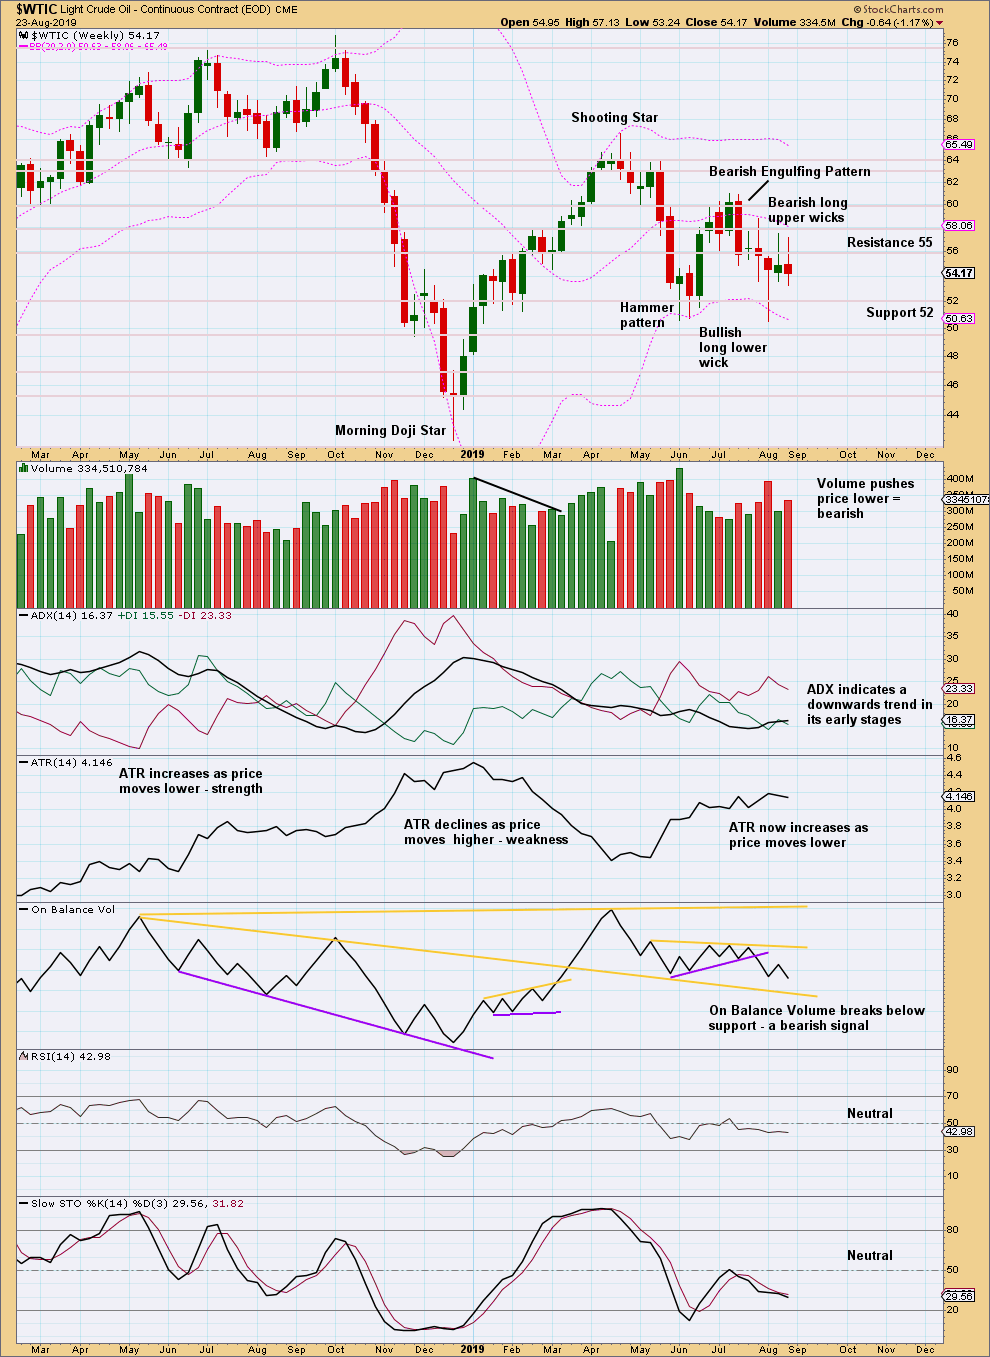
Now two long upper wicks is more strongly bearish, at least for the short term.
There is again a downwards trend in place. ADX is giving the strongest signal it can give.
DAILY CHART
Click chart to enlarge. Chart courtesy of StockCharts.com.
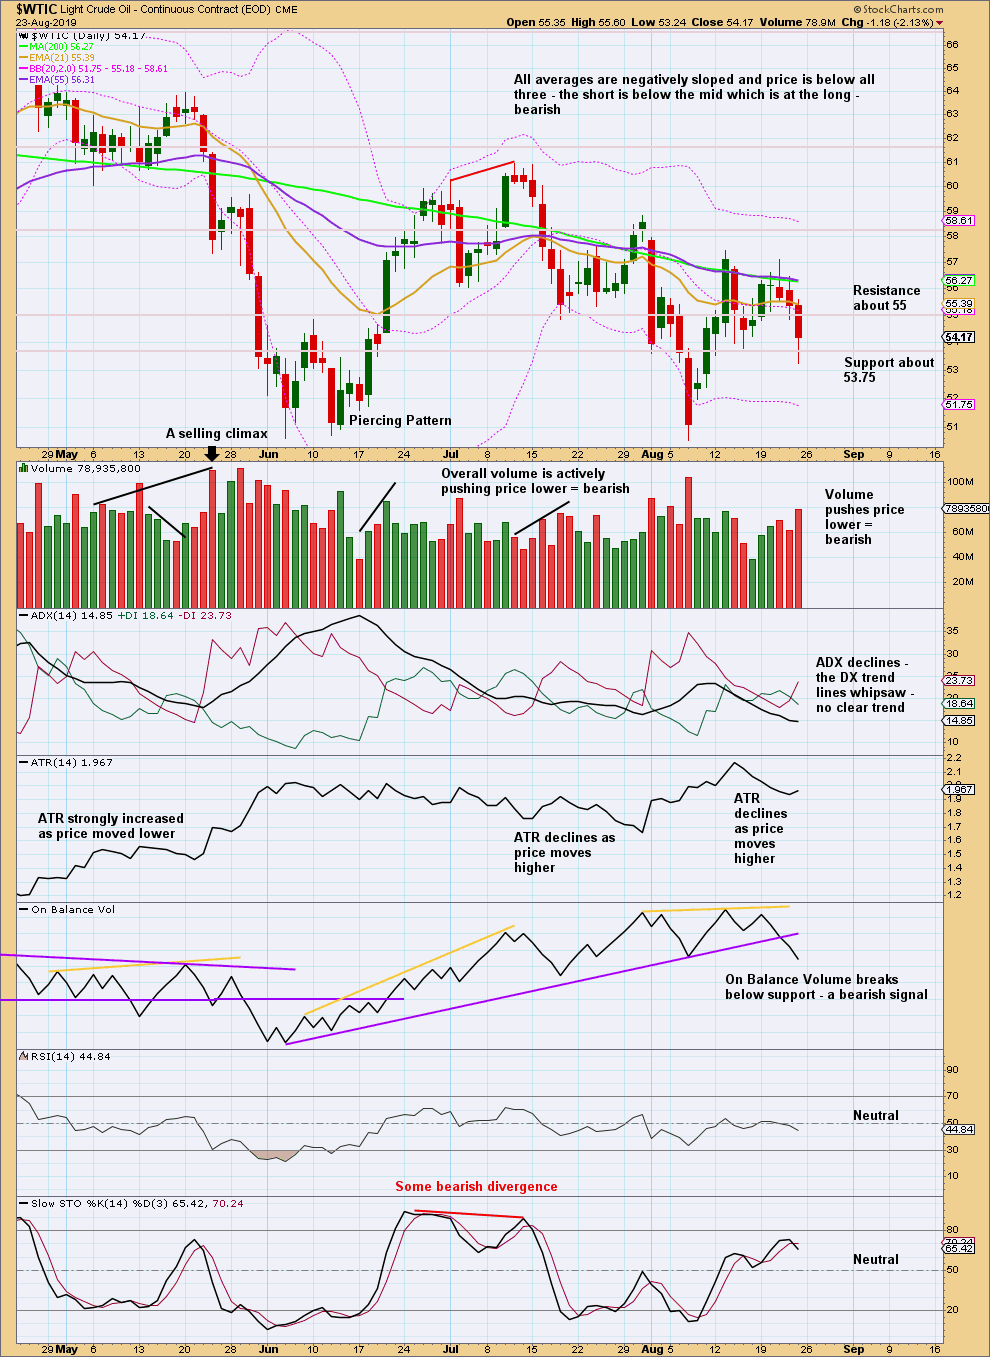
Overall, this chart is bearish and supports the main Elliott wave count. For the very short term, look out for a bounce Monday / Tuesday as indicated by a long lower wick on Friday’s candlestick.
—
Always practice good risk management as the most important aspect of trading. Always trade with stops and invest only 1-5% of equity on any one trade. Failure to manage risk is the most common mistake new traders make.
Comment for the S&P500 today:
Today the AD line makes a new all time high. There is now one 90% OCO up day and now two back to back 80% up days off the last low.
Overall this is very bullish, supporting the main EW count. I am expecting an upwards breakout from the consolidation of the last 18 sessions to likely happen tomorrow.
With today’s +2% move up in OIL, it is awfully tempting to go short. What concerns me, however, is that we have not witnessed any of the momentum increase to the downside we should expect to observe if we are in fact in a 3rd of a 3rd down at several degrees. In addition, we are just under the 50 day moving average which has turned upwards. So, I will wait a bit longer before I open a short OIL position. I may regret it later, but right now price action is not matching what the primary or main wave count is expecting.
Any thoughts?
summer doldrums?
Rodney, I share your concern about a lack of increase momentum to the downside in USOIL.
I suspect that Minute ii is not over, and that what was labeled Minuette i and Minuette ii and the beginnings of Minuette iii in Lara’s last weekly analysis has actually turned out to be an X or B wave. The upturn we have seen in the last few days may by Y or C, likely marking the coming end of Minute ii.
What is bothersome with this analysis is that Minute ii would be turning out to be exceeding long compared to Minor 2, and would now clearly moving above the base channel upper trendline formed by the start of Minor 1 and the end of Minor 2. Waves of lower degree should find strong resistance at a trendline formed by waves of higher degree. None of this represents rule violations, so we might very well see USOIL turn down very soon.
I am going to patient on this one.
Exactly.
It is concerning. Minute ii could certainly be continuing.
Whatever happens, I would expect the upper edge of the base channel to offer very strong resistance if price does get up there.
But also, for Oil and other commodities, their third waves do start out slowly quite often. Lots of deep second wave corrections, and short first waves. They tend to develop momentum only through the middle of the third wave, then have quick brief fourth waves, and explode in the fifth wave. So the lack of momentum here is not concerning me.
The depth of correction so close to the invalidation point is though.
I’m a big fan of analogs and I came across this chart on twitter. I believe it was made by someone relatively obscure, so I don’t think this is a mainstream idea. In fact, I see a number of “crash charts” targeting September. Anyway, this matches Lara’s bullish forecast to about 3400 on the S&P, and I’ve often thought the greatest bubble in market history (with massive QE, etc.) would end with a similar move up as 1929. Personally, I think a modest trade deal with China gets done and we accelerate the economy into the fall. I feel like the consensus out there is recession imminent, no deal ever, and market decline coming. This type of move higher certainly would get bears to throw in the towel.
Yeah wave 5’s should be feel good waves 🙂 Work is a crazy mess and good hires are a thing of the past. Where is that blow off top! I want a feel good wave like 2000!