

S&P 500
Upwards movement continued as the main Elliott wave count expected. All three Elliott wave counts remain valid at the end of the week, but the two alternates now have a very low probability.
Summary: An upwards breakout above 2,940 with support from volume would add confidence in the main wave count. If this happens, then the next target is 3,120. Classic analysis very strongly supports this main wave count, so much so that I have considered discarding alternates, but I shall let price confirm it.
A new low below 2,822.12 would indicate a continuing deeper pullback as fairly likely, as outlined by the alternate wave counts. The first target would then be at 2,663.
The biggest picture, Grand Super Cycle analysis, is here.
Monthly charts were last published here. There are two further alternate monthly charts here.
ELLIOTT WAVE COUNTS
The two weekly Elliott wave counts below will be labelled First and Second. They may be about of even probability. When the fifth wave currently unfolding on weekly charts may be complete, then these two wave counts will diverge on the severity of the expected following bear market. To see an illustration of this future divergence monthly charts should be viewed.
FIRST WAVE COUNT
WEEKLY CHART
Click chart to enlarge.
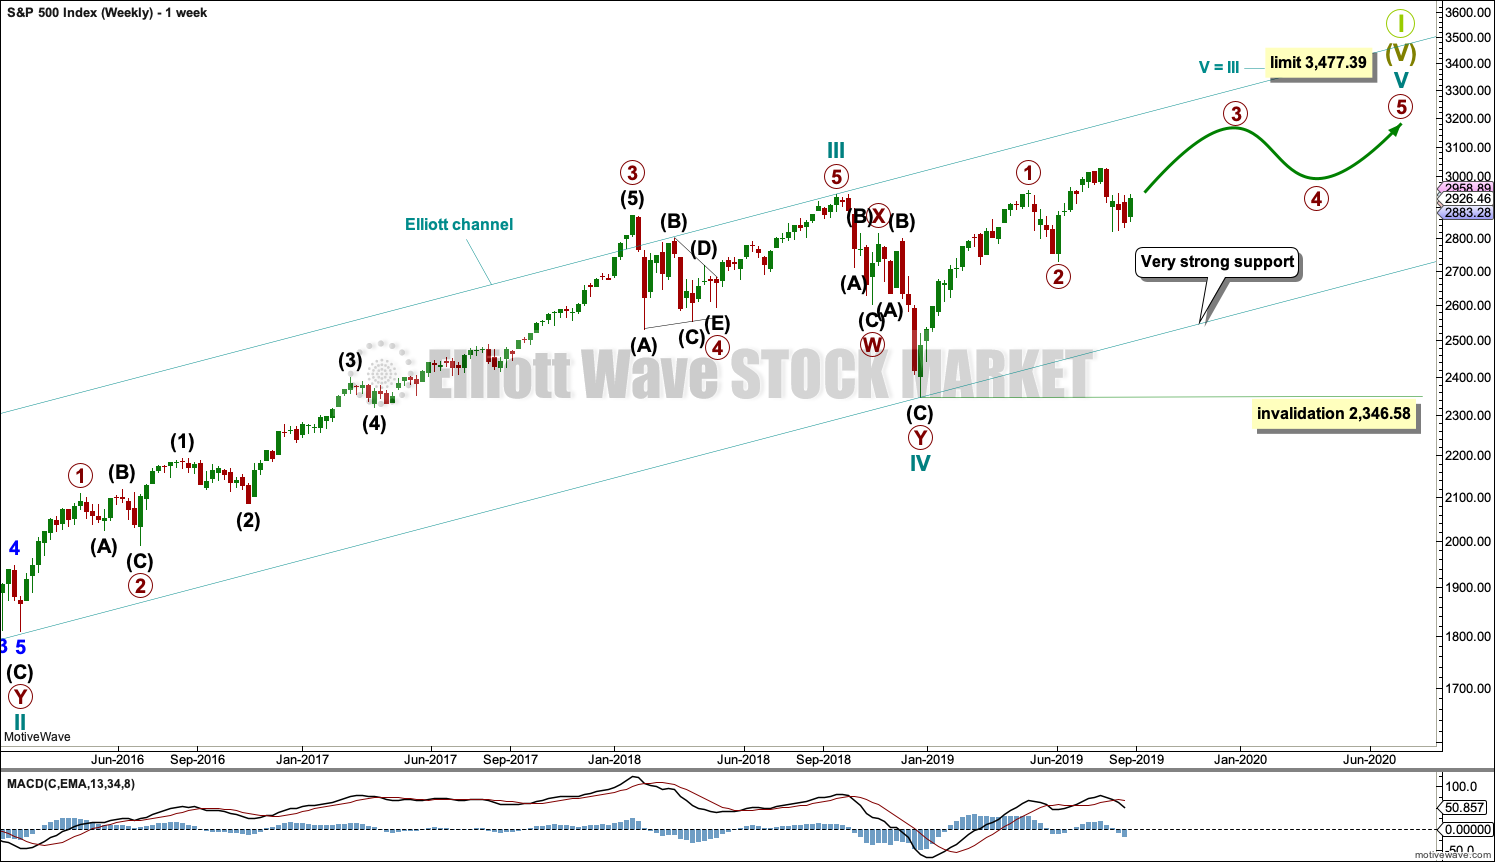
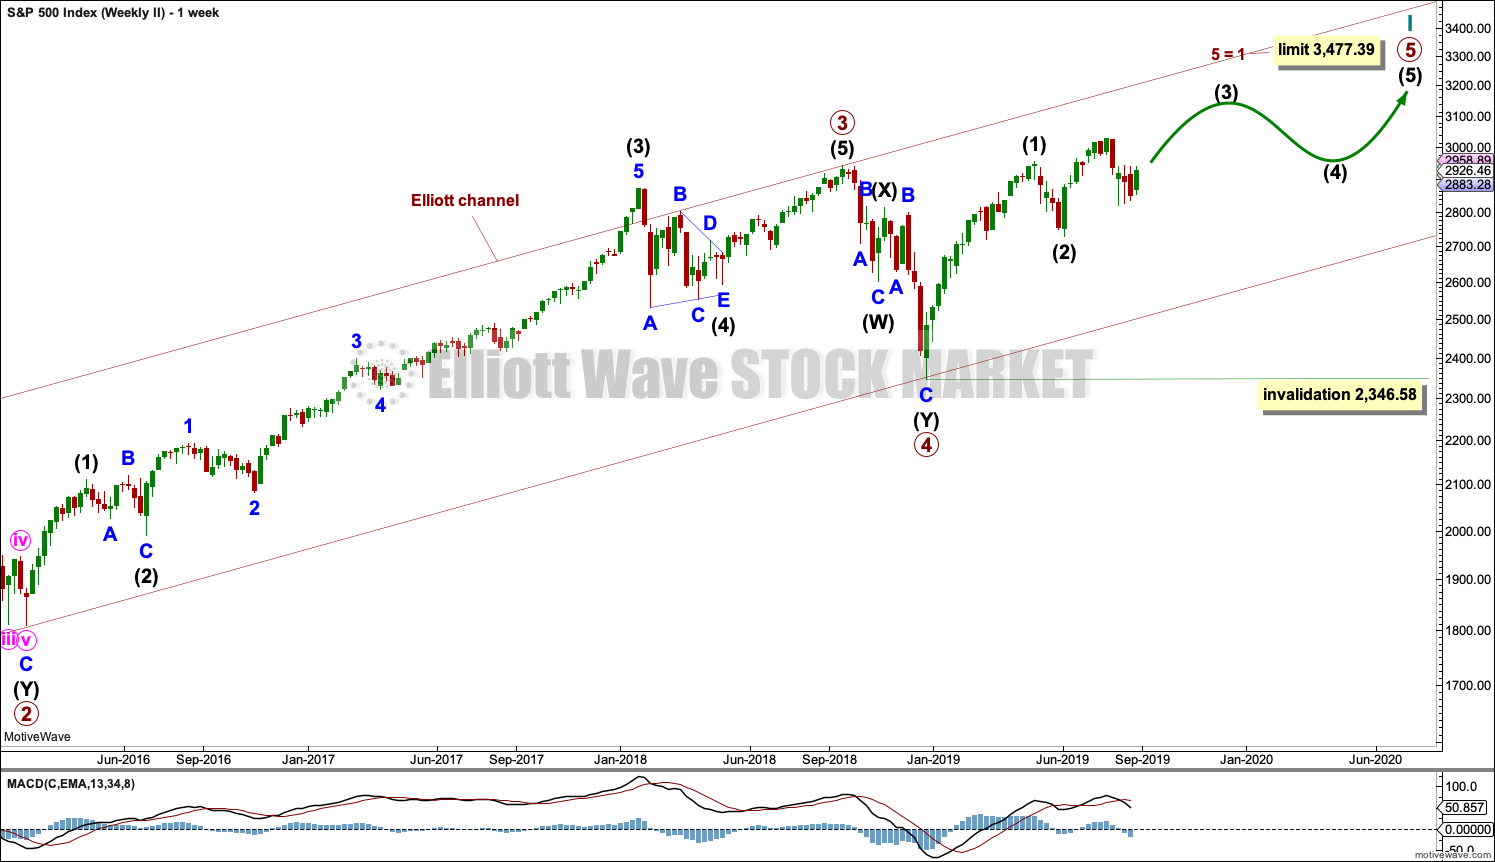
The basic Elliott wave structure consists of a five wave structure up followed by a three wave structure down (for a bull market). This wave count sees the bull market beginning in March 2009 as an incomplete five wave impulse and now within the last fifth wave, which is labelled cycle wave V. This impulse is best viewed on monthly charts. The weekly chart focusses on the end of it.
Elliott wave is fractal. This fifth wave labelled cycle wave V may end a larger fifth wave labelled Super Cycle wave (V), which may end a larger first wave labelled Grand Super Cycle wave I.
The teal Elliott channel is drawn using Elliott’s first technique about the impulse of Super Cycle wave (V). Draw the first trend line from the end of cycle wave I (off to the left of the chart, the weekly candlestick beginning 30th November 2014) to the end of cycle wave III, then place a parallel copy on the end of cycle wave II. This channel perfectly shows where cycle wave IV ended at support. The strongest portion of cycle wave III, the end of primary wave 3, overshoots the upper edge of the channel. This is a typical look for a third wave and suggests the channel is drawn correctly and the way the impulse is counted is correct.
Within Super Cycle wave (V), cycle wave III is shorter than cycle wave I. A core Elliott wave rule states that a third wave may never be the shortest. For this rule to be met in this instance, cycle wave V may not be longer in length than cycle wave III. This limit is at 3,477.39.
Cycle wave V may subdivide either as an impulse or an ending diagonal. Impulses are much more common. This main wave count expects that cycle wave V may be unfolding as an impulse.
The daily charts below will now focus on all of cycle wave V.
In historic analysis, two further monthly charts have been published that do not have a limit to upwards movement and are more bullish than this wave count. Members are encouraged to consider those possibilities (links below summary) alongside the wave counts presented on a daily and weekly basis.
MAIN DAILY CHART
Click chart to enlarge.
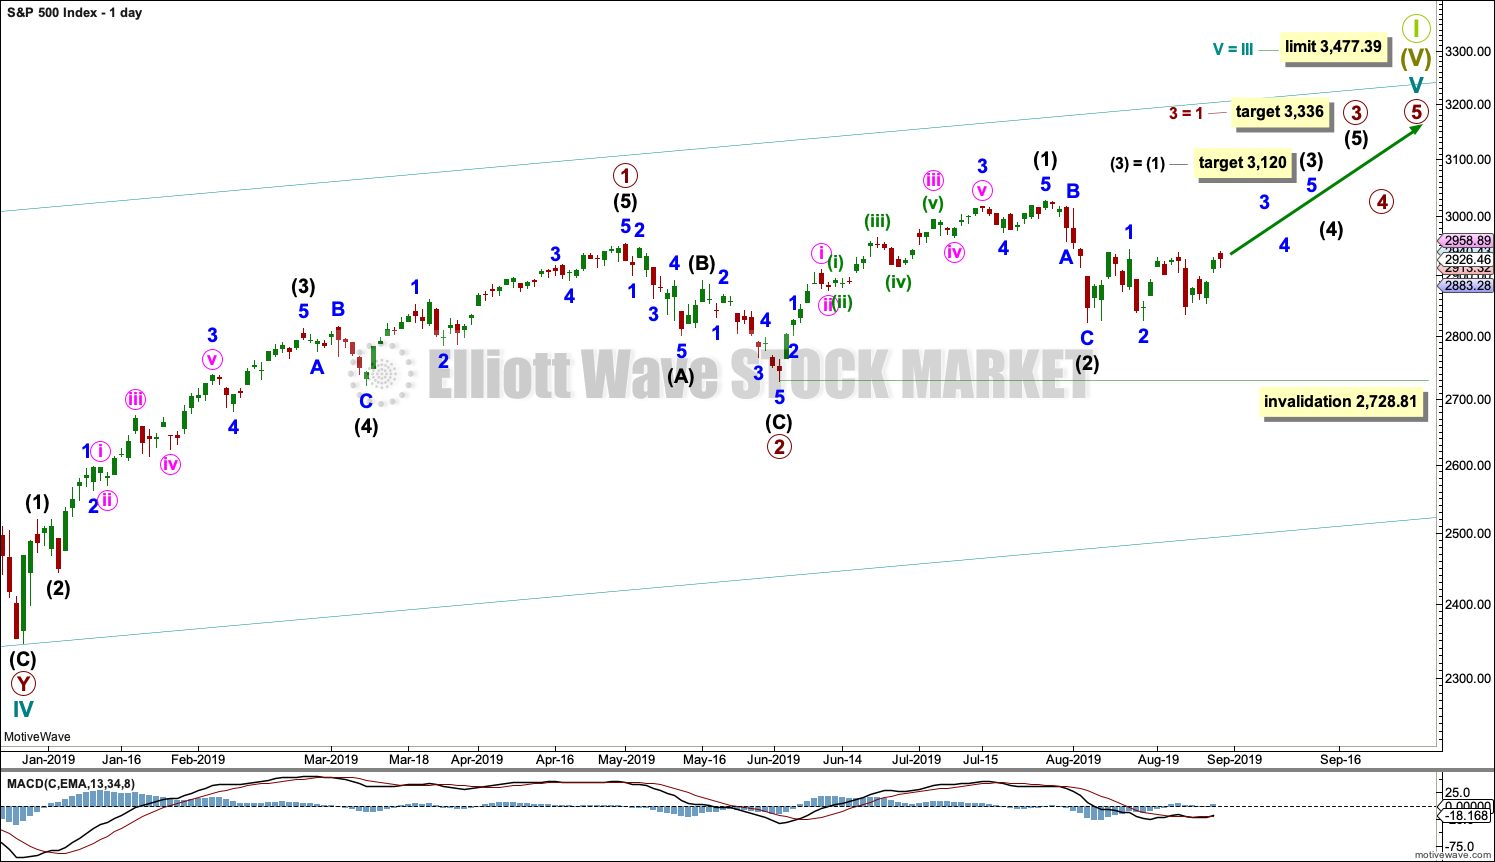
Cycle wave V is seen as an impulse for this wave count.
Within cycle wave V, primary waves 1 and 2 may be complete. Primary wave 3 may have begun.
Primary wave 3 may only subdivide as an impulse. Within primary wave 3, intermediate waves (1) and (2) may be complete.
It is also possible that intermediate wave (2) may be incomplete and sideways movement of the last 19 sessions may be minor wave B within a zigzag for intermediate wave (2). If intermediate wave (2) continues lower, then it may not move beyond the start of intermediate wave (1) below 2,728.81.
Intermediate wave (3) may have begun. Intermediate wave (3) may only subdivide as an impulse.
ALTERNATE DAILY CHART
Click chart to enlarge.
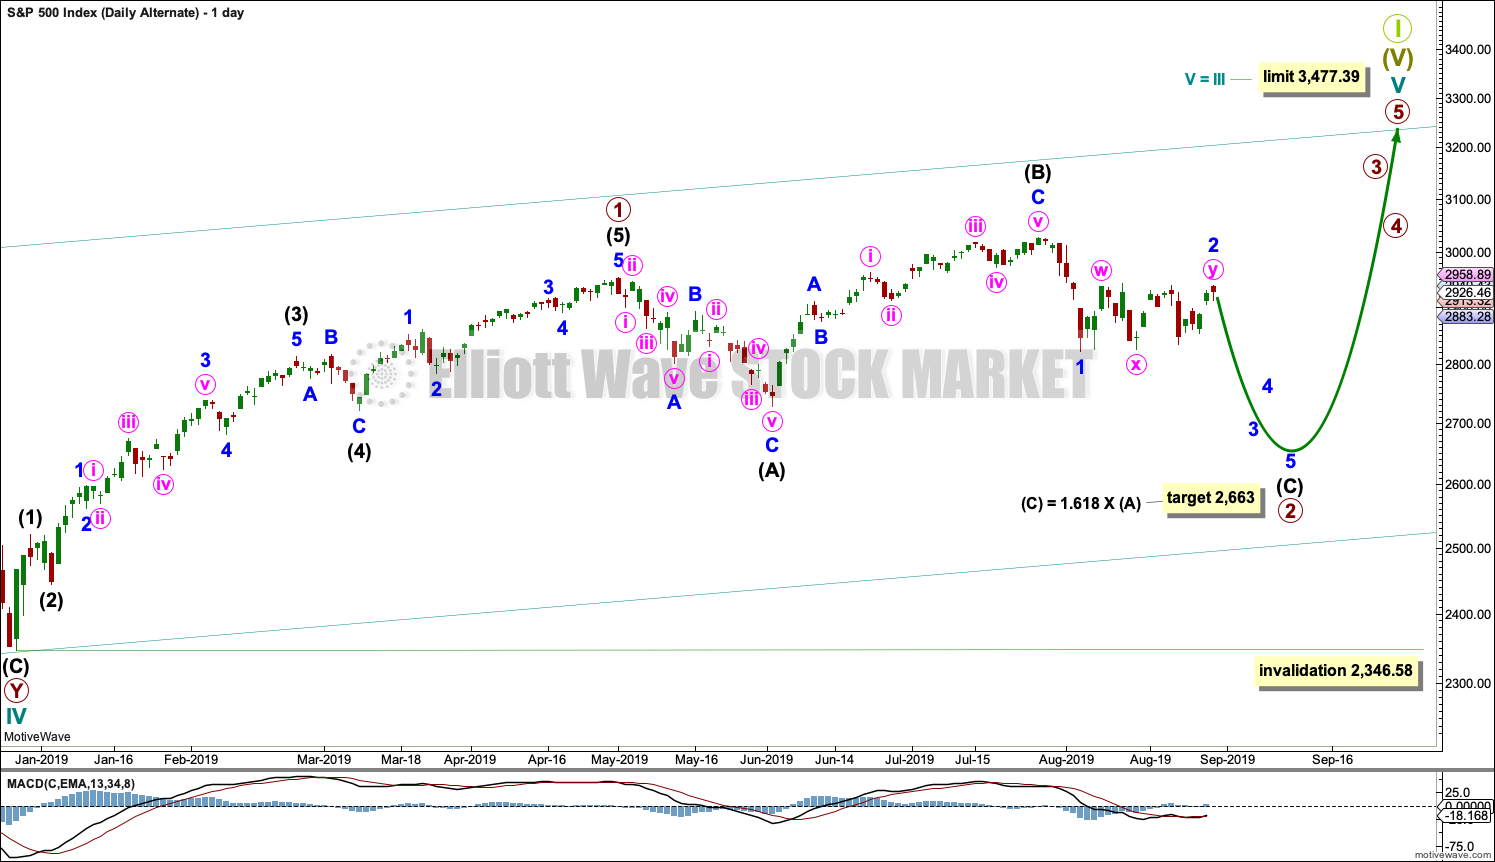
This first alternate wave count considers the possibility that cycle wave V may be unfolding as an impulse.
Cycle wave V must subdivide as a five wave motive structure. Within that five wave structure, primary wave 1 only may be complete.
Primary wave 2 may be unfolding as an expanded flat correction. These are reasonably common Elliott wave corrective structures. Flat corrections subdivide 3-3-5. Expanded flats have B waves which are 1.05 or more the length of their A waves. In this example for primary wave 2, intermediate wave (B) is a 1.33 length of intermediate wave (A). The target for intermediate wave (C) expects it to exhibit the most common Fibonacci Ratio to intermediate wave (A) within an expanded flat.
If price reaches the target at 2,663 and keeps falling, then the next target would be the 0.618 Fibonacci Ratio of primary wave 1 at 2,578.66.
Primary wave 2 may not move beyond the start of primary wave 1 below 2,346.58.
SECOND ALTERNATE DAILY CHART
Click chart to enlarge.
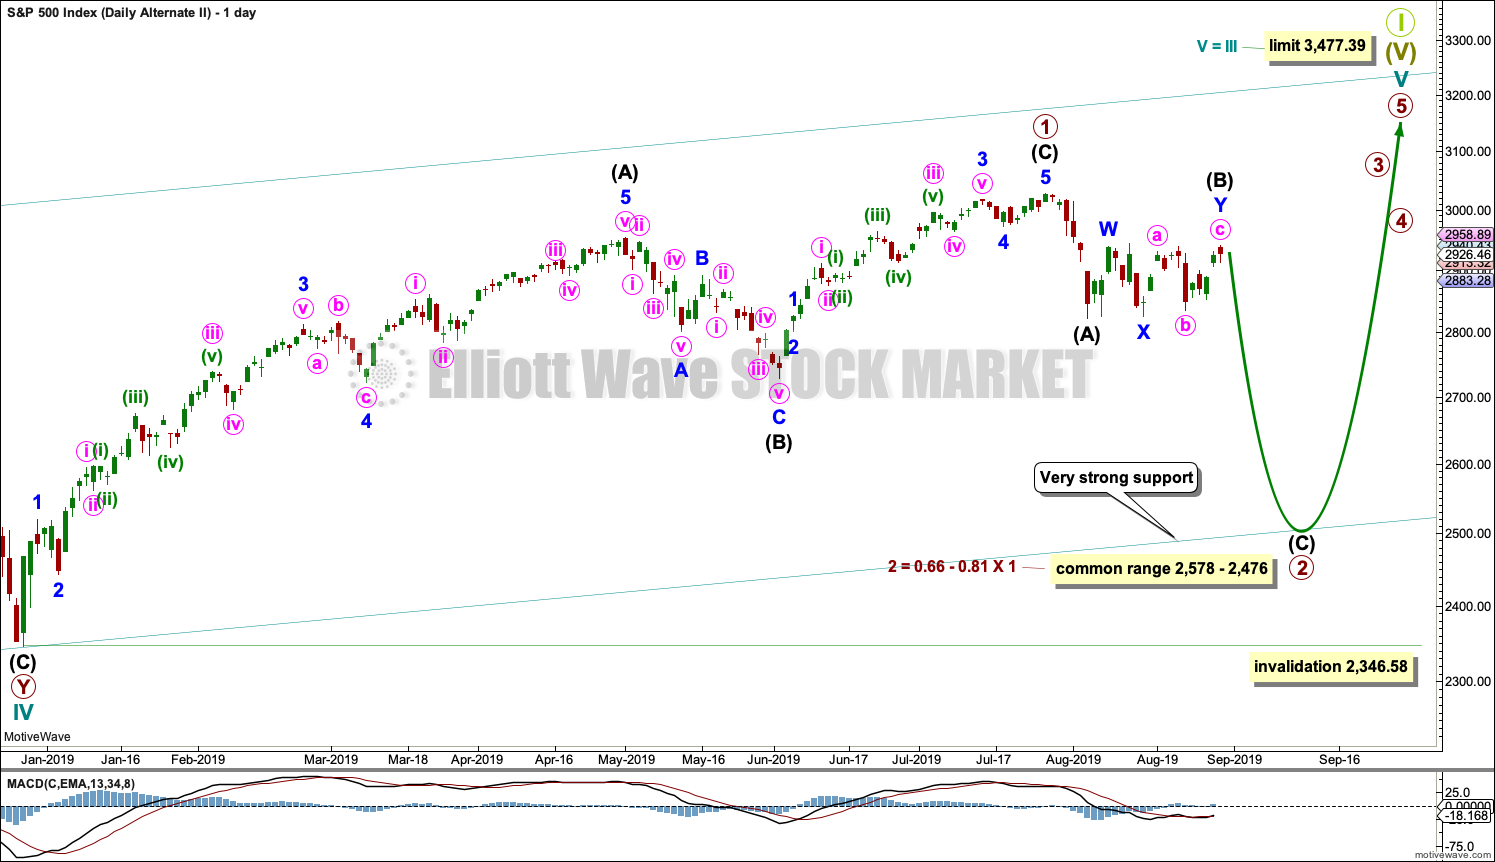
This second alternate daily chart considers the other structural possibility for cycle wave V, that of an ending diagonal. Ending diagonals in fifth wave positions are not as common as impulses; for this reason, this wave count will remain an alternate until an impulse for cycle wave V is invalidated.
All sub-waves within an ending diagonal must subdivide as zigzags. Primary wave 1 may have been complete as a zigzag at the last all time high on the 26th of July.
Primary wave 2 may be continuing lower as a zigzag. Within the zigzag, intermediate wave (B) may now be a complete double combination.
Within diagonals, sub-waves 2 and 4 are normally very deep, ending within a range of 0.66 to 0.81 the prior wave. This range for primary wave 2 is from 2,578 to 2,476. Primary wave 2 may possibly come as low as the lower edge of the teal channel, which is copied over from the weekly chart.
Primary wave 2 may not move beyond the start of primary wave 1 below 2,346.58.
SECOND WAVE COUNT
WEEKLY CHART
Click chart to enlarge.
This weekly chart is almost identical to the first weekly chart, with the sole exception being the degree of labelling.
This weekly chart moves the degree of labelling for the impulse beginning in March 2009 all down one degree. This difference is best viewed on monthly charts.
The impulse is still viewed as nearing an end; a fifth wave is still seen as needing to complete higher. This wave count labels it primary wave 5.
TECHNICAL ANALYSIS
WEEKLY CHART
Click chart to enlarge. Chart courtesy of StockCharts.com.
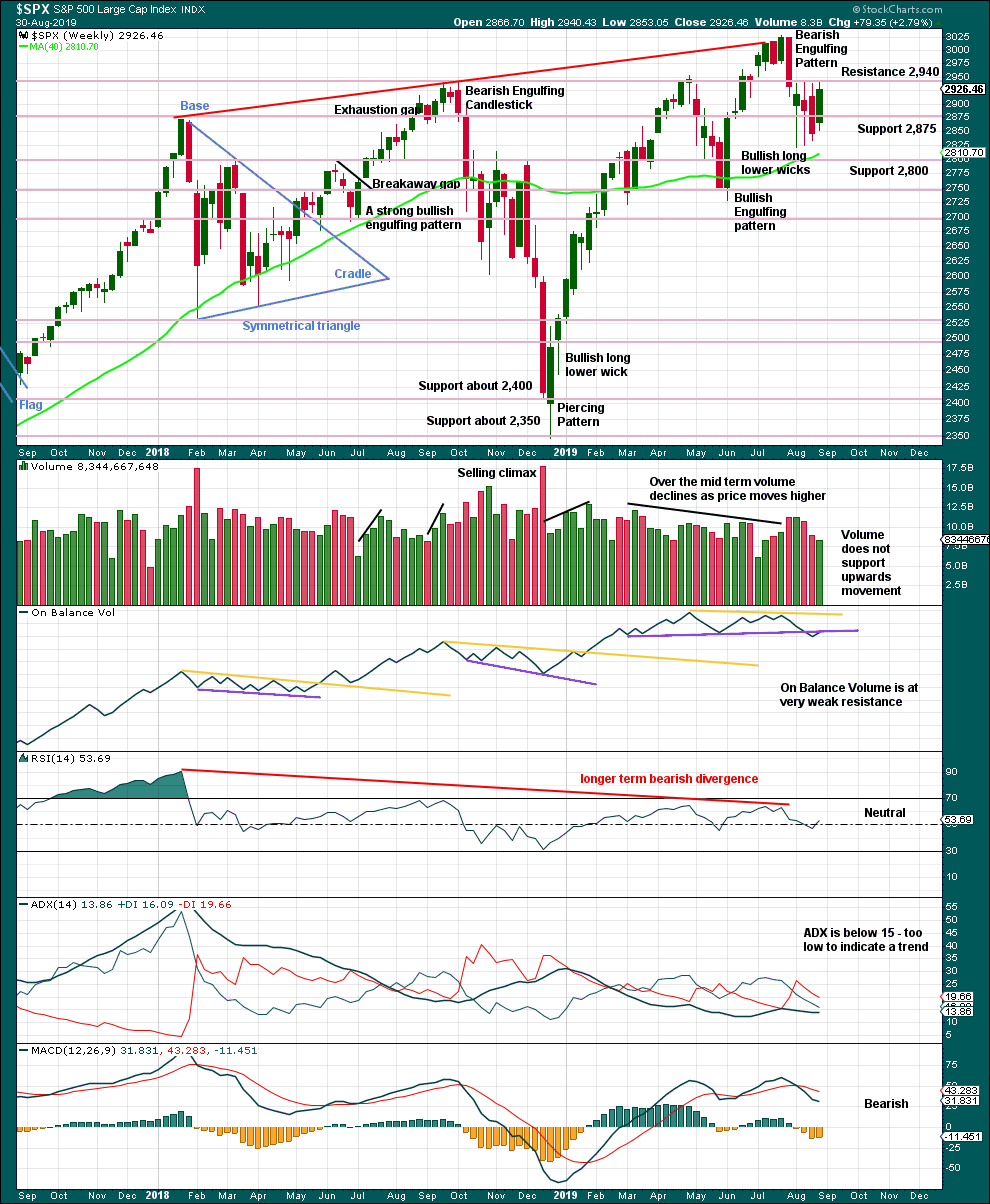
Price remains range bound with resistance about 2,940 and support about 2,920.
The larger trend is up from the low in December 2018, with a series of higher highs and higher lows. This upwards trend should be assumed to remain while the last swing low at 2,728.81 remains intact.
If On Balance Volume breaks back above the resistance line, then the weak bearish signal would be negated and the line would need to be redrawn.
DAILY CHART
Click chart to enlarge. Chart courtesy of StockCharts.com.
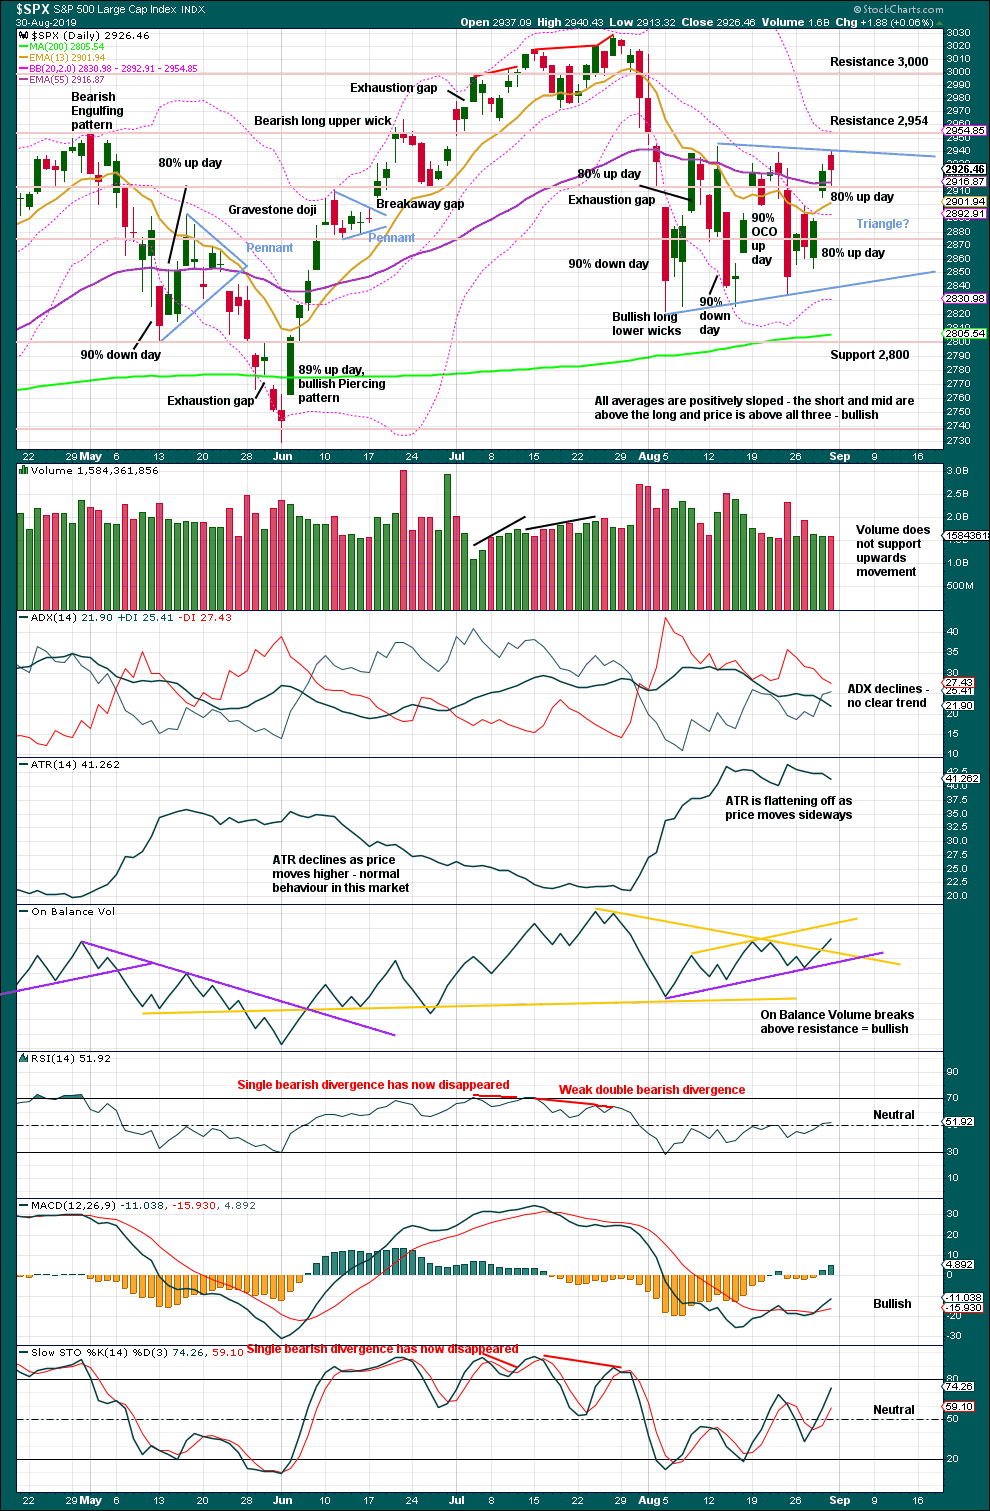
The last low of the 15th of August was preceded immediately by a 90% downward day and followed immediately by a 90% OCO (Operating Companies Only) up day. This is a pattern commonly found at major lows, and it indicates a 180 degree shift in sentiment from bearish to bullish. This favours the main Elliott wave count.
Now the next low of the 23rd of August has been followed by two back to back 80% up days. This too is very bullish and favours the main Elliott wave count.
The classic triangle no longer has a very clear look. The trend lines do not converge at a normal rate. This pattern is weak.
On Balance Volume today gives a clear bullish signal. This supports the main Elliott wave count.
BREADTH – AD LINE
WEEKLY CHART
Click chart to enlarge. Chart courtesy of StockCharts.com. So that colour blind members are included, bearish signals
will be noted with blue and bullish signals with yellow.
Bear markets from the Great Depression and onwards have been preceded by an average minimum of 4 months divergence between price and the AD line with only two exceptions in 1946 and 1976. With the AD line making new all time highs again this week, the end of this bull market and the start of a new bear market is very likely a minimum of 4 months away, which is the end of December 2019.
In all bear markets in the last 90 years there is some positive correlation (0.6022) between the length of bearish divergence and the depth of the following bear market. No to little divergence is correlated with more shallow bear markets. Longer divergence is correlated with deeper bear markets.
If a bear market does develop here, it comes after no bearish divergence. It would therefore more likely be shallow.
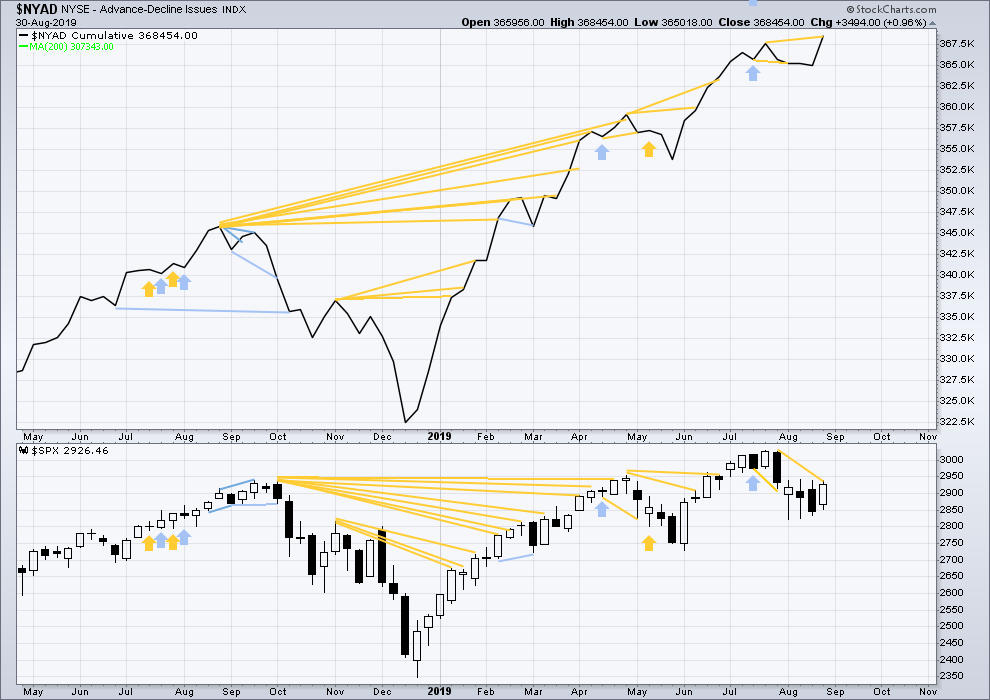
This week both price and the AD line have moved higher.
The AD line makes a new all time high. This is a very bullish signal and very strongly supports the main Elliott wave count.
DAILY CHART
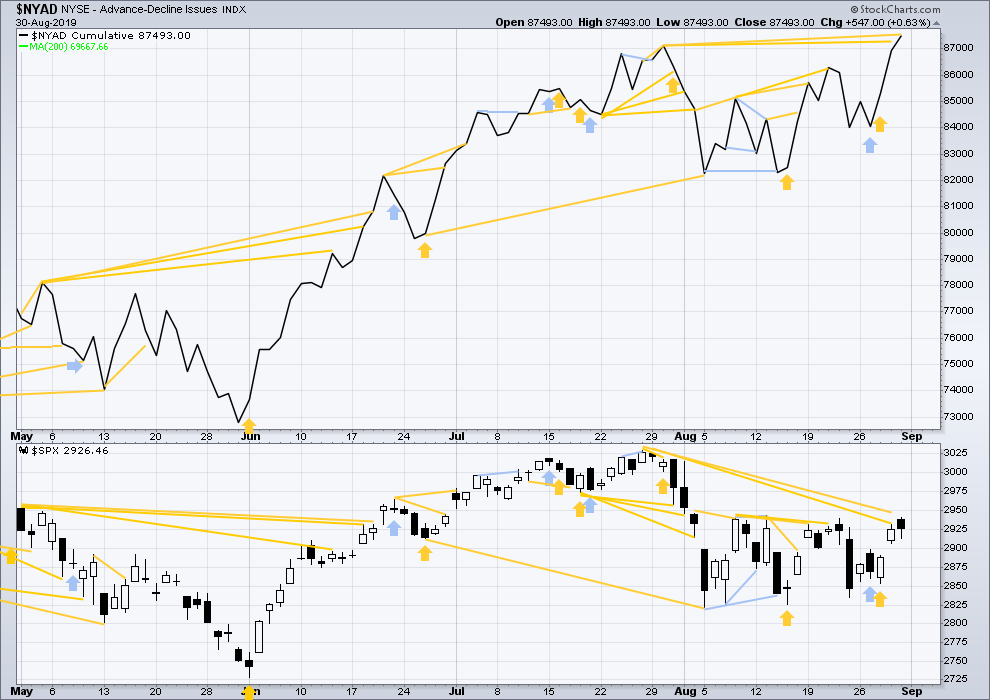
Click chart to enlarge. Chart courtesy of StockCharts.com. So that colour blind members are included, bearish signals
will be noted with blue and bullish signals with yellow.
Breadth should be read as a leading indicator.
The AD line makes another new all time high on Friday. This is a very bullish signal and strongly favours the main Elliott wave count.
VOLATILITY – INVERTED VIX CHART
WEEKLY CHART
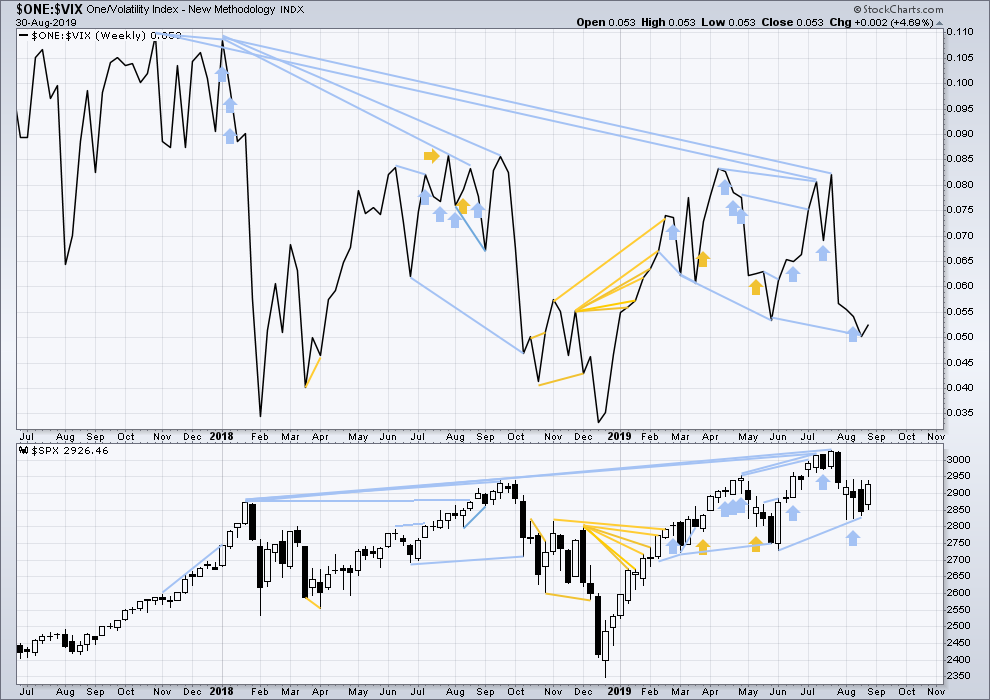
Click chart to enlarge. Chart courtesy of StockCharts.com. So that colour blind members are included, bearish signals
will be noted with blue and bullish signals with yellow.
The all time high for inverted VIX (which is the same as the low for VIX) was on 30th October 2017. There is now nearly one year and nine months of bearish divergence between price and inverted VIX.
The rise in price is not coming with a normal corresponding decline in VIX; VIX remains elevated. This long-term divergence is bearish and may yet develop further as the bull market matures.
This divergence may be an early warning, a part of the process of a top developing that may take years. It may not be useful in timing a trend change.
This week both price and inverted VIX have moved higher. There is no new divergence.
DAILY CHART
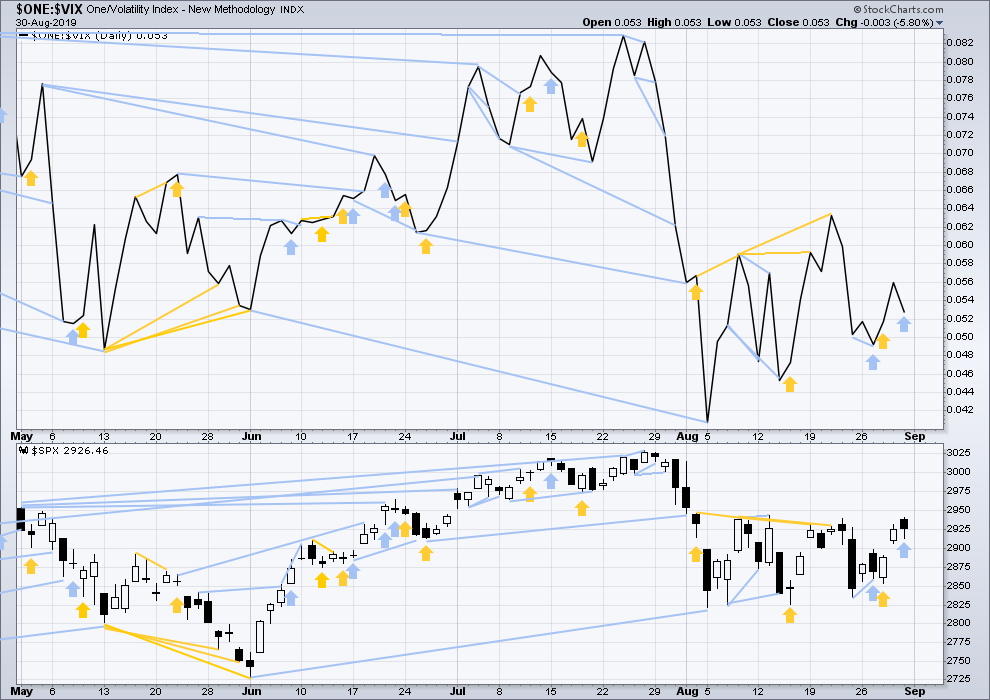
Click chart to enlarge. Chart courtesy of StockCharts.com. So that colour blind members are included, bearish signals
will be noted with blue and bullish signals with yellow.
Price has moved higher on Friday, but inverted VIX has moved lower. This divergence is bearish but shall be given no weight in this analysis as it is contradicted by the AD line.
DOW THEORY
Dow Theory confirmed a bear market in December 2018. This does not necessarily mean a bear market at Grand Super Cycle degree though; Dow Theory makes no comment on Elliott wave counts. On the 25th of August 2015 Dow Theory also confirmed a bear market. The Elliott wave count sees that as part of cycle wave II. After Dow Theory confirmation of a bear market in August 2015, price went on to make new all time highs and the bull market continued.
DJIA: 23,344.52 – a close on the 19th of December at 23,284.97 confirms a bear market.
DJT: 9,806.79 – price has closed below this point on the 13th of December.
S&P500: 2,532.69 – a close on the 19th of December at 2,506.96 provides support to a bear market conclusion.
Nasdaq: 6,630.67 – a close on the 19th of December at 6,618.86 provides support to a bear market conclusion.
With all the indices having moved higher following a Dow Theory bear market confirmation, Dow Theory would confirm a bull market if the following highs are made:
DJIA: 26,951.81 – a close above this point has been made on the 3rd of July 2019.
DJT: 11,623.58 – to date DJT has failed to confirm an ongoing bull market.
S&P500: 2,940.91 – a close above this point was made on the 29th of April 2019.
Nasdaq: 8,133.30 – a close above this point was made on the 26th of April 2019.
GOLD
Downwards movement has continued as expected after a new high for the week.
Summary: It looks increasingly likely that at the end of the week a major high may be in place. The upwards trend reached very extreme and overbought, and there are now candlestick reversal patterns on both weekly and daily charts.
The bullish wave count now expects downwards movement for a week or two to 1,469.
The main bearish wave count expects a new downwards wave to last one to several years has begun. This may now be taken more seriously.
If price makes a new high above 1,552.65, then the next target would be at 1,572
A classic analysis target using the pennant pattern is at 1,660. This target may still be optimistic.
Grand SuperCycle analysis is here.
Monthly charts were last published here with video here.
BEARISH ELLIOTT WAVE COUNT
WEEKLY CHART
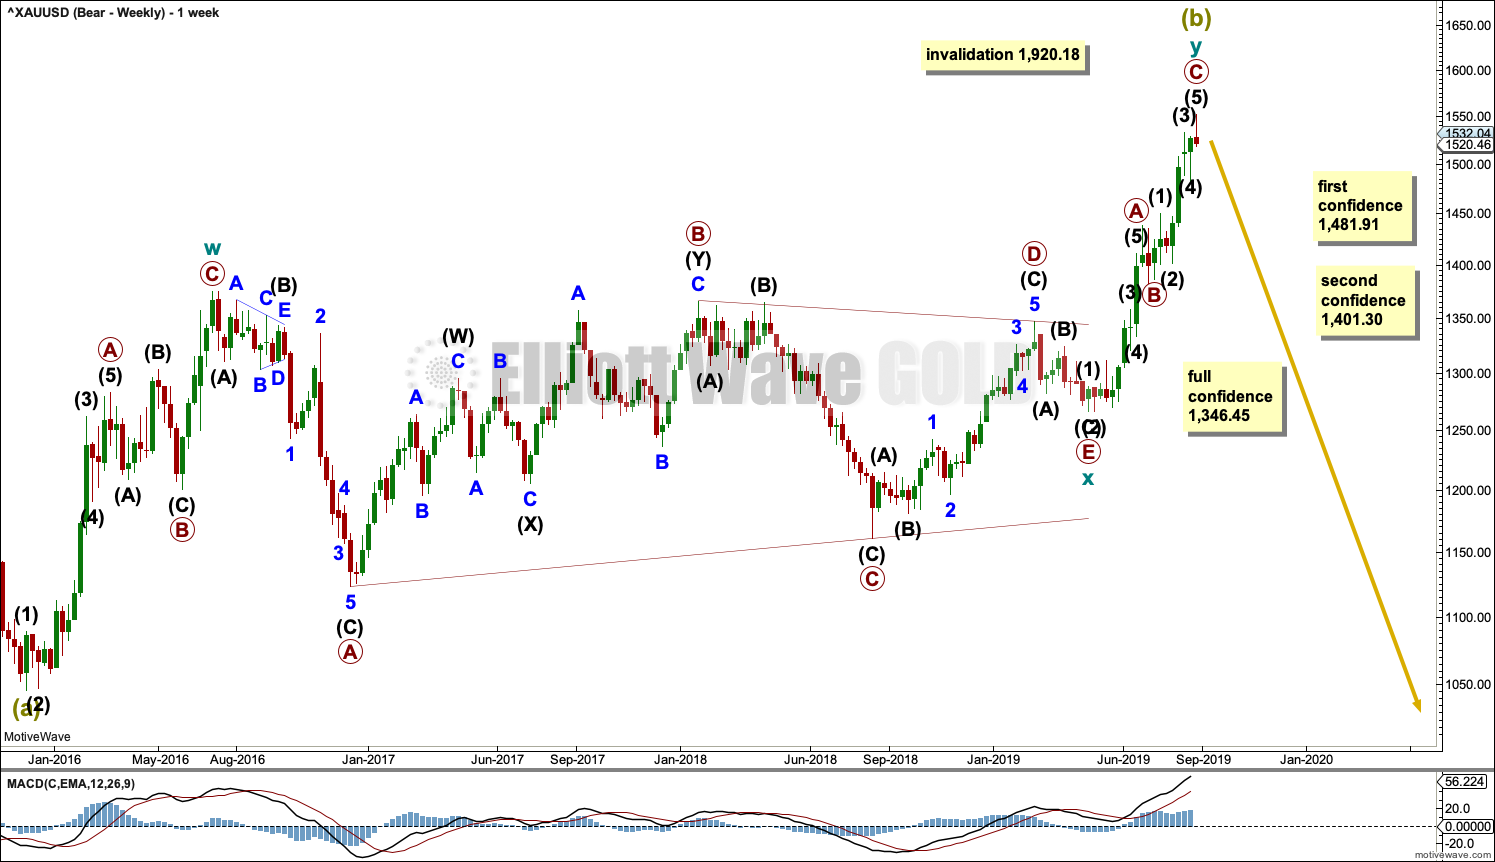
Click chart to enlarge.
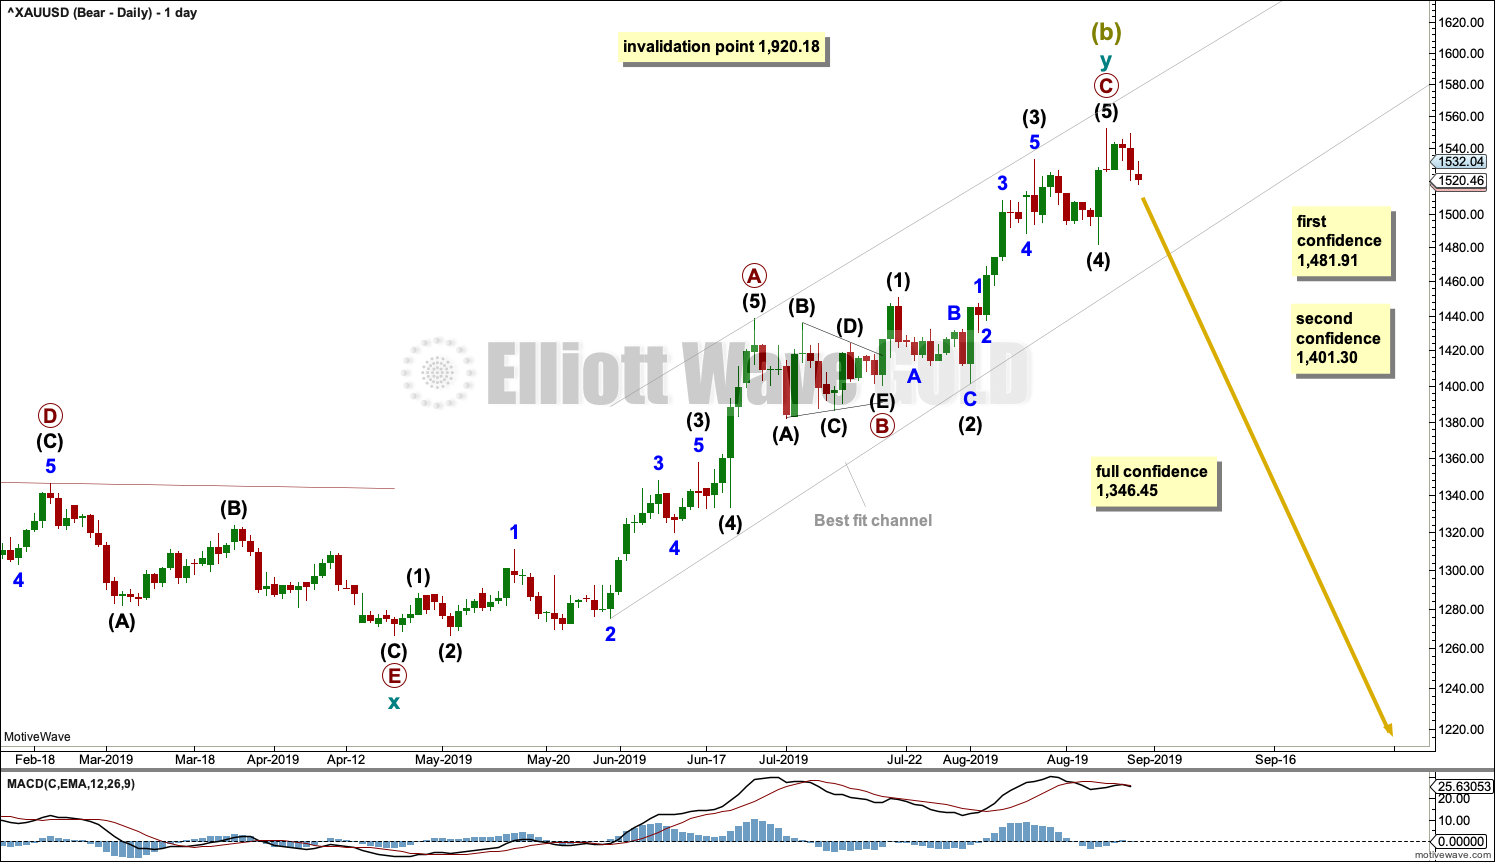
It is possible that Super Cycle wave (b) is completing as a double zigzag.
The first zigzag in the double is labelled cycle wave w. The double is joined by a three in the opposite direction, a triangle labelled cycle wave x. The second zigzag in the double is labelled cycle wave y.
Cycle wave y may now be a complete zigzag, or it may yet continue a little higher.
The purpose of the second zigzag in a double is to deepen the correction. Cycle wave y has achieved this purpose.
1,481.91 is the start of intermediate wave (5) within primary wave C. A new low below 1,481.91 could not be a second wave correction within intermediate wave (5), so at that stage intermediate wave (5) would have to be over.
1,401.30 is the start of primary wave C. A new low below this point could not be a second wave correction within primary wave C, so at that stage primary wave C would be confirmed as over.
A new low below 1,346.45 would invalidate the bullish wave count below and add confidence to a bearish wave count.
DAILY CHART
Click chart to enlarge.
Within cycle wave y, the triangle that ended on the 17th of July may have been primary wave B. Primary wave C may have begun there. Primary wave C must subdivide as a five wave structure; it could be a complete impulse.
Within cycle wave y, there is no Fibonacci Ratio between primary waves A and C.
Within primary wave C, intermediate wave (3) is just 0.33 longer than 2.618 the length of intermediate wave (1). If intermediate wave (5) is over at the last high, then it exhibits no Fibonacci ratio to either of intermediate waves (1) or (3).
A breach of the best fit trend channel by downwards movement would be a very strong indication of a major trend change.
BULLISH ELLIOTT WAVE COUNT
WEEKLY CHART
Click chart to enlarge.
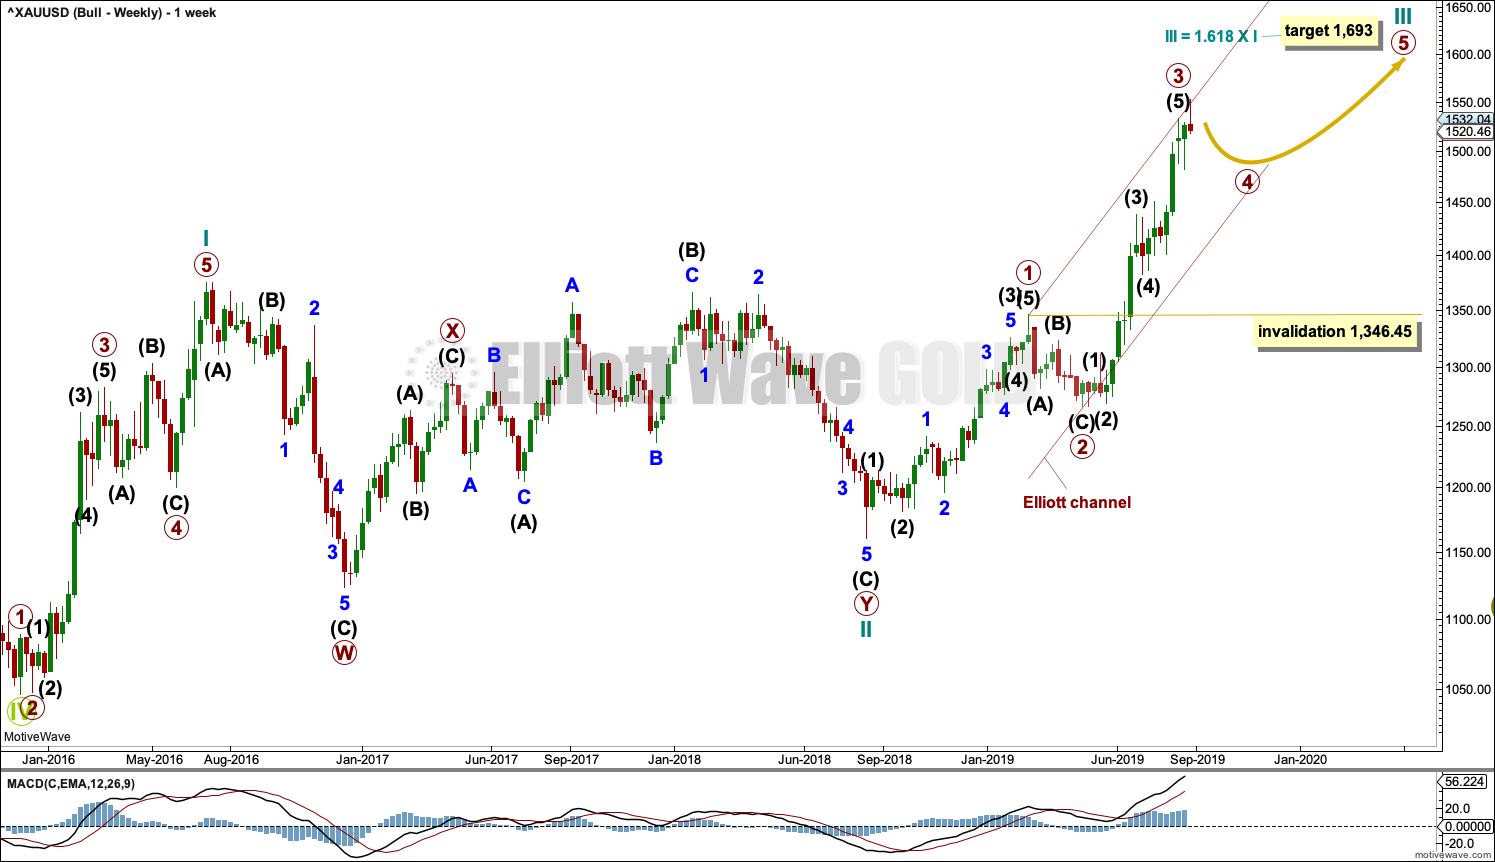
This wave count sees the the bear market complete at the last major low for Gold in November 2015.
If Gold is in a new bull market, then it should begin with a five wave structure upwards on the weekly chart. However, the biggest problem with this wave count is the structure labelled cycle wave I because this wave count must see it as a five wave structure, but it looks more like a three wave structure.
Commodities often exhibit swift strong fifth waves that force the fourth wave corrections coming just prior and just after to be more brief and shallow than their counterpart second waves. It is unusual for a commodity to exhibit a quick second wave and a more time consuming fourth wave, and this is how cycle wave I is labelled. This wave count still suffers from this very substantial problem, and for this reason the bearish wave count is still considered because it has a better fit in terms of Elliott wave structure.
Cycle wave II subdivides well as a double combination: zigzag – X – expanded flat.
Cycle wave III may have begun. Within cycle wave III, primary waves 1 and 2 may now be complete. Primary wave 3 has now moved above the end of primary wave 1 meeting a core Elliott wave rule. It has now moved far enough to allow room for primary wave 4 to unfold and remain above primary wave 1 price territory. Primary wave 4 may not move into primary wave 1 price territory below 1,346.45.
Cycle wave III so far for this wave count would have been underway now for 54 weeks. It is beginning to exhibit some support from volume and increasing ATR. This wave count now has some support from classic technical analysis.
The channel drawn about cycle wave III is an Elliott channel. Primary wave 4 may find support about the lower edge if it is time consuming enough.
DAILY CHART
Click chart to enlarge.
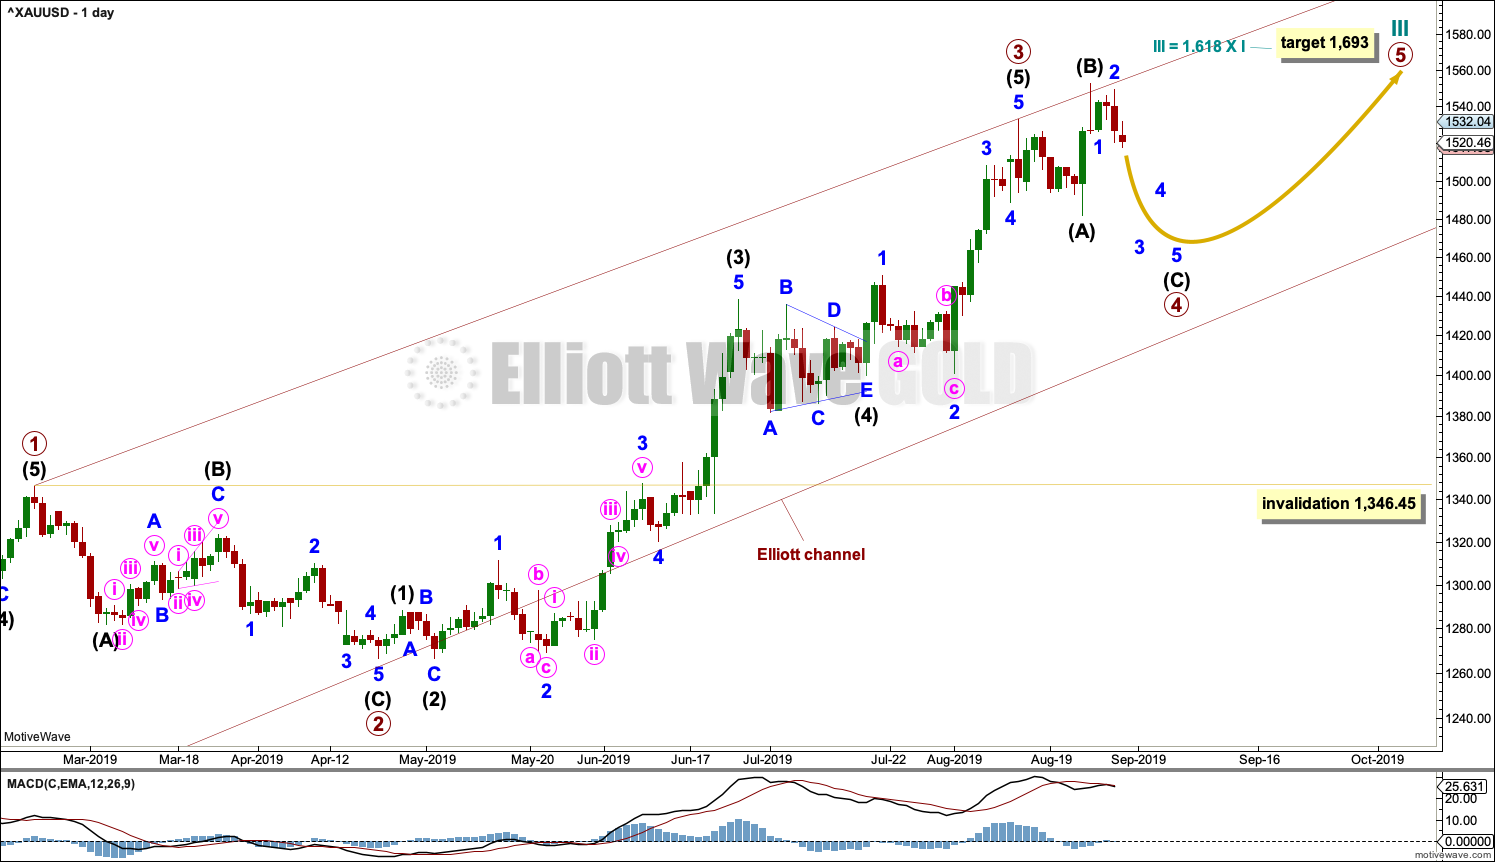
Primary wave 4 may be continuing as an expanded flat, which is a common corrective structure. This would see alternation in structure with the zigzag of primary wave 2.
Primary wave 2 lasted 43 sessions. Primary wave 4 may be expected to be more brief; Gold usually exhibits more brief fourth waves than their counterpart second waves. Primary wave 4 may end in a total Fibonacci 21 or 34 sessions. So far it has lasted 13 sessions.
Primary wave 4 may not move into primary wave 1 price territory below 1,346.45.
TECHNICAL ANALYSIS
WEEKLY CHART
Click chart to enlarge. Chart courtesy of StockCharts.com.
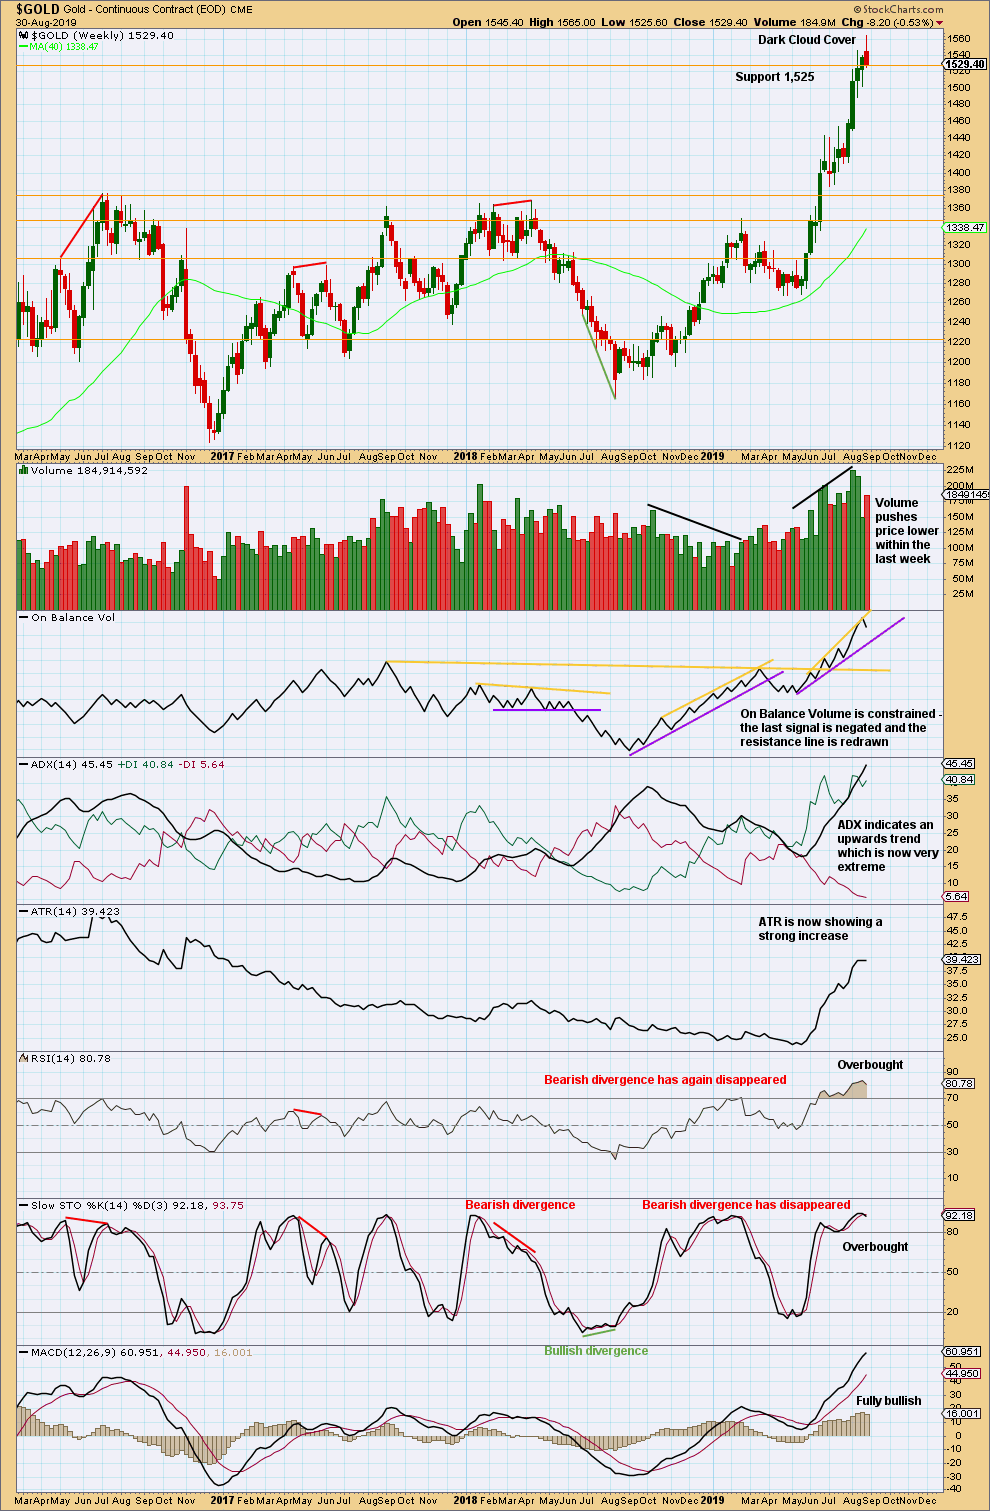
When trends reach very extreme, candlestick reversal patterns should be given weight. The Dark Cloud Cover bearish reversal pattern is given more bearish weight from the long upper wick.
The risk of a major high and a trend change or a large time consuming consolidation developing here is very high. These two scenarios effectively follow the main bearish wave count (major trend change) or bullish wave count (a large time consuming consolidation).
DAILY CHART
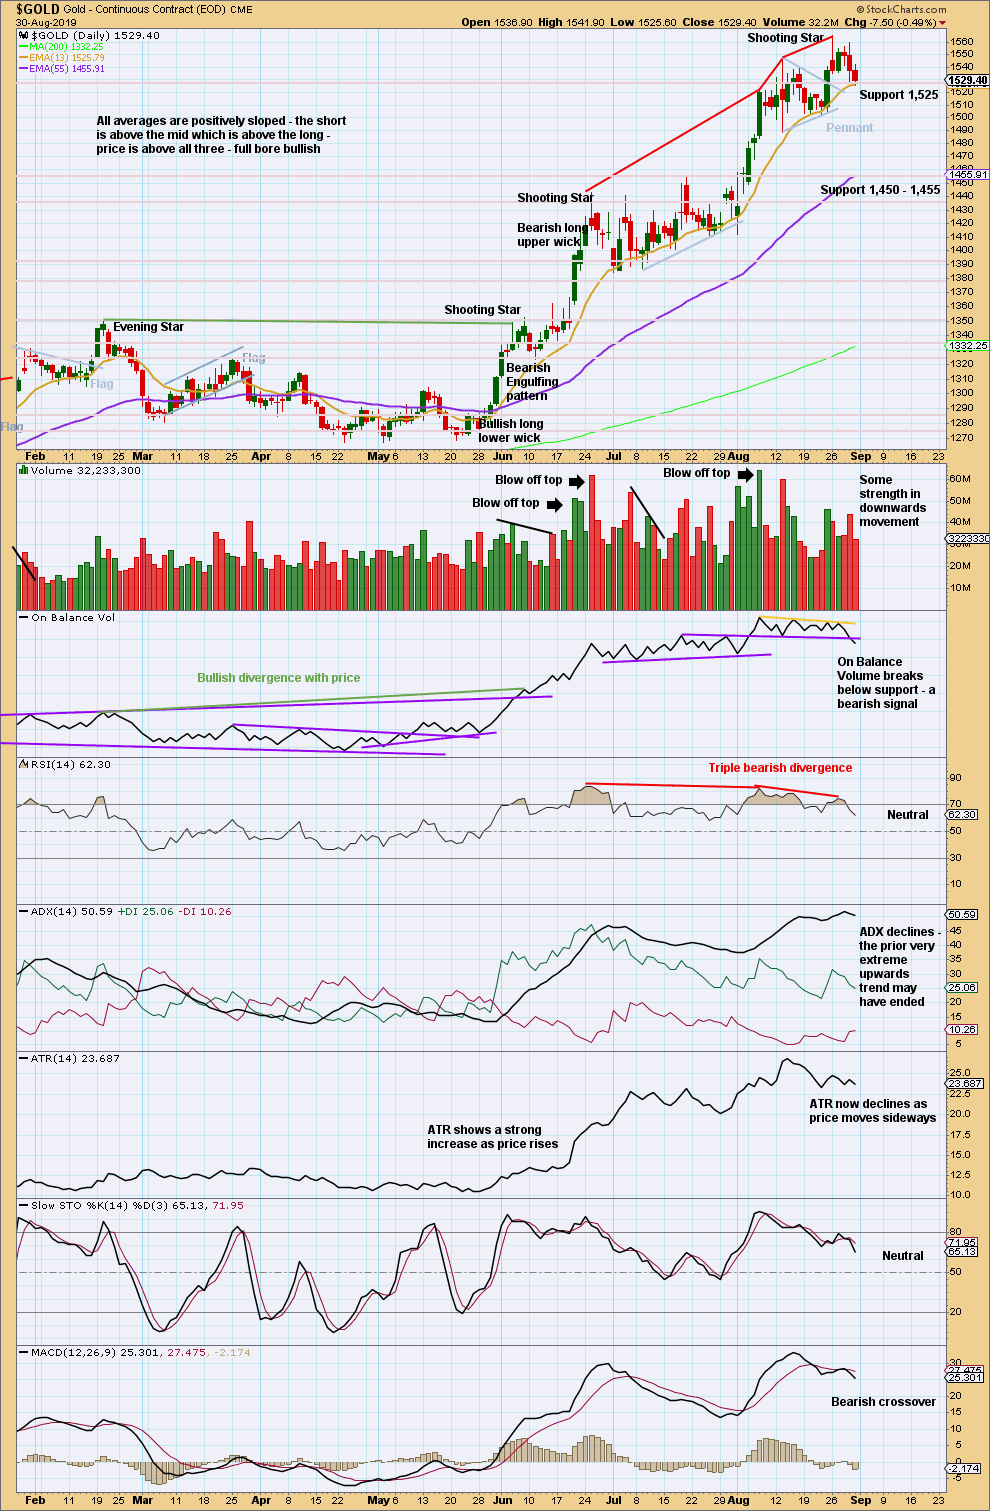
Click chart to enlarge. Chart courtesy of StockCharts.com.
When trends reach very extreme at both weekly and daily time frames, and then candlestick reversal patterns develop at both time frames, more weight may be given to the idea of a major trend change. This is especially so when RSI has reached extreme and then exhibited multiple divergence with price.
Look out for either a major trend change or a very time consuming consolidation to alleviate extreme conditions.
GDX WEEKLY CHART
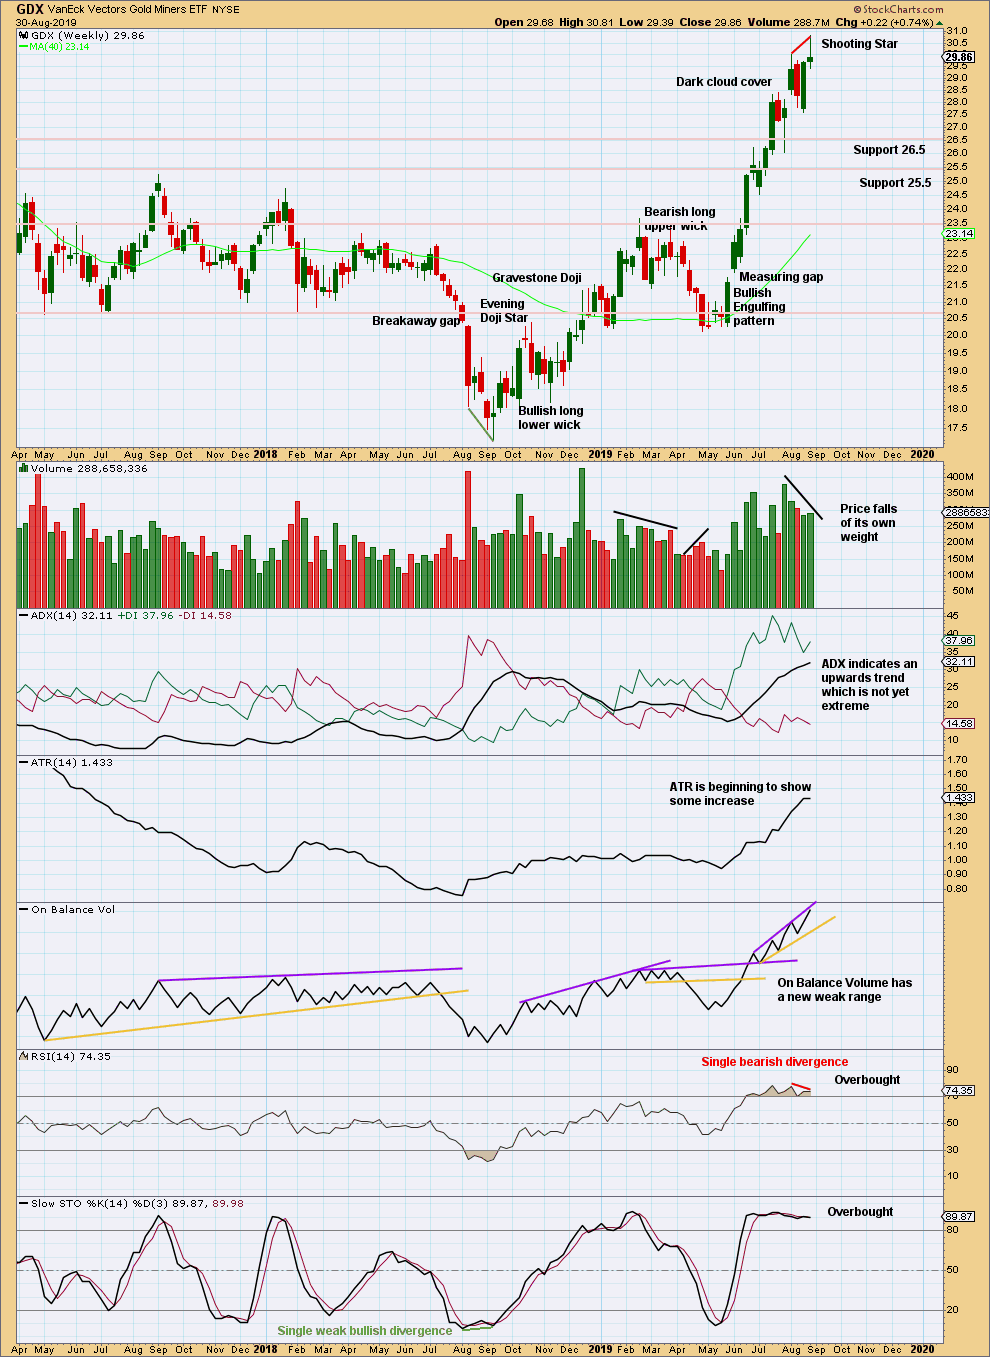
Click chart to enlarge. Chart courtesy of StockCharts.com.
This week closes as a fairly strong bearish candlestick, a Shooting Star with a long upper wick. Look out for either a trend change to either down or sideways here.
GDX DAILY CHART
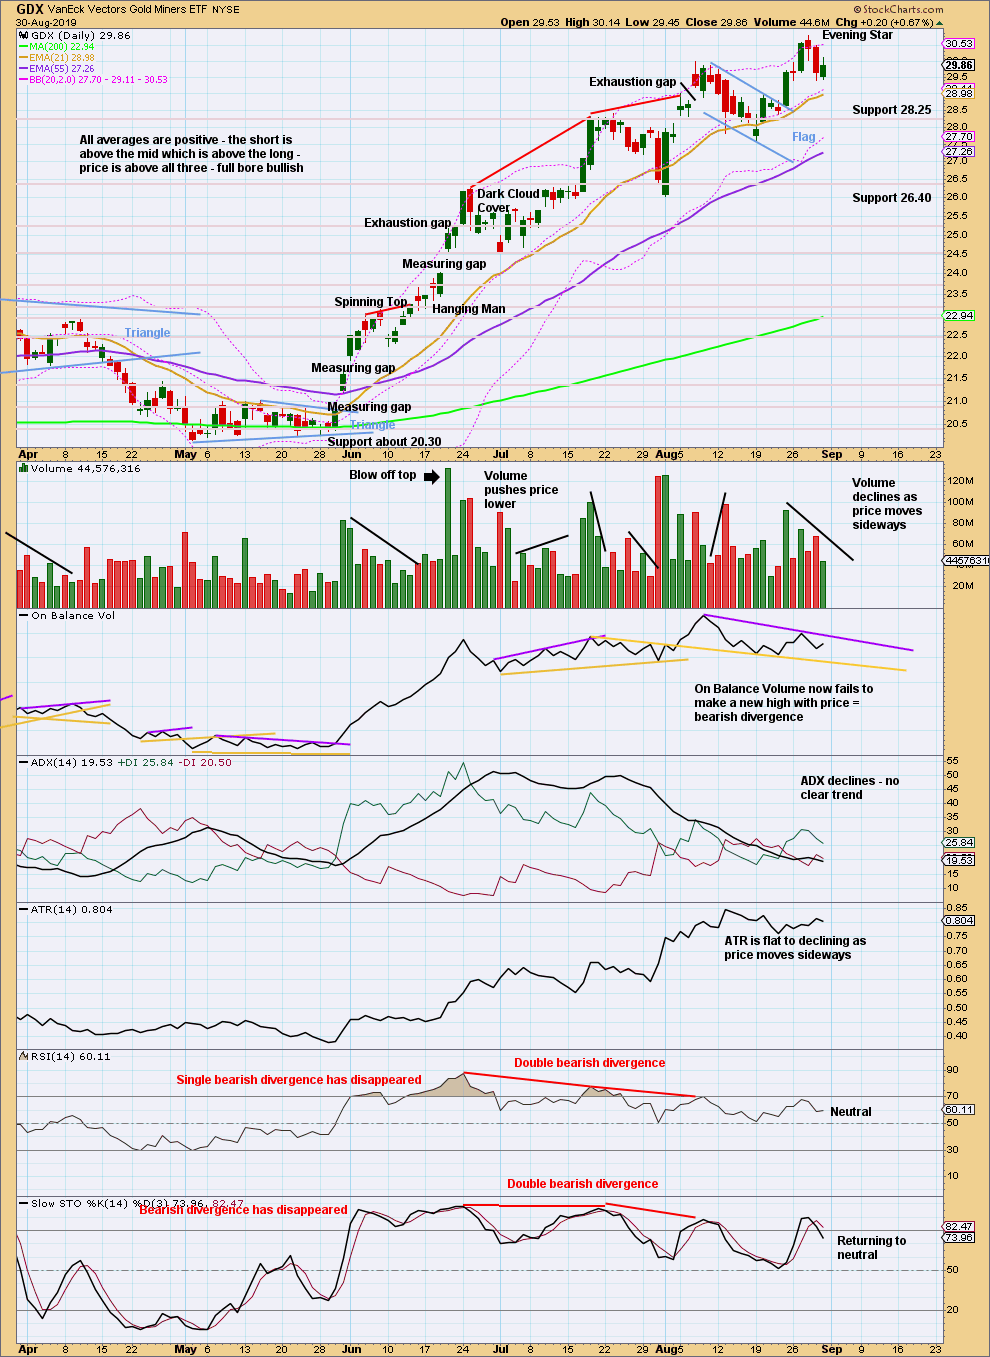
Click chart to enlarge. Chart courtesy of StockCharts.com.
The target using the flag pole is at 32.76. This may now not be met.
GDX may have seen a trend change to either sideways for a consolidation or downwards for a new trend.
US OIL
Downwards movement was expected for Oil this week. Although the candlestick has closed green, a lower low and a lower high fits the expectation.
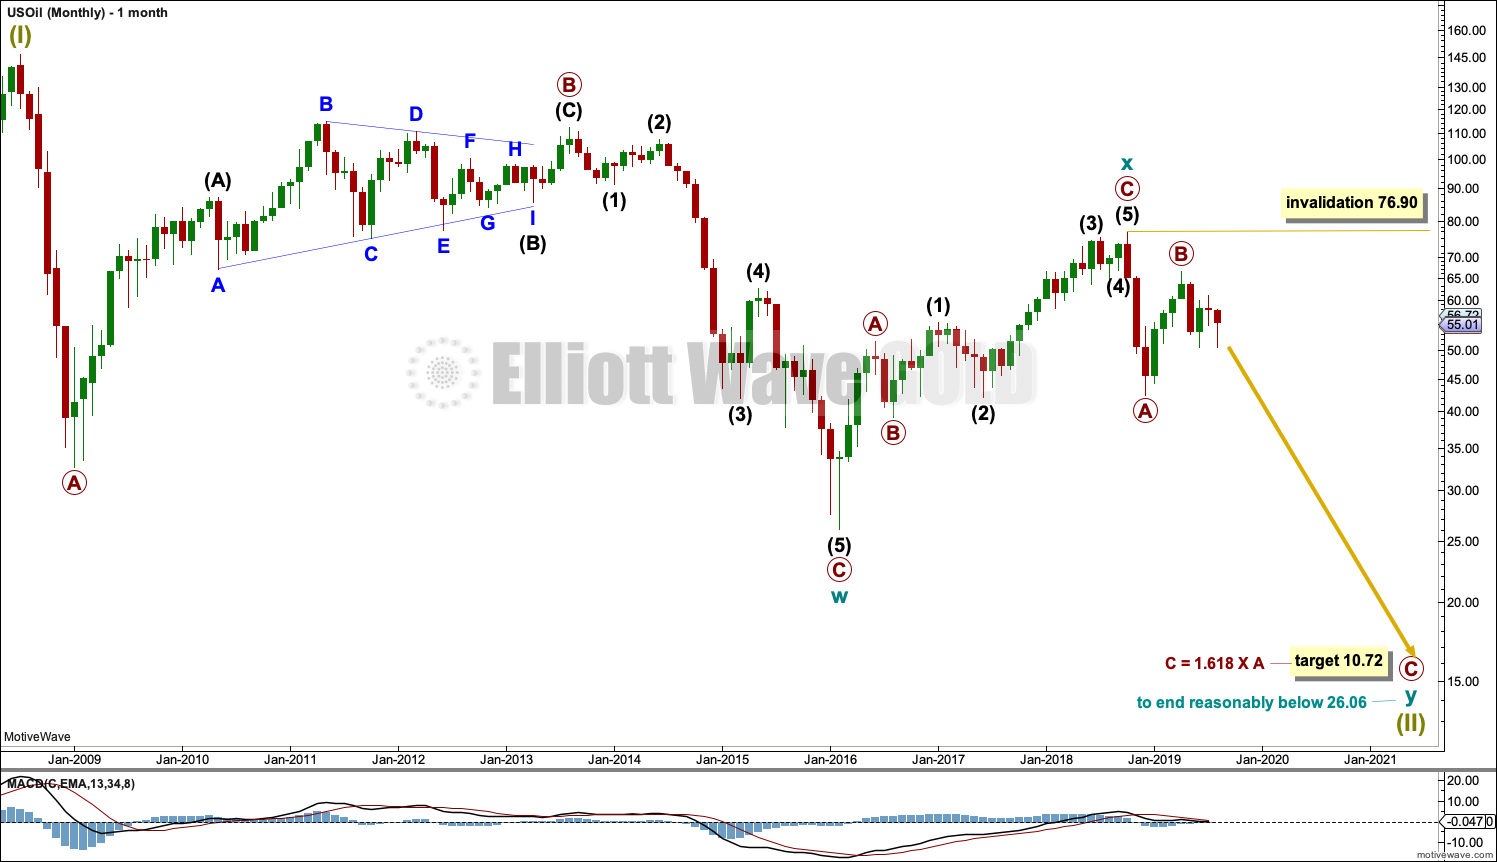
Summary: A new mid-term target is now at 35.25 for a third wave down. This may exhibit an increase in momentum, and may end with a capitulation spike.
The final target is calculated at 10.72. Confidence in this target may be had if price makes a new low below 50.61.
For the short term, a new high above 57.30 would indicate a deeper bounce. The target would then be at 74.75.
The bullish alternate wave count would have confidence above 76.90. At that stage, a target for a third wave to end would be at 89.80.
MAIN ELLIOTT WAVE COUNT – BEARISH
MONTHLY CHART
Click chart to enlarge.
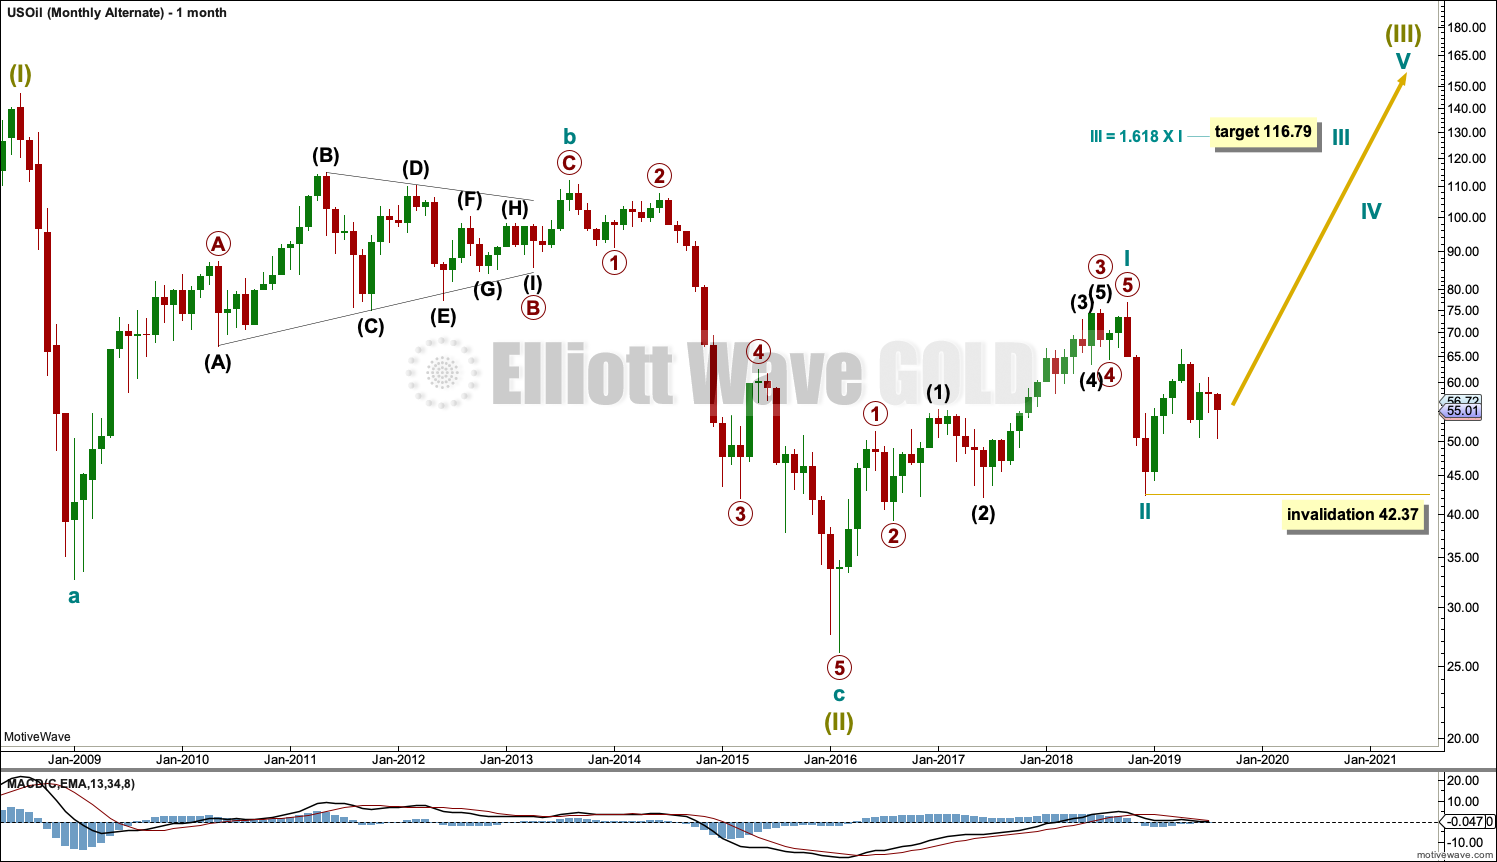
The basic Elliott wave structure is five steps forward and three steps back. This Elliott wave count expects that US Oil is still within a three steps back pattern, which began in July 2008. The Elliott wave count expects that the bear market for US Oil continues.
This Elliott wave corrective structure is a double zigzag, which is a fairly common structure. The correction is labelled Super Cycle wave (II).
The first zigzag in the double is complete and labelled cycle wave y. The double is joined by a three in the opposite direction labelled cycle wave x, which subdivides as a zigzag. The second zigzag in the double may now have begun, labelled cycle wave w.
The purpose of a second zigzag in a double zigzag is to deepen the correction when the first zigzag does not move price deep enough. To achieve this purpose cycle wave y may be expected to move reasonably below the end of cycle wave w at 26.06. The target calculated would see this expectation met.
Cycle wave y is expected to subdivide as a zigzag, which subdivides 5-3-5.
Cycle wave w lasted 7.6 years and cycle wave x lasted 2.7 years. Cycle wave y may be expected to last possibly about a Fibonacci 5 or 8 years.
If it continues higher, then primary wave B may not move beyond the start of primary wave A above 76.90.
WEEKLY CHART
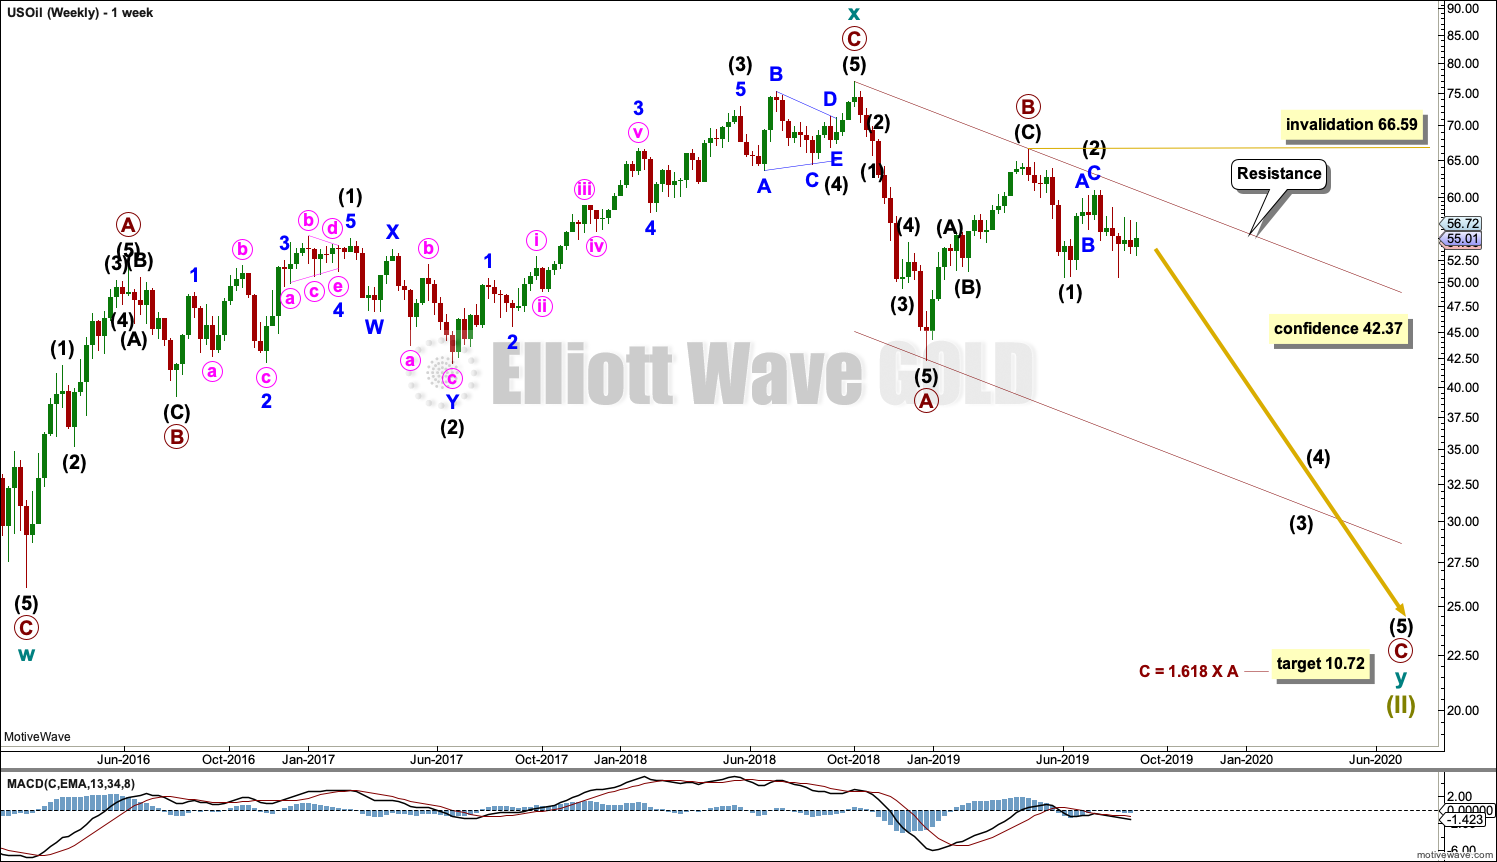
Click chart to enlarge.
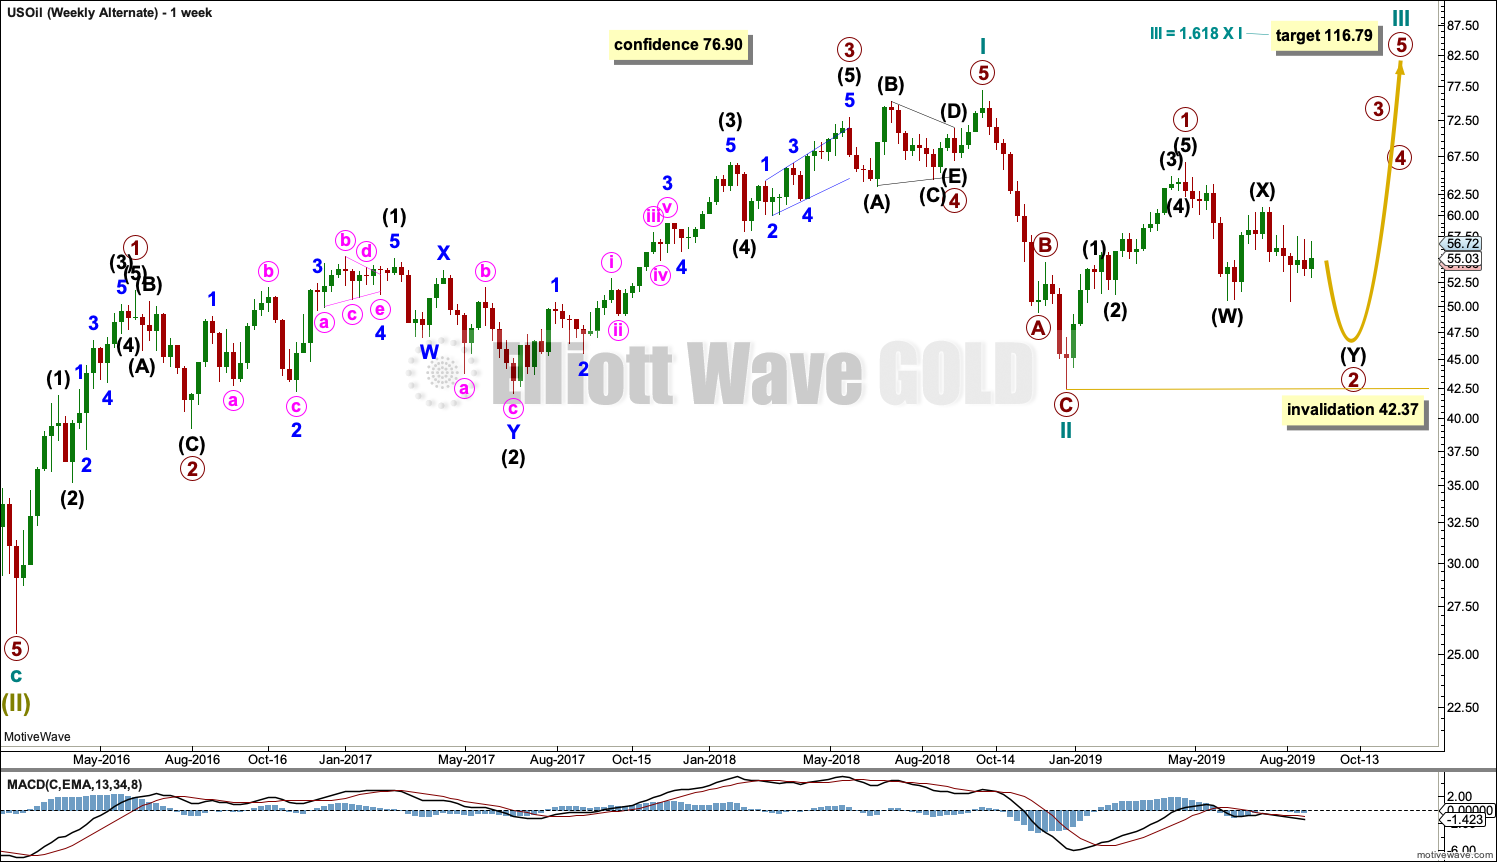
This weekly chart shows all of cycle waves x and y so far.
Cycle wave y is expected to subdivide as a zigzag. A zigzag subdivides 5-3-5. Primary wave A must subdivide as a five wave structure if this wave count is correct.
Primary wave A may be a complete five wave impulse at the last low.
Primary wave B may now be a complete single zigzag at the last high.
Primary wave C may have just begun. Primary wave C must subdivide as a five wave structure.
Primary wave A lasted 12 weeks, just one short of a Fibonacci 13.
Primary wave C may be longer in time as well as price. If cycle wave y lasts a Fibonacci 5 years, then primary wave C within it may take as long as a Fibonacci 233 weeks.
Intermediate wave (1) within primary wave C may be a complete impulse. Intermediate wave (2) may not move beyond the start of intermediate wave (1) above 66.59.
Draw a channel about the zigzag of primary wave y using Elliott’s technique for a correction. Draw the first trend line from the start of primary wave A to the end of primary wave B, then place a parallel copy on the end of primary wave A. The upper edge of this channel is so far showing where bounces along the way down find resistance. The lower edge of the channel may provide support.
DAILY CHART
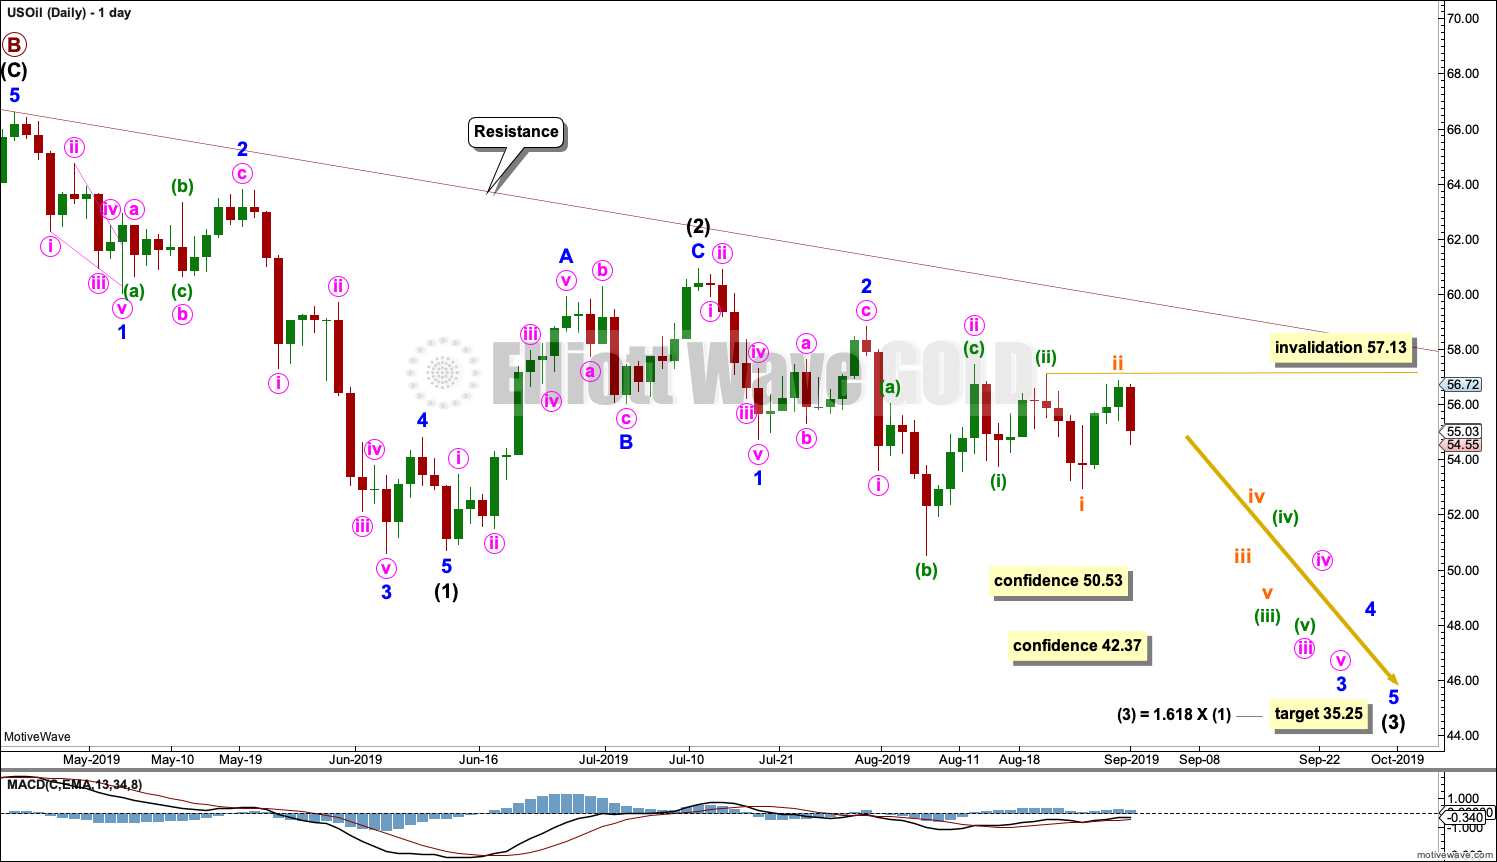
Click chart to enlarge.
Note that monthly and weekly charts are on a semi-log scale, but this daily chart is on an arithmetic scale. This makes a slight difference to trend channels.
Intermediate wave (1) looks complete. Minor wave 4 for this wave count exhibits some alternation to minor wave 2; minor wave 2 may be a relatively deep zigzag or flat, and minor wave 4 may be a more shallow zigzag.
Minor wave 5 ends with a slight 0.11 truncation. All Elliott wave counts must now accept this small truncation.
Intermediate wave (2) may also now be complete as a zigzag.
Intermediate wave (3) may only subdivide as an impulse, and it must move below the end of intermediate wave (1). Within intermediate wave (3), minor waves 1 and 2 may now be complete.
Minor wave 3 may only subdivide as an impulse. Within minor wave 3, minute waves i and ii may now be complete.
Minute wave iii may only subdivide as an impulse. Within minute wave iii, minuette waves (i) and (ii) may be complete. Within minuette wave (iii), subminuette wave ii may not move beyond the start of subminuette wave i above 57.13.
The next downwards wave for this wave count is now expected to be a third wave at five degrees. It may be expected to exhibit an increase in momentum and an increase in ATR. So far it has support from volume pushing price lower.
Oil, typical of commodities, exhibits swift and strong fifth waves. This tendency is especially prevalent in its fifth waves to end third wave impulses one degree higher. Its third waves often begin relatively slowly, build momentum through their middles, and then explode at the end. Intermediate wave (3) here may be beginning slowly and that would be typical behaviour for this market.
SECOND WEEKLY CHART
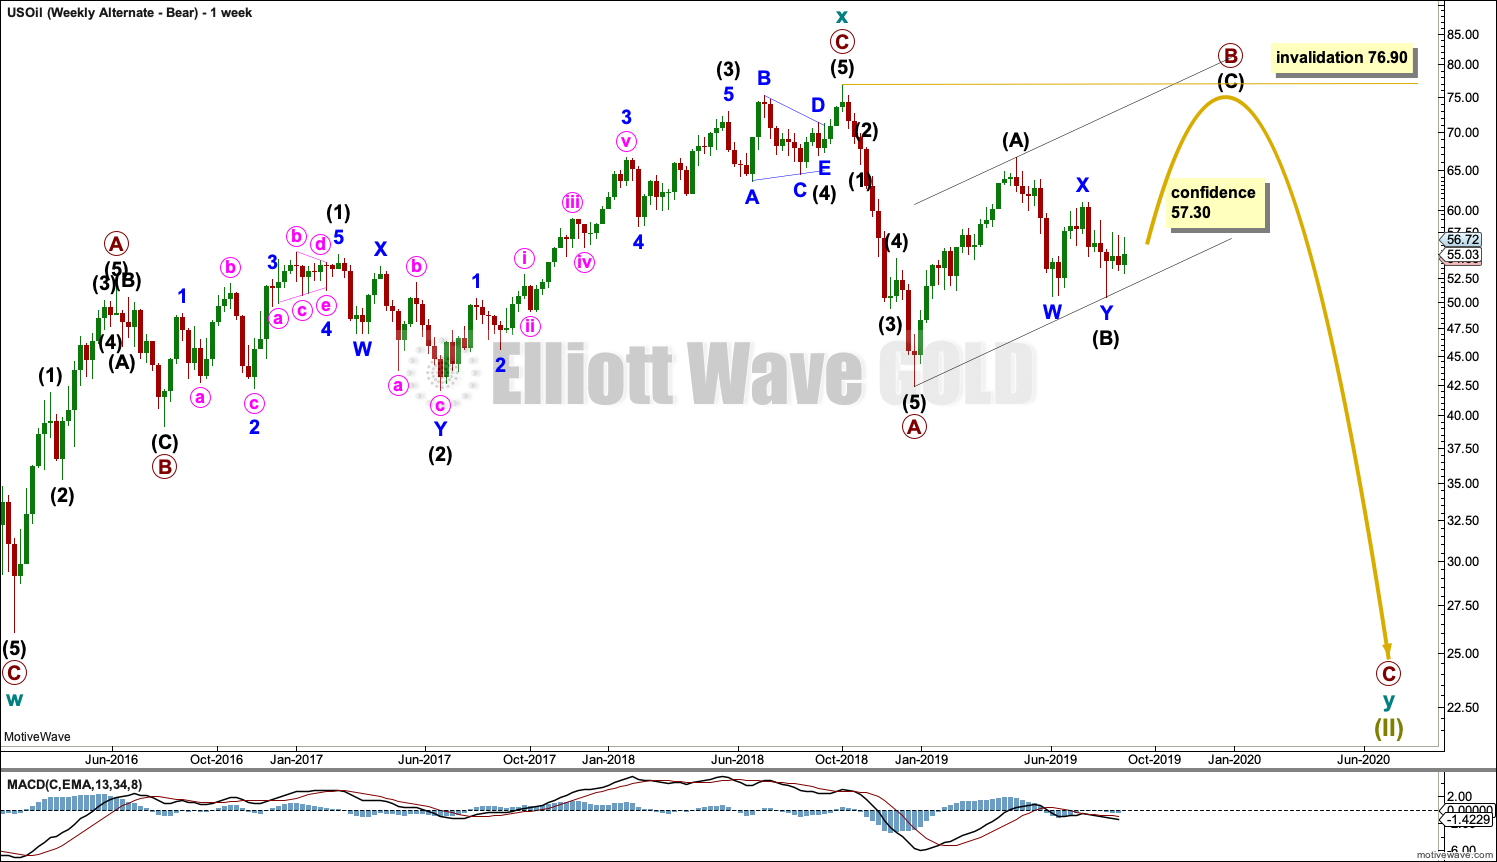
Click chart to enlarge.
This wave count is new this week. This wave count considers the possibility that primary wave B within the zigzag of cycle wave y may be incomplete. This wave count should only be used if price makes a new high by any amount at any time frame above 57.30.
Primary wave B may not move beyond the start of primary wave A above 76.90.
SECOND DAILY CHART
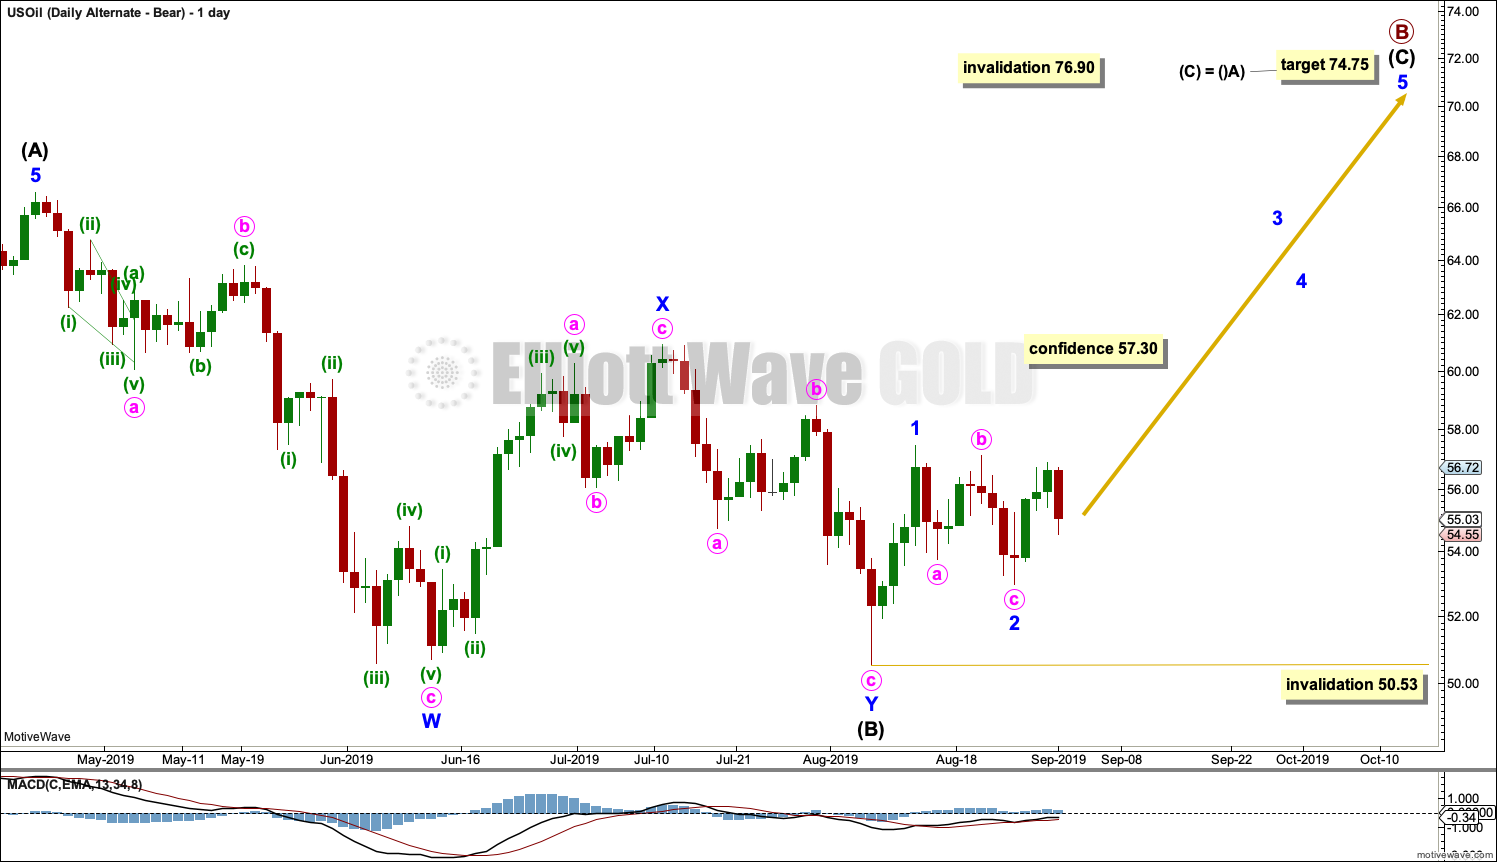
Click chart to enlarge.
Intermediate wave (B) will only fit as a double zigzag. This is possible, but minor wave Y of the double zigzag has barely achieved its purpose to move the correction deeper as it only moves very slightly below the end of minor wave W.
Intermediate wave (C) must subdivide as a five wave motive structure, either an impulse or an ending diagonal. It should move beyond the end of intermediate wave (A) to avoid a truncation.
So far within intermediate wave (C), minor waves 1 and 2 may be complete. If minor wave 2 continues lower or further sideways as a double flat or double combination, then it may not move beyond the start of minor wave 1 below 50.53.
ALTERNATE ELLIOTT WAVE COUNT
MONTHLY CHART
Click chart to enlarge.
It is possible that the bear market is over for Oil and a new bull market has begun.
For a bullish wave count for Oil, the upwards wave from the major low at 26.06 in February 2016 must be seen as a complete five wave impulse. This is labelled cycle wave I.
Cycle wave II may be a complete zigzag at 0.679 the depth of cycle wave I.
A target is calculated for cycle wave III to reach a common Fibonacci ratio to cycle wave I.
Within cycle wave III, no second wave correction may move beyond the start of its first wave below 42.37.
WEEKLY CHART
Click chart to enlarge.
This weekly chart shows detail of cycle wave I as a five wave impulse.
Cycle wave II does look best as a three. This is the only part of this wave count that has a better look than the main wave count, which sees this downwards wave as a five.
The upwards wave of primary wave 1 within cycle wave III must be seen as a five wave structure for a bullish wave count to work. This movement at lower time frames does not subdivide well at all as a five; this reduces the probability of this wave count.
Cycle wave III may only subdivide as an impulse. Within cycle wave III, so far primary wave 1 may be complete. Primary wave 2 may be moving lower as a double zigzag. Primary wave 2 may not move beyond the start of primary wave 1 below 42.37.
DAILY CHART
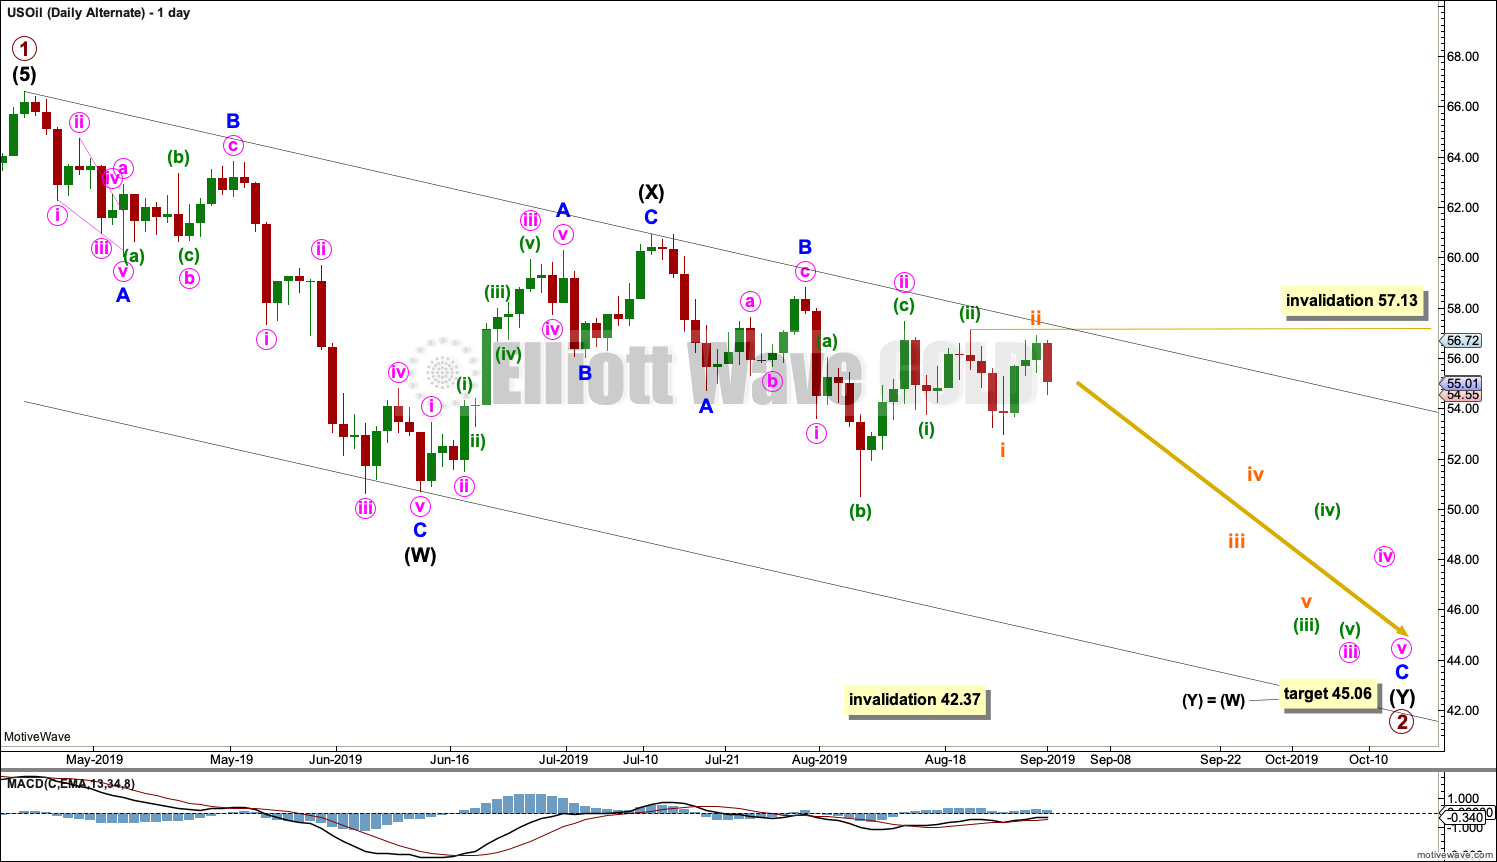
Click chart to enlarge.
Primary wave 2 may be continuing lower as a double zigzag.
The first zigzag in the double would be complete, labelled intermediate wave (W). Within intermediate wave (W), minor wave C ends with a slight truncation for minute wave v. This is acceptable.
The double may be now joined by a complete three in the opposite direction, a zigzag labelled intermediate wave (X).
A second zigzag may now unfold labelled intermediate wave (Y). Within intermediate wave (Y), minor waves A and B may be complete. Minor wave C must now complete lower as a five wave structure. Within minor wave C, minute waves i and ii may now be complete.
Minute wave iii may only subdivide as an impulse. Within minute wave iii, minuette waves (i) and (ii) may be complete. Within minuette wave (iii), subminuette wave ii may not move beyond the start of subminuette wave i above 57.13.
TECHNICAL ANALYSIS
MONTHLY CHART
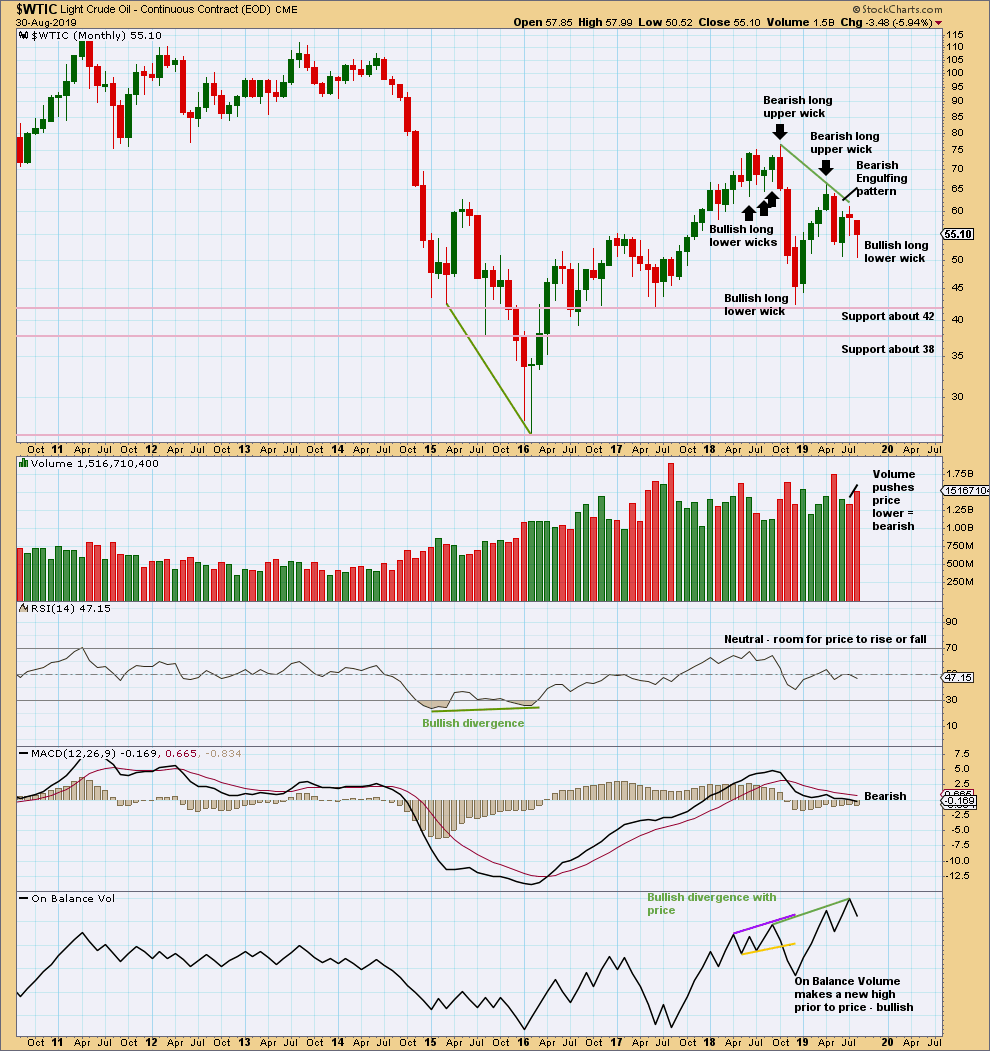
Click chart to enlarge. Chart courtesy of StockCharts.com.
August has closed with a long lower wick, which is bullish, but price has moved lower with push from volume, which is bearish.
Overall, this month is judged to be more bearish than bullish.
There is now double bullish divergence between price and On Balance Volume. This supports the alternate Elliott wave count.
WEEKLY CHART
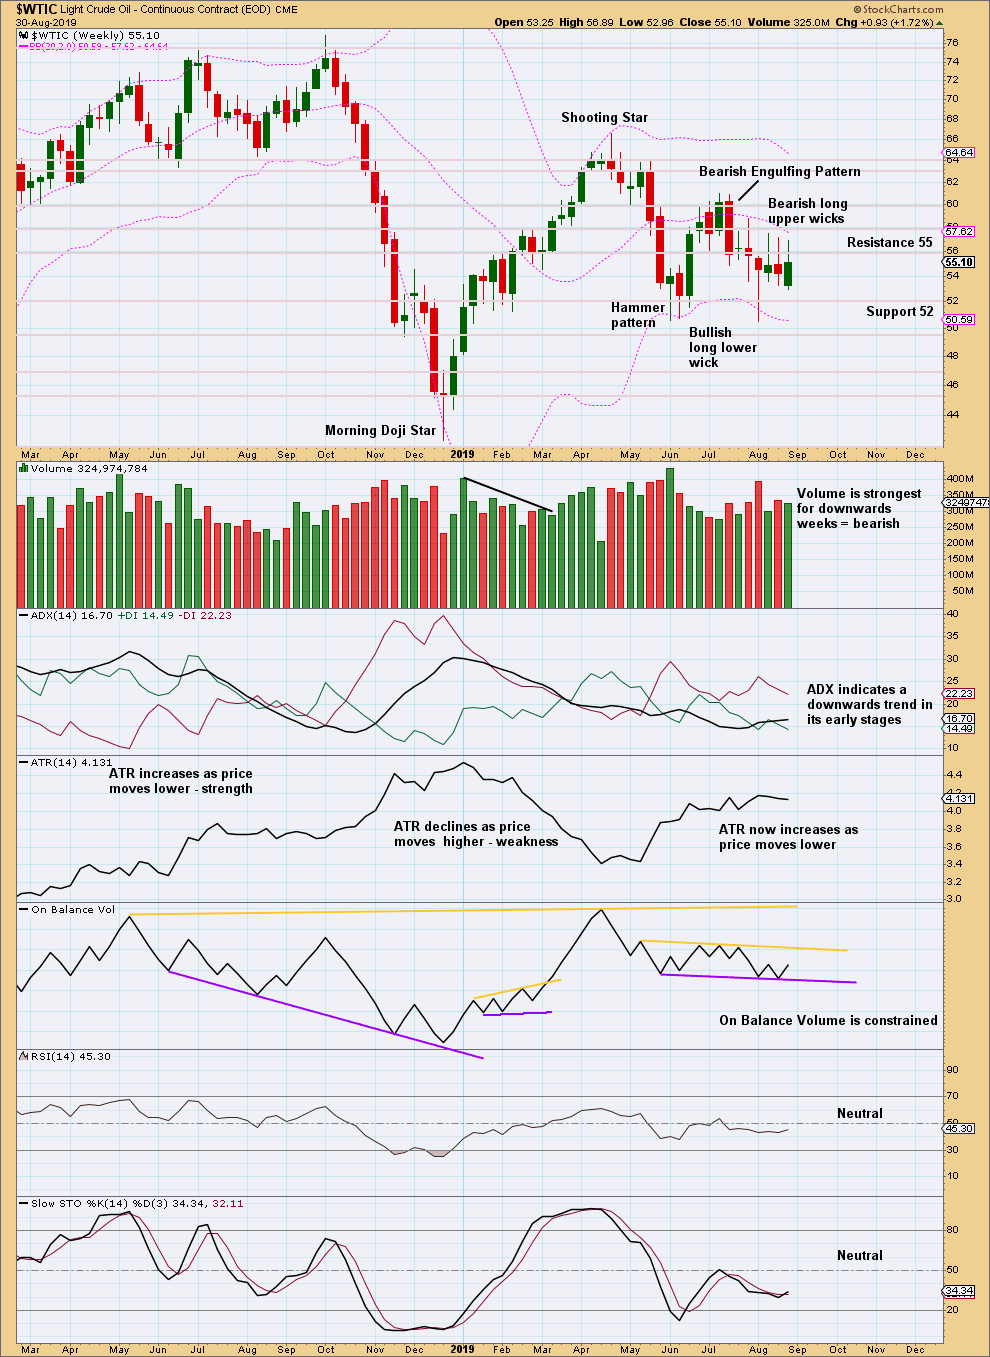
Click chart to enlarge. Chart courtesy of StockCharts.com.
Three weeks in a row now with long upper wicks are bearish and support the main Elliott wave count.
There is again a downwards trend in place. ADX is giving the strongest signal it can give.
DAILY CHART
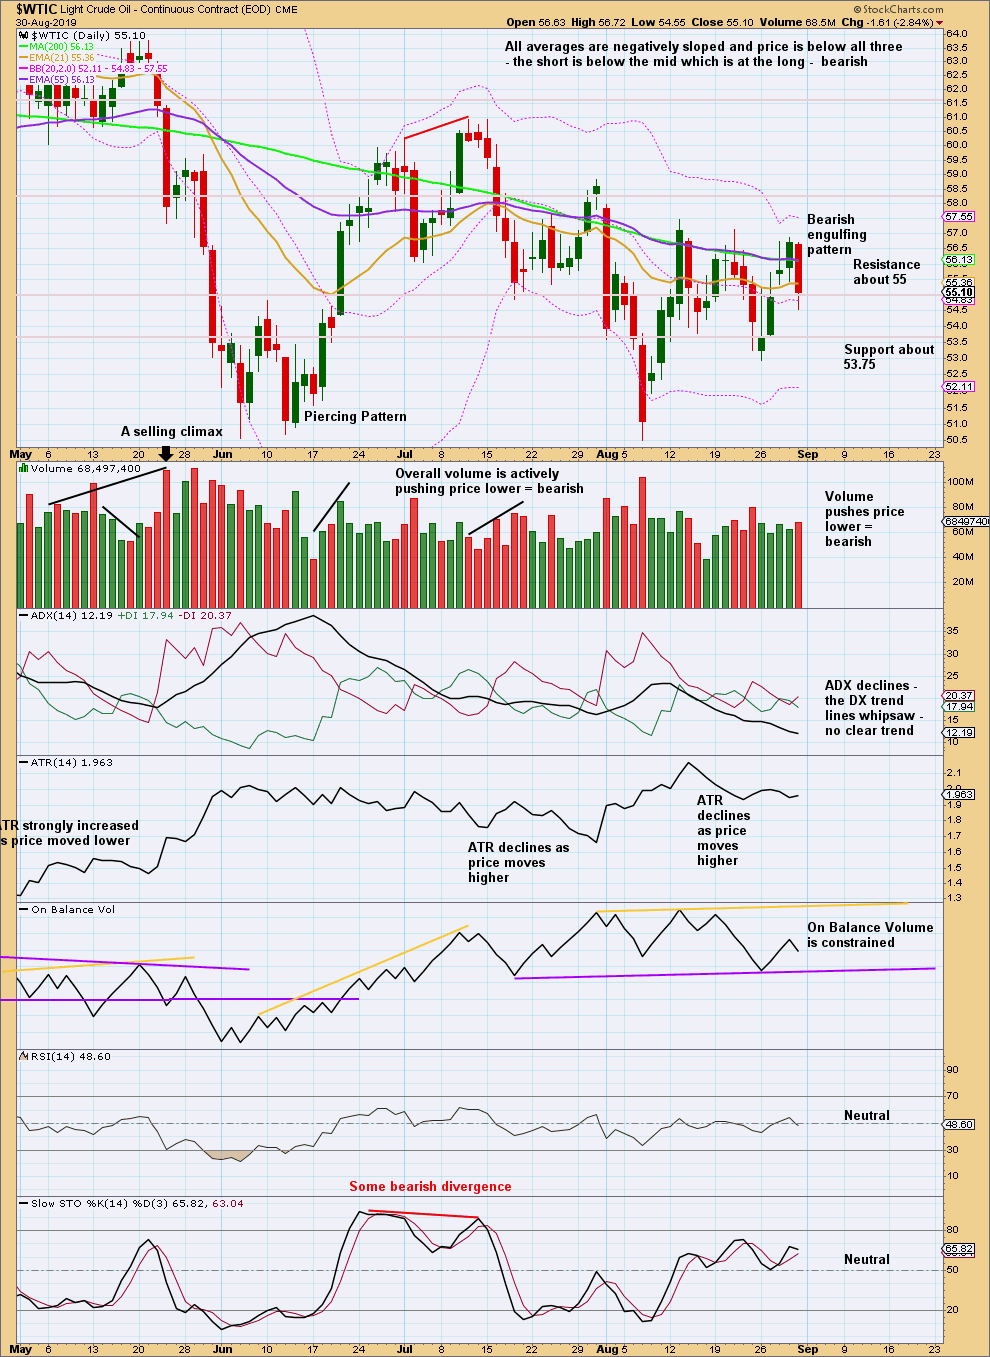
Click chart to enlarge. Chart courtesy of StockCharts.com.
Overall, this chart is still bearish and supports the main Elliott wave count.
—
Always practice good risk management as the most important aspect of trading. Always trade with stops and invest only 1-5% of equity on any one trade. Failure to manage risk is the most common mistake new traders make.
Updated daily chart for Oil:
Minute ii may have continued sideways, it now fits very nicely as a double flat. It’s disproportionate to minor 2 one degree higher, but not so much so that the count should be discarded based upon disproportion.
Price reached up today very close to the upper trend line. The long upper wick today strongly suggests its found resistance there and should move lower tomorrow.
Lara,
Thank you for the update. I sketched out the Minuette waves on my chart. All within 140 to 160 bars. If we can break below September 3rd price I’ll watch the retracement.
I am with you Rodney on the mid-term outlook for Oil and using UWT as my ETF of choice.
I never did put on a short position of OIL. I am quite thankful for that. It now looks like OIL has quite a bit upside to go. This should power the advance of energy equities and the SPX 500 index to new ATH’s.
In fact, after looking things over, I now have a full long position in OIL using a 3X leveraged ETF (OILU). Have a great day.
Oil remains range bound and below the resistance line. The long upper wick today on the daily candlestick is concerning for bulls. Caution for long positions is strongly advised.
Thanks for the update and cautionary comment. Oil certainly did not finish the day as I expected.
On another topic, I’ve have got to make a rule for myself. No trading decisions before two full cups of coffee.
Once again, Lara, you are absolutely right. I am out of my OIL long. Poor decision on my part. Still at age 65 I am learning lessons. Cheers.
Hi Lara,
How would you go about determining the correlation between US Oil and the S&P? Since last October the two seem to have been moving together.
StockCharts have a correlation co-efficient tool.
There is definitely no reliable statistically significant correlation between these two markets.
They will appear to be positively correlated from time to time, their correlation coefficient may be above 0.5. But much of the time it is less than 0.5, in the shaded zone. And so any apparent correlation is more likely due to chance and not due to a relationship between them.
Hi Lara, I was hoping for an update on Bitcoin sometime in the next week or two??
Sure. I’m still expecting it to move lower. It’s just taking its sweet sweet time. Ugh
Wow, lots of action in all three markets. I have gone 100% long in SPX. I am looking at a short position in GOLD as well as going short OIL. A lot for our consideration. Thank you Lara. I am wondering how other members are positioning their investments / trades. Love to hear from you all.
Have a great weekend and for those in the USA a great Labor Day Weekend. My labors this year have provided much fruit / return. I am quite blessed and quite grateful for that. Oh, BTW, today is my first day qualifying for and a recipient of Medicare in the USA. I will now begin to collect on that for which I have been contributing (through taxes) for 53 years!
I’m still holding onto my oil shorts, who h I’ve had in place since early May at about 58usd. I completely missed the run up in gold, and don’t have the confidence to take any position atm.
jkmistry,
did you actually short oil stock directly or do you hold an inverse ETF?
If inverse ETF, does it get badly, heavily affected by decay, when oil goes up?
Lastly if ETF, do you mind sharing which one, please.
Thanks.
I’ve done both. The decay on ETFs is hard to watch, but was my mistake for not adjusting my stops lower. I use 3ois on the lse which is priced in usd, but it’s a bit of a pain if there are big moves in the afternoon in new York, which will result in it gapping the next day. I also trade tsx:hod (2x), drip, and oild. But I’m gonna stop using drip because it’s not purely us oil.
Thank you very much for sharing. I appreciate your help. Regards
Haven’t traded much this year due to my trading knowledge and market actions. I reduced my 401k in February this year, no intention of adding. My study has been using momentum indicators and during sideway price action momentum indicators fail.
The market needs to provide me some direction before I choose an instrument.