

S&P 500
A finish to the week with a small range inside day does not change the Elliott wave count. The target remains the same and the wave count has strong support from classic technical analysis.
Summary: An upwards breakout above 2,940 with support from volume adds confidence in the wave count. The next target is 3,120. Classic analysis very strongly supports this main wave count.
The biggest picture, Grand Super Cycle analysis, is here.
Monthly charts were last published here. There are two further alternate monthly charts here.
ELLIOTT WAVE COUNTS
The two weekly Elliott wave counts below will be labelled First and Second. They may be about of even probability. When the fifth wave currently unfolding on weekly charts may be complete, then these two wave counts will diverge on the severity of the expected following bear market. To see an illustration of this future divergence monthly charts should be viewed.
FIRST WAVE COUNT
WEEKLY CHART
Click chart to enlarge.
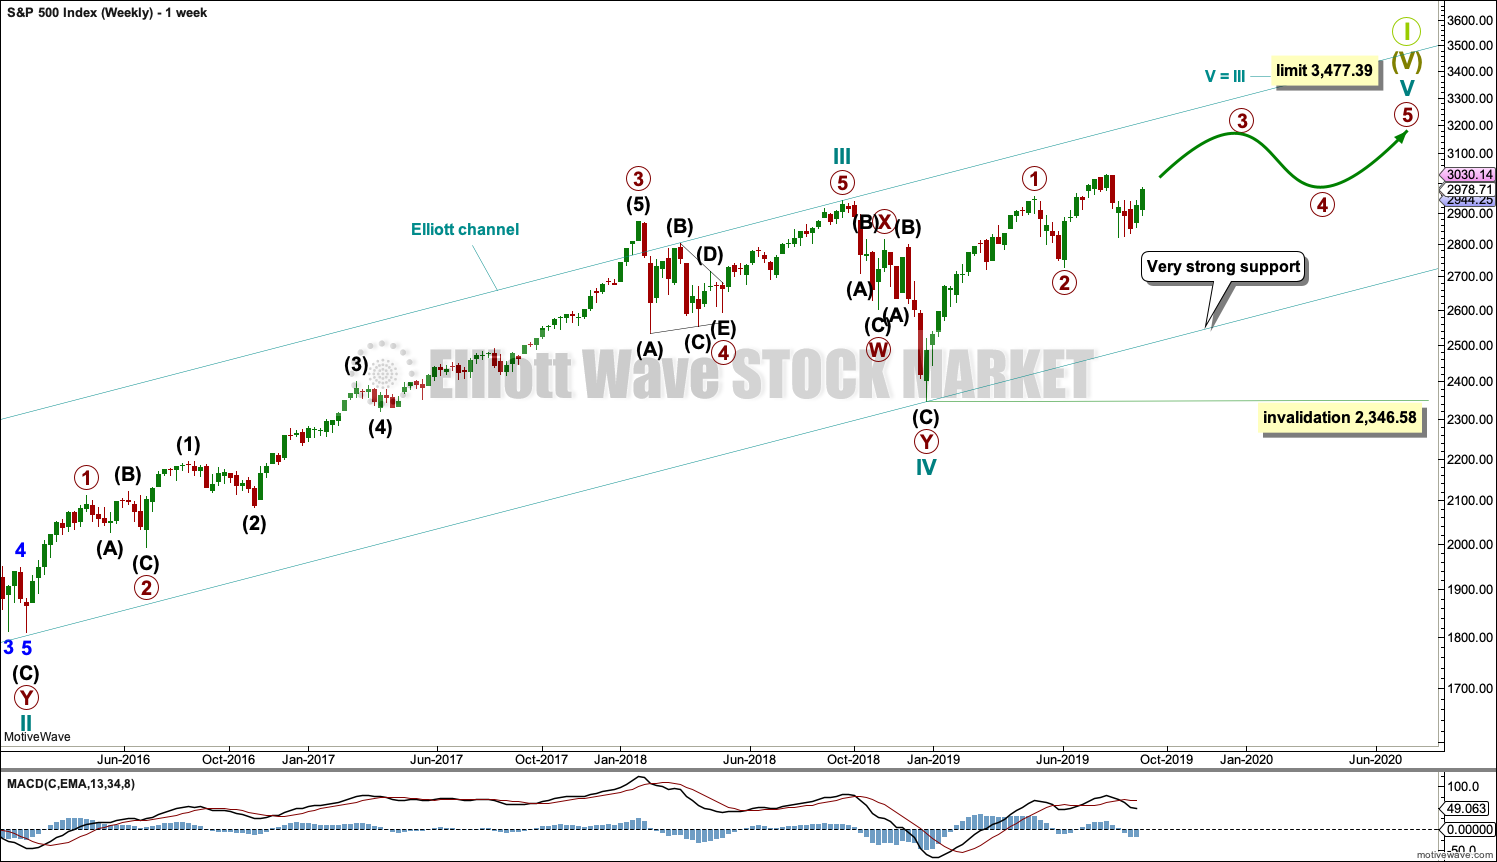
The basic Elliott wave structure consists of a five wave structure up followed by a three wave structure down (for a bull market). This wave count sees the bull market beginning in March 2009 as an incomplete five wave impulse and now within the last fifth wave, which is labelled cycle wave V. This impulse is best viewed on monthly charts. The weekly chart focusses on the end of it.
Elliott wave is fractal. This fifth wave labelled cycle wave V may end a larger fifth wave labelled Super Cycle wave (V), which may end a larger first wave labelled Grand Super Cycle wave I.
The teal Elliott channel is drawn using Elliott’s first technique about the impulse of Super Cycle wave (V). Draw the first trend line from the end of cycle wave I (off to the left of the chart, the weekly candlestick beginning 30th November 2014) to the end of cycle wave III, then place a parallel copy on the end of cycle wave II. This channel perfectly shows where cycle wave IV ended at support. The strongest portion of cycle wave III, the end of primary wave 3, overshoots the upper edge of the channel. This is a typical look for a third wave and suggests the channel is drawn correctly and the way the impulse is counted is correct.
Within Super Cycle wave (V), cycle wave III is shorter than cycle wave I. A core Elliott wave rule states that a third wave may never be the shortest. For this rule to be met in this instance, cycle wave V may not be longer in length than cycle wave III. This limit is at 3,477.39.
Cycle wave V may subdivide either as an impulse or an ending diagonal. Impulses are much more common. This main wave count expects that cycle wave V may be unfolding as an impulse.
The daily chart below will now focus on all movement from the end of primary wave 1.
In historic analysis, two further monthly charts have been published that do not have a limit to upwards movement and are more bullish than this wave count. Members are encouraged to consider those possibilities (links below summary) alongside the wave counts presented on a daily and weekly basis.
DAILY CHART
Click chart to enlarge.
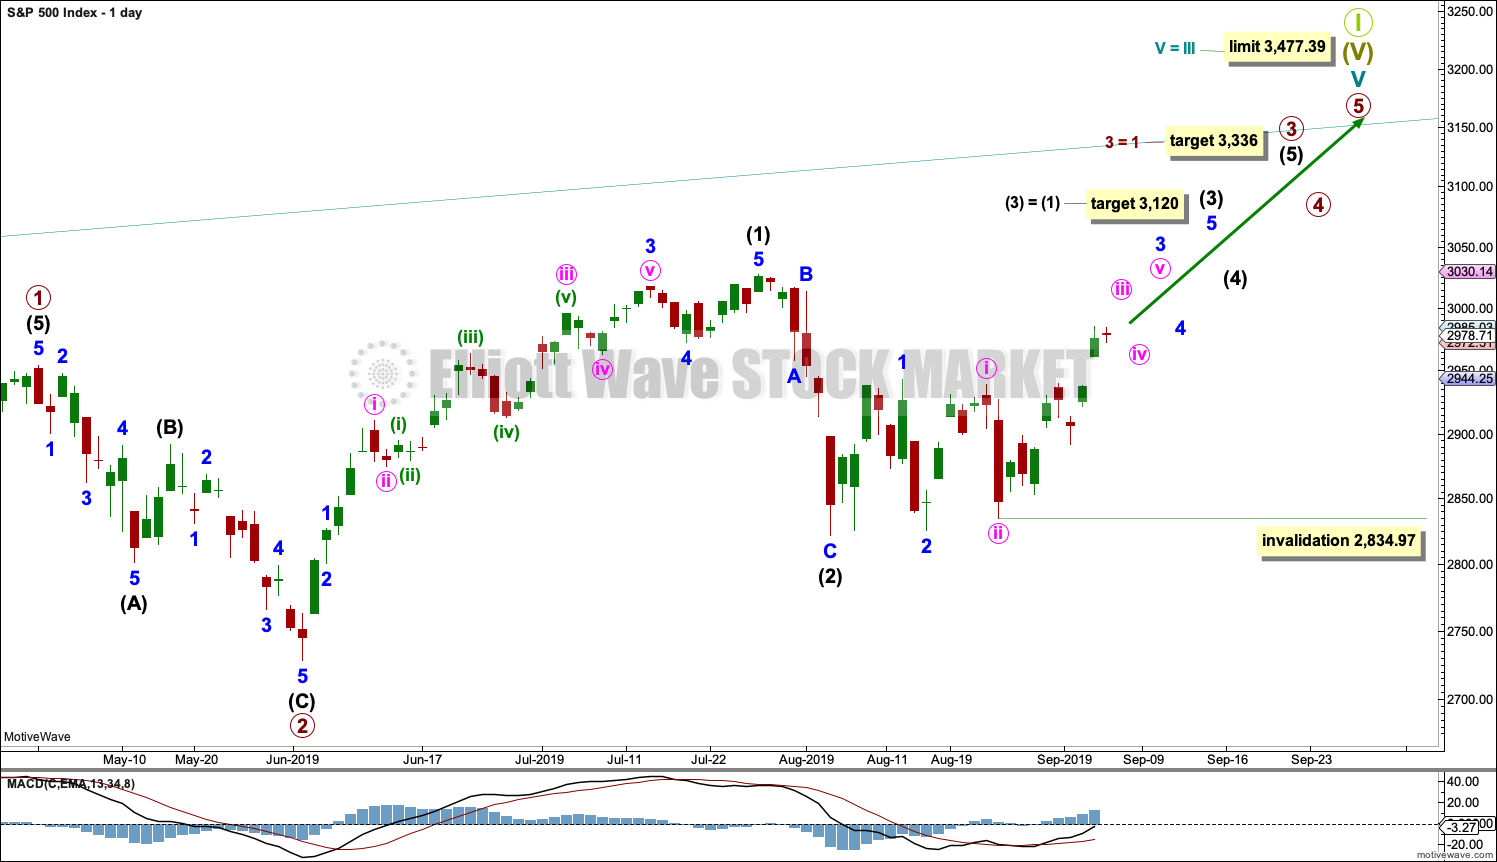
Cycle wave V is seen as an impulse for this wave count.
Within cycle wave V, primary waves 1 and 2 may be complete. Primary wave 3 may have begun.
Primary wave 3 may only subdivide as an impulse. Within primary wave 3, intermediate waves (1) and (2) may be complete.
Intermediate wave (3) may have begun. Intermediate wave (3) may only subdivide as an impulse.
Within intermediate wave (3), minor waves 1 and 2 may be complete. Within minor wave 3, minute waves i and ii may be complete. Within minute wave iii, no second wave correction may move beyond its start below 2,834.97.
All of primary wave 3, intermediate wave (3), minor wave 3 and minute wave iii may only subdivide as impulses.
Intermediate wave (3) must move far enough above the end of intermediate wave (1) to then allow intermediate wave (4) to unfold and remain above intermediate wave (1) price territory.
SECOND WAVE COUNT
WEEKLY CHART
Click chart to enlarge.
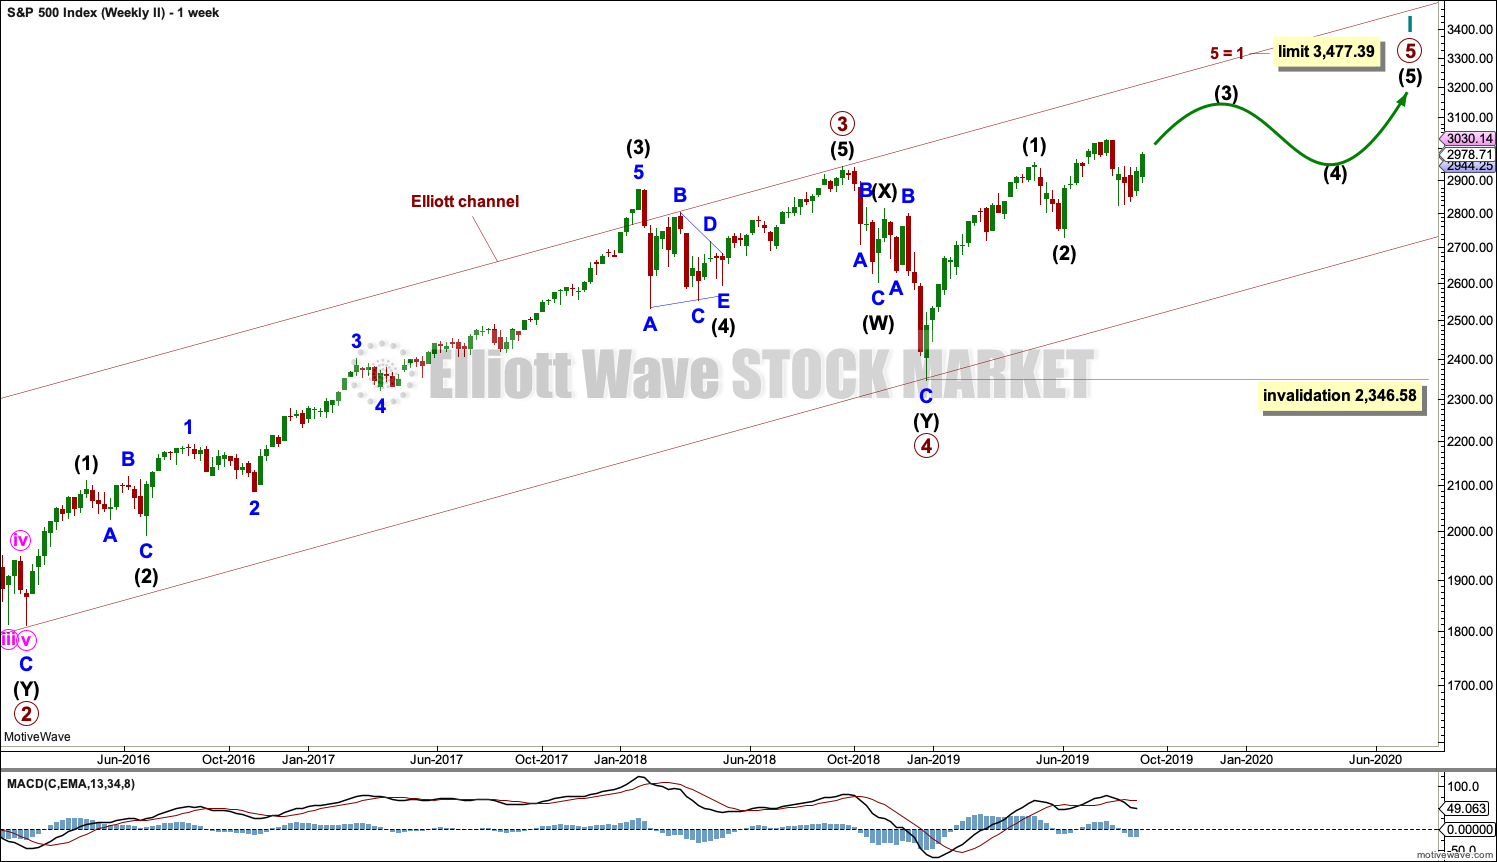
This weekly chart is almost identical to the first weekly chart, with the sole exception being the degree of labelling.
This weekly chart moves the degree of labelling for the impulse beginning in March 2009 all down one degree. This difference is best viewed on monthly charts.
The impulse is still viewed as nearing an end; a fifth wave is still seen as needing to complete higher. This wave count labels it primary wave 5.
TECHNICAL ANALYSIS
WEEKLY CHART
Click chart to enlarge. Chart courtesy of StockCharts.com.
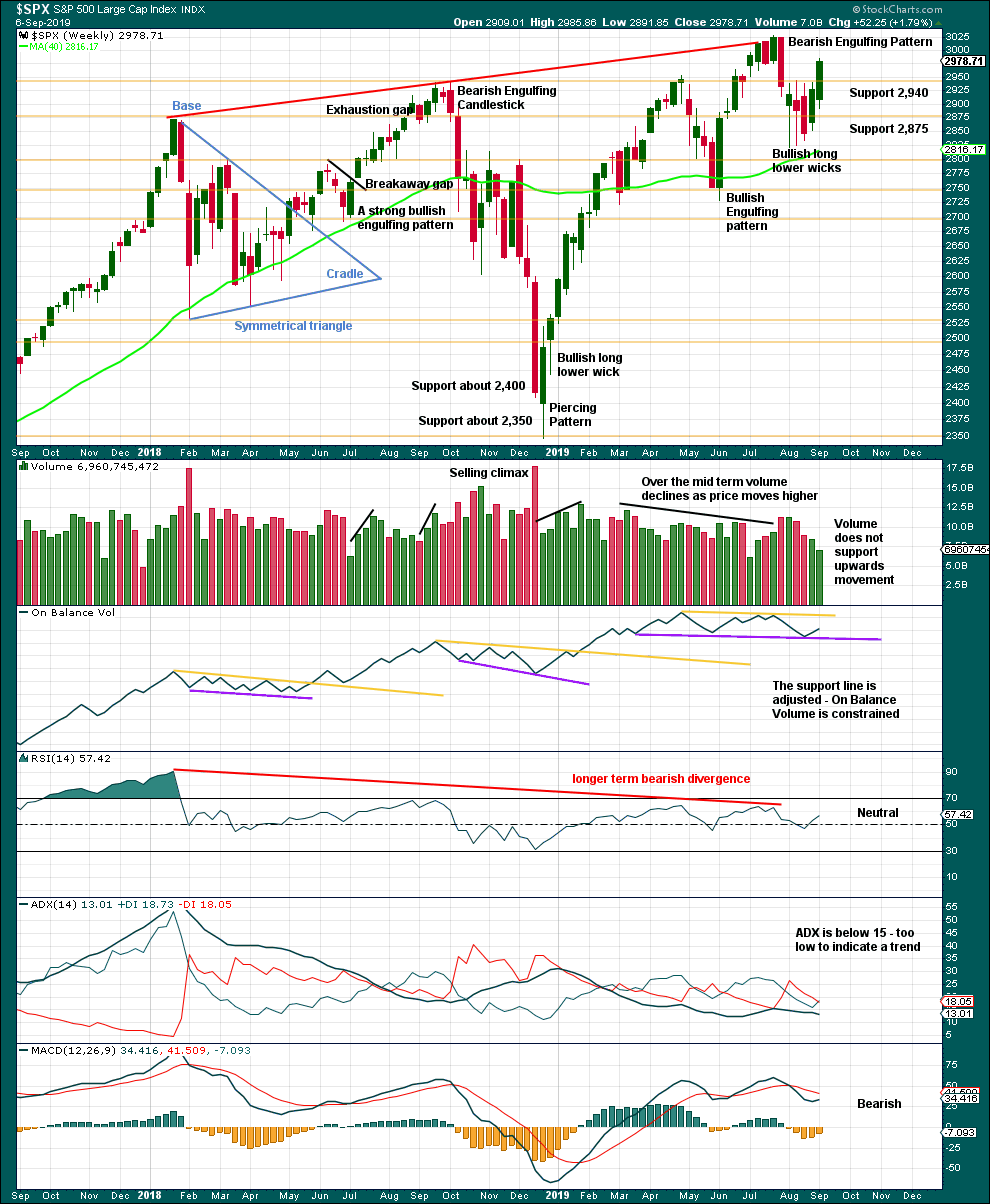
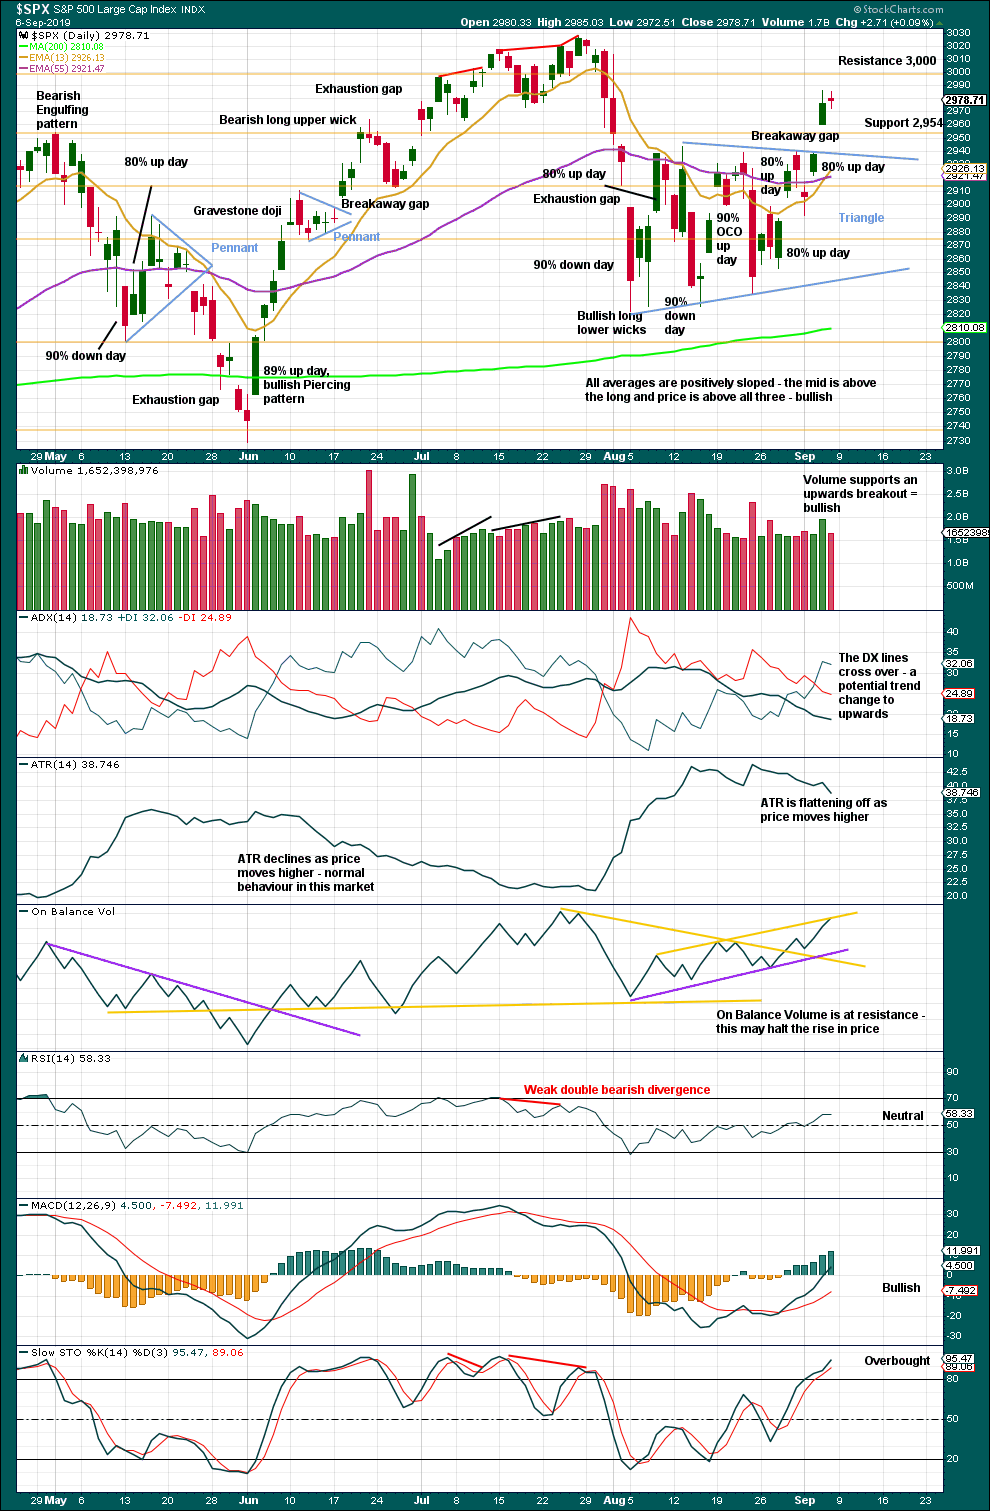
This week has effected an upwards breakout from a small range of the prior three weeks. While the breakout does not have support from volume at the weekly chart level, it does at the daily chart level for the day of the breakout.
DAILY CHART
Click chart to enlarge. Chart courtesy of StockCharts.com.
The last low of the 15th of August was preceded immediately by a 90% downward day and followed immediately by a 90% OCO (Operating Companies Only) up day. This is a pattern commonly found at major lows, and it indicates a 180 degree shift in sentiment from bearish to bullish. This favours the main Elliott wave count.
Now the next low of the 23rd of August has been followed by two back to back 80% up days. This too is very bullish and favours the main Elliott wave count.
There is now an upwards breakout above the triangle pattern with support from volume and a breakaway gap. The breakaway gap may offer support at 2,938.84.
A target from the triangle pattern is 3,060.
Look for next resistance about 3,000.
BREADTH – AD LINE
WEEKLY CHART
Click chart to enlarge. Chart courtesy of StockCharts.com. So that colour blind members are included, bearish signals
will be noted with blue and bullish signals with yellow.
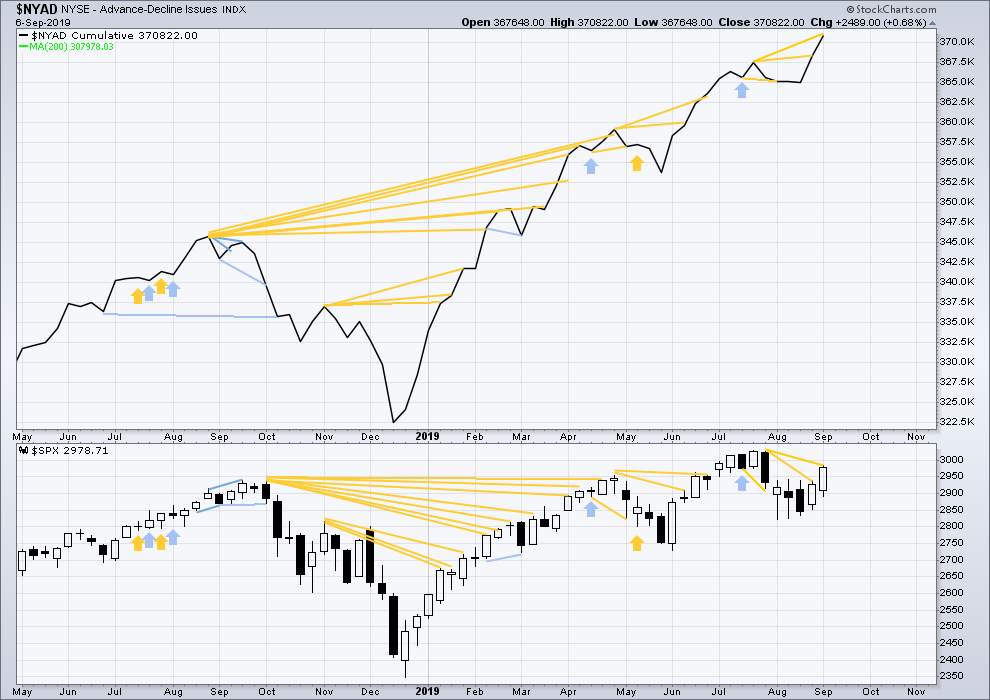
Bear markets from the Great Depression and onwards have been preceded by an average minimum of 4 months divergence between price and the AD line with only two exceptions in 1946 and 1976. With the AD line making new all time highs again this week, the end of this bull market and the start of a new bear market is very likely a minimum of 4 months away, which is the beginning of January 2020.
In all bear markets in the last 90 years there is some positive correlation (0.6022) between the length of bearish divergence and the depth of the following bear market. No to little divergence is correlated with more shallow bear markets. Longer divergence is correlated with deeper bear markets.
If a bear market does develop here, it comes after no bearish divergence. It would therefore more likely be shallow.
Again, this week both price and the AD line have moved higher.
The AD line makes a new all time high. This is a very bullish signal and very strongly supports the Elliott wave count.
DAILY CHART
Click chart to enlarge. Chart courtesy of StockCharts.com. So that colour blind members are included, bearish signals
will be noted with blue and bullish signals with yellow.
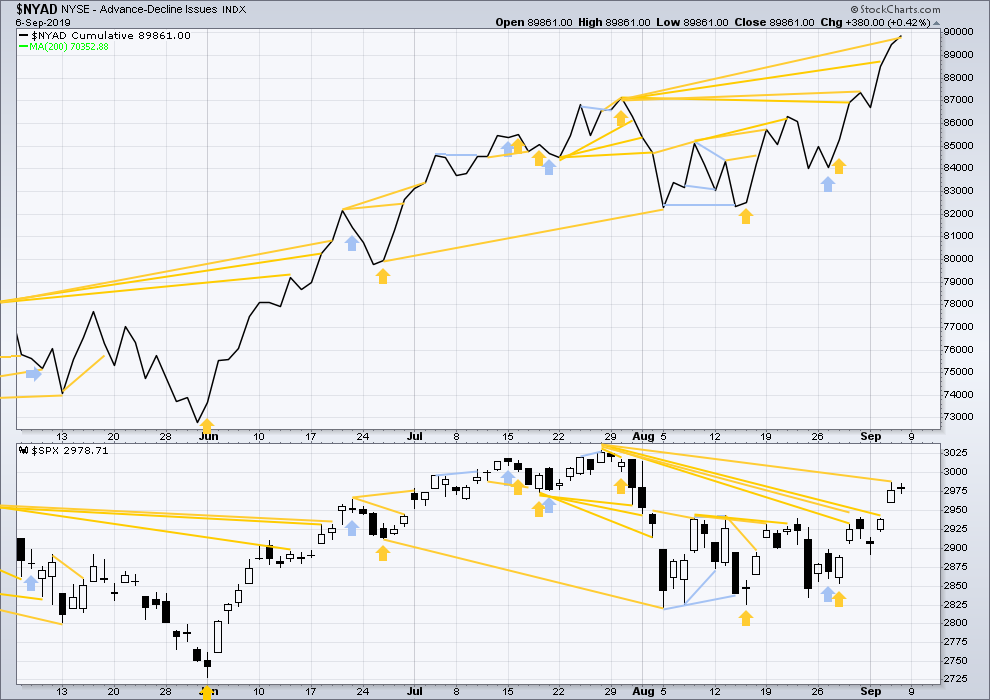
Breadth should be read as a leading indicator.
Again, the AD line makes another new all all time high. This is a very bullish signal and strongly favours the Elliott wave count.
VOLATILITY – INVERTED VIX CHART
WEEKLY CHART
Click chart to enlarge. Chart courtesy of StockCharts.com. So that colour blind members are included, bearish signals
will be noted with blue and bullish signals with yellow.
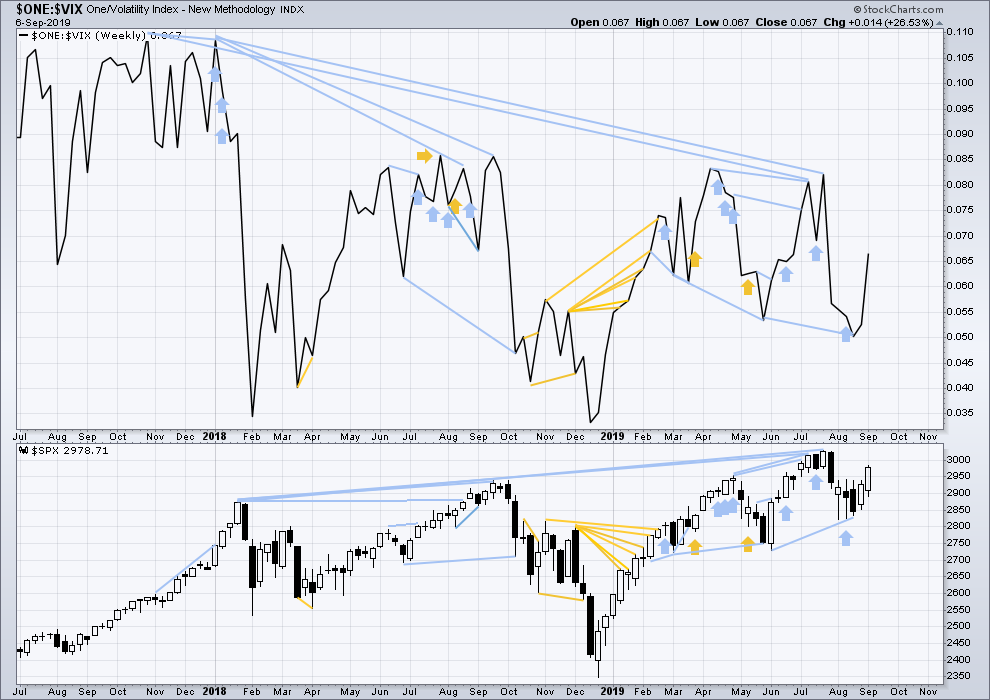
The all time high for inverted VIX (which is the same as the low for VIX) was on 30th October 2017. There is now nearly one year and ten months of bearish divergence between price and inverted VIX.
The rise in price is not coming with a normal corresponding decline in VIX; VIX remains elevated. This long-term divergence is bearish and may yet develop further as the bull market matures.
This divergence may be an early warning, a part of the process of a top developing that may take years. It may not be useful in timing a trend change.
This week both price and inverted VIX have moved higher. There is no new divergence.
DAILY CHART
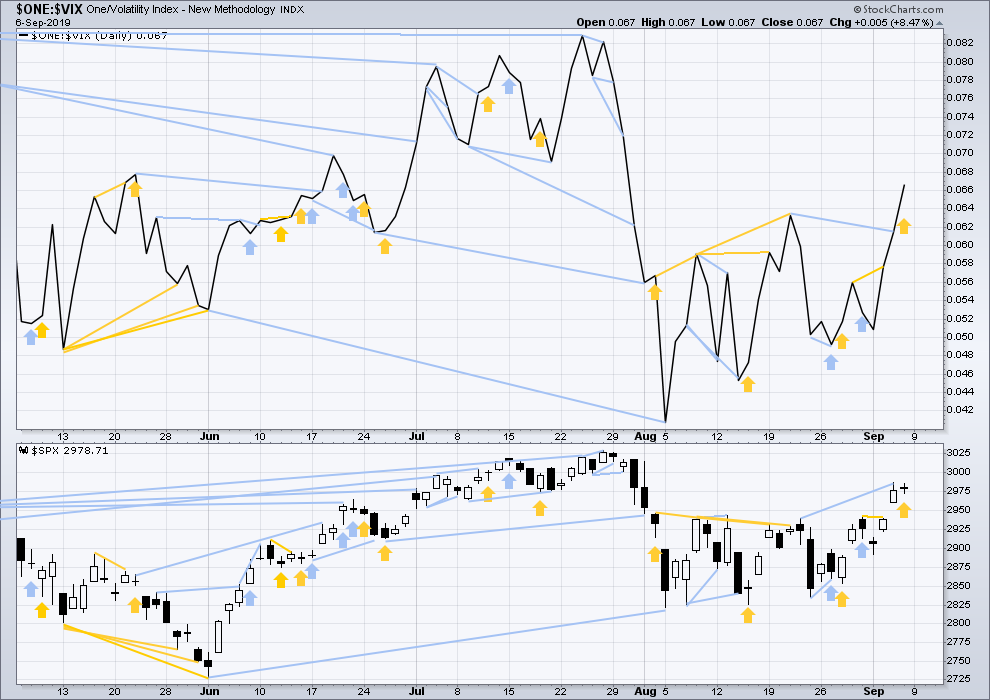
Click chart to enlarge. Chart courtesy of StockCharts.com. So that colour blind members are included, bearish signals
will be noted with blue and bullish signals with yellow.
On Friday price moved sideways to complete and inside day, but inverted VIX has moved strongly higher. This divergence is very bullish and confirms bullish divergence in the AD line. This supports the Elliott wave count.
DOW THEORY
Dow Theory confirmed a bear market in December 2018. This does not necessarily mean a bear market at Grand Super Cycle degree though; Dow Theory makes no comment on Elliott wave counts. On the 25th of August 2015 Dow Theory also confirmed a bear market. The Elliott wave count sees that as part of cycle wave II. After Dow Theory confirmation of a bear market in August 2015, price went on to make new all time highs and the bull market continued.
DJIA: 23,344.52 – a close on the 19th of December at 23,284.97 confirms a bear market.
DJT: 9,806.79 – price has closed below this point on the 13th of December.
S&P500: 2,532.69 – a close on the 19th of December at 2,506.96 provides support to a bear market conclusion.
Nasdaq: 6,630.67 – a close on the 19th of December at 6,618.86 provides support to a bear market conclusion.
With all the indices having moved higher following a Dow Theory bear market confirmation, Dow Theory would confirm a bull market if the following highs are made:
DJIA: 26,951.81 – a close above this point has been made on the 3rd of July 2019.
DJT: 11,623.58 – to date DJT has failed to confirm an ongoing bull market.
S&P500: 2,940.91 – a close above this point was made on the 29th of April 2019.
Nasdaq: 8,133.30 – a close above this point was made on the 26th of April 2019.
GOLD
Downwards movement was expected for Friday’s session, which is what has happened.
Both Elliott wave counts expect the same direction next.
Summary: Price remains range bound and volume suggests a downwards swing to support may begin here. The upwards trend remains very extreme and overbought. The risk of a large consolidation or major trend change here is very high indeed.
The bullish Elliott wave count expects a swing down to 1,473 to 1,470.
The bearish wave count expects a major trend change at the last high.
Grand SuperCycle analysis is here.
Monthly charts were last published here with video here.
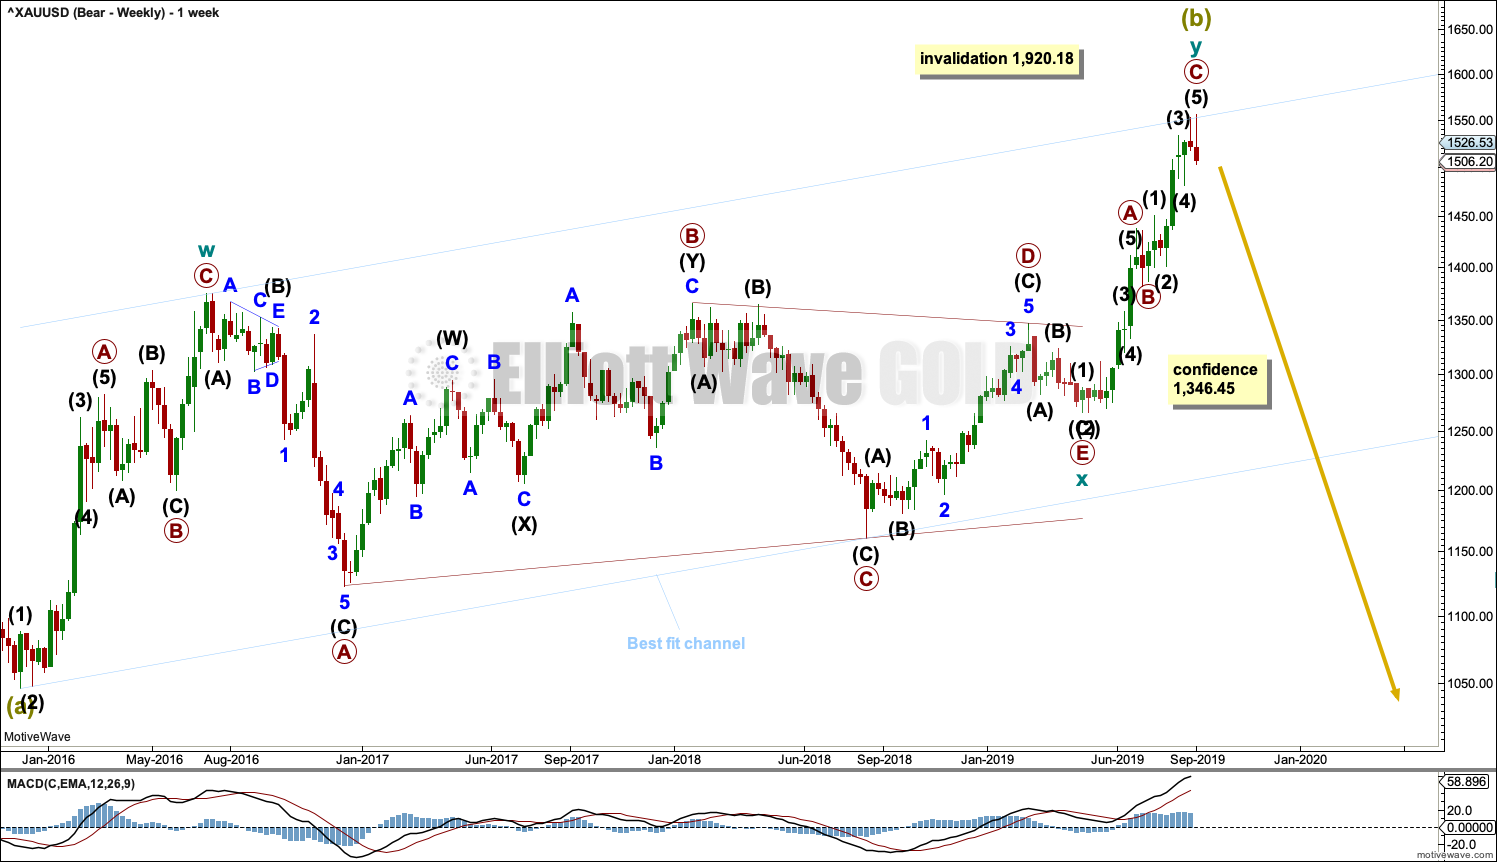
BEARISH ELLIOTT WAVE COUNT
WEEKLY CHART
Click chart to enlarge.
It is possible that Super Cycle wave (b) is completing as a double zigzag.
The first zigzag in the double is labelled cycle wave w. The double is joined by a three in the opposite direction, a triangle labelled cycle wave x. The second zigzag in the double is labelled cycle wave y.
Cycle wave y may now be a complete zigzag.
The purpose of the second zigzag in a double is to deepen the correction. Cycle wave y has achieved this purpose.
A new low below 1,346.45 would add strong confidence to this wave count. At that stage, the bullish Elliott wave count would be invalidated.
A wide best fit channel is added in light blue. This channel contains all of Super Cycle wave (b) and may currently provide strong resistance. Copy this channel over to daily charts.
DAILY CHART
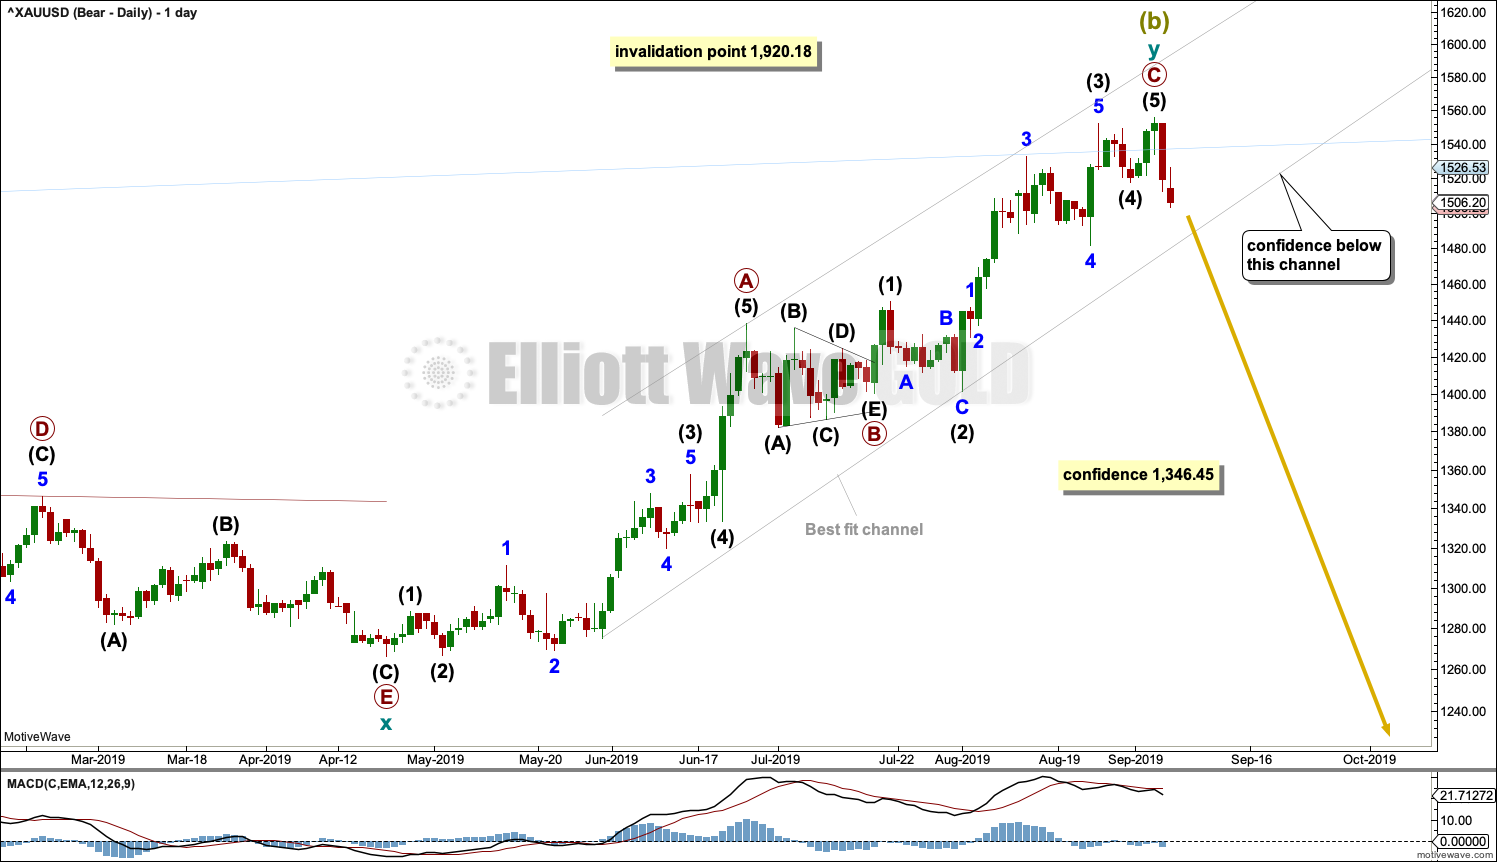
Click chart to enlarge.
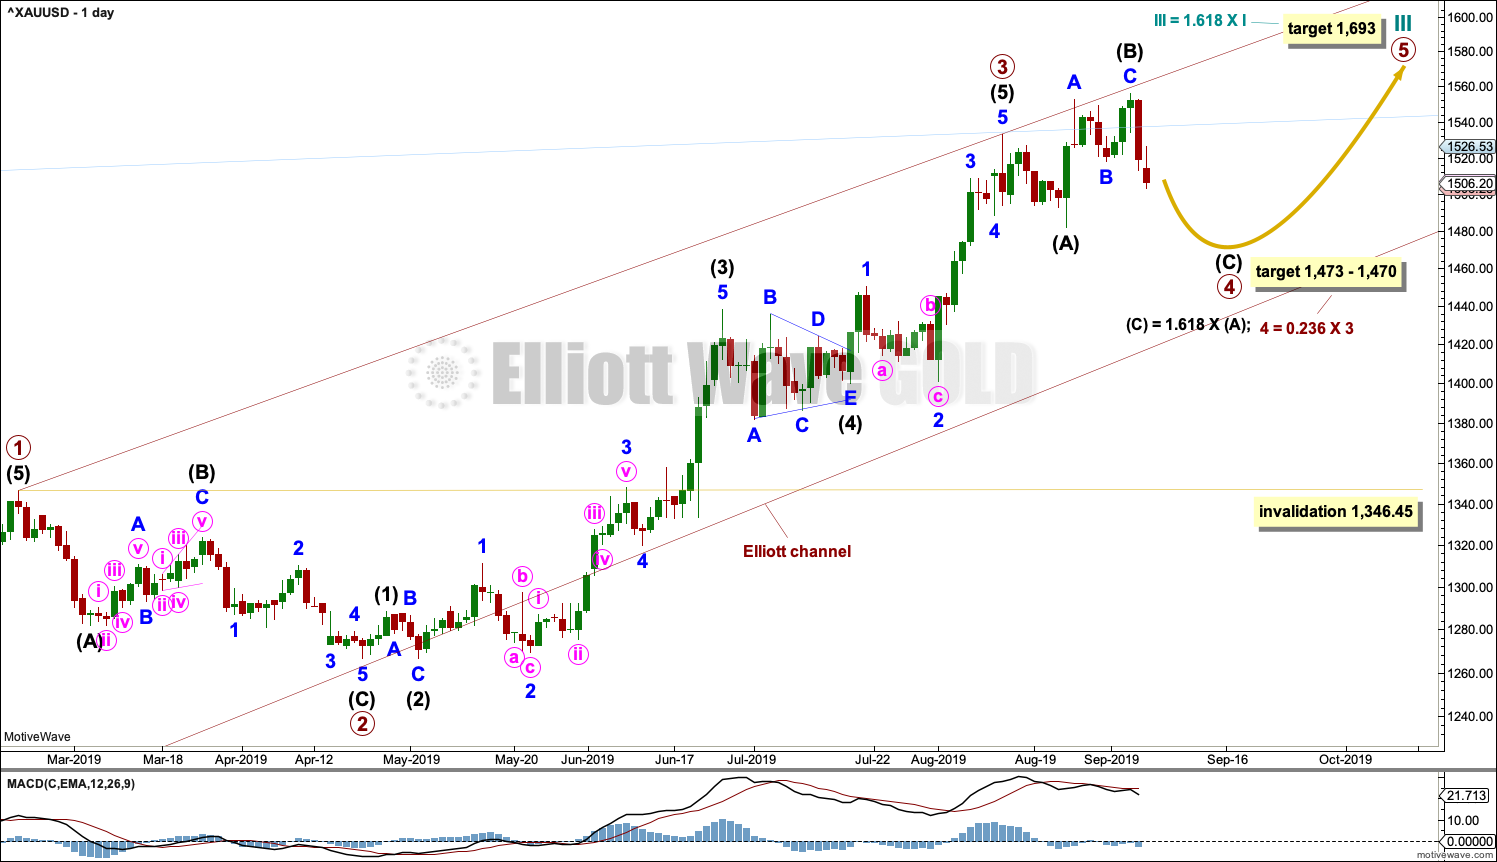
Within cycle wave y, the triangle that ended on the 17th of July may have been primary wave B. Primary wave C may have begun there. Primary wave C must subdivide as a five wave structure; it could be a complete impulse.
Within cycle wave y, there is no Fibonacci Ratio between primary waves A and C.
A breach of the best fit trend channel by downwards movement would be a very strong indication of a major trend change.
BULLISH ELLIOTT WAVE COUNT
WEEKLY CHART
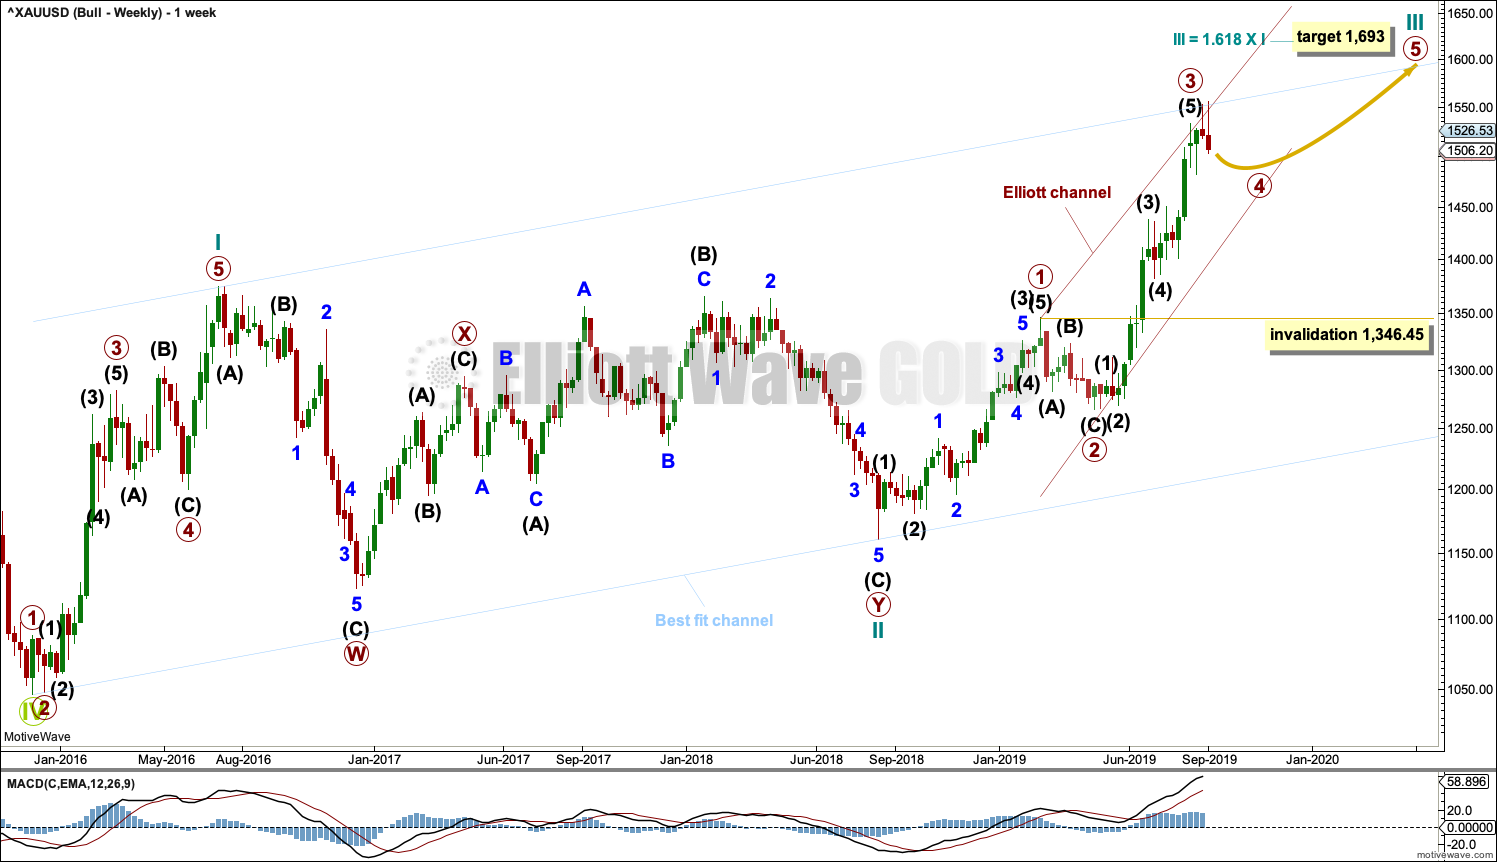
Click chart to enlarge.
This wave count sees the the bear market complete at the last major low for Gold in November 2015.
If Gold is in a new bull market, then it should begin with a five wave structure upwards on the weekly chart. However, the biggest problem with this wave count is the structure labelled cycle wave I because this wave count must see it as a five wave structure, but it looks more like a three wave structure.
Commodities often exhibit swift strong fifth waves that force the fourth wave corrections coming just prior and just after to be more brief and shallow than their counterpart second waves. It is unusual for a commodity to exhibit a quick second wave and a more time consuming fourth wave, and this is how cycle wave I is labelled. This wave count still suffers from this very substantial problem, and for this reason the bearish wave count is still considered because it has a better fit in terms of Elliott wave structure.
Cycle wave II subdivides well as a double combination: zigzag – X – expanded flat.
Cycle wave III may have begun. Within cycle wave III, primary waves 1 and 2 may now be complete. Primary wave 3 has now moved above the end of primary wave 1 meeting a core Elliott wave rule. It has now moved far enough to allow room for primary wave 4 to unfold and remain above primary wave 1 price territory. Primary wave 4 may not move into primary wave 1 price territory below 1,346.45.
Cycle wave III so far for this wave count would have been underway now for 55 weeks. It is beginning to exhibit some support from volume and increasing ATR. This wave count now has some support from classic technical analysis.
The channel drawn about cycle wave III is an Elliott channel. Primary wave 4 may find support about the lower edge if it is time consuming enough.
Add the wide best fit channel to weekly and daily charts.
DAILY CHART
Click chart to enlarge.
Primary wave 4 may be continuing as an expanded flat, which is a common corrective structure. This would see alternation in structure with the zigzag of primary wave 2.
Primary wave 2 lasted 43 sessions. Primary wave 4 may be expected to be more brief; Gold usually exhibits more brief fourth waves than their counterpart second waves. Primary wave 4 may end in a total Fibonacci 21 or 34 sessions. So far it has lasted 18 sessions.
Primary wave 4 may not move into primary wave 1 price territory below 1,346.45.
Intermediate wave (B) may have moved higher. There is no Elliott wave rule which states a limit for B waves within flat corrections, so there is no upper invalidation point for this wave count.
B waves should be identifiable by weak volume, momentum or ATR. If intermediate wave (B) is over at the last high, then it has ended on weak volume, exhibits bearish divergence between price and On Balance Volume, and exhibits quadruple bearish divergence between price and RSI. Technical analysis supports the possibility that this high may be the end of a B wave.
TECHNICAL ANALYSIS
WEEKLY CHART
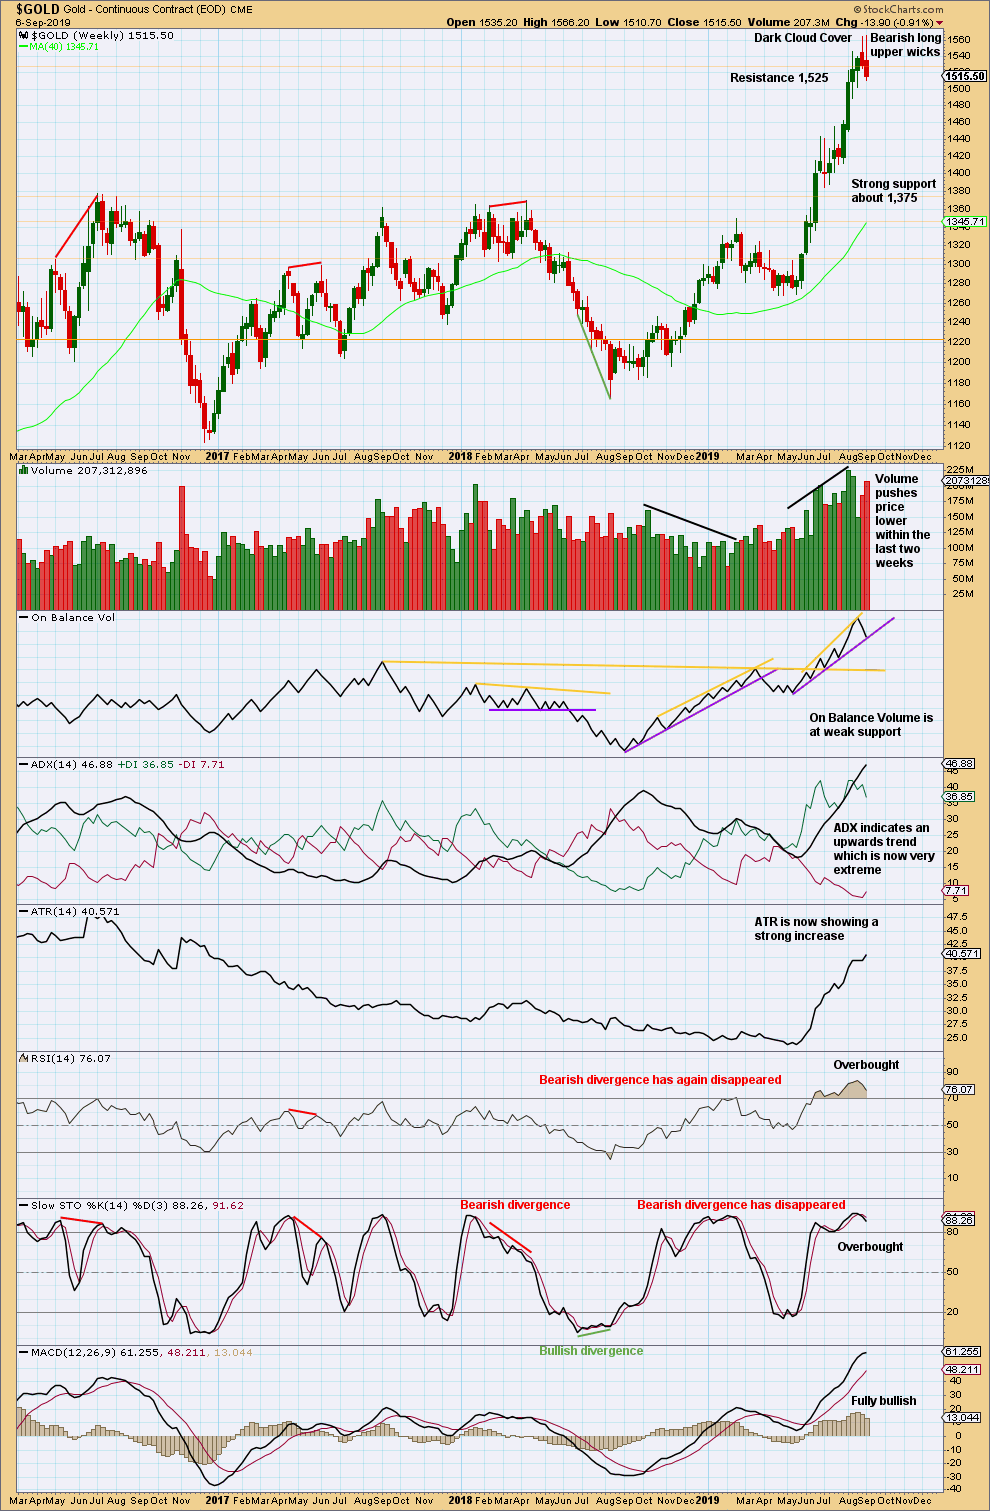
Click chart to enlarge. Chart courtesy of StockCharts.com.
When trends reach very extreme, candlestick reversal patterns should be given weight. The Dark Cloud Cover bearish reversal pattern is given more bearish weight from the long upper wick.
The risk of a major high and a trend change or a large time consuming consolidation developing here is very high. These two scenarios effectively follow the main bearish wave count (major trend change) or bullish wave count (a large time consuming consolidation).
Despite a very slight new high this week, the weekly candlestick is bearish and has support from volume pushing price lower.
DAILY CHART
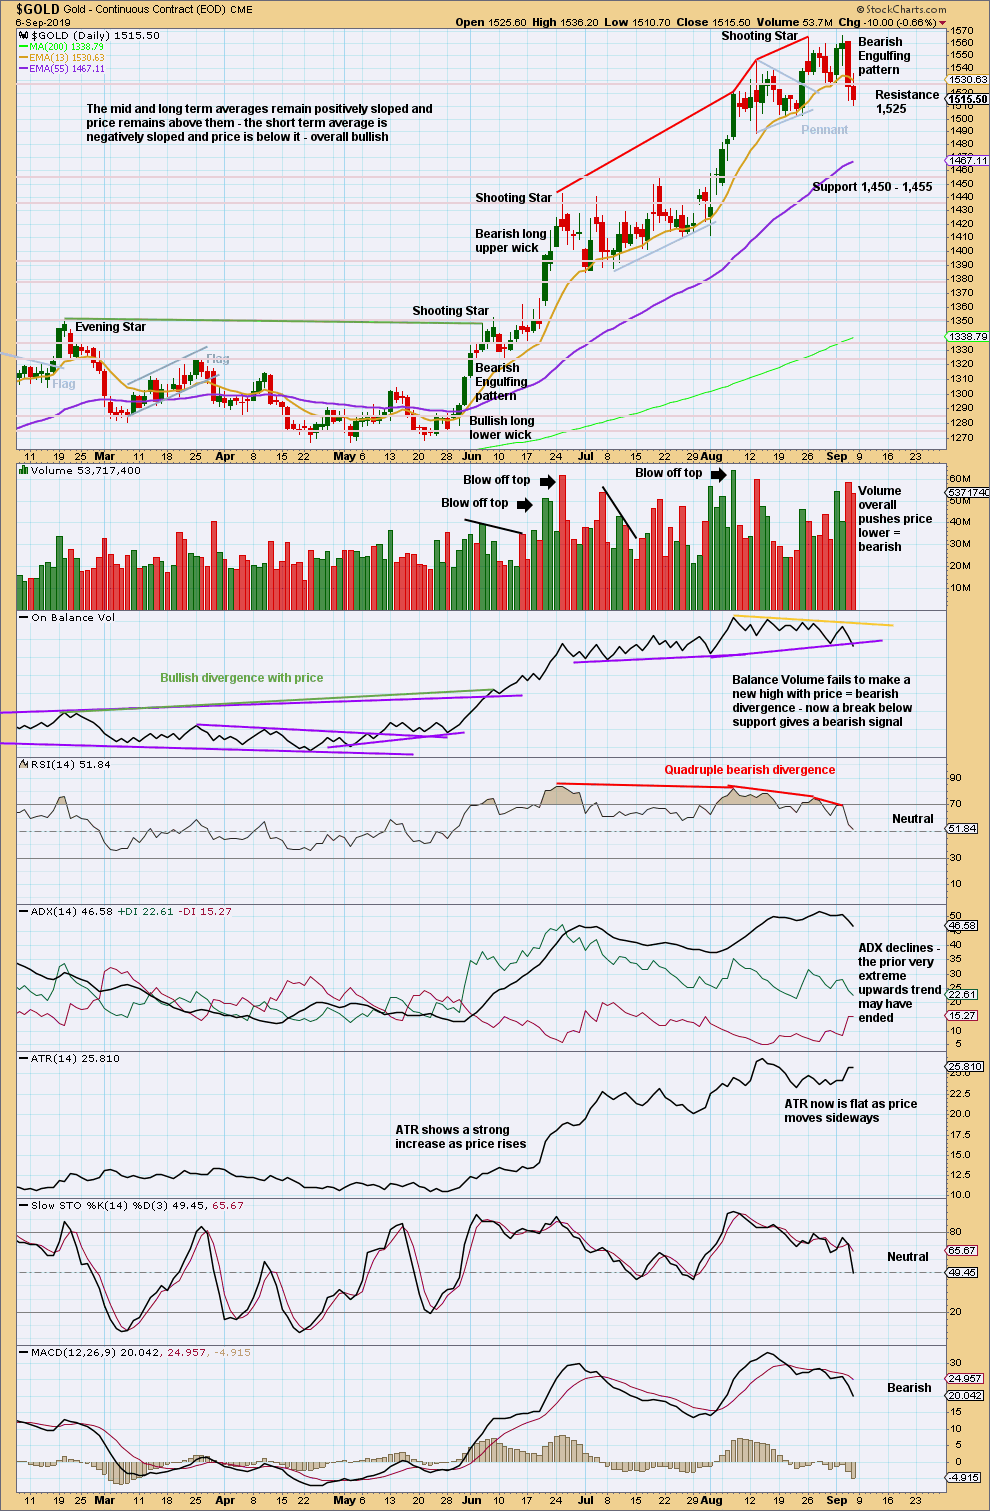
Click chart to enlarge. Chart courtesy of StockCharts.com.
The Bearish Engulfing pattern is very strong. It fully engulfs the real bodies of the prior seven daily candlesticks. Coming after an upwards trend reached very extreme and indicators reached overbought then exhibited multiple bearish divergence with price, the probability here of either a major trend change to a new downwards trend, or a major consolidation to last weeks or months, is very high indeed.
The last swing low is at 1,488.90. A new low below this point would confirm a trend change.
GDX WEEKLY CHART
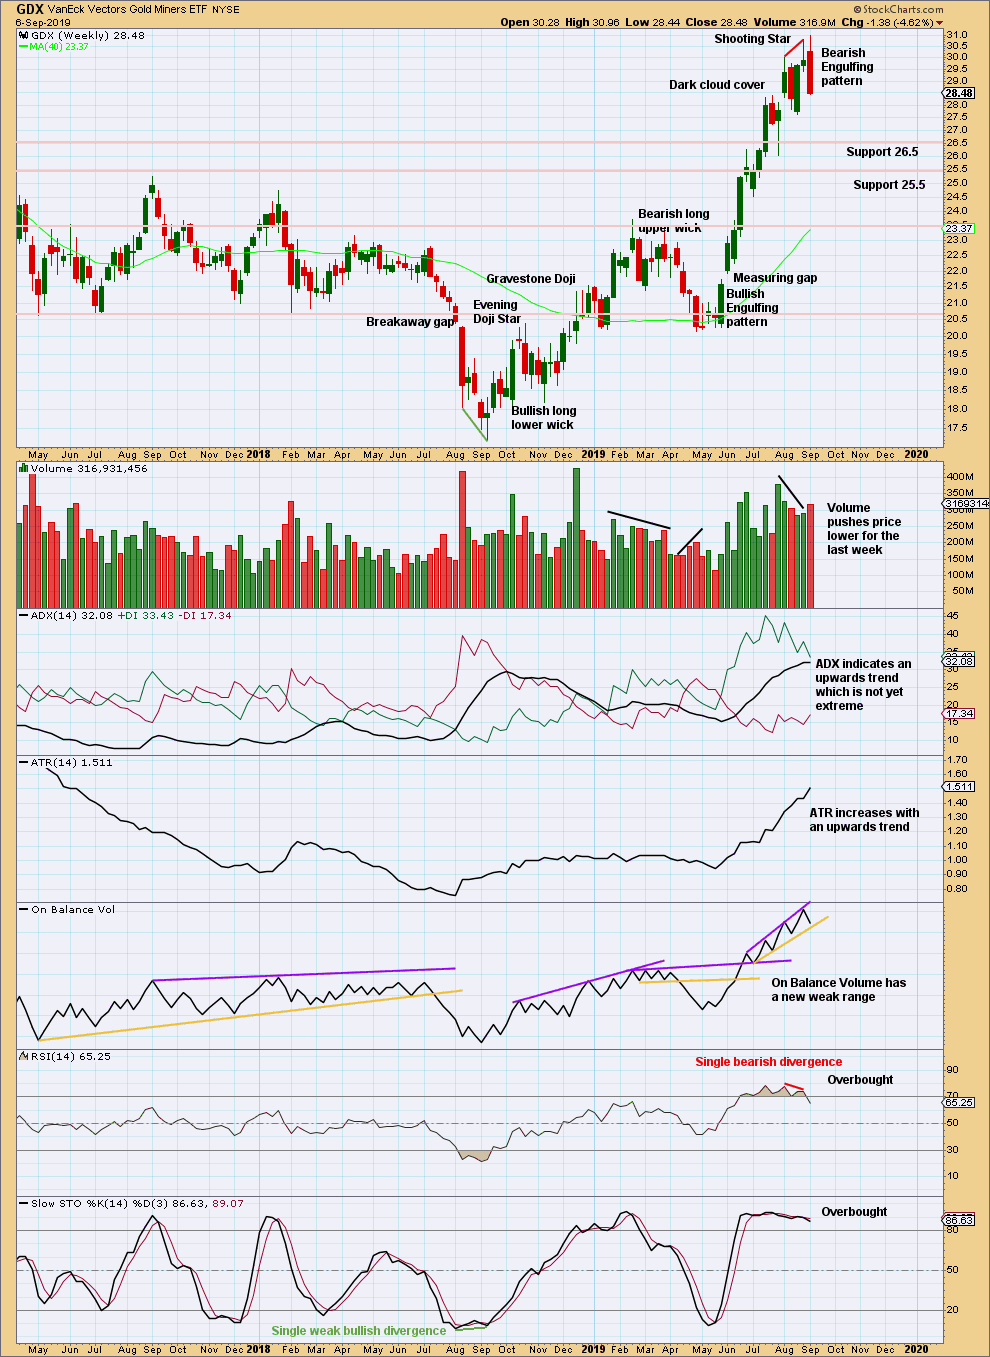
Click chart to enlarge. Chart courtesy of StockCharts.com.
Look out for either a trend change to either down or sideways here.
GDX DAILY CHART
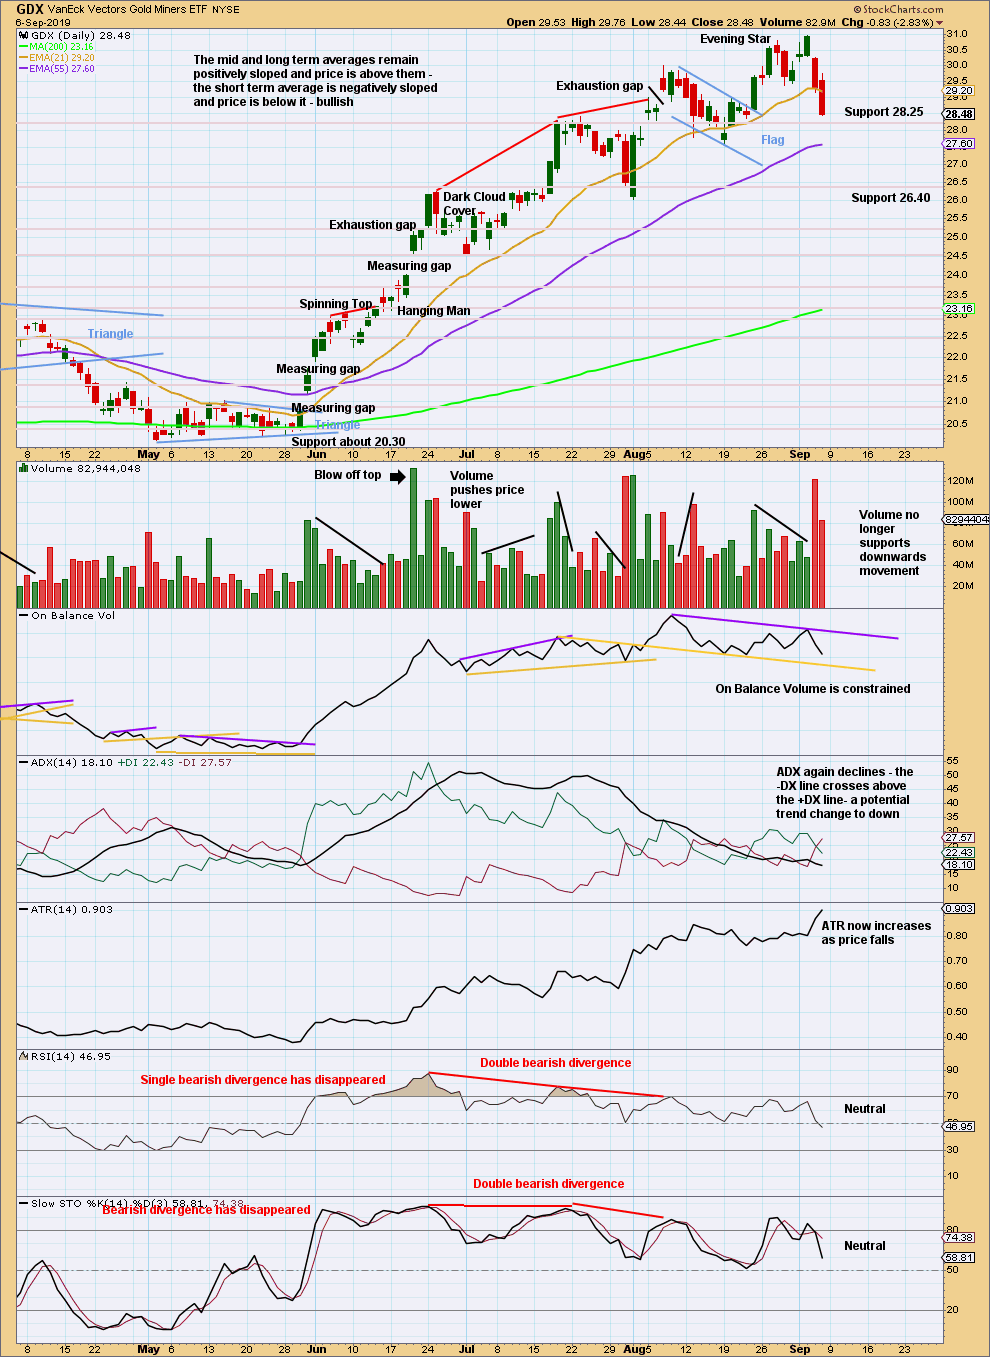
Click chart to enlarge. Chart courtesy of StockCharts.com.
A new low below the prior swing low at 27.61 would confirm a trend change.
US OIL
Again, downwards movement was expected for Oil. An outside week closes green, and price remains below resistance.
Summary: A mid-term target is at 35.25 for a third wave down. This may exhibit an increase in momentum, and may end with a capitulation spike.
The final target is calculated at 10.72. Confidence in this target may be had if price makes a new low below 50.61.
For the short term, a new high now above 58.82, and then above the channel on the main daily chart, would indicate a deeper bounce. The target would then be at 74.75.
The bullish alternate wave count would have confidence above 76.90. At that stage, a target for a third wave to end would be at 89.80.
MAIN ELLIOTT WAVE COUNT – BEARISH
MONTHLY CHART
Click chart to enlarge.
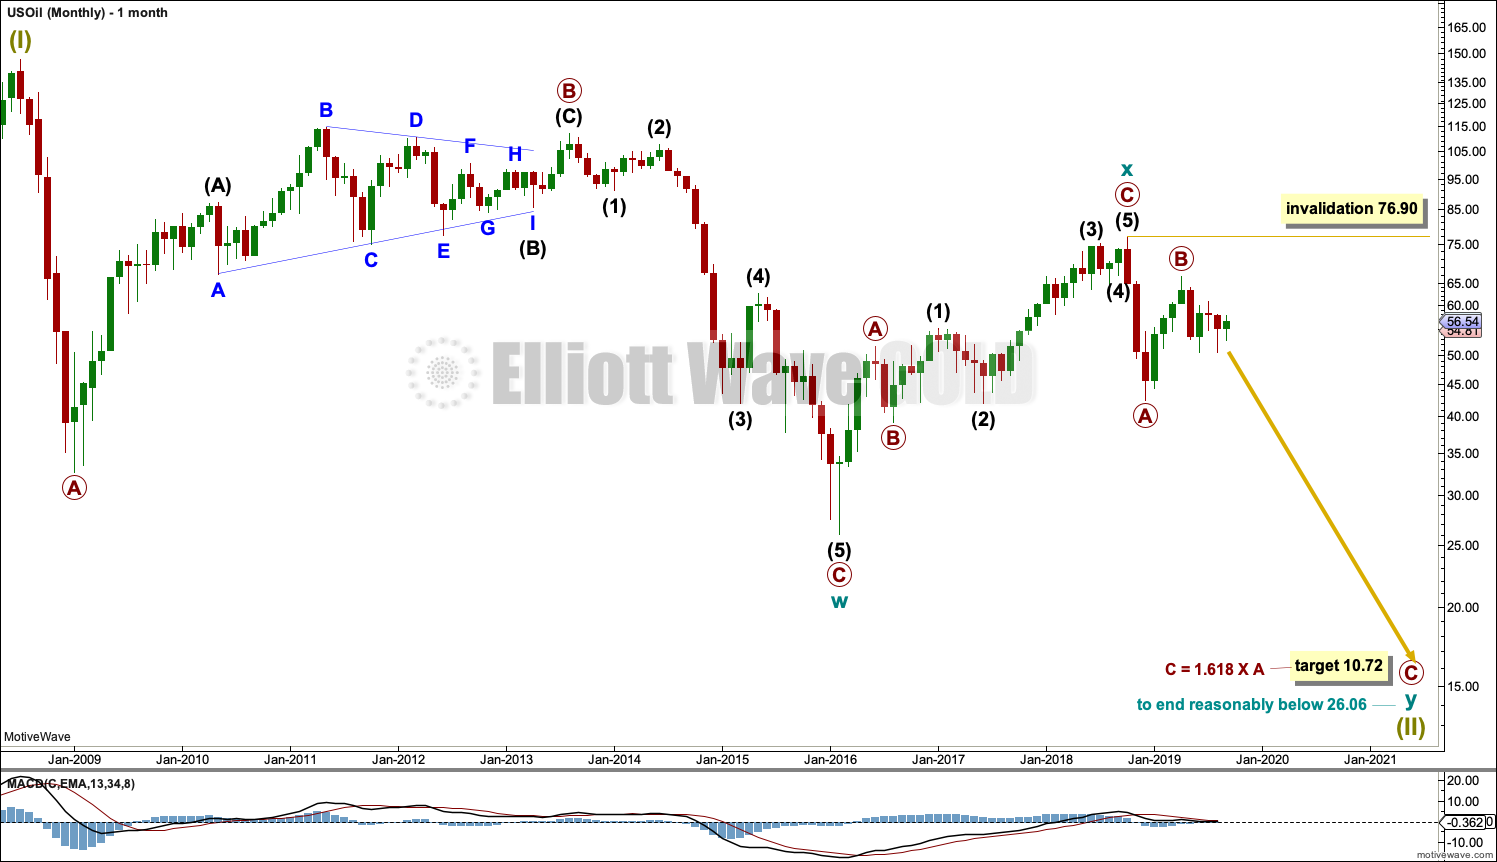
The basic Elliott wave structure is five steps forward and three steps back. This Elliott wave count expects that US Oil is still within a three steps back pattern, which began in July 2008. The Elliott wave count expects that the bear market for US Oil continues.
This Elliott wave corrective structure is a double zigzag, which is a fairly common structure. The correction is labelled Super Cycle wave (II).
The first zigzag in the double is complete and labelled cycle wave y. The double is joined by a three in the opposite direction labelled cycle wave x, which subdivides as a zigzag. The second zigzag in the double may now have begun, labelled cycle wave w.
The purpose of a second zigzag in a double zigzag is to deepen the correction when the first zigzag does not move price deep enough. To achieve this purpose cycle wave y may be expected to move reasonably below the end of cycle wave w at 26.06. The target calculated would see this expectation met.
Cycle wave y is expected to subdivide as a zigzag, which subdivides 5-3-5.
Cycle wave w lasted 7.6 years and cycle wave x lasted 2.7 years. Cycle wave y may be expected to last possibly about a Fibonacci 5 or 8 years.
If it continues higher, then primary wave B may not move beyond the start of primary wave A above 76.90.
WEEKLY CHART
Click chart to enlarge.
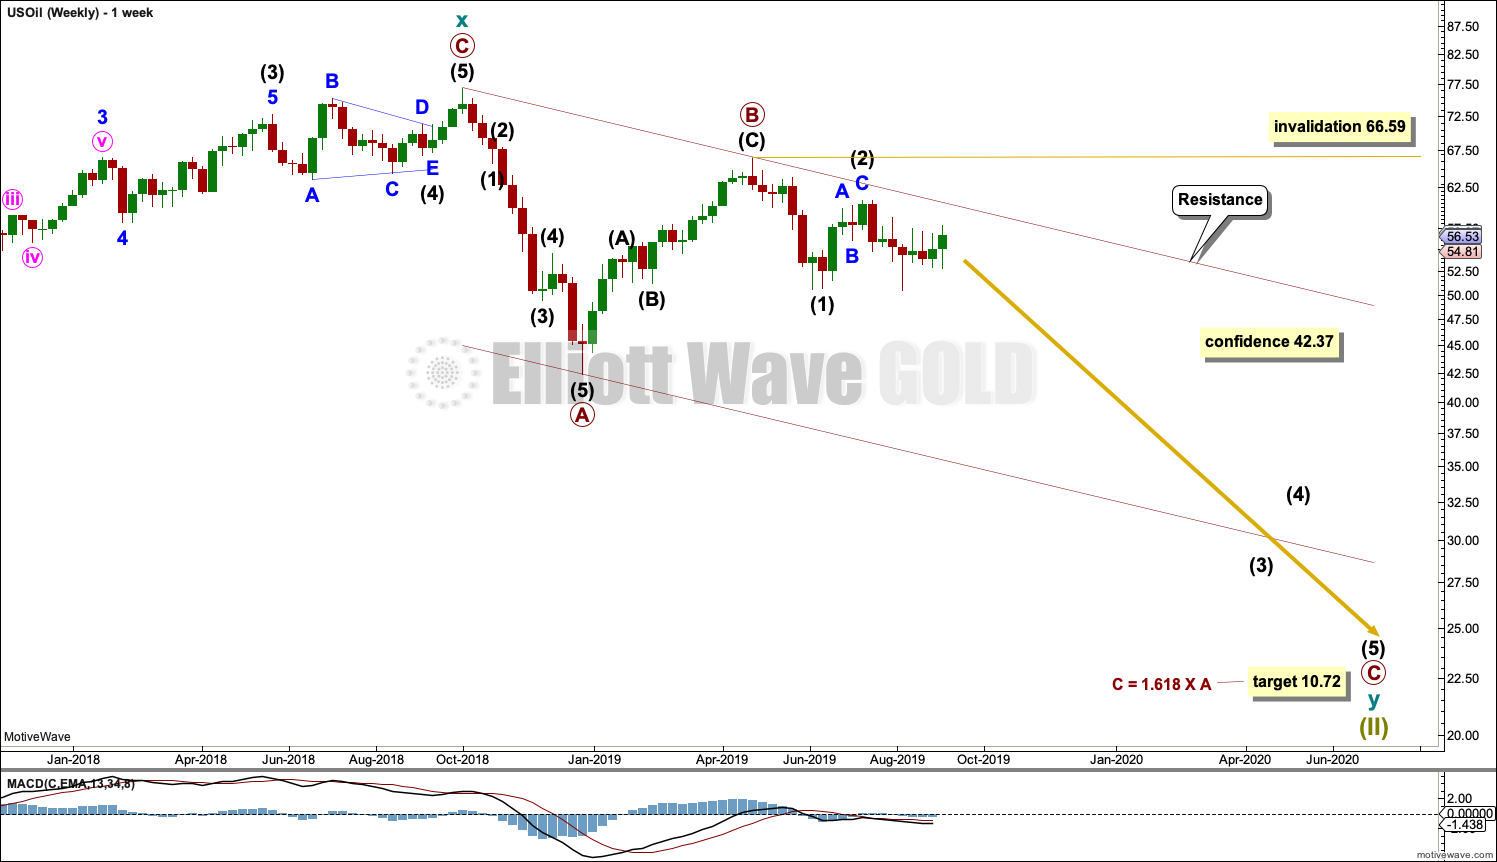
This weekly chart shows all of cycle waves x and y so far.
Cycle wave y is expected to subdivide as a zigzag. A zigzag subdivides 5-3-5. Primary wave A must subdivide as a five wave structure if this wave count is correct.
Primary wave A may be a complete five wave impulse at the last low.
Primary wave B may now be a complete single zigzag at the last high.
Primary wave C may have just begun. Primary wave C must subdivide as a five wave structure.
Primary wave A lasted 12 weeks, just one short of a Fibonacci 13.
Primary wave C may be longer in time as well as price. If cycle wave y lasts a Fibonacci 5 years, then primary wave C within it may take as long as a Fibonacci 233 weeks.
Intermediate wave (1) within primary wave C may be a complete impulse. Intermediate wave (2) may not move beyond the start of intermediate wave (1) above 66.59.
Draw a channel about the zigzag of primary wave y using Elliott’s technique for a correction. Draw the first trend line from the start of primary wave A to the end of primary wave B, then place a parallel copy on the end of primary wave A. The upper edge of this channel is so far showing where bounces along the way down find resistance. The lower edge of the channel may provide support. If this channel is breached by upwards movement prior to a new high above 66.59, then this wave count would be discarded in favour of the second bearish wave count below.
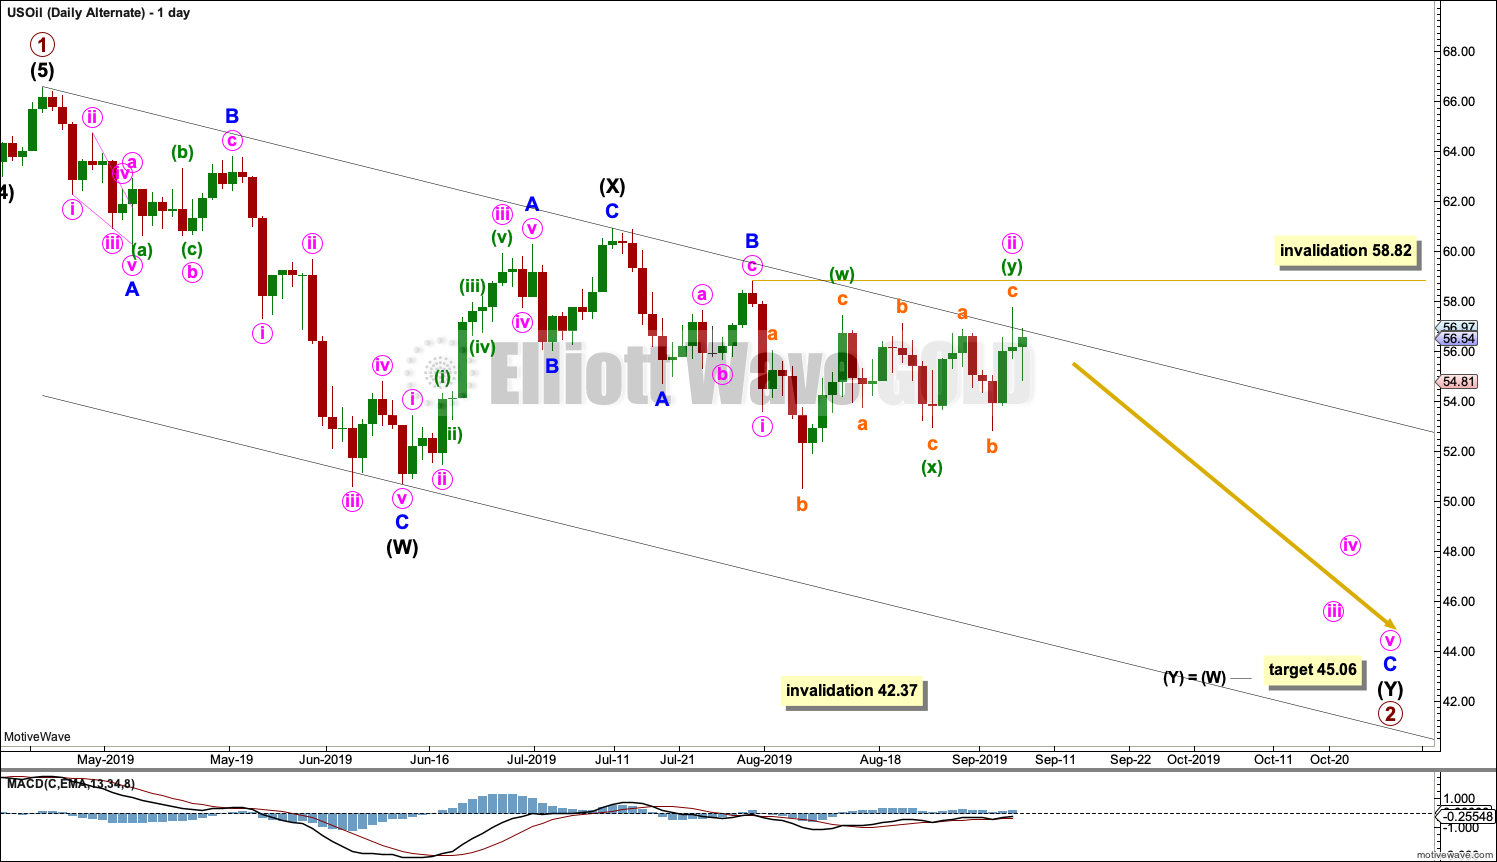
DAILY CHART
Click chart to enlarge.
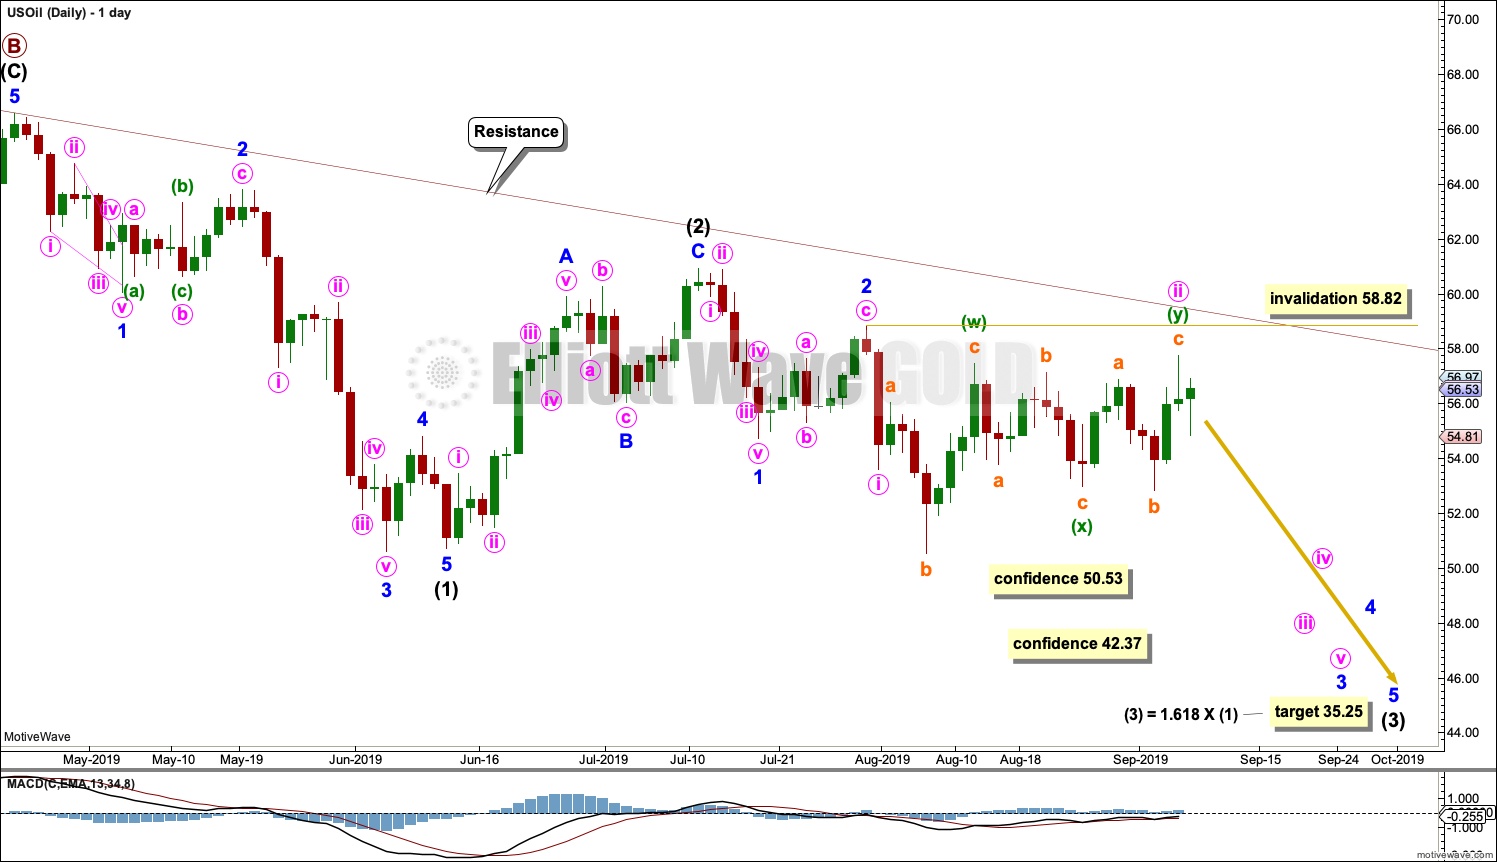
Note that monthly and weekly charts are on a semi-log scale, but this daily chart is on an arithmetic scale. This makes a slight difference to trend channels.
Intermediate wave (1) looks complete. Minor wave 4 for this wave count exhibits some alternation to minor wave 2; minor wave 2 may be a relatively deep zigzag or flat, and minor wave 4 may be a more shallow zigzag.
Minor wave 5 ends with a slight 0.11 truncation. All Elliott wave counts must now accept this small truncation.
Intermediate wave (2) may also now be complete as a zigzag.
Intermediate wave (3) may only subdivide as an impulse, and it must move below the end of intermediate wave (1). Within intermediate wave (3), minor waves 1 and 2 may now be complete.
Minor wave 3 may only subdivide as an impulse. Within minor wave 3, minute waves i and ii may now be complete. Minute wave ii may have continued sideways this week as a double flat correction. If it continues any further, then minute wave ii may not move beyond the start of minute wave i above 58.82.
Minute wave iii may only subdivide as an impulse.
The next downwards wave for this wave count is now expected to be a third wave at three degrees. It may be expected to exhibit an increase in momentum and an increase in ATR. So far it has support from volume pushing price lower.
Oil, typical of commodities, exhibits swift and strong fifth waves. This tendency is especially prevalent in its fifth waves to end third wave impulses one degree higher. Its third waves often begin relatively slowly, build momentum through their middles, and then explode at the end. Intermediate wave (3) here may be beginning slowly and that would be typical behaviour for this market.
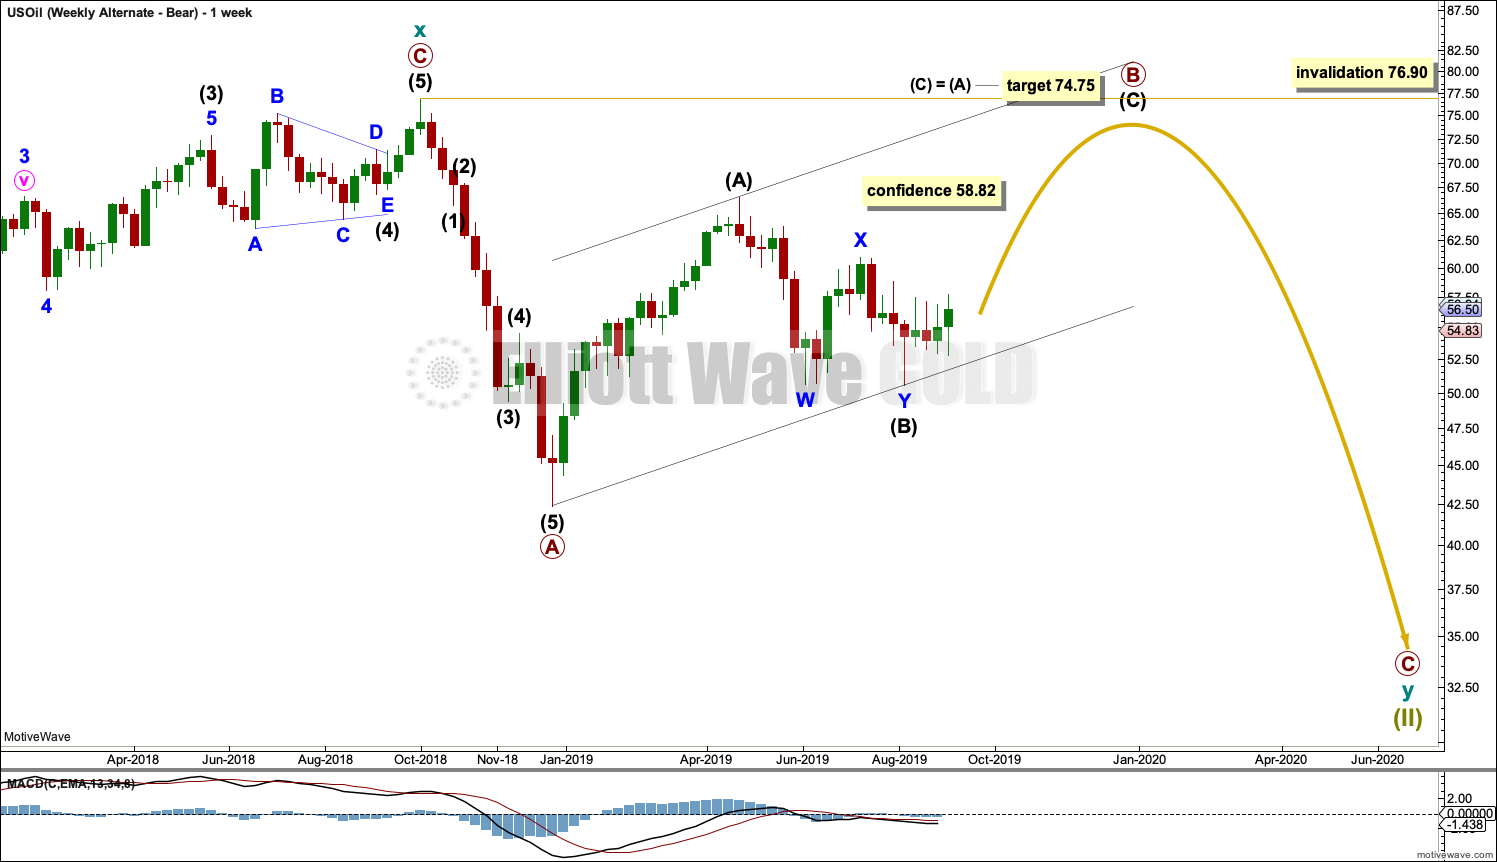
SECOND WEEKLY CHART
Click chart to enlarge.
This wave count considers the possibility that primary wave B within the zigzag of cycle wave y may be incomplete. This wave count should only be used if price makes a new high by any amount at any time frame above 58.82.
Primary wave B may not move beyond the start of primary wave A above 76.90.
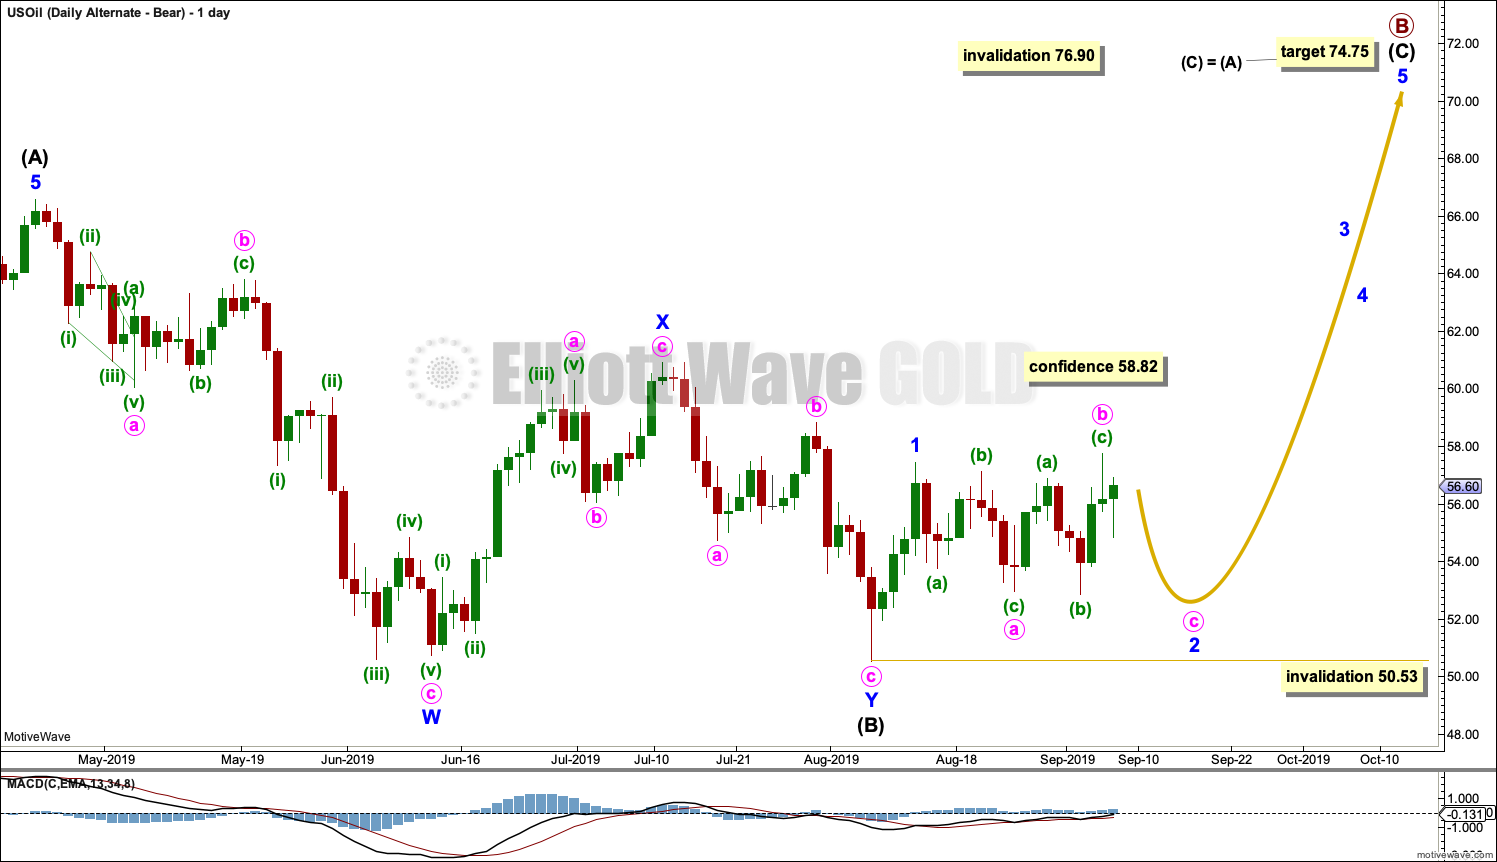
SECOND DAILY CHART
Click chart to enlarge.
Intermediate wave (B) will only fit as a double zigzag. This is possible, but minor wave Y of the double zigzag has barely achieved its purpose to move the correction deeper as it only moves very slightly below the end of minor wave W.
Intermediate wave (C) must subdivide as a five wave motive structure, either an impulse or an ending diagonal. It should move beyond the end of intermediate wave (A) to avoid a truncation.
So far minor wave 1 within intermediate wave (C) may be complete. Minor wave 2 may be completing as an expanded flat correction. Minor wave 2 may not move beyond the start of minor wave 1 below 50.53.
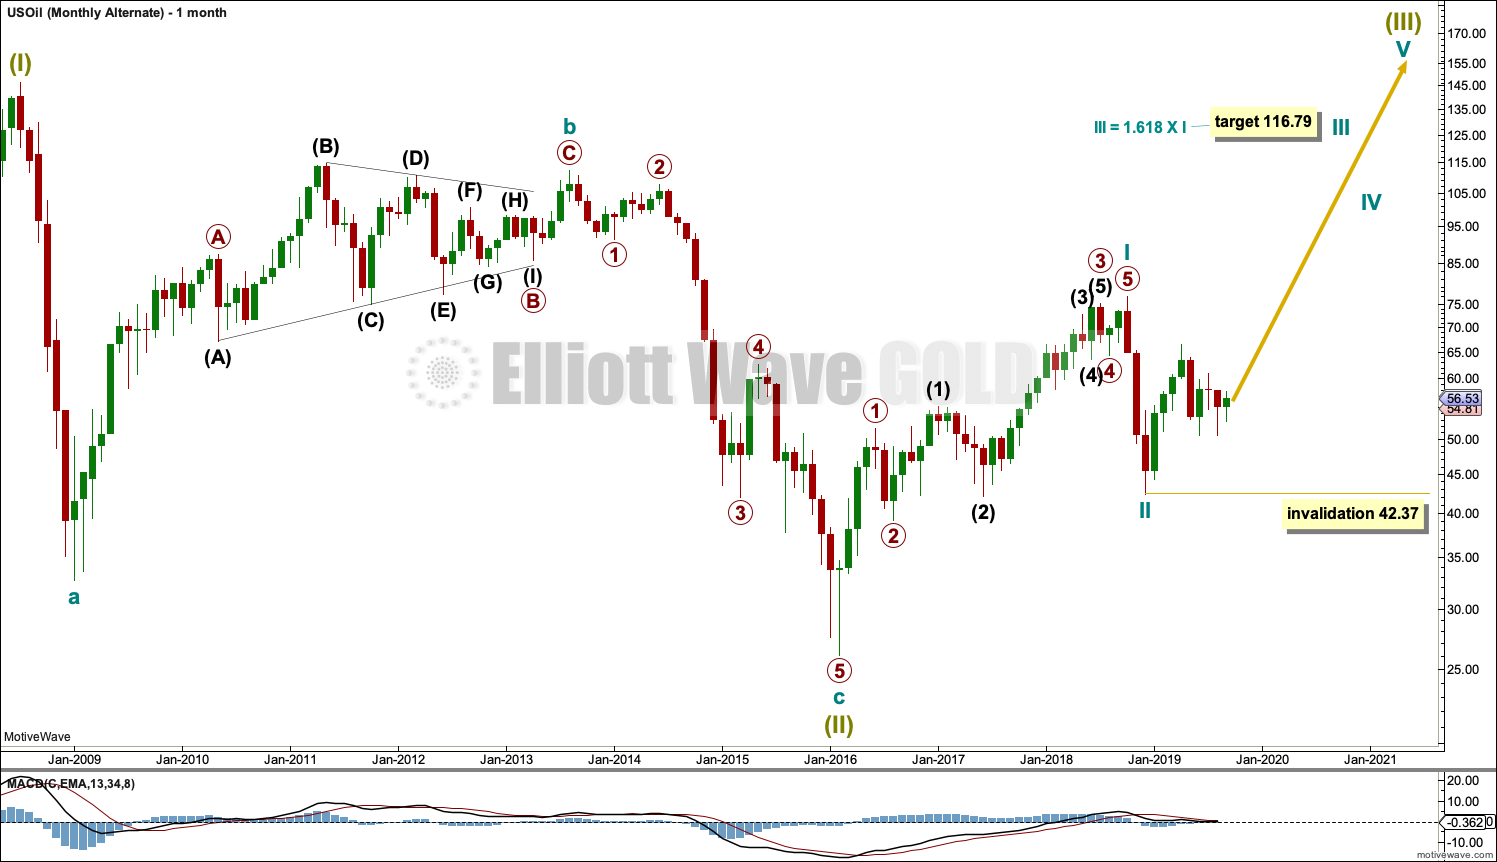
ALTERNATE ELLIOTT WAVE COUNT
MONTHLY CHART
Click chart to enlarge.
It is possible that the bear market is over for Oil and a new bull market has begun.
For a bullish wave count for Oil, the upwards wave from the major low at 26.06 in February 2016 must be seen as a complete five wave impulse. This is labelled cycle wave I.
Cycle wave II may be a complete zigzag at 0.679 the depth of cycle wave I.
A target is calculated for cycle wave III to reach a common Fibonacci ratio to cycle wave I.
Within cycle wave III, no second wave correction may move beyond the start of its first wave below 42.37.
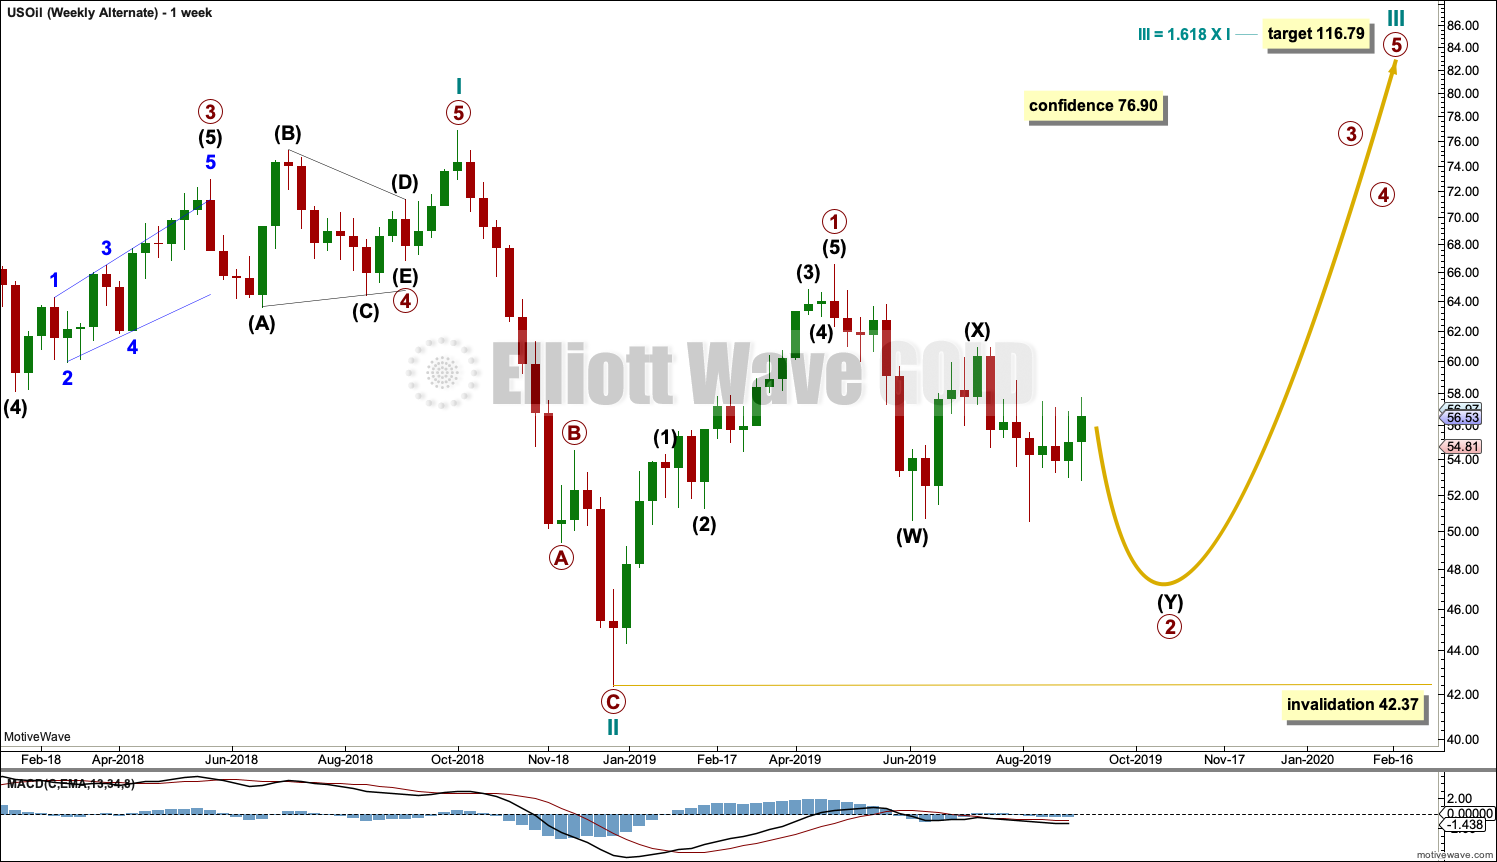
WEEKLY CHART
Click chart to enlarge.
This weekly chart shows detail of cycle wave I as a five wave impulse.
Cycle wave II does look best as a three. This is the only part of this wave count that has a better look than the main wave count, which sees this downwards wave as a five.
The upwards wave of primary wave 1 within cycle wave III must be seen as a five wave structure for a bullish wave count to work. This movement at lower time frames does not subdivide well at all as a five; this reduces the probability of this wave count.
Cycle wave III may only subdivide as an impulse. Within cycle wave III, so far primary wave 1 may be complete. Primary wave 2 may be moving lower as a double zigzag. Primary wave 2 may not move beyond the start of primary wave 1 below 42.37.
DAILY CHART
Click chart to enlarge.
Primary wave 2 may be continuing lower as a double zigzag.
The first zigzag in the double would be complete, labelled intermediate wave (W). Within intermediate wave (W), minor wave C ends with a slight truncation for minute wave v. This is acceptable.
The double may be now joined by a complete three in the opposite direction, a zigzag labelled intermediate wave (X).
A second zigzag may now unfold labelled intermediate wave (Y). Within intermediate wave (Y), minor waves A and B may be complete. Minor wave C must now complete lower as a five wave structure. Within minor wave C, minute waves i and ii may now be complete. Minute wave ii may have continued sideways this week as a double flat correction. If it continued any higher, minute wave ii may not move beyond the start of minute wave i above 58.82.
Minute wave iii may only subdivide as an impulse.
TECHNICAL ANALYSIS
MONTHLY CHART

Click chart to enlarge. Chart courtesy of StockCharts.com.
August has closed with a long lower wick, which is bullish, but price has moved lower with push from volume, which is bearish.
Overall, August is judged to be more bearish than bullish.
There is now double bullish divergence between price and On Balance Volume. This supports the alternate Elliott wave count.
WEEKLY CHART
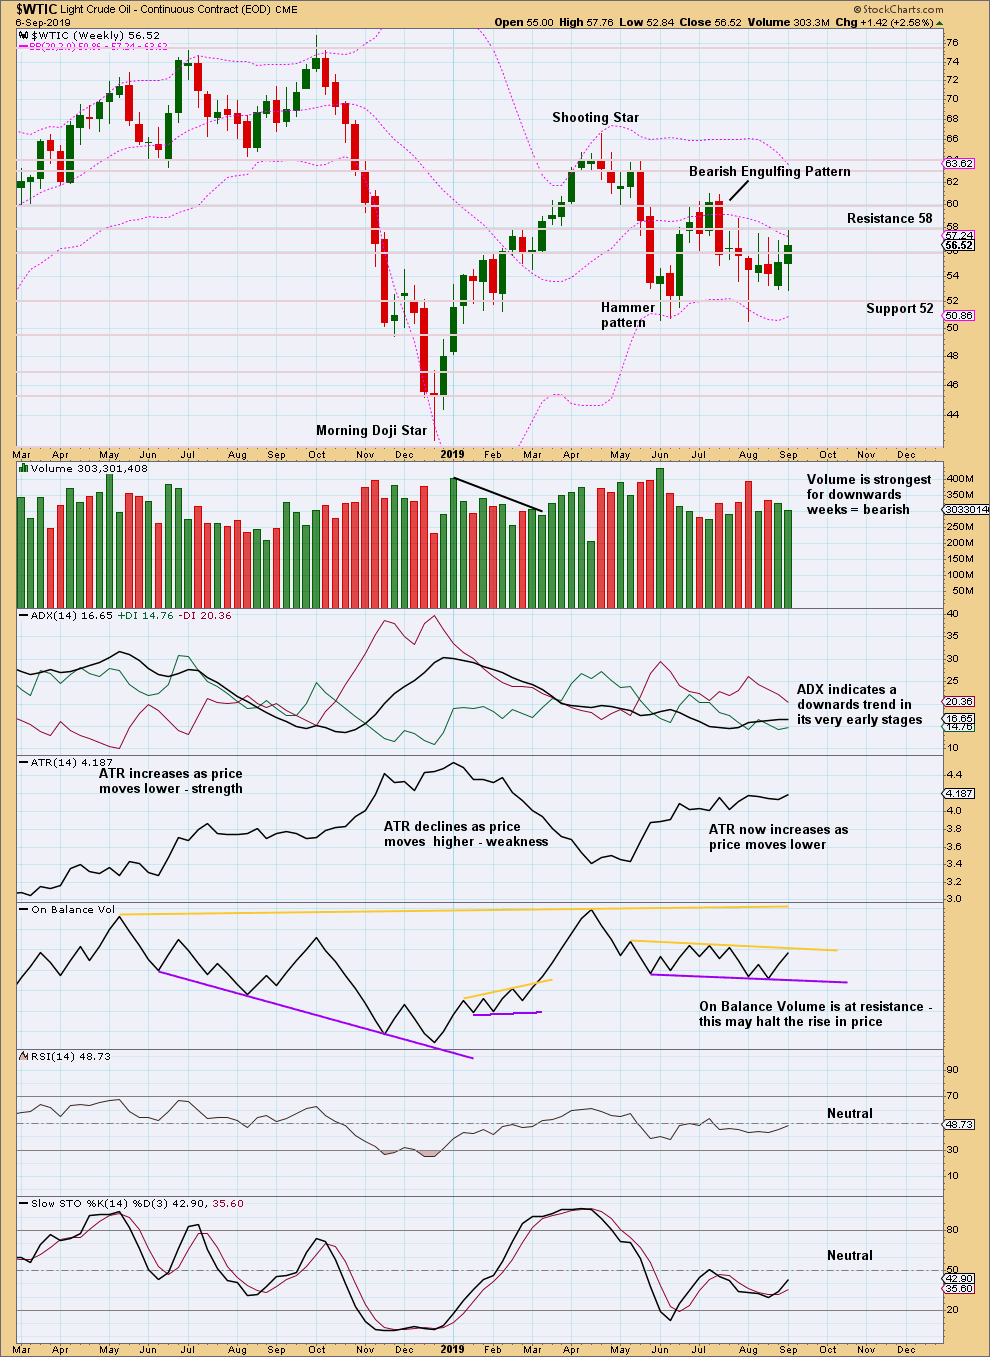
Click chart to enlarge. Chart courtesy of StockCharts.com.
This outside week has both long lower and upper wicks, with the lower wick slightly longer. The difference is not great enough to draw a strong bullish conclusion. Overall, this chart remains mostly bearish.
Price currently remains range bound with resistance about 58 and support about 52. A breakout is required to indicate the next direction.
There is again a downwards trend in place. ADX is giving the strongest signal it can give.
DAILY CHART
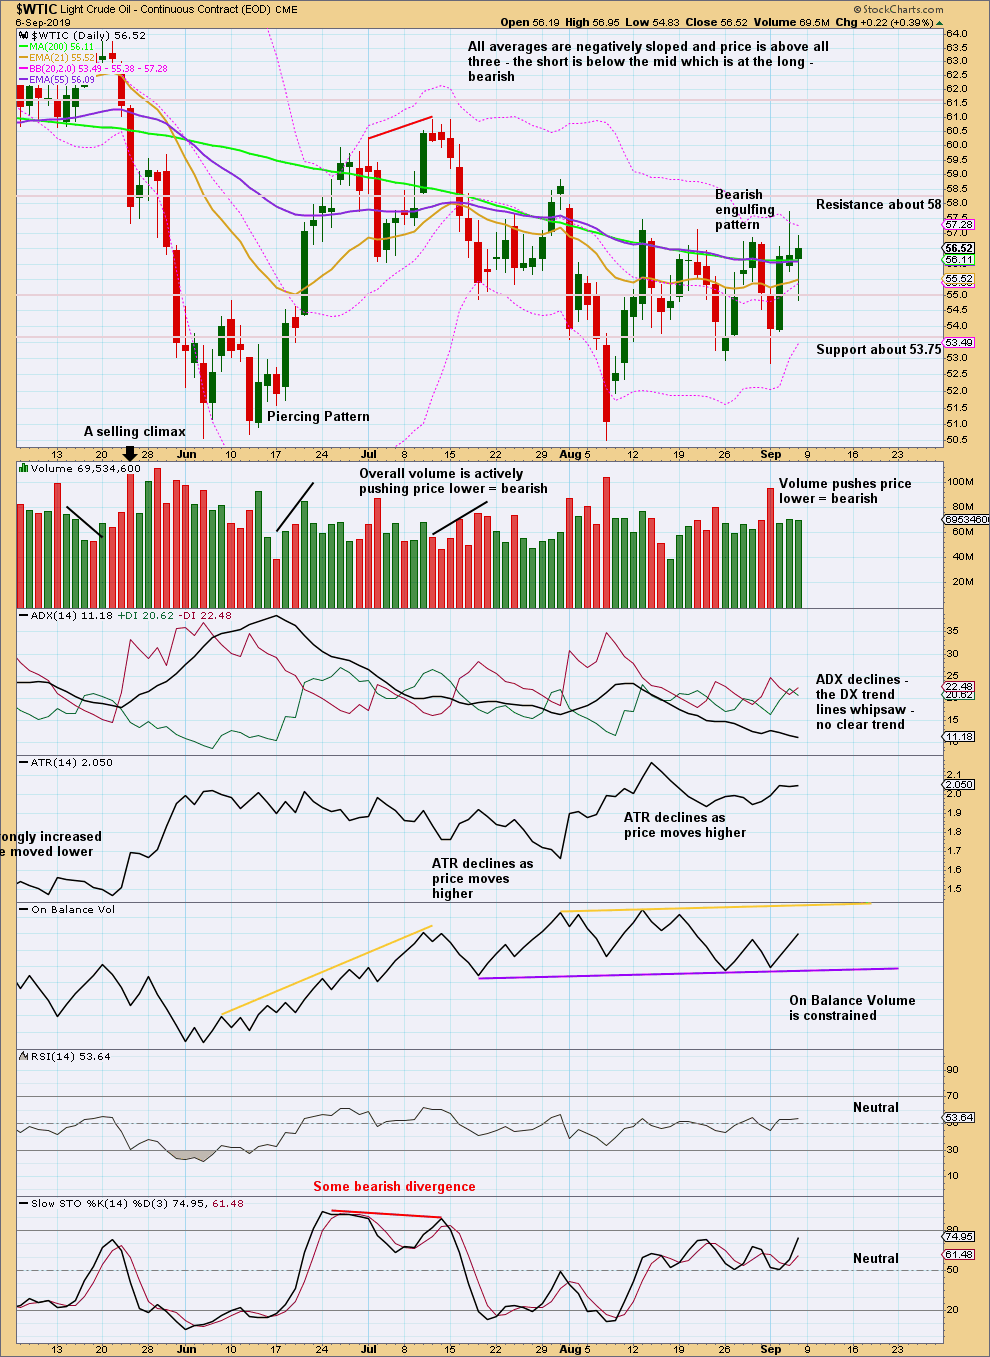
Click chart to enlarge. Chart courtesy of StockCharts.com.
Price is range bound with resistance about 58 and support about 53.75 to 52. A breakout from this consolidation is required for confidence in a trend.
—
Always practice good risk management as the most important aspect of trading. Always trade with stops and invest only 1-5% of equity on any one trade. Failure to manage risk is the most common mistake new traders make.
Hi Lara,
Would it be common to see an increase in volume at the end of minute ii? Can the candlestick on 10/09 with downward support from volume be a more convincing turn around point?
Jiten
Which market are you referring to? I’m guessing… Oil? (I don’t like guessing)
It’s common to see relatively small volume spikes when price is in a trading zone and hits support or resistance. So yes, the increase in volume for 10th Sep for Oil could be the end of minute ii, that’s how I’m labelling it.
Now the 11th September has moved strongly lower, another huge bearish engulfing candlestick pattern with strong support from volume. That’s impressive and adds confidence to the view that Oil has found at least a temporary high here.
Its Sept 11th, and for many of us, that day of 2001 changed many facets of our lives. I watched the movie, The Good American, a couple of weeks ago and bring it here as the dialogue in the early segments of the movie described clearly the Elliott Wave basis. I would like to recommend its viewing for us to remember, and to recognize the treasure we have in Lara. https://www.imdb.com/title/tt4065414/plotsummary?ref_=tt_ov_pl It is available as part of the Amazon Prime Video collection.
brent
Thanks for the kind words. And looks like an interesting movie.