

S&P 500
Upwards movement was expected for Friday. An outside day closes red. Price remains above the short-term invalidation point and within the Elliott channel.
Summary: The upwards trend to new all time highs may resume next week. The next target is 3,120.
A new low below 2,931 would indicate a deeper pullback. The target would then be at 2,916 or 2,905.
The biggest picture, Grand Super Cycle analysis, is here.
Monthly charts were last published here. There are two further alternate monthly charts here.
ELLIOTT WAVE COUNTS
The two weekly Elliott wave counts below will be labelled First and Second. They may be about of even probability. When the fifth wave currently unfolding on weekly charts may be complete, then these two wave counts will diverge on the severity of the expected following bear market. To see an illustration of this future divergence monthly charts should be viewed.
FIRST WAVE COUNT
WEEKLY CHART
Click chart to enlarge.
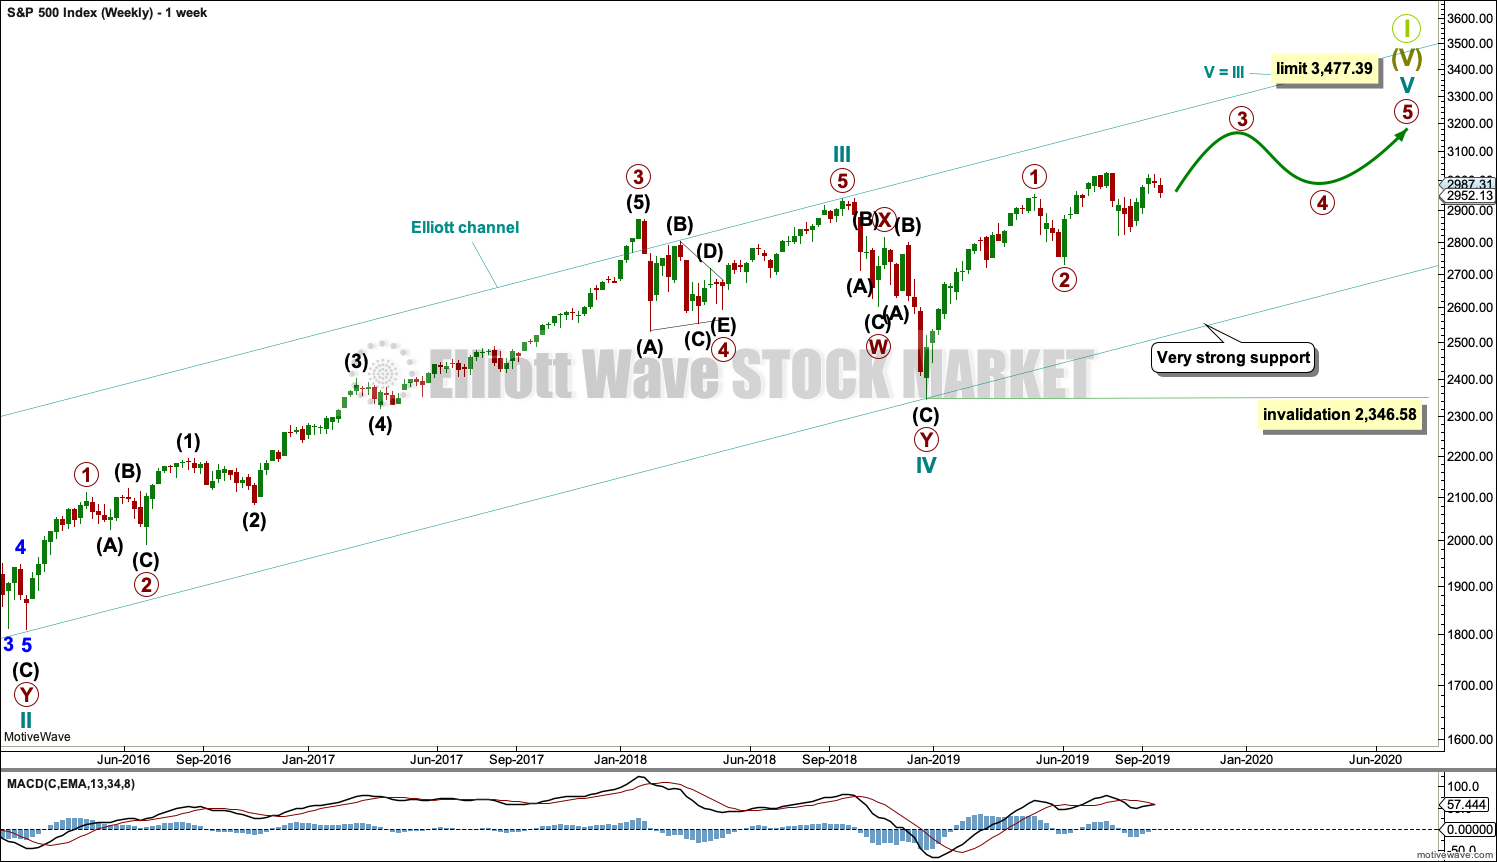
The basic Elliott wave structure consists of a five wave structure up followed by a three wave structure down (for a bull market). This wave count sees the bull market beginning in March 2009 as an incomplete five wave impulse and now within the last fifth wave, which is labelled cycle wave V. This impulse is best viewed on monthly charts. The weekly chart focusses on the end of it.
Elliott wave is fractal. This fifth wave labelled cycle wave V may end a larger fifth wave labelled Super Cycle wave (V), which may end a larger first wave labelled Grand Super Cycle wave I.
The teal Elliott channel is drawn using Elliott’s first technique about the impulse of Super Cycle wave (V). Draw the first trend line from the end of cycle wave I (off to the left of the chart, the weekly candlestick beginning 30th November 2014) to the end of cycle wave III, then place a parallel copy on the end of cycle wave II. This channel perfectly shows where cycle wave IV ended at support. The strongest portion of cycle wave III, the end of primary wave 3, overshoots the upper edge of the channel. This is a typical look for a third wave and suggests the channel is drawn correctly and the way the impulse is counted is correct.
Within Super Cycle wave (V), cycle wave III is shorter than cycle wave I. A core Elliott wave rule states that a third wave may never be the shortest. For this rule to be met in this instance, cycle wave V may not be longer in length than cycle wave III. This limit is at 3,477.39.
Cycle wave V may subdivide either as an impulse or an ending diagonal. Impulses are much more common. This main wave count expects that cycle wave V may be unfolding as an impulse.
The daily charts below will focus on price movement from the end of primary wave 2.
In historic analysis, two further monthly charts have been published that do not have a limit to upwards movement and are more bullish than this wave count. Members are encouraged to consider those possibilities (links below summary) alongside the wave counts presented on a daily and weekly basis.
MAIN DAILY CHART
Click chart to enlarge.
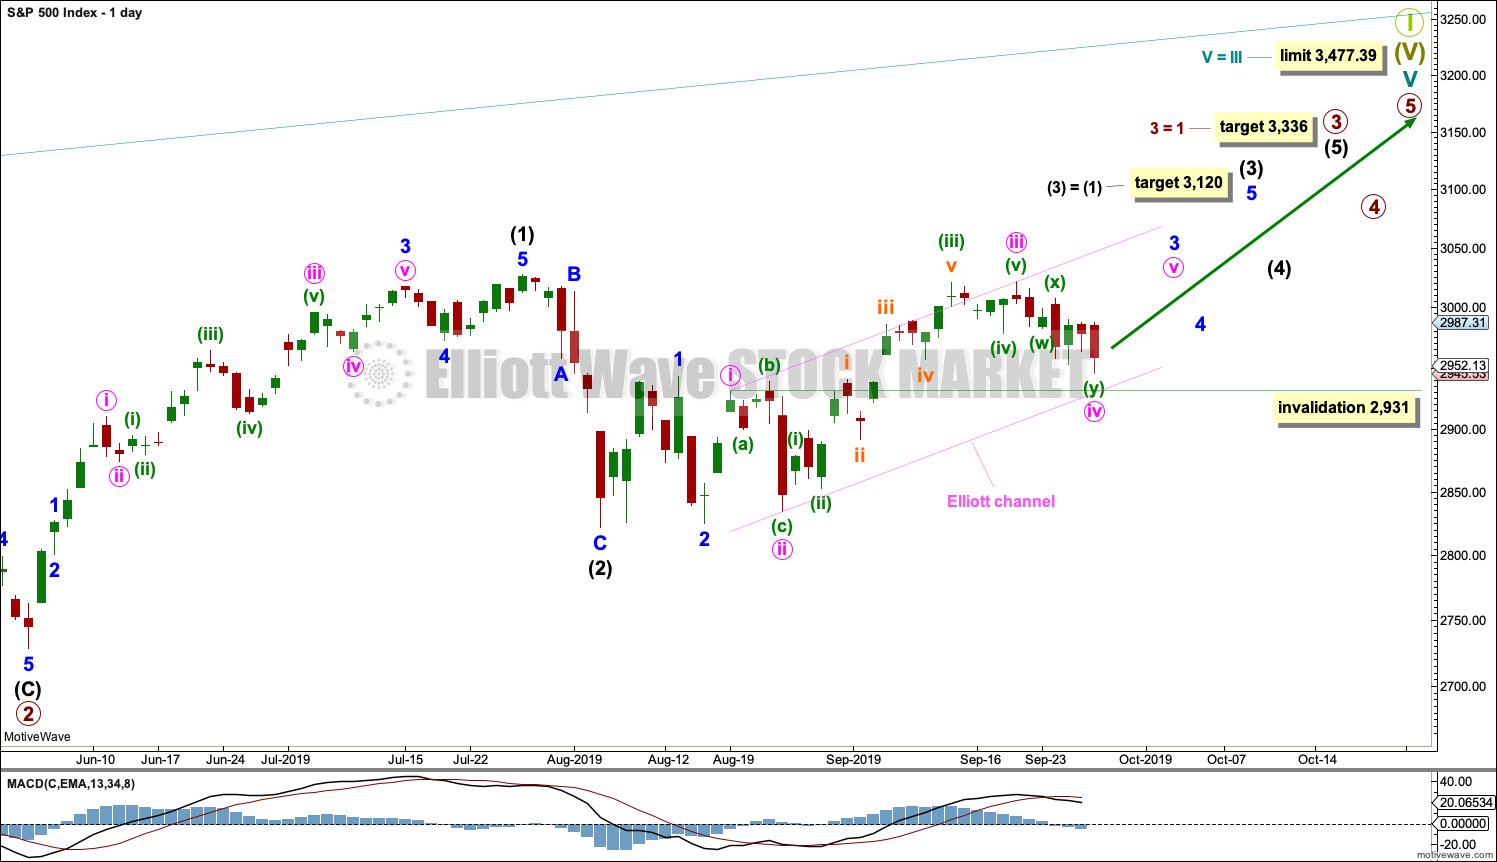
Primary wave 3 may have begun.
Primary wave 3 may only subdivide as an impulse. Within primary wave 3, intermediate waves (1) and (2) may be complete.
Intermediate wave (3) may have begun. Intermediate wave (3) may only subdivide as an impulse.
Within intermediate wave (3), minor waves 1 and 2 may be complete. Within minor wave 3, minute waves i through to iii may now be complete. Minute wave iv may not move into minute wave i price territory below 2,931.
All of primary wave 3, intermediate wave (3), minor wave 3 and minute wave iii may only subdivide as impulses. This labelling of minute wave iii as complete sees the middle of a third wave at multiple degrees now complete.
Intermediate wave (3) must move far enough above the end of intermediate wave (1) to then allow intermediate wave (4) to unfold and remain above intermediate wave (1) price territory.
ALTERNATE DAILY CHART
Click chart to enlarge.
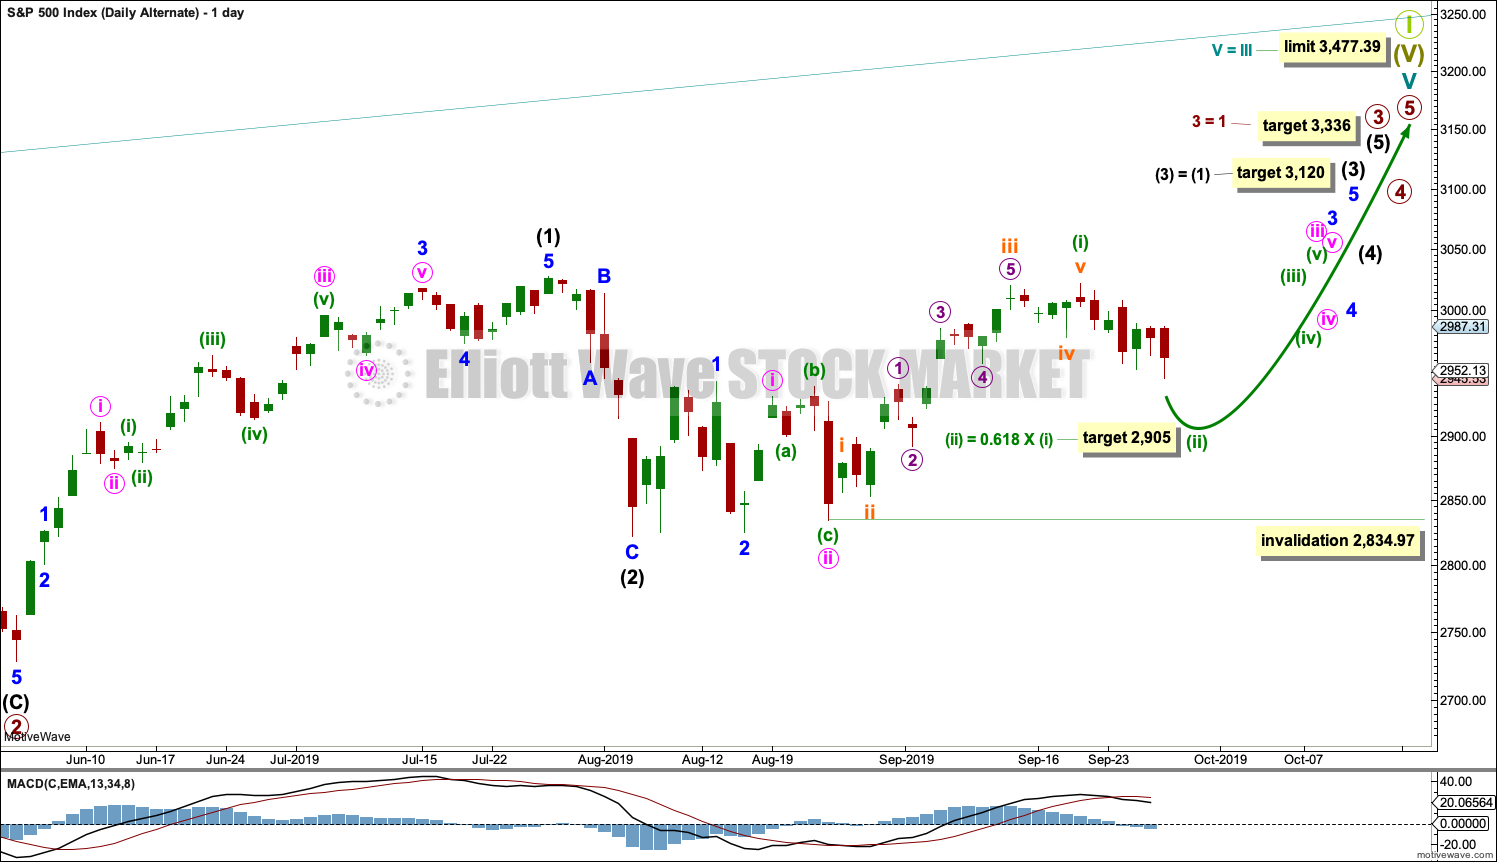
If the main daily wave count is invalidated with a new low by any amount at any time frame below 2,931, then this is the alternate that should be used.
If the degree of labelling within minute wave iii is moved down one degree, then it is possible to see that the pullback may not be over.
Within minute wave iii, it may be that only minuette wave (i) was over at the last high. A target for minuette wave (ii) would be the 0.618 Fibonacci Ratio of minuette wave (i).
This wave count expects that the middle of a third wave at multiple degrees has not yet passed and is ahead. Although this wave count is more bearish for the very short term, it is much more bullish for the mid term.
Minuette wave (ii) may not move beyond the start of minuette wave (i) below 2,834.97.
SECOND WAVE COUNT
WEEKLY CHART
Click chart to enlarge.
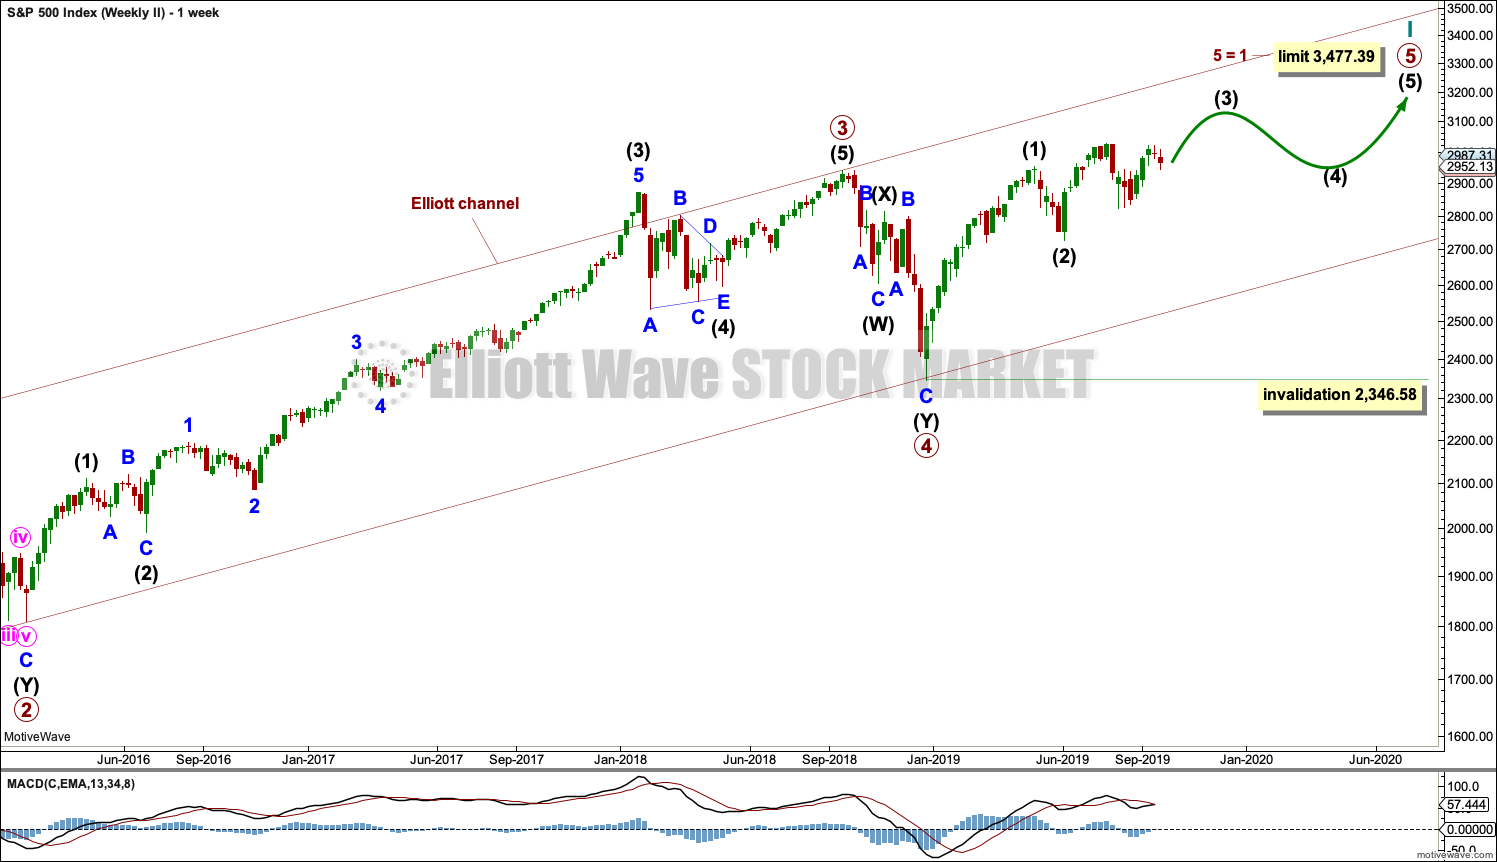
This weekly chart is almost identical to the first weekly chart, with the sole exception being the degree of labelling.
This weekly chart moves the degree of labelling for the impulse beginning in March 2009 all down one degree. This difference is best viewed on monthly charts.
The impulse is still viewed as nearing an end; a fifth wave is still seen as needing to complete higher. This wave count labels it primary wave 5.
TECHNICAL ANALYSIS
WEEKLY CHART
Click chart to enlarge. Chart courtesy of StockCharts.com.
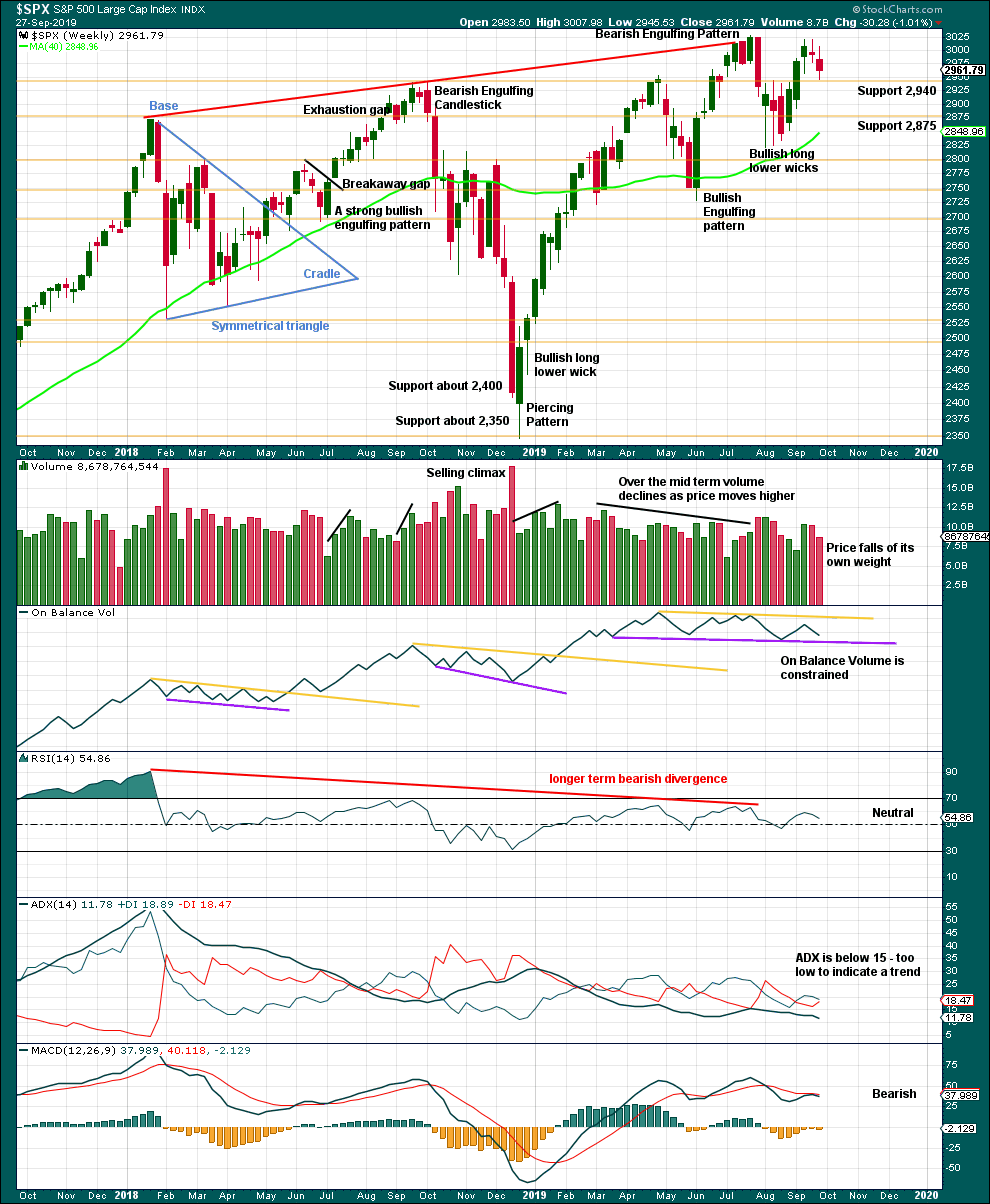
There is no bearish candlestick reversal pattern in the last three weekly candlesticks. A decline in volume this week with a small range real body is slightly bullish. This looks like a small pullback within an ongoing upwards trend.
DAILY CHART
Click chart to enlarge. Chart courtesy of StockCharts.com.
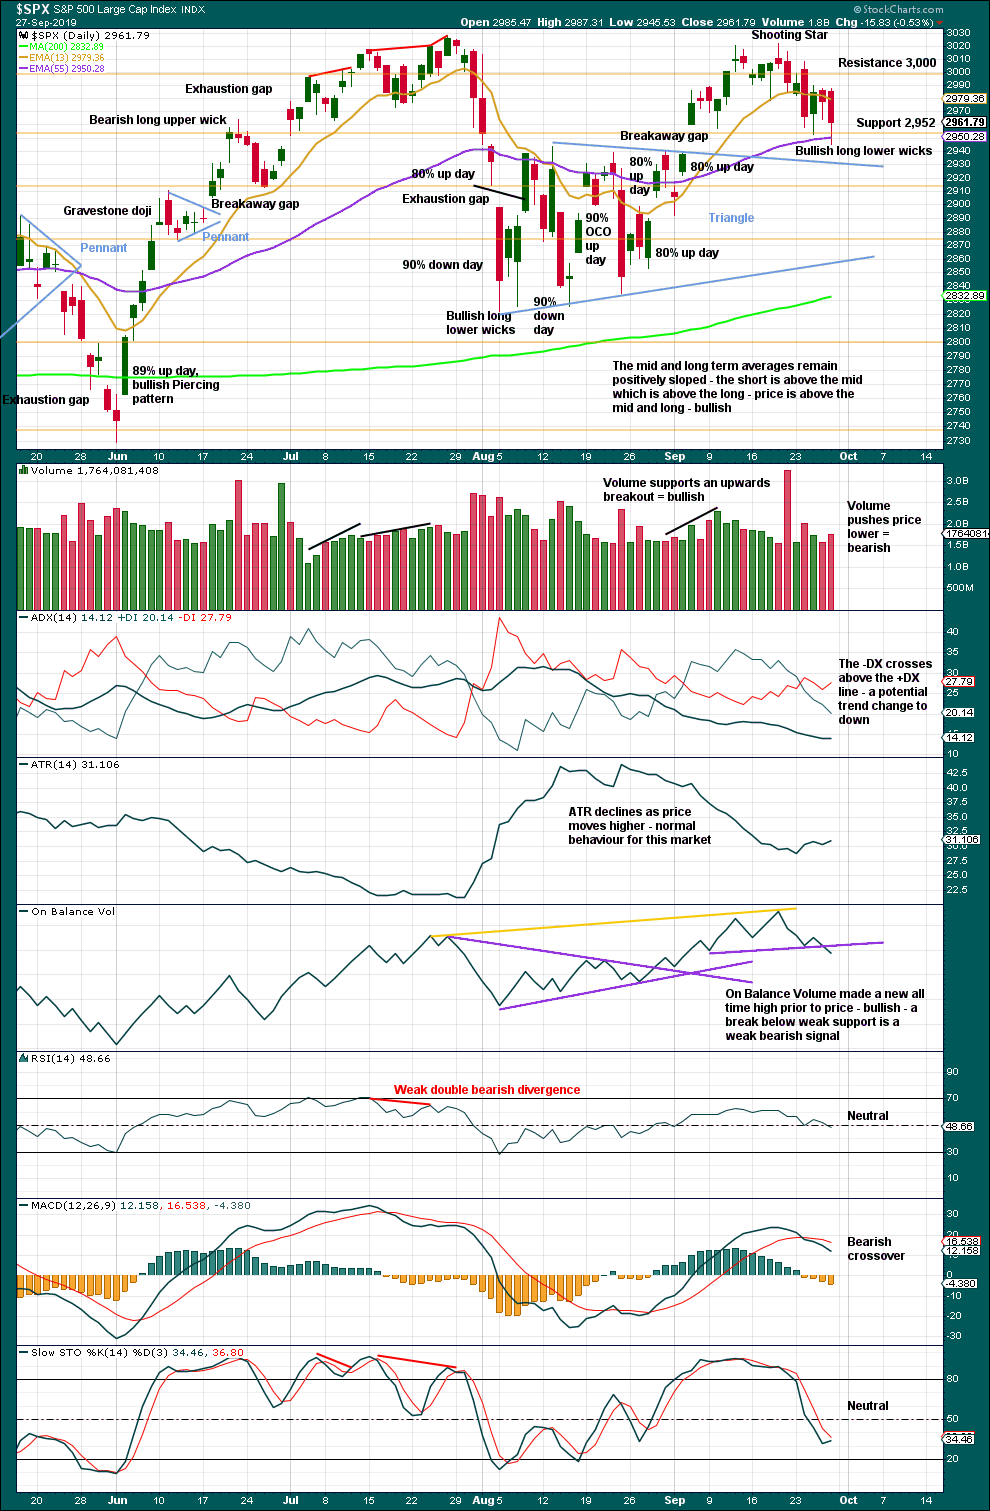
There is now a series of higher highs and higher lows since the 5th of August. Strength in 90% up days and back to back 80% up days off lows indicate the lows may be sustainable.
The target from the triangle is at 3,060, which has still not been met and remains valid.
It looks like price has curved down to complete a typical test of support about the breakaway gap from the triangle. Support is holding. Now three long lower candlestick wicks in a row suggests price may move upwards from here.
BREADTH – AD LINE
WEEKLY CHART
Click chart to enlarge. Chart courtesy of StockCharts.com. So that colour blind members are included, bearish signals
will be noted with blue and bullish signals with yellow.
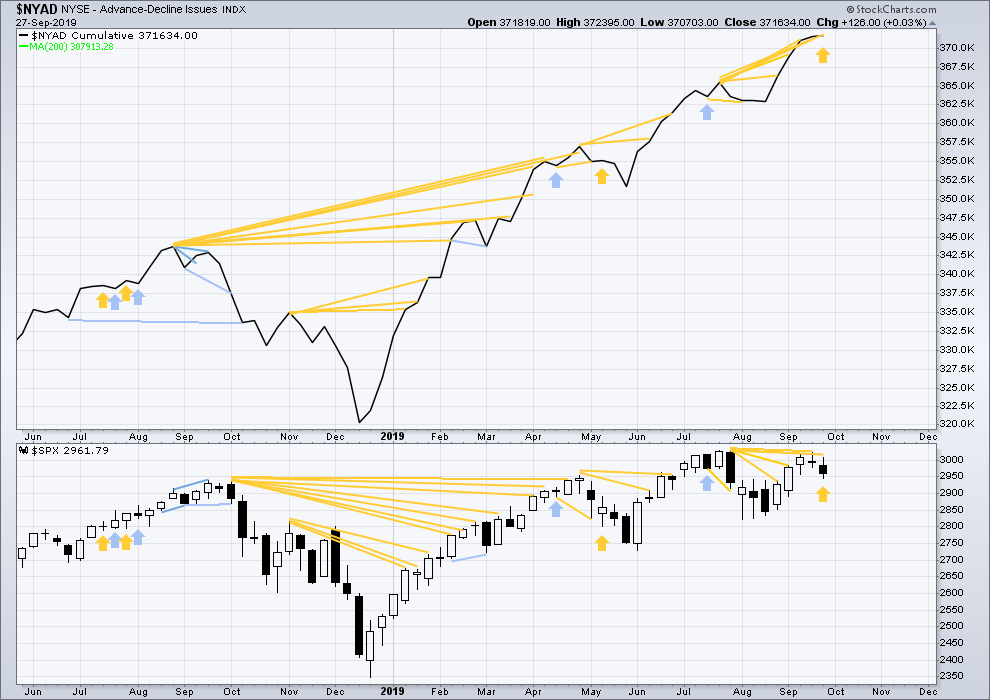
Bear markets from the Great Depression and onwards have been preceded by an average minimum of 4 months divergence between price and the AD line with only two exceptions in 1946 and 1976. With the AD line making new all time highs again this week, the end of this bull market and the start of a new bear market is very likely a minimum of 4 months away, which is end January 2020.
In all bear markets in the last 90 years there is some positive correlation (0.6022) between the length of bearish divergence and the depth of the following bear market. No to little divergence is correlated with more shallow bear markets. Longer divergence is correlated with deeper bear markets.
If a bear market does develop here, it comes after no bearish divergence. It would therefore more likely be shallow.
This week price has moved lower, but the AD line has moved slightly higher to make a slight new all time high. This divergence is strongly bullish and supports the main Elliott wave count.
Small caps have made a new swing high above the prior high of the end of July, but mid and large caps have not yet done so. This upwards movement of the last four weeks appears to be led by small caps. Because small caps are usually the first to exhibit deterioration in the later stages of a bull market, some strength in small caps at this stage indicates a healthy bull market with further to run.
DAILY CHART
Click chart to enlarge. Chart courtesy of StockCharts.com. So that colour blind members are included, bearish signals
will be noted with blue and bullish signals with yellow.
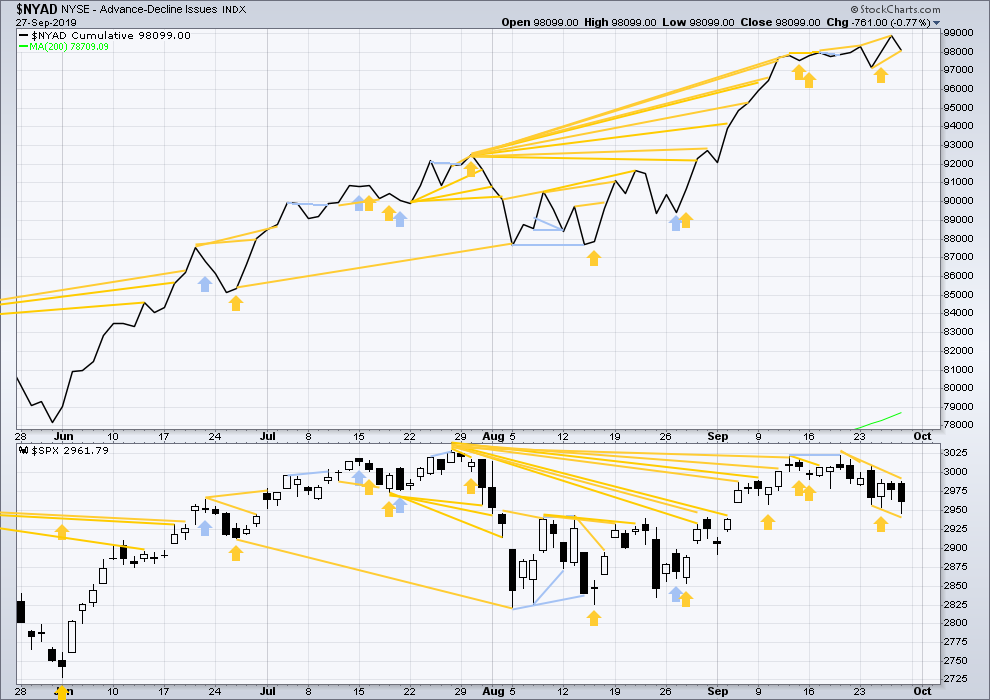
Breadth should be read as a leading indicator.
A new all time high on Thursday from the AD line is again bullish divergence and supports the main Elliott wave count.
VOLATILITY – INVERTED VIX CHART
WEEKLY CHART
Click chart to enlarge. Chart courtesy of StockCharts.com. So that colour blind members are included, bearish signals
will be noted with blue and bullish signals with yellow.
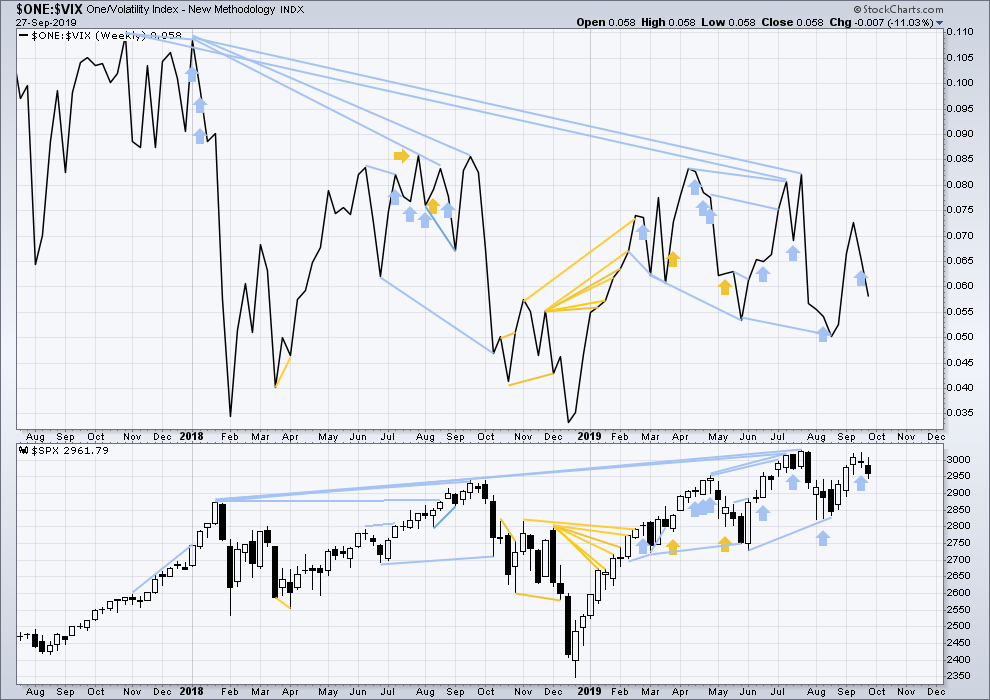
The all time high for inverted VIX (which is the same as the low for VIX) was on 30th October 2017. There is now nearly one year and eleven months of bearish divergence between price and inverted VIX.
The rise in price is not coming with a normal corresponding decline in VIX; VIX remains elevated. This long-term divergence is bearish and may yet develop further as the bull market matures.
This divergence may be an early warning, a part of the process of a top developing that may take years. It may not be useful in timing a trend change.
Bearish short-term divergence noted last week at the weekly chart level between price and inverted VIX has now been followed by a downwards week. It may be resolved here.
This week both price and inverted VIX moved lower. There is no new short-term divergence.
DAILY CHART
Click chart to enlarge. Chart courtesy of StockCharts.com. So that colour blind members are included, bearish signals
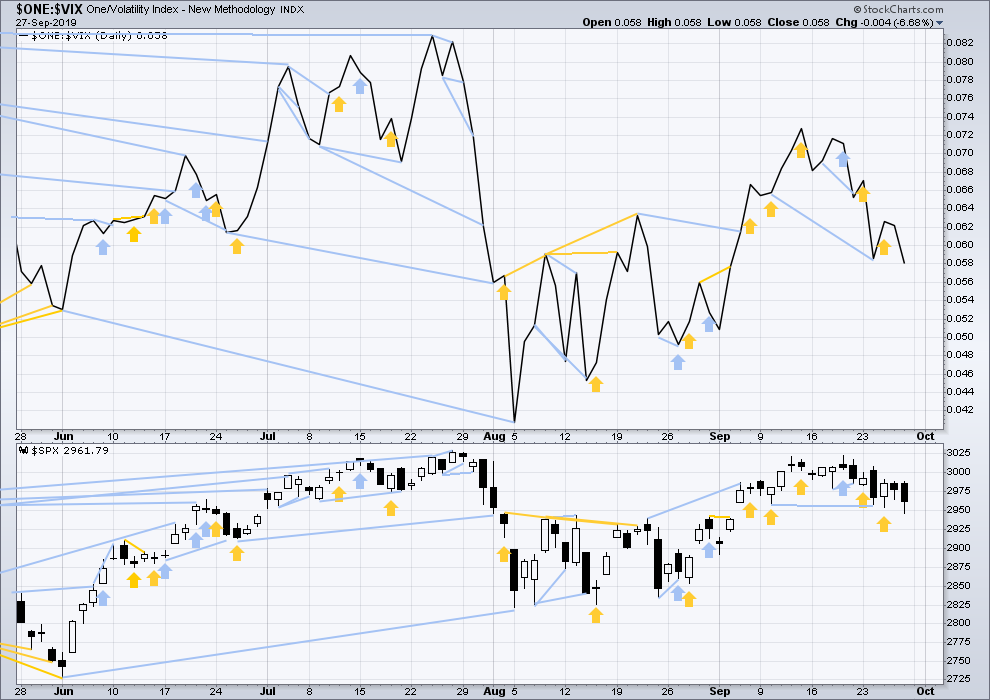
will be noted with blue and bullish signals with yellow.
Both price and inverted VIX have moved lower on Friday. There is no new short-term divergence.
On Friday price has made a new short-term swing low below the low two sessions prior, but the AD line has not. This short-term divergence is bullish and supports the view that a low may be in on Friday.
DOW THEORY
Dow Theory confirmed a bear market in December 2018. This does not necessarily mean a bear market at Grand Super Cycle degree though; Dow Theory makes no comment on Elliott wave counts. On the 25th of August 2015 Dow Theory also confirmed a bear market. The Elliott wave count sees that as part of cycle wave II. After Dow Theory confirmation of a bear market in August 2015, price went on to make new all time highs and the bull market continued.
DJIA: 23,344.52 – a close on the 19th of December at 23,284.97 confirms a bear market.
DJT: 9,806.79 – price has closed below this point on the 13th of December.
S&P500: 2,532.69 – a close on the 19th of December at 2,506.96 provides support to a bear market conclusion.
Nasdaq: 6,630.67 – a close on the 19th of December at 6,618.86 provides support to a bear market conclusion.
With all the indices having moved higher following a Dow Theory bear market confirmation, Dow Theory would confirm a bull market if the following highs are made:
DJIA: 26,951.81 – a close above this point has been made on the 3rd of July 2019.
DJT: 11,623.58 – to date DJT has failed to confirm an ongoing bull market.
S&P500: 2,940.91 – a close above this point was made on the 29th of April 2019.
Nasdaq: 8,133.30 – a close above this point was made on the 26th of April 2019.
GOLD
Again, downwards movement was expected. For the short term, a bounce was expected to begin. This is what happened at the end of Friday’s session after downwards movement.
Summary: A short-term target may now be at 1,464 or 1,420. A classic analysis target using the flag pattern is at 1,426.
The bearish Elliott wave count expects a new downwards trend to last one to several years has begun. Confidence in this view may be had if price makes a new low by any amount at any time frame below 1,346.45.
The bullish Elliott wave count expects a primary degree fourth wave is unfolding, forming a large consolidation to end in possibly 5 more sessions. The eventual area of support for the consolidation is expected to be about 1,431.
Grand SuperCycle analysis is here.
Monthly charts were last published here with video here.
BEARISH ELLIOTT WAVE COUNT
WEEKLY CHART
Click chart to enlarge.
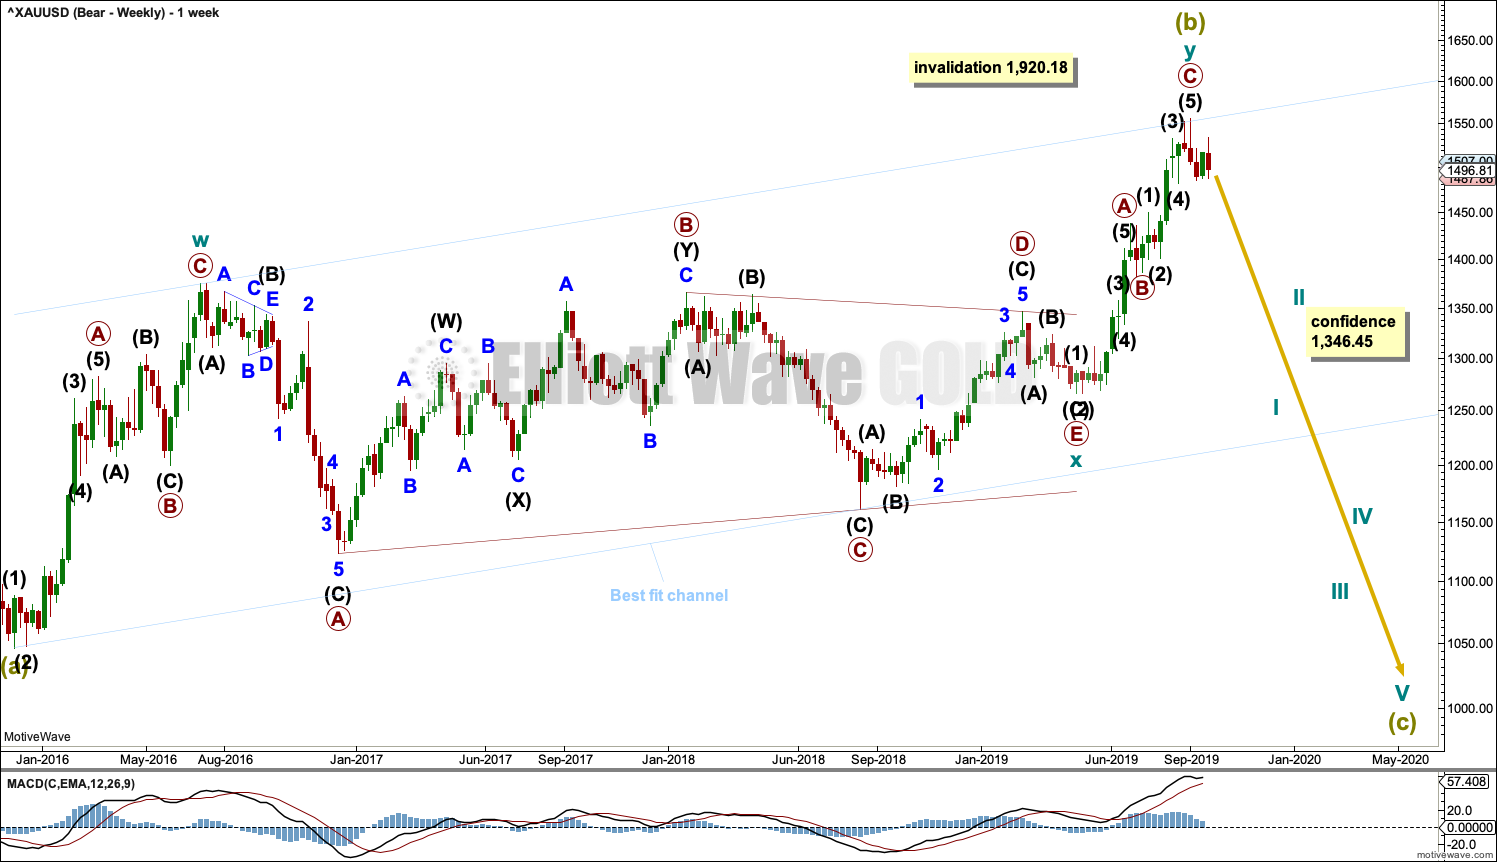
It is possible that Super Cycle wave (b) is complete as a double zigzag.
The first zigzag in the double is labelled cycle wave w. The double is joined by a three in the opposite direction, a triangle labelled cycle wave x. The second zigzag in the double is labelled cycle wave y.
The purpose of the second zigzag in a double is to deepen the correction. Cycle wave y has achieved this purpose.
A new low below 1,346.45 would add strong confidence to this wave count. At that stage, the bullish Elliott wave count would be invalidated.
A wide best fit channel is added in light blue. This channel contains all of Super Cycle wave (b) and may provide resistance and support. Copy this channel over to daily charts.
DAILY CHART
Click chart to enlarge.
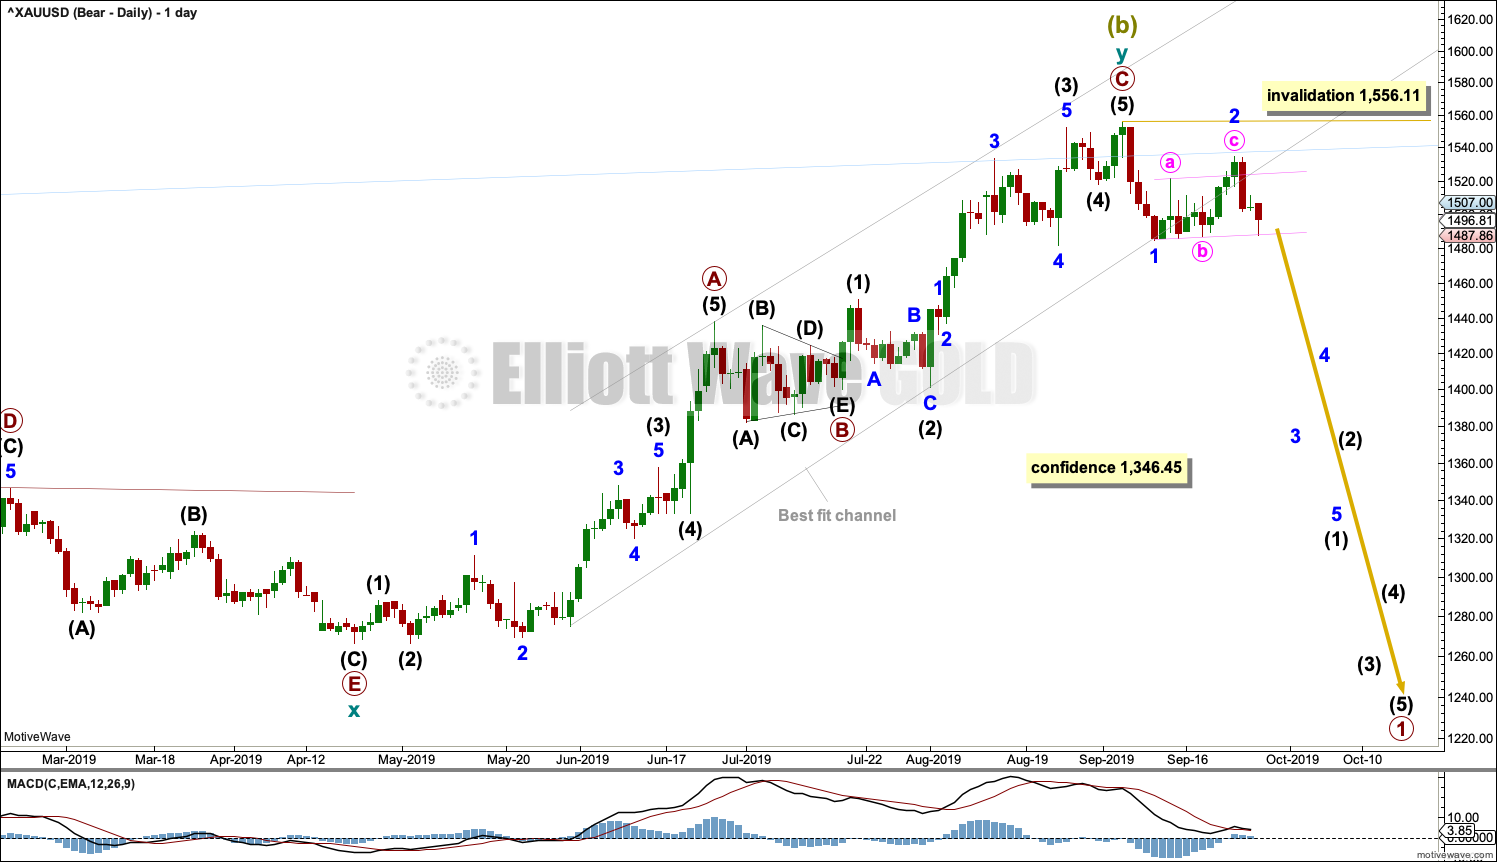
Within cycle wave y, the triangle that ended on the 17th of July may have been primary wave B. Primary wave C may have begun there. Primary wave C must subdivide as a five wave structure; it could be a complete impulse.
Within cycle wave y, there is no Fibonacci Ratio between primary waves A and C.
Draw a small channel about minor wave 2 using Elliott’s technique for a correction: draw the first trend line from the start of minute wave a to the end of minute wave b, then place a parallel copy on the end of minute wave a. The lower edge of this channel shows where price has bounced up at the end of Friday’s session.
BULLISH ELLIOTT WAVE COUNT
WEEKLY CHART
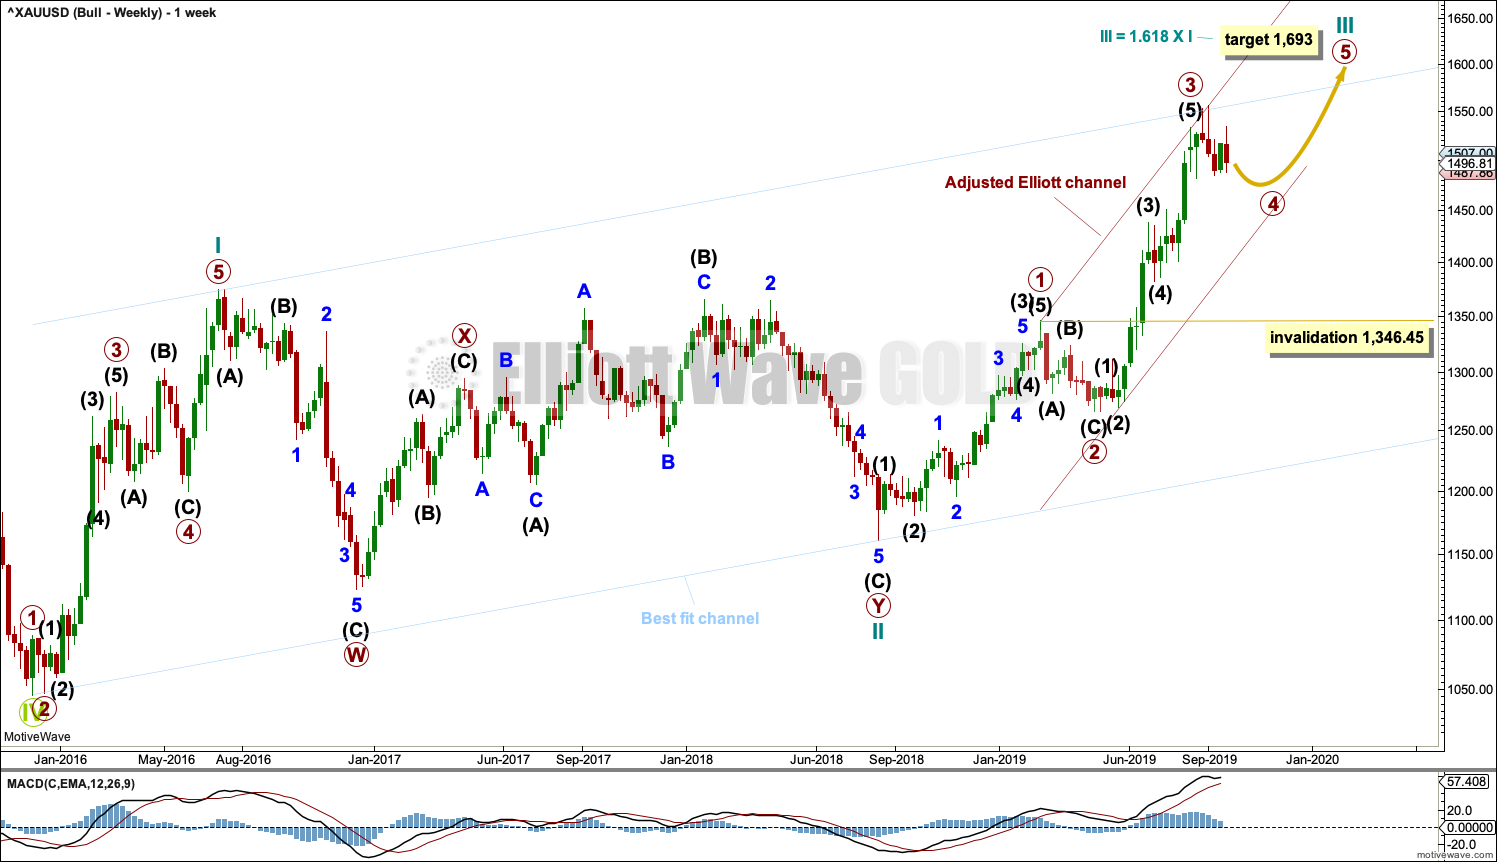
Click chart to enlarge.
This wave count sees the the bear market complete at the last major low for Gold in November 2015.
If Gold is in a new bull market, then it should begin with a five wave structure upwards on the weekly chart. However, the biggest problem with this wave count is the structure labelled cycle wave I because this wave count must see it as a five wave structure, but it looks more like a three wave structure.
Commodities often exhibit swift strong fifth waves that force the fourth wave corrections coming just prior and just after to be more brief and shallow than their counterpart second waves. It is unusual for a commodity to exhibit a quick second wave and a more time consuming fourth wave, and this is how cycle wave I is labelled. This wave count still suffers from this very substantial problem, and for this reason the bearish wave count is still considered because it has a better fit in terms of Elliott wave structure.
Cycle wave II subdivides well as a double combination: zigzag – X – expanded flat.
Cycle wave III may have begun. Within cycle wave III, primary waves 1 and 2 may now be complete. Primary wave 3 has now moved above the end of primary wave 1 meeting a core Elliott wave rule. It has now moved far enough to allow room for primary wave 4 to unfold and remain above primary wave 1 price territory. Primary wave 4 may not move into primary wave 1 price territory below 1,346.45.
Cycle wave III so far for this wave count would have been underway now for 58 weeks. It is beginning to exhibit some support from volume and increasing ATR. This wave count now has some support from classic technical analysis.
The channel drawn about cycle wave III is an adjusted Elliott channel. The lower edge is pulled lower. Primary wave 4 may find support about the lower edge.
Add the wide best fit channel to weekly and daily charts.
DAILY CHART
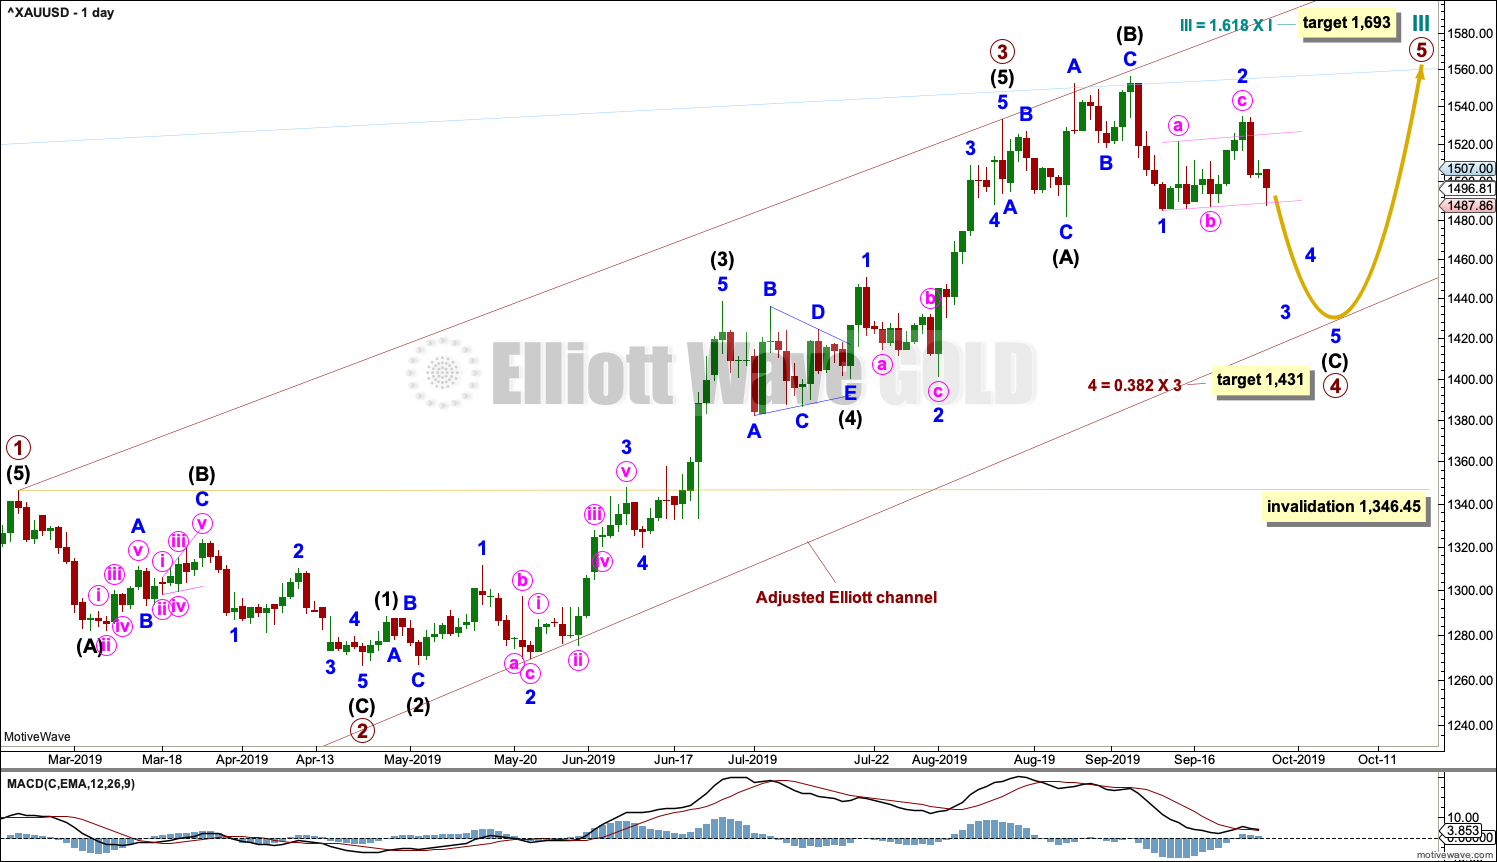
Click chart to enlarge.
Primary wave 4 may be continuing as an expanded flat, which is a common corrective structure. This would see alternation in structure with the zigzag of primary wave 2.
Primary wave 2 lasted 43 sessions. Primary wave 4 may be expected to be more brief; Gold usually exhibits more brief fourth waves than their counterpart second waves. Primary wave 4 may not exhibit a Fibonacci number in duration. It may be about even in duration with primary wave 2. So far primary wave 4 has lasted 32 sessions.
Within primary wave 4, it would be extremely likely for intermediate wave (C) to move at least slightly below the end of intermediate wave (A) at 1,481.91 to avoid a truncation and a very rare running flat. It would be most likely that primary wave 4 is incomplete because there is not yet a new low below 1,481.91.
Primary wave 4 may not move into primary wave 1 price territory below 1,346.45.
TECHNICAL ANALYSIS
WEEKLY CHART
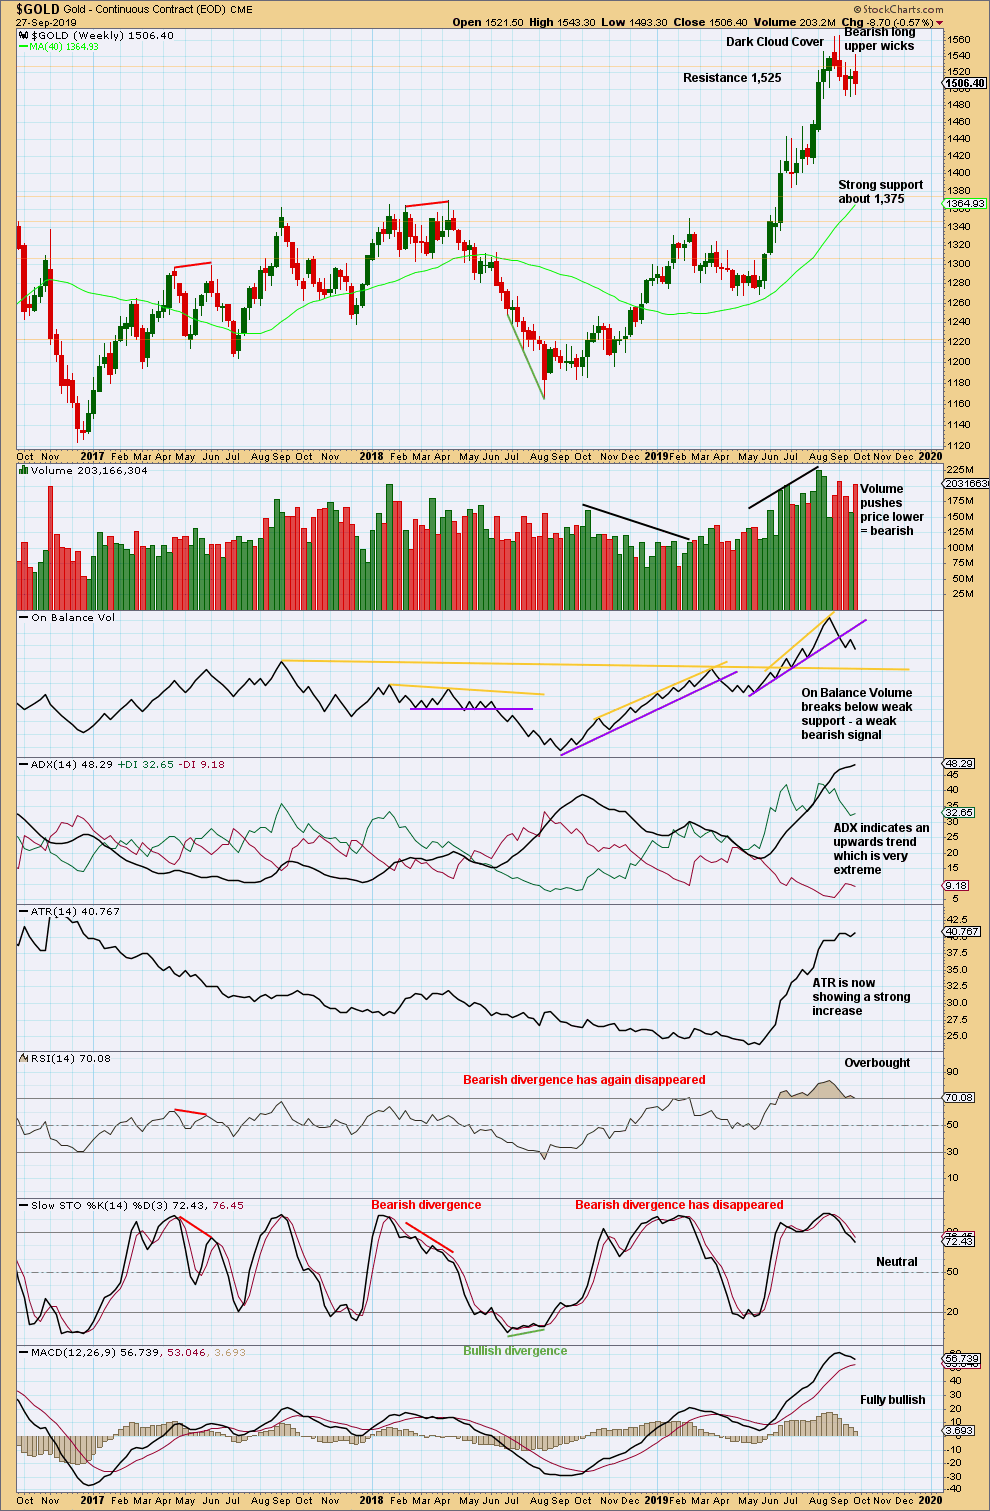
Click chart to enlarge. Chart courtesy of StockCharts.com.
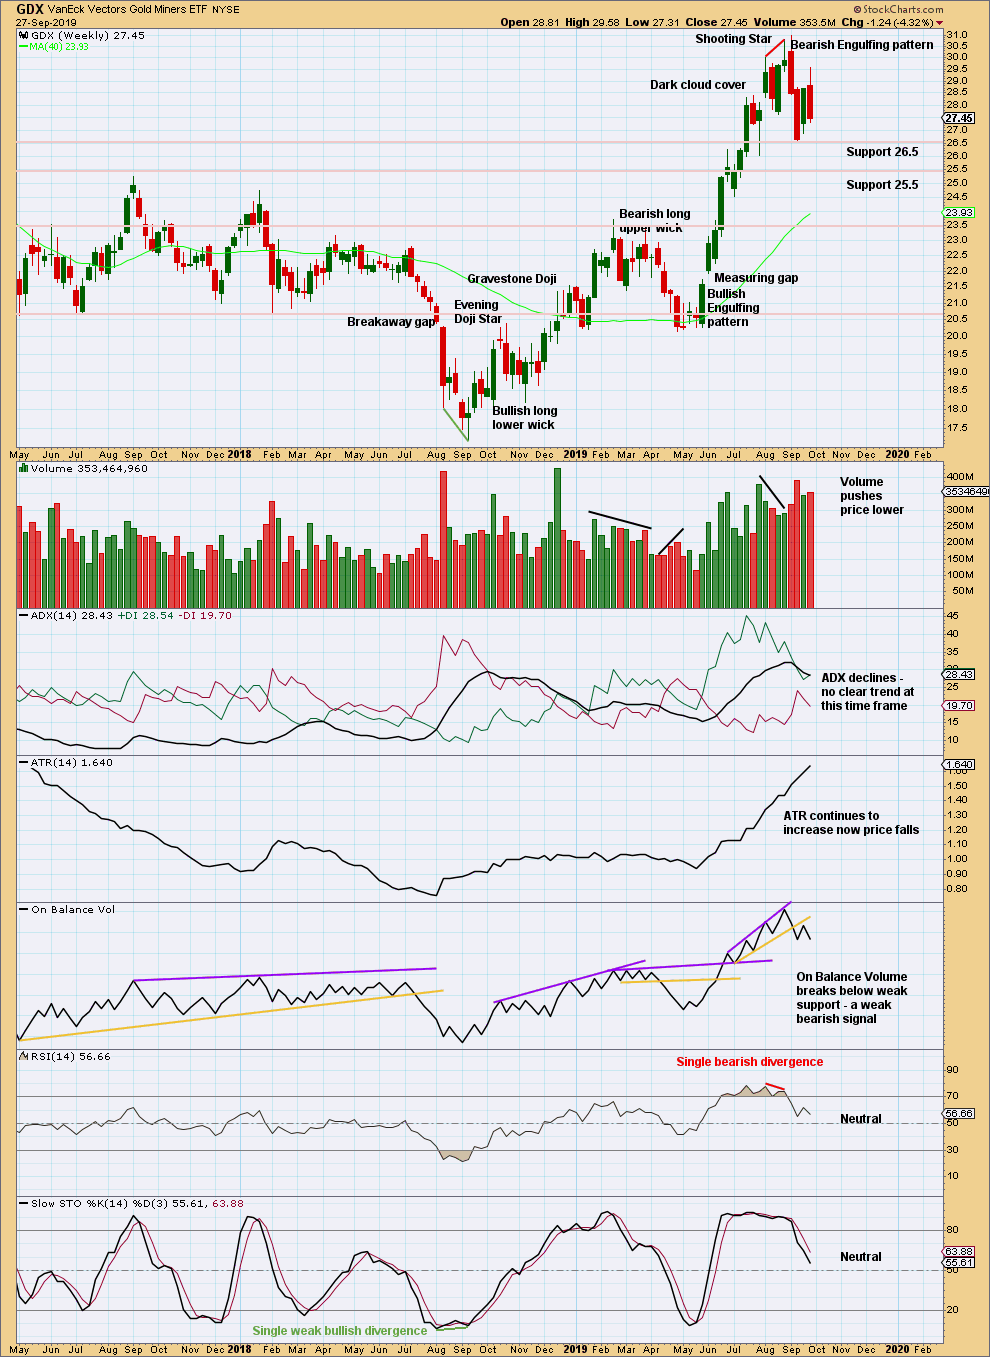
When trends reach very extreme, candlestick reversal patterns should be given weight. The Dark Cloud Cover bearish reversal pattern is given more bearish weight from the long upper wick.
The risk of a major high and a trend change or a large time consuming consolidation continuing here is very high. These two scenarios effectively follow the main bearish wave count (major trend change) or bullish wave count (a large time consuming consolidation).
A weak bearish signal from On Balance Volume adds confidence to this analysis.
This week completes an upwards week with a higher high and a higher low, but the candlestick has closed red and the balance of volume is down. Volume is pushing price lower. The longer upper wick on this weekly candlestick is also bearish.
DAILY CHART
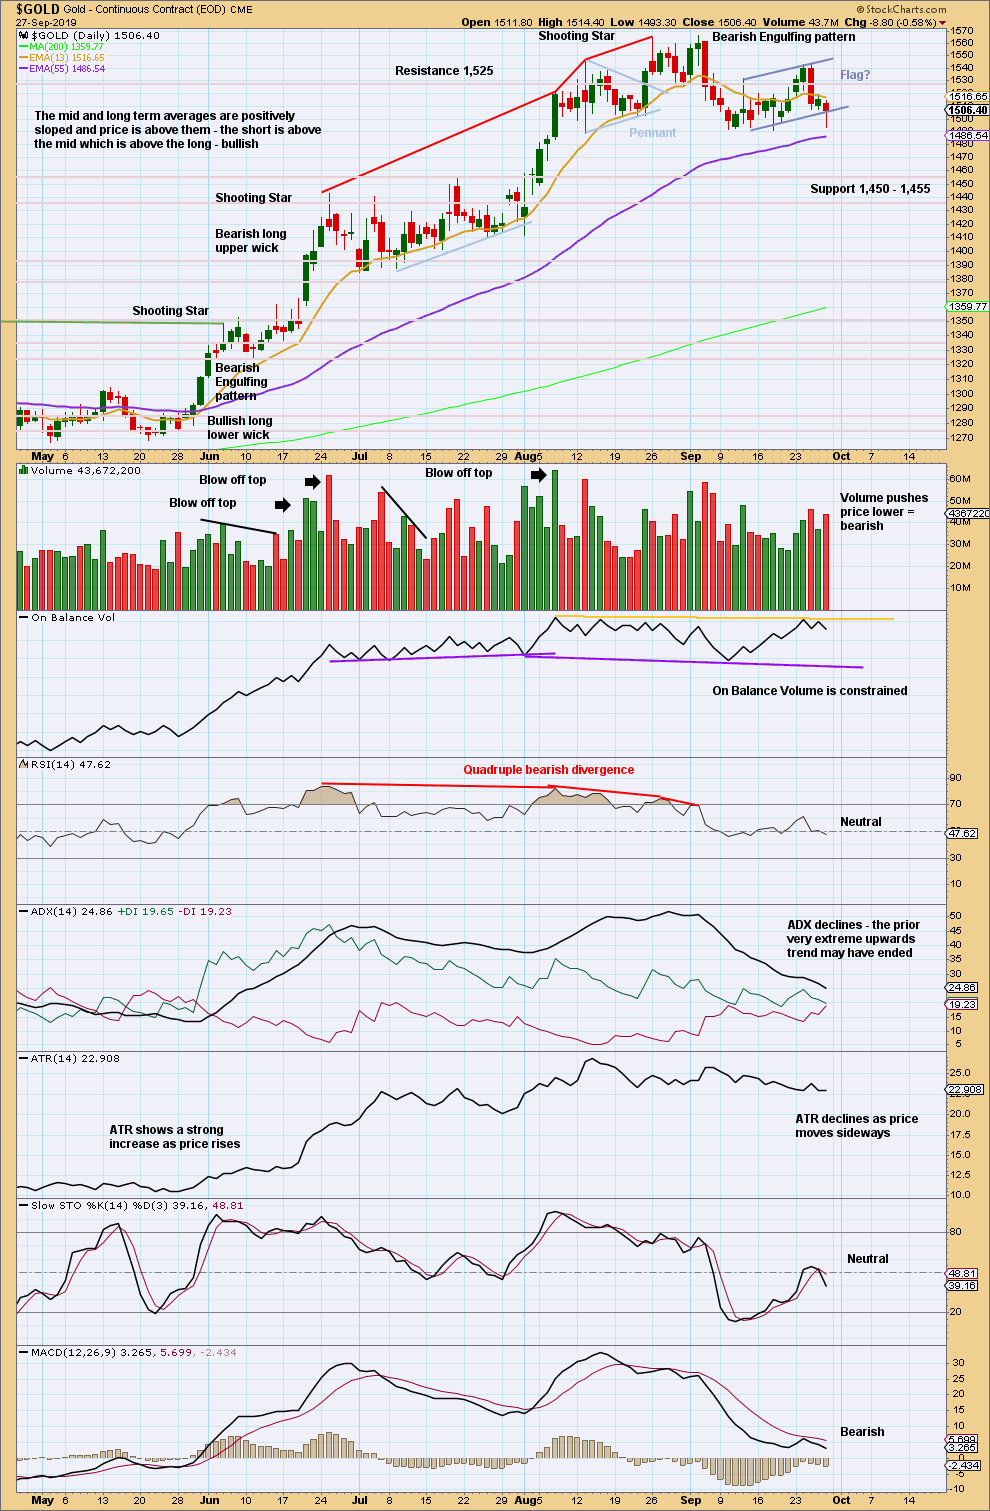
Click chart to enlarge. Chart courtesy of StockCharts.com.
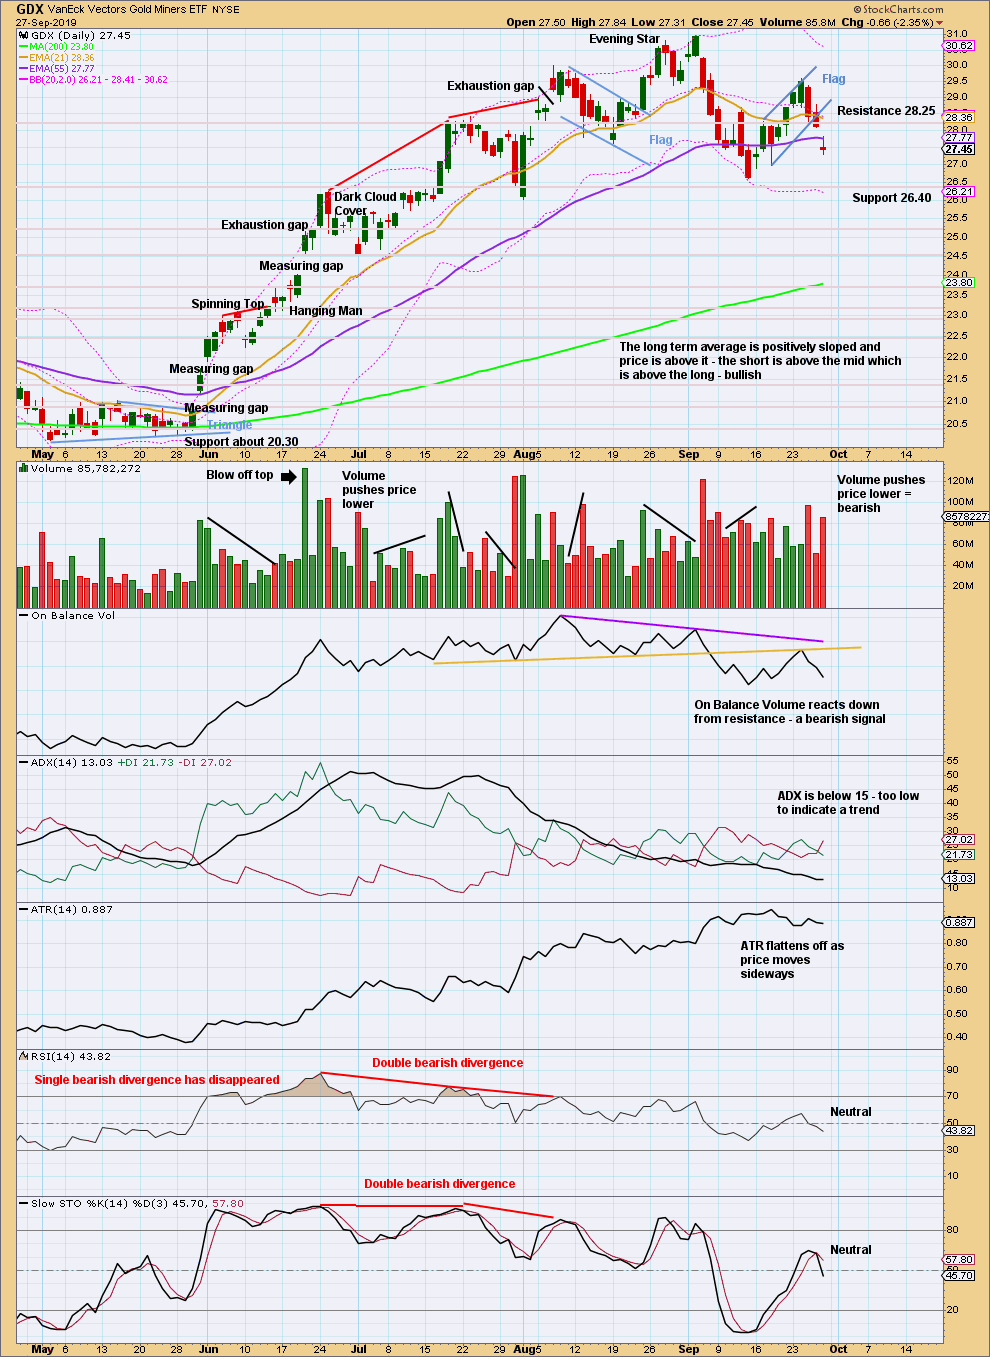
The flag no longer looks very clear. Friday did not effect a downwards breakout below the flag trend line. A target calculated from the flag pole would be about 1,426.
Volume remains fairly strongly bearish.
Price is range bound with resistance about 1,540 and support about 1,490. A breakout is required to indicate the next direction of a trend.
GDX WEEKLY CHART
Click chart to enlarge. Chart courtesy of StockCharts.com.
This week saw price move higher with a higher high and a higher low, but the candlestick is red and the balance of volume is down. The longer upper wick is also bearish.
GDX DAILY CHART
Click chart to enlarge. Chart courtesy of StockCharts.com.
A target would be at 23.87. The breakaway gap for Friday’s open should offer resistance now at 28.09.
US OIL
A consolidation was expected to continue. Price remains range bound.
Summary: A consolidation is expected to most likely continue sideways for a few more weeks. Resistance is about 66.59 and support is about 50.53. The breakout is expected to most likely be downwards.
The bullish alternate wave count would have confidence above 76.90. At that stage, a target for a third wave to end would be at 89.80.
MAIN ELLIOTT WAVE COUNT – BEARISH
MONTHLY CHART
Click chart to enlarge.
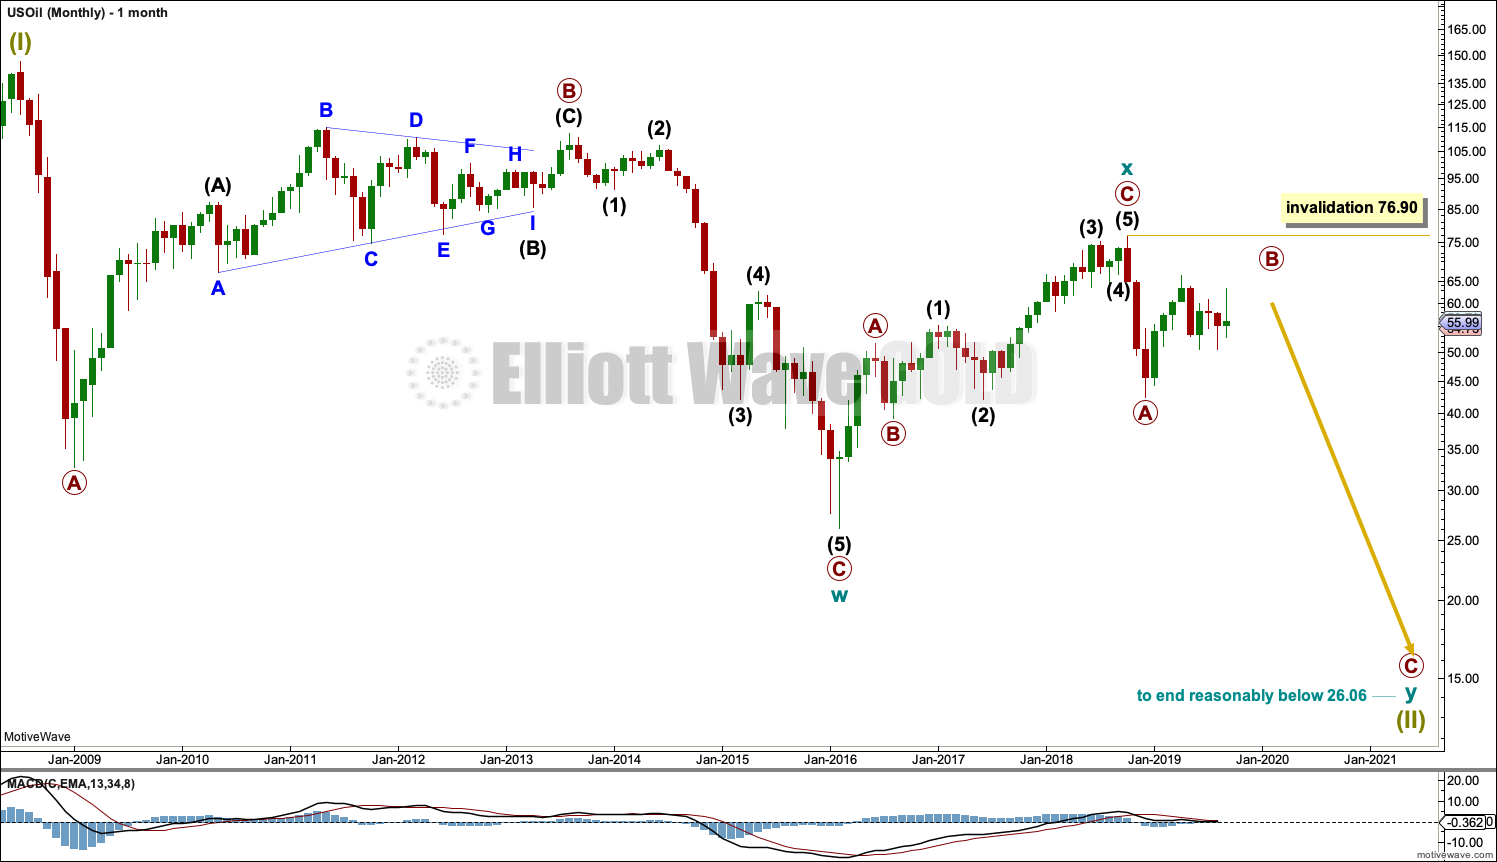
The basic Elliott wave structure is five steps forward and three steps back. This Elliott wave count expects that US Oil is still within a three steps back pattern, which began in July 2008. The Elliott wave count expects that the bear market for US Oil continues.
This Elliott wave corrective structure is a double zigzag, which is a fairly common structure. The correction is labelled Super Cycle wave (II).
The first zigzag in the double is complete and labelled cycle wave y. The double is joined by a three in the opposite direction labelled cycle wave x, which subdivides as a zigzag. The second zigzag in the double may now have begun, labelled cycle wave w.
The purpose of a second zigzag in a double zigzag is to deepen the correction when the first zigzag does not move price deep enough. To achieve this purpose cycle wave y may be expected to move reasonably below the end of cycle wave w at 26.06. When primary wave B may be complete then the start of primary wave C may be known and a target may be calculated.
Cycle wave y is expected to subdivide as a zigzag, which subdivides 5-3-5.
Cycle wave w lasted 7.6 years and cycle wave x lasted 2.7 years. Cycle wave y may be expected to last possibly about a Fibonacci 5 or 8 years.
Primary wave B may not move beyond the start of primary wave A above 76.90.
WEEKLY CHART
Click chart to enlarge.
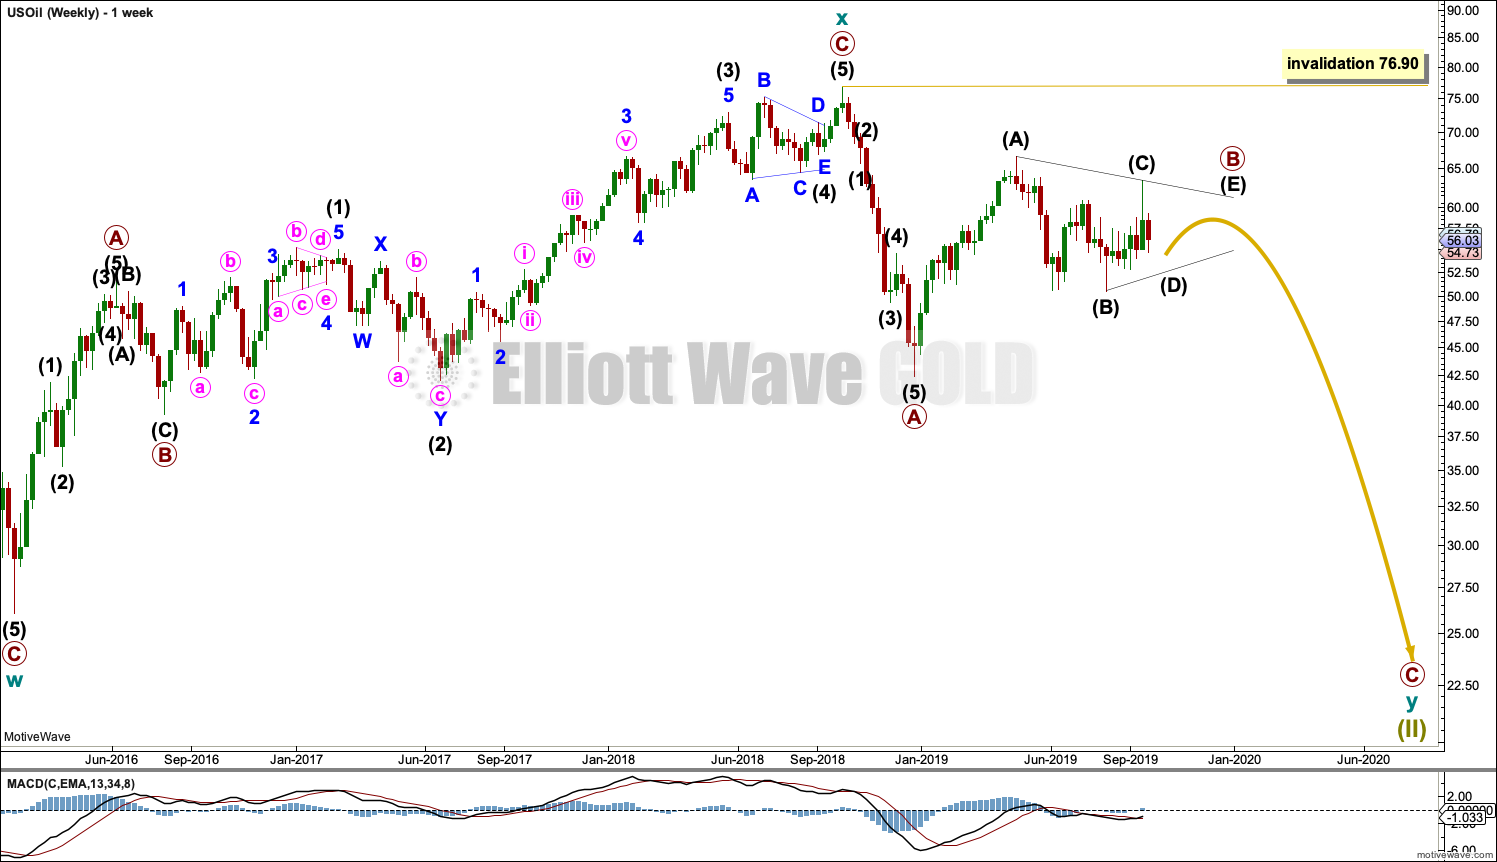
This weekly chart shows all of cycle waves x and y so far.
Cycle wave y is expected to subdivide as a zigzag. A zigzag subdivides 5-3-5. Primary wave A must subdivide as a five wave structure if this wave count is correct.
Primary wave A may be a complete five wave impulse at the last low.
Primary wave B may now be continuing further as a triangle or combination. Both ideas are outlined in daily charts below, and a triangle is labelled on the weekly chart.
When primary wave B may be complete, then a downwards breakout would be expected for primary wave C.
Primary wave B may not move beyond the start of primary wave A above 76.90.
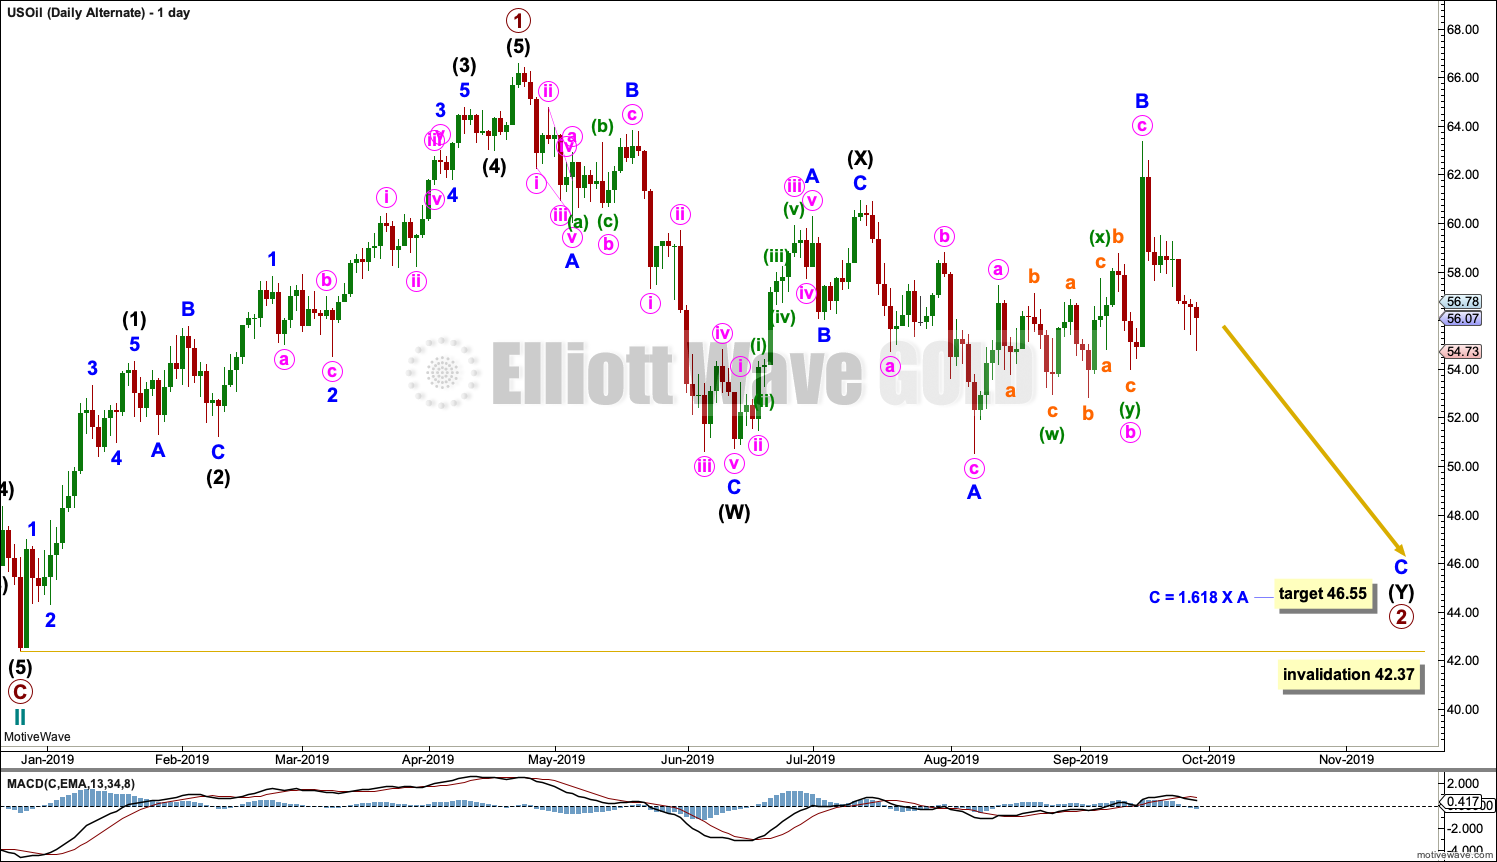
DAILY CHART
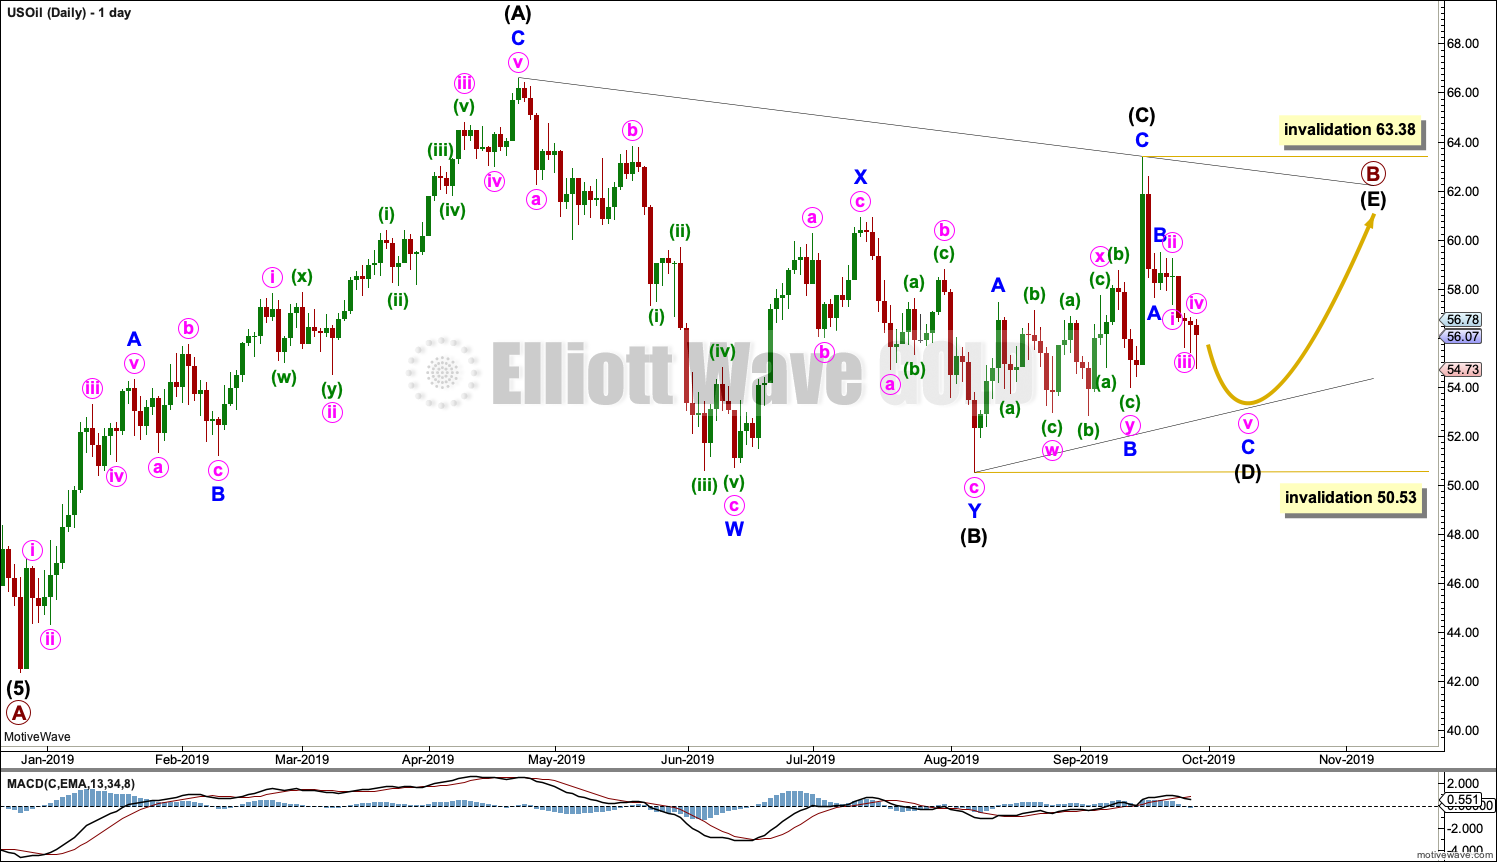
Click chart to enlarge.
Note that monthly and weekly charts are on a semi-log scale, but this daily chart is on an arithmetic scale. This makes a slight difference to trend channels.
Elliott wave triangles are always continuation patterns. When primary wave B is complete, then a downwards breakout would be expected for primary wave C.
This chart considers a triangle for primary wave B. The triangle may be a regular contracting or regular barrier triangle.
Within a contracting triangle: intermediate wave (C) may not move beyond the end of intermediate wave (A); intermediate wave (D) may not move beyond the end of intermediate wave (B) below 50.53; intermediate wave (E) may not move beyond the end of intermediate wave (C) above 63.38, and would most likely fall short of the (A)-(C) trend line.
Within a barrier triangle: intermediate wave (C) may not move beyond the end of intermediate wave (A); intermediate wave (D) should end about the same level as intermediate wave (B) at 50.53 so that the (B)-(D) trend line is flat (in practice, this means that intermediate wave (D) may move slightly below intermediate wave (B) at 50.53; this invalidation point is not absolute for a barrier triangle); and, finally, intermediate wave (E) may not move beyond the end of intermediate wave (C) above 63.38, and would most likely fall short of the (A)-(C) trend line.
All triangle sub-waves must subdivide as corrective structures. Four of the five sub-waves must subdivide as zigzags or zigzag multiples, with only one sub-wave allowed to subdivide as a multiple. So far intermediate wave (B) fits best as a double zigzag. All remaining waves of intermediate waves (C), (D) and (E) should now subdivide as single zigzags.
DAILY CHART II
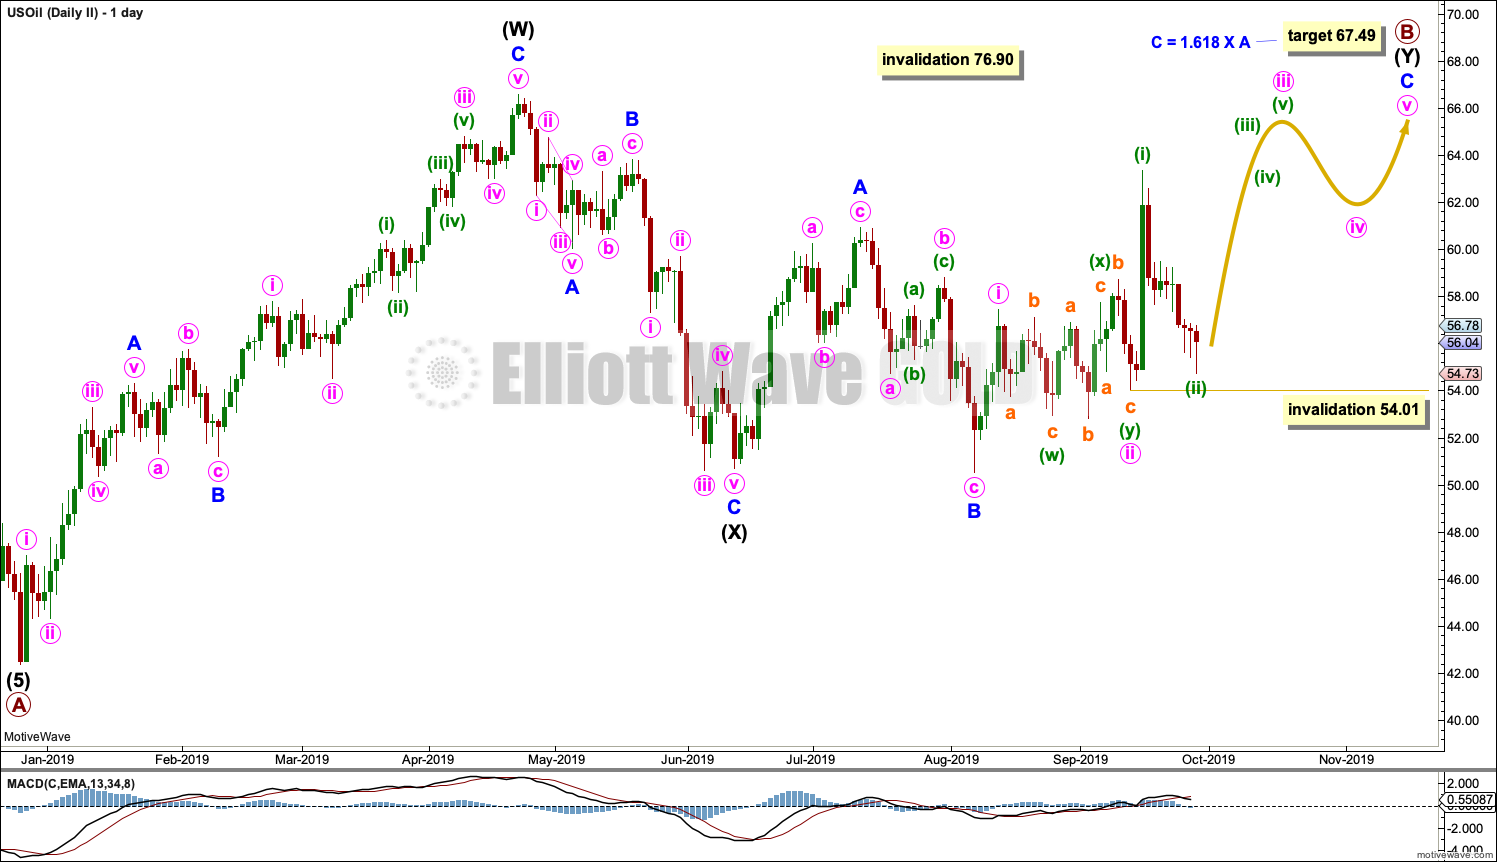
Click chart to enlarge.
When an Elliott wave triangle is considered, it is essential that alternates are also considered. Too many times an Elliott wave triangle may look to be completing only for the structure to be invalidated; the correction turns out to be something else, and the something else is almost always a combination.
Primary wave B may be a double combination: zigzag – X – flat. Intermediate wave (W) fits as a zigzag. Intermediate wave (Y) fits as a regular flat correction.
Within intermediate wave (Y), minor waves A and B both subdivide as threes. Minor wave B is a 1.02 length of minor wave A. For minor wave C to have room to complete its structure, the target calculated is for it to reach 1.618 the length of minor wave A.
The purpose of double combinations is to take up time and move price sideways. To achieve this purpose the second structure in the double usually ends about the same level as the first. The target for intermediate wave (Y) would see this purpose achieved.
ALTERNATE ELLIOTT WAVE COUNT
MONTHLY CHART
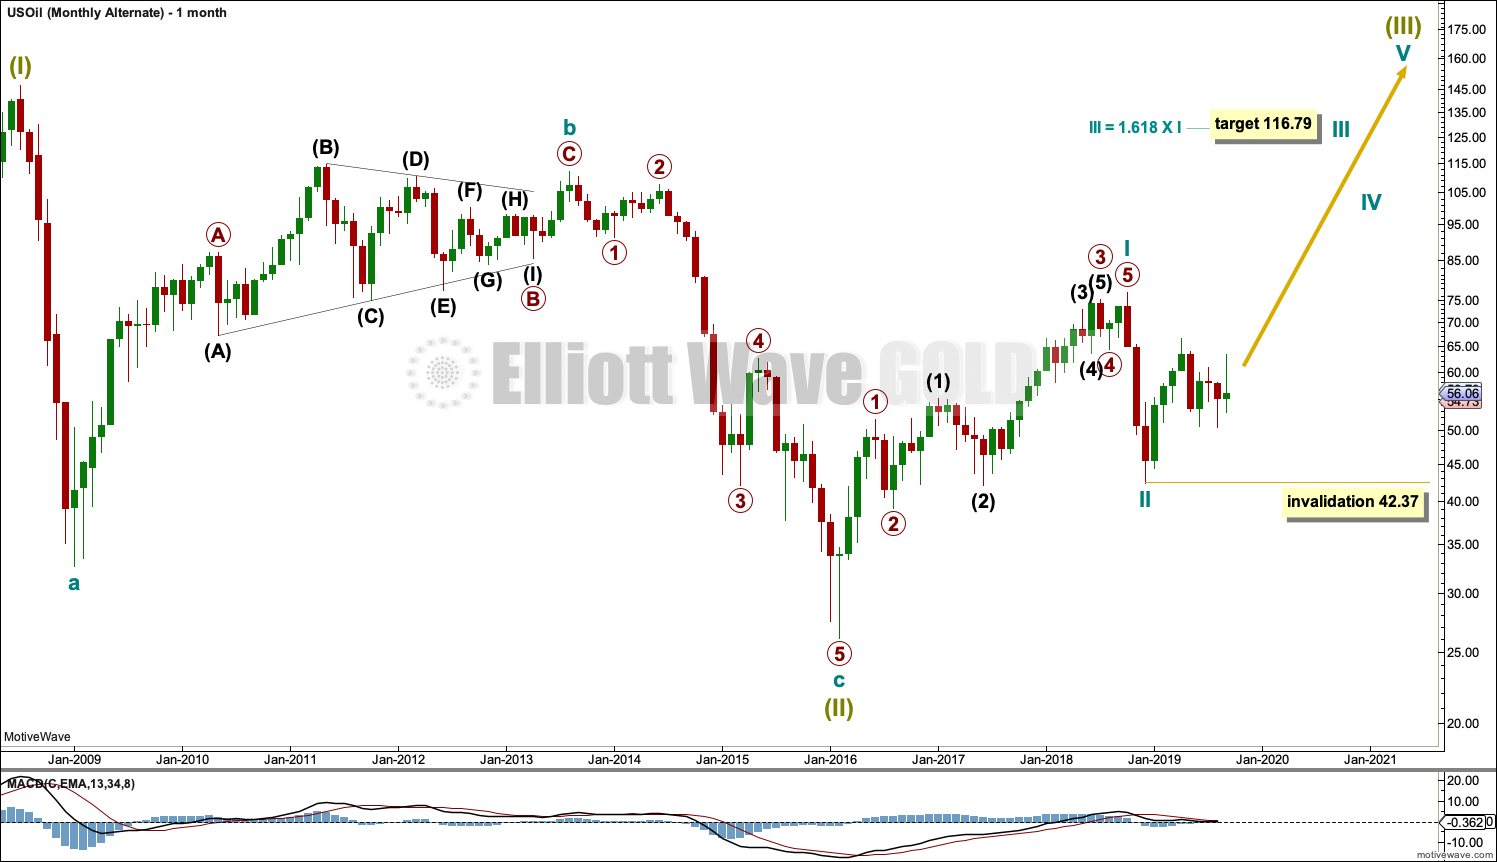
Click chart to enlarge.
It is possible that the bear market is over for Oil and a new bull market has begun.
For a bullish wave count for Oil, the upwards wave from the major low at 26.06 in February 2016 must be seen as a complete five wave impulse. This is labelled cycle wave I.
Cycle wave II may be a complete zigzag at 0.679 the depth of cycle wave I.
A target is calculated for cycle wave III to reach a common Fibonacci ratio to cycle wave I.
Within cycle wave III, no second wave correction may move beyond the start of its first wave below 42.37.
WEEKLY CHART
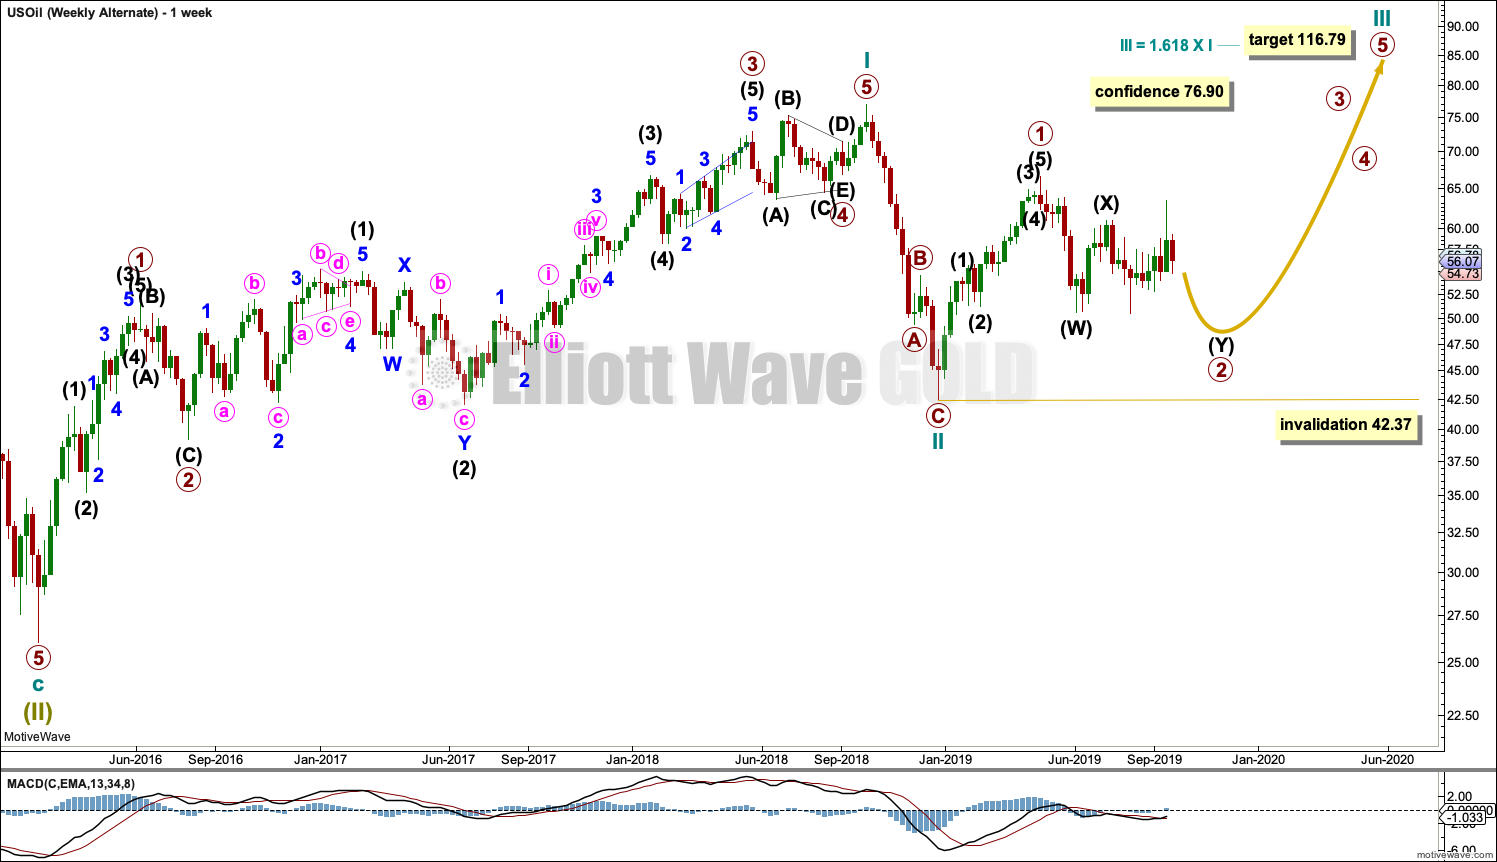
Click chart to enlarge.
This weekly chart shows detail of cycle wave I as a five wave impulse.
Cycle wave II does look best as a three. This is the only part of this wave count that has a better look than the main wave count, which sees this downwards wave as a five.
The upwards wave of primary wave 1 within cycle wave III must be seen as a five wave structure for a bullish wave count to work. This movement at lower time frames does not subdivide well at all as a five; this reduces the probability of this wave count.
Cycle wave III may only subdivide as an impulse. Within cycle wave III, so far primary wave 1 may be complete. Primary wave 2 may be moving lower as a double zigzag. Primary wave 2 may not move beyond the start of primary wave 1 below 42.37.
DAILY CHART
Click chart to enlarge.
Primary wave 2 may be continuing lower as a double combination.
The first structure in the double would be complete, a zigzag labelled intermediate wave (W). Within intermediate wave (W), minor wave C ends with a slight truncation for minute wave v. This is acceptable.
The double may be now joined by a complete three in the opposite direction, a zigzag labelled intermediate wave (X).
Intermediate wave (Y) may now be completing as an expanded flat correction. Within intermediate wave (Y), minor waves A and B both subdivide as threes, and minor wave B is a 1.24 length of minor wave A (this is within the most common range for B waves of flats from 1 to 1.38).
A target is calculated for minor wave C to exhibit the most common Fibonacci Ratio to minor wave A within an expanded flat.
Primary wave 2 may not move beyond the start of primary wave 1 below 42.37.
TECHNICAL ANALYSIS
MONTHLY CHART
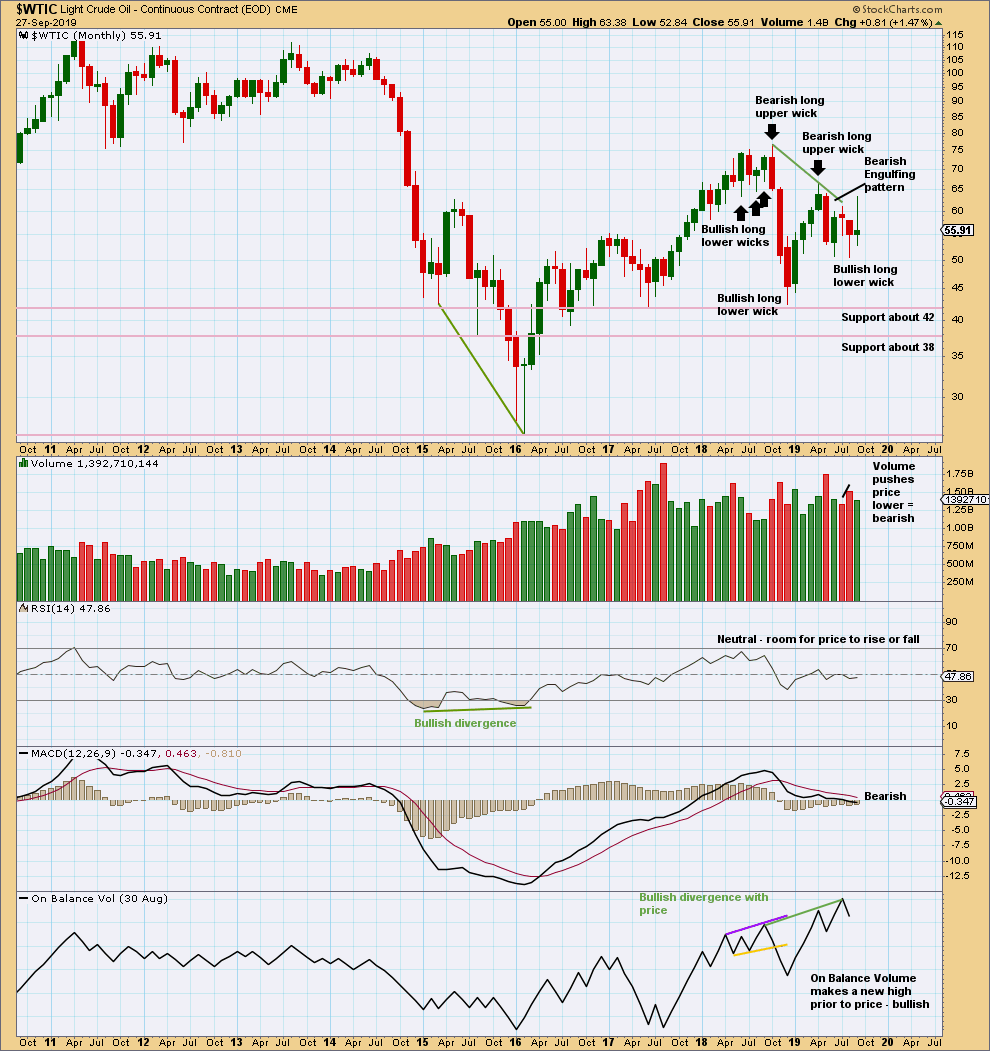
Click chart to enlarge. Chart courtesy of StockCharts.com.
August has closed with a long lower wick, which is bullish, but price has moved lower with push from volume, which is bearish.
Overall, August is judged to be more bearish than bullish.
There is now double bullish divergence between price and On Balance Volume. This supports the alternate Elliott wave count.
WEEKLY CHART
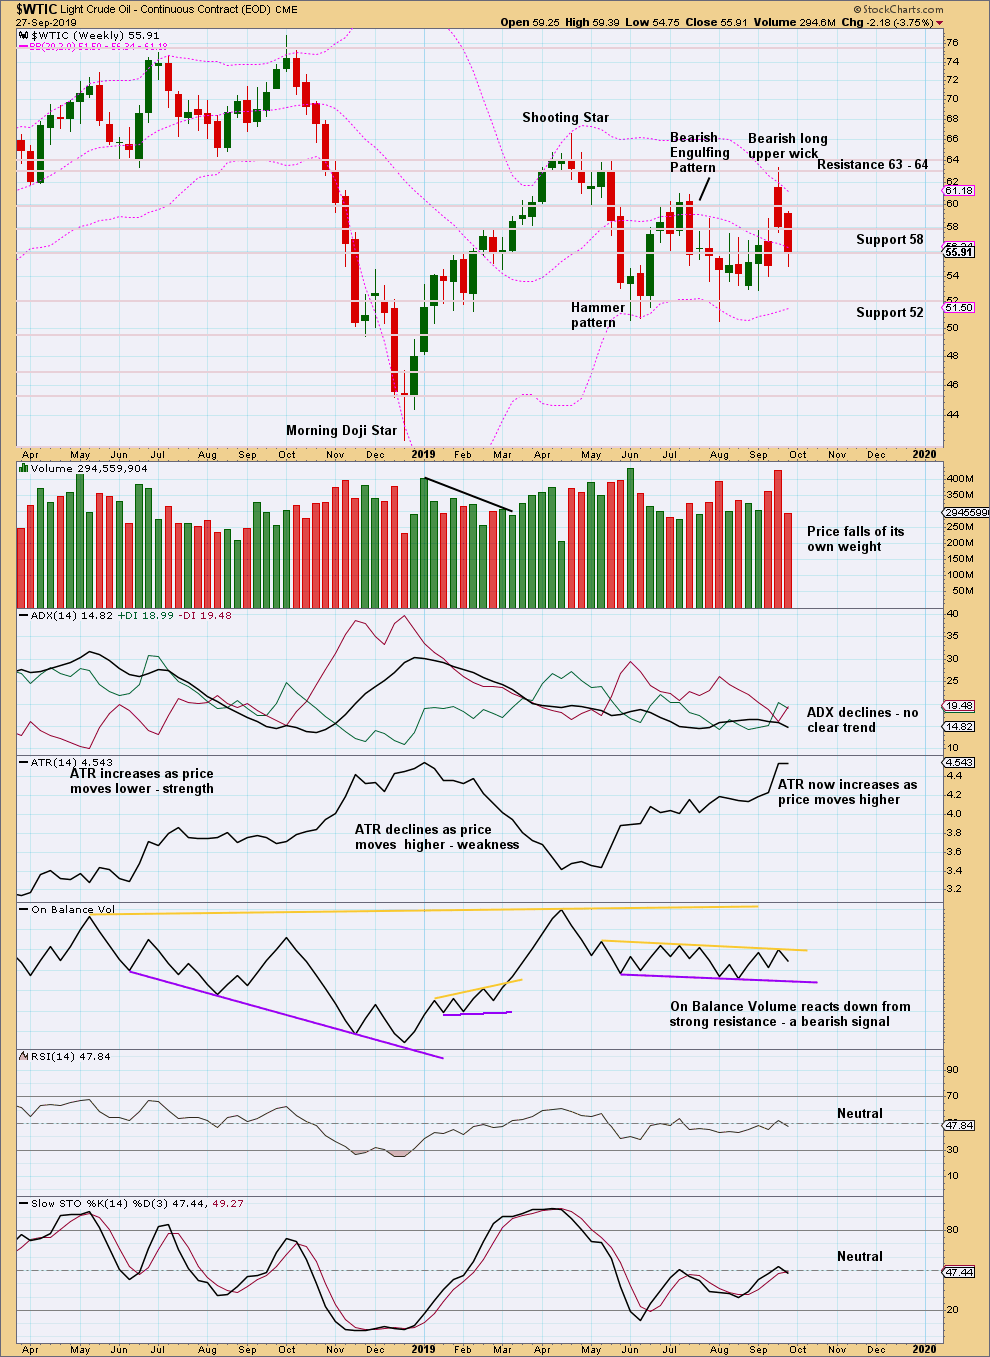
Click chart to enlarge. Chart courtesy of StockCharts.com.
Price is back within a consolidation zone with resistance about 64 and support about 50. On Balance Volume is also range bound. A breakout is required for confidence in a new trend.
DAILY CHART
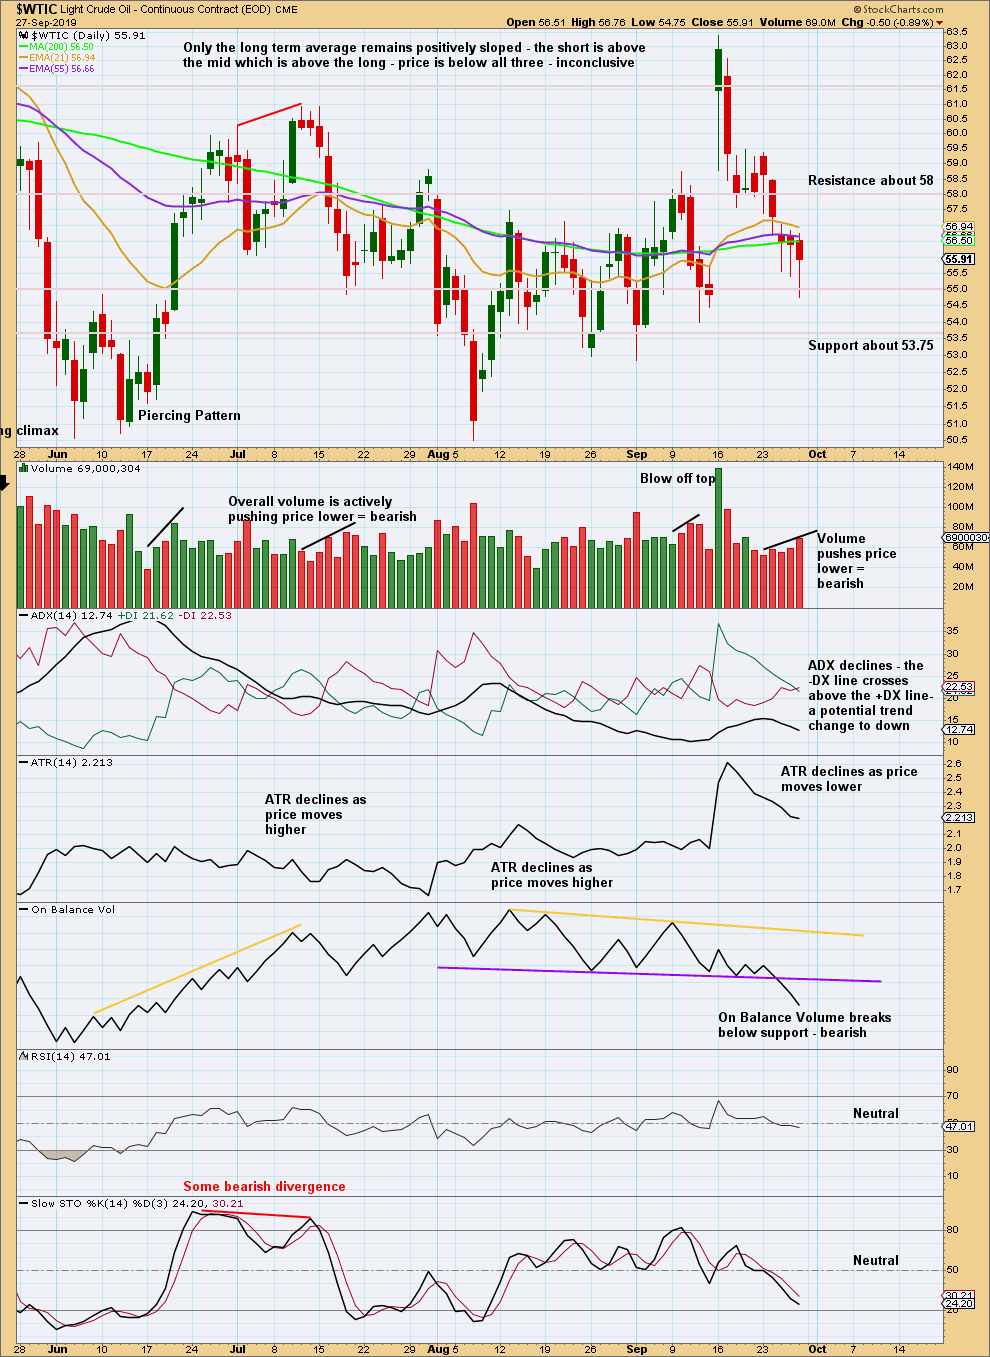
Click chart to enlarge. Chart courtesy of StockCharts.com.
For the short term, expect a downwards swing to continue to support about 50. When price reaches support and Stochastics reaches oversold, then the downwards swing may end.
—
Always practice good risk management as the most important aspect of trading. Always trade with stops and invest only 1-5% of equity on any one trade. Failure to manage risk is the most common mistake new traders make.
Re – US Oil
Updated first daily chart:
the triangle still looks good, it may be a barrier triangle
remember, the lower invalidation point at 50.53 is not absolute, this is the only EW rule which involves an area of subjectivity
price can move a little below 50.53 and this count can remain valid, as long as the B-D trend line looks essentially flat to the eye the triangle remains valid
this last daily candlestick has a long lower wick, this is a Hammer pattern, a bullish reversal pattern. I’ll now expect intermediate (E) to move up as a zigzag and fall short of the A-C trend line above.
Lara, Thanks or the update on USOIL. As always I appreciate your hard work.
Hey Mathieu Lapensee,
No problem expressing caution to me on my gold shorts. I understand and receive all comments as they are intended, to be helpful. So thanks for your thoughts. BTW, I just closed my golden shorts for a 1 penny profit! Gold is not acting the way I expected. But more importantly, the equity markets are getting creamed and that is not safe for shorting gold at the moment. I will live to fight another day and got away with enough to buy lunch. So lunch is on me today, boys and girls!
Have a good one.
No problem…. This market is very difficult to understand as there are many moving parts…
I also diminished my gold longs as I don’t know where it goes from here….
I put shorts on growth stocks that are overpriced…. given how weak the market is….
Hi Lara, re:oil
It looks like oil bearish daily ii has been invalidated. For Daily i, can a daily close be below the triangle support?
yes, for oil it looks like the triangle is valid and my alternate idea isn’t
for oil that lower (B)-(D) trend line needs to stay essentially flat, that lower invalidation point for the triangle at 50.53 can be breached by a little, that point is not absolute
a barrier triangle has wave D that ends about the same level as wave B, so that the B-D trend line looks essentially flat, in practice that means D can move slightly beyond B. this is the only EW rule which is not absolute, it involves a slight area of subjectivity
Hi Lara,
Thanks for the answer – but I was referring to the black line between B and D on the Daily chart, which is not flat at 50.53, but slopes up.
I assumed that line was meant to be a support for the triangle – am I reading it wrong?
Cheers,
Jiten
chart and comment above
Hi Lara,
Is there a minimum size of minute ii for gold?
it may already be over
there really is no minimum, and corrections within third waves (this one is within minor 3) can be surprisingly brief and shallow
but may also not yet have arrived, todays downwards movement could be just minute wave i within minor 3. so risk and the invalidation point must remain the same for the short term at 1,534.54.
Great, thanks.
Thanks Lara for your exceptional analysis and EW counts. It looks like a good low risk time to put on some golden shorts.
LOL
yes, golden shorts
Be careful with shorting Gold…. The US economy is slowing down dramatically with the US manufacturing data coming at the lowest since the 2009….
This bad data will probably force the Fed to come in and lower interest rates….
This is why there is a big turn around this morning.
I am long Gold stocks here…
Sorry for saying “Be careful”…. It is your own decision 🙂 …
My opinion is that we might have finished the zigzag correction for GDX.
Watch the DXY though – it’s possible it may go parabolic if it breaks up over 100. Bad for metals if it does