

S&P 500
At the end of this week, the AD line gives another signal that strongly supports the main Elliott wave count.
Summary: For the very short term, a little downwards movement to about 2,955 or 2,931 may begin on Monday. Thereafter, the upwards trend may resume. The next target is at 3,120.
Further confidence that a low is in place and price should make new all time highs very soon would come if either a 90% up day or two back to back 80% up days is seen.
A new low below 2,822.12 would add confidence to an alternate. Expect price at that stage to keep falling to 2,578 – 2,476 to find support at the lower edge of the large teal channel on weekly and daily charts.
The biggest picture, Grand Super Cycle analysis, is here.
Monthly charts were last published here. There are two further alternate monthly charts here.
ELLIOTT WAVE COUNTS
The two weekly Elliott wave counts below will be labelled First and Second. They may be about of even probability. When the fifth wave currently unfolding on weekly charts may be complete, then these two wave counts will diverge on the severity of the expected following bear market. To see an illustration of this future divergence monthly charts should be viewed.
FIRST WAVE COUNT
MAIN WEEKLY CHART
Click chart to enlarge.
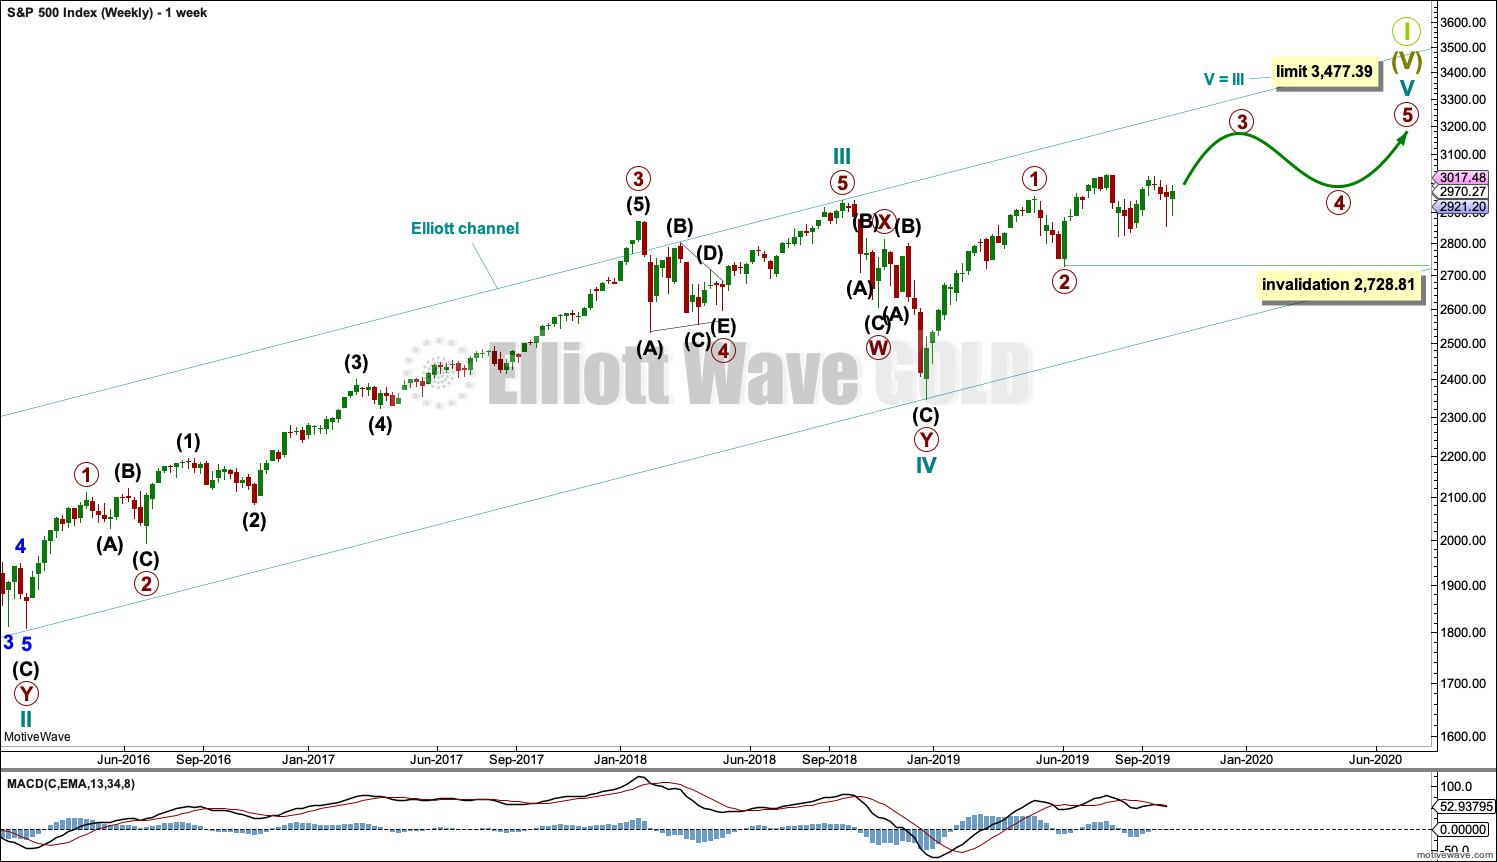
The basic Elliott wave structure consists of a five wave structure up followed by a three wave structure down (for a bull market). This wave count sees the bull market beginning in March 2009 as an incomplete five wave impulse and now within the last fifth wave, which is labelled cycle wave V. This impulse is best viewed on monthly charts. The weekly chart focusses on the end of it.
Elliott wave is fractal. This fifth wave labelled cycle wave V may end a larger fifth wave labelled Super Cycle wave (V), which may end a larger first wave labelled Grand Super Cycle wave I.
The teal Elliott channel is drawn using Elliott’s first technique about the impulse of Super Cycle wave (V). Draw the first trend line from the end of cycle wave I (off to the left of the chart, the weekly candlestick beginning 30th November 2014) to the end of cycle wave III, then place a parallel copy on the end of cycle wave II. This channel perfectly shows where cycle wave IV ended at support. The strongest portion of cycle wave III, the end of primary wave 3, overshoots the upper edge of the channel. This is a typical look for a third wave and suggests the channel is drawn correctly and the way the impulse is counted is correct.
Within Super Cycle wave (V), cycle wave III is shorter than cycle wave I. A core Elliott wave rule states that a third wave may never be the shortest. For this rule to be met in this instance, cycle wave V may not be longer in length than cycle wave III. This limit is at 3,477.39.
Cycle wave V may subdivide either as an impulse or an ending diagonal. Impulses are much more common. This main wave count expects that cycle wave V may be unfolding as an impulse.
The daily chart below will focus on movement from the end of primary wave 2.
In historic analysis, two further monthly charts have been published that do not have a limit to upwards movement and are more bullish than this wave count. Members are encouraged to consider those possibilities (links below summary) alongside the wave counts presented on a daily and weekly basis.
Within cycle wave V, primary waves 1 and 2 may be complete. Within primary wave 3, no second wave correction may move beyond its start below 2,728.81.
MAIN DAILY CHART
Click chart to enlarge.
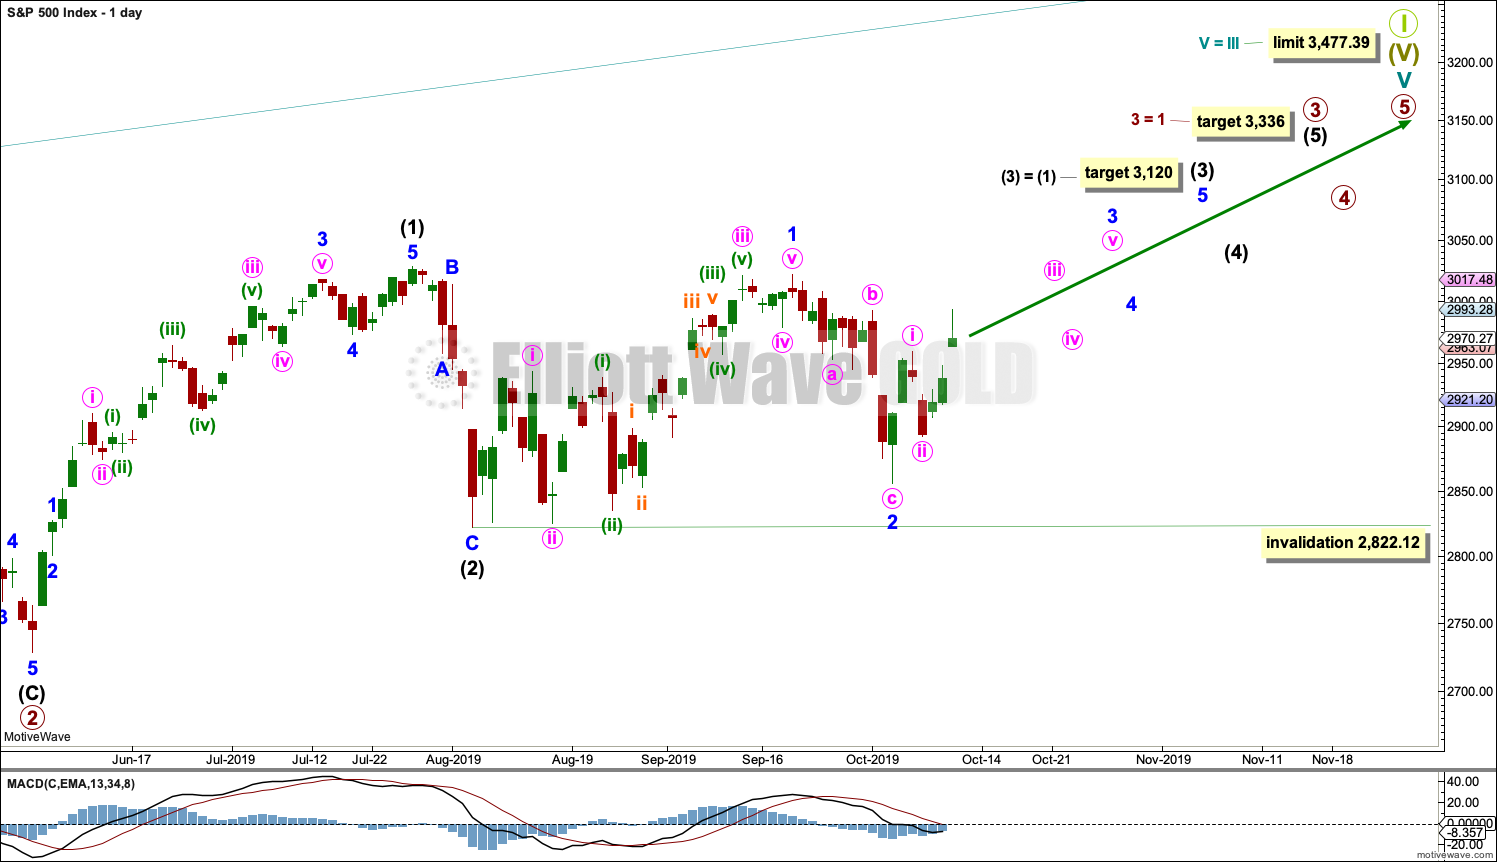
Primary wave 3 may have begun.
All of primary wave 3, intermediate wave (3) and minor wave 3 may only subdivide as impulses. Within each impulse, its second wave correction may not move beyond the start of its first wave.
Minor wave 2 may not move beyond the start of minor wave 1 below 2,822.12.
Intermediate wave (3) must move far enough above the end of intermediate wave (1) to then allow intermediate wave (4) to unfold and remain above intermediate wave (1) price territory.
ALTERNATE WEEKLY CHART
Click chart to enlarge.
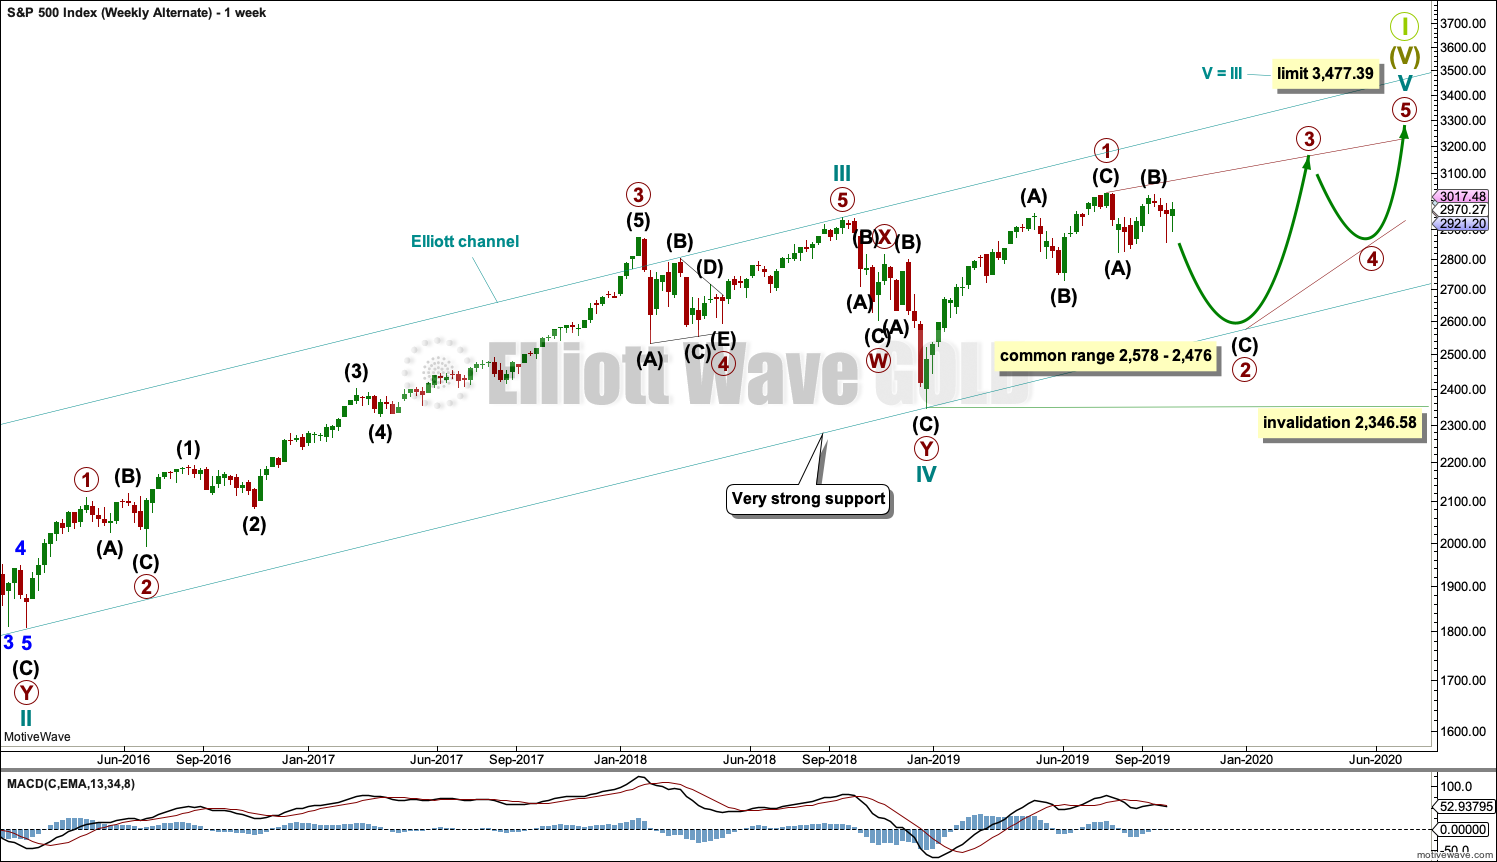
Cycle wave V may be subdividing as an ending diagonal. Within ending diagonals, all sub-waves must subdivide as zigzags. Primary wave 1 may be over at the last all time high as a zigzag.
Primary wave 2 must complete lower as a zigzag.
The second and fourth waves within diagonals are usually very deep, commonly between 0.81 to 0.66 the depth of the prior wave. This gives a target zone for primary wave 2.
Primary wave 2 may end if it comes down to find support at the lower edge of the teal channel, which is copied over from monthly and weekly charts. This trend line should provide final support for a deeper pullback.
Primary wave 2 may not move beyond the start of primary wave 1 below 2,346.58.
SECOND WAVE COUNT
WEEKLY CHART
Click chart to enlarge.
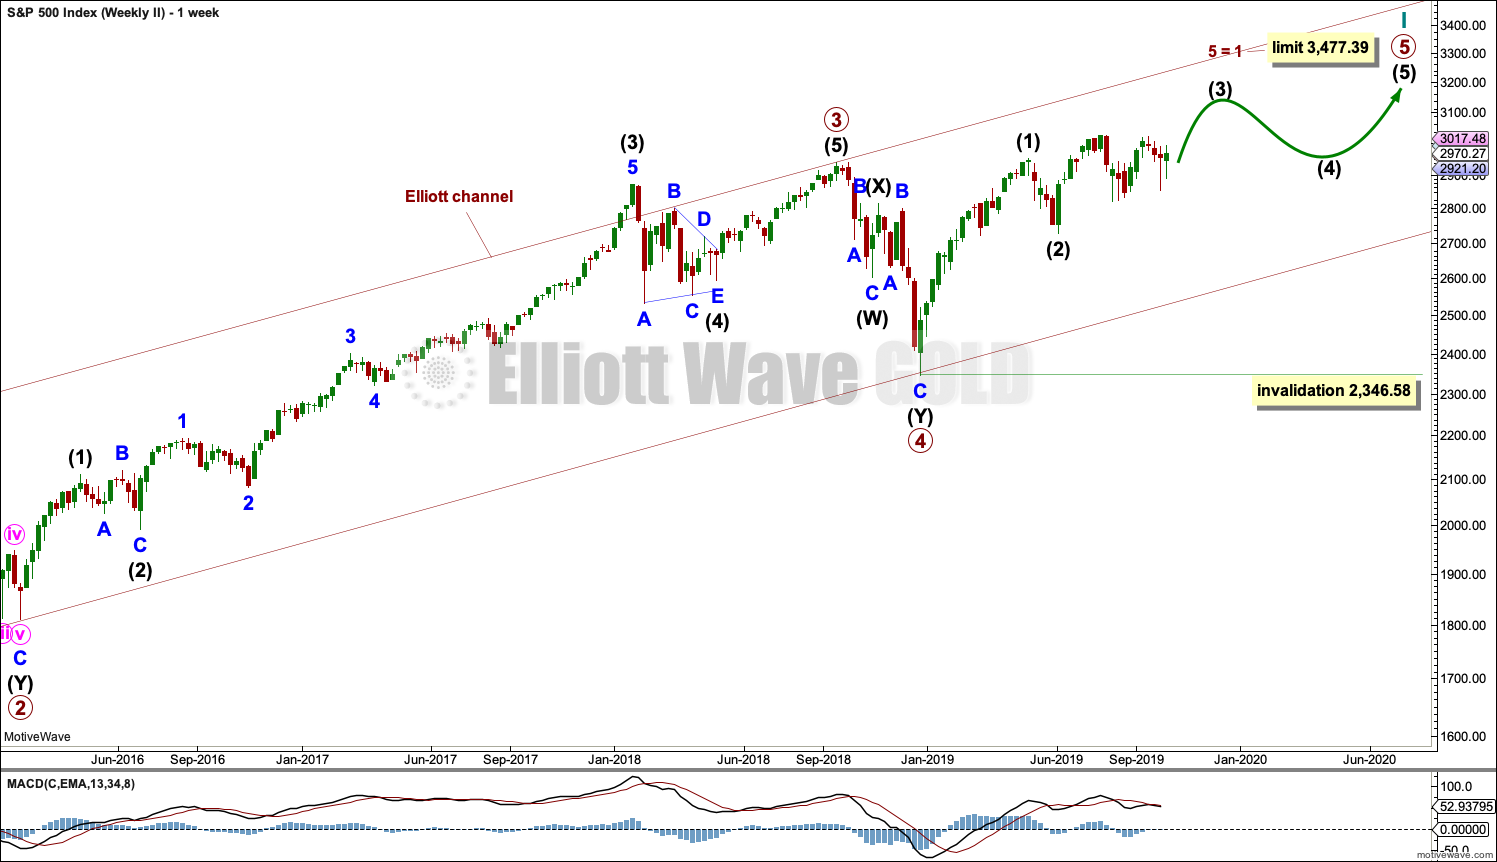
This weekly chart is almost identical to the first weekly chart, with the sole exception being the degree of labelling.
This weekly chart moves the degree of labelling for the impulse beginning in March 2009 all down one degree. This difference is best viewed on monthly charts.
The impulse is still viewed as nearing an end; a fifth wave is still seen as needing to complete higher. This wave count labels it primary wave 5.
Primary wave 5 may be subdividing as either an impulse or ending diagonal, in the same way that cycle wave V is seen for the first weekly chart.
TECHNICAL ANALYSIS
WEEKLY CHART
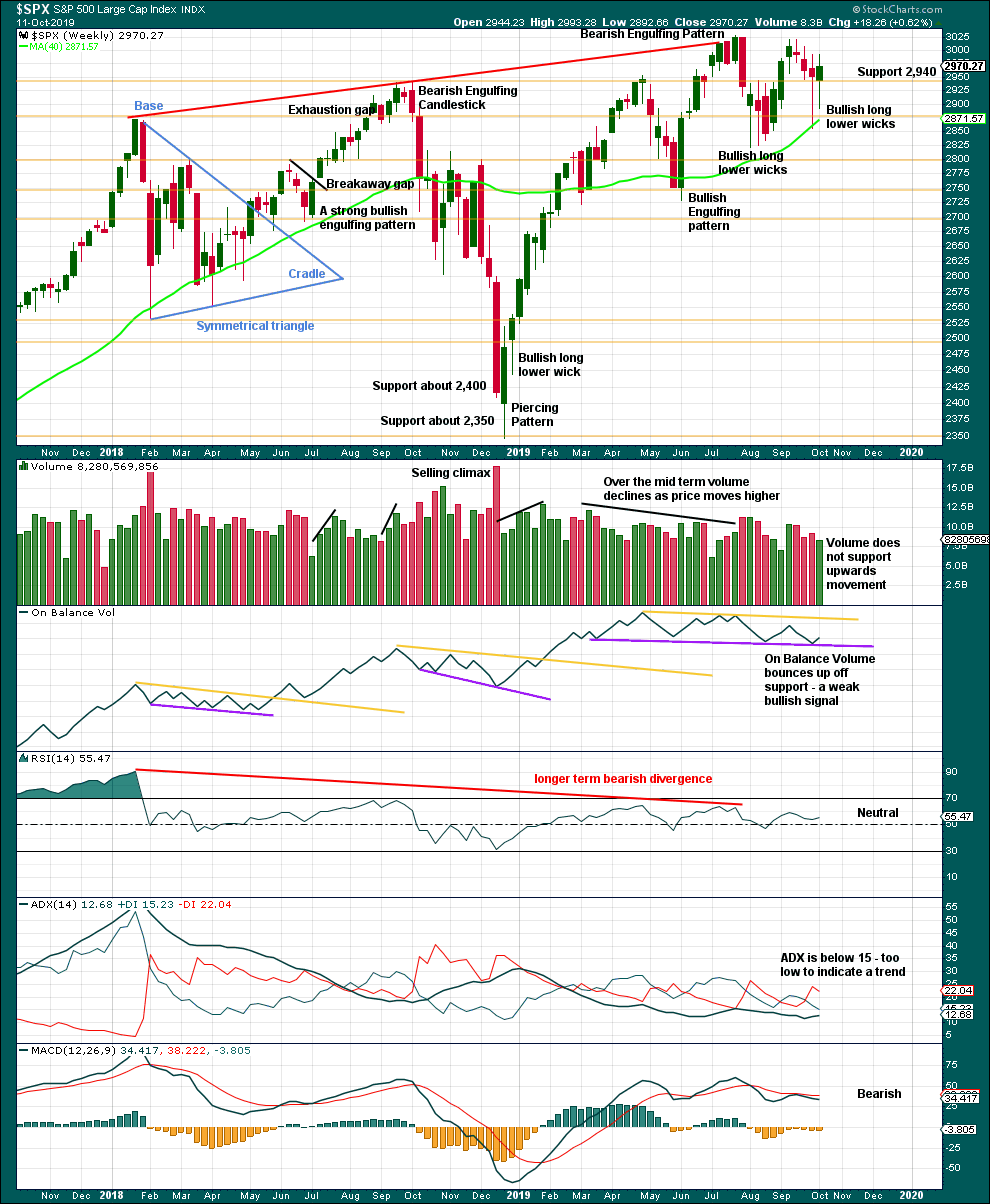
Click chart to enlarge. Chart courtesy of StockCharts.com.
Two long lower wicks now suggest more upwards movement ahead. A decline in volume with upwards movement is not of a concern in current market conditions.
DAILY CHART
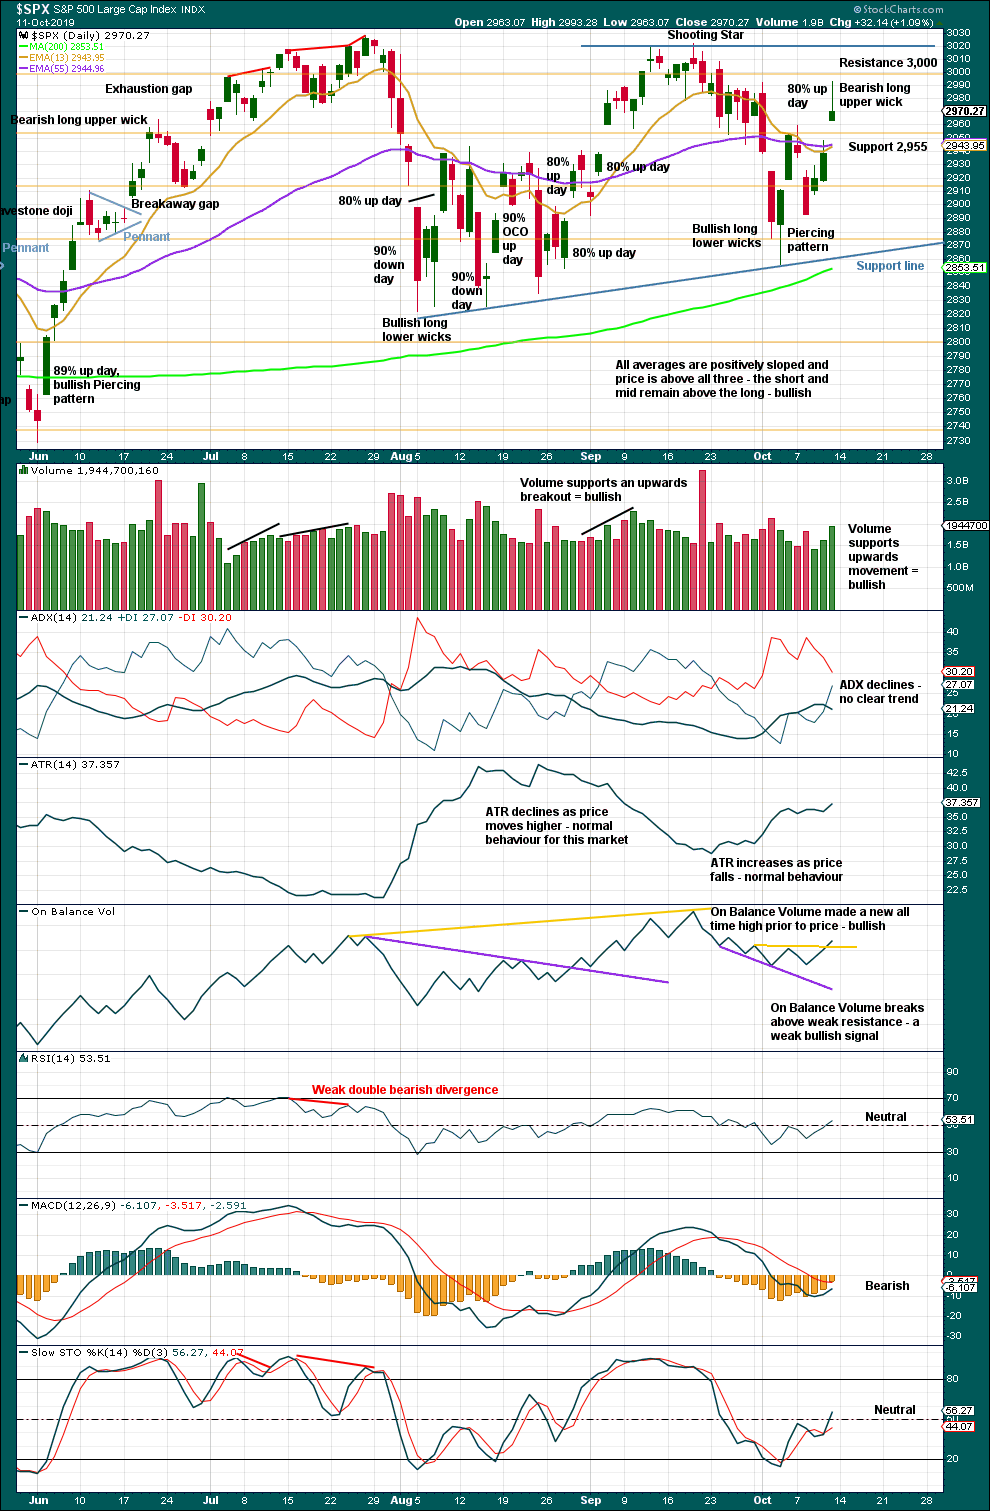
Click chart to enlarge. Chart courtesy of StockCharts.com.
There is now a series of higher highs and higher lows since the 5th of August. Strength in 90% up days and back to back 80% up days off lows indicate the lows may still be sustainable.
Friday was an 80% upwards day. If Monday shows strength in an 80% or 90% upwards day, then substantial confidence that another small swing low is in may be had.
While Friday shows internal strength, the long upper wick suggests some downwards movement on Monday for another very short-term pullback.
BREADTH – AD LINE
WEEKLY CHART
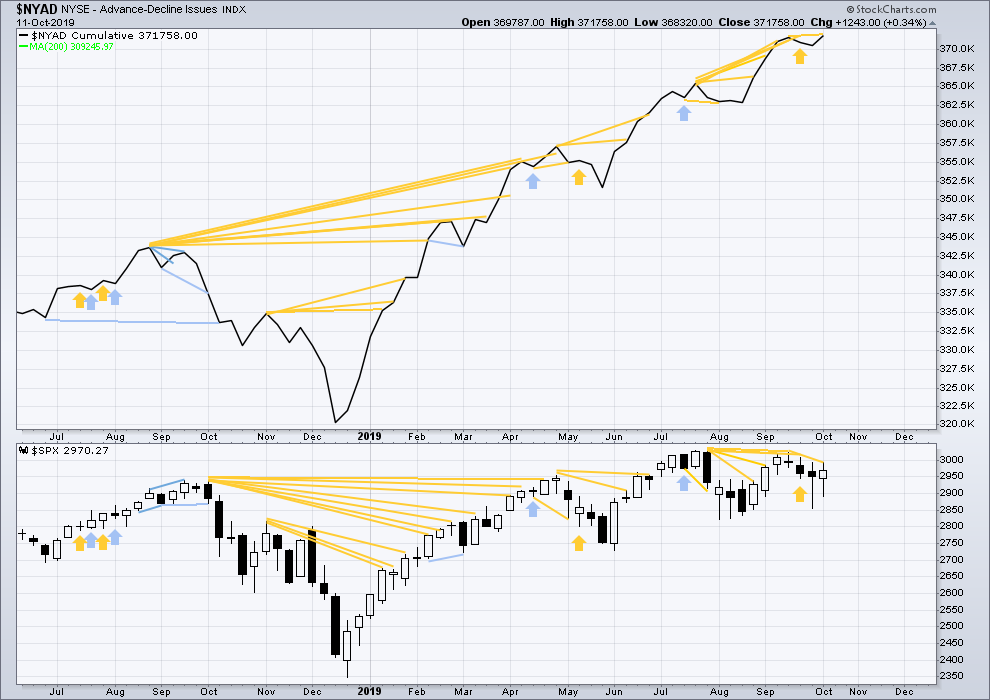
Click chart to enlarge. Chart courtesy of StockCharts.com. So that colour blind members are included, bearish signals
will be noted with blue and bullish signals with yellow.
Bear markets from the Great Depression and onwards have been preceded by an average minimum of 4 months divergence between price and the AD line with only two exceptions in 1946 and 1976. With the AD line making new all time highs again this week, the end of this bull market and the start of a new bear market is very likely a minimum of 4 months away, which is mid February 2020.
In all bear markets in the last 90 years there is some positive correlation (0.6022) between the length of bearish divergence and the depth of the following bear market. No to little divergence is correlated with more shallow bear markets. Longer divergence is correlated with deeper bear markets.
If a bear market does develop here, it comes after no bearish divergence. It would therefore more likely be shallow.
Small caps have made a new swing high above the prior high of the end of July, but mid and large caps have not yet done so. The last upwards movement appears to be led by small caps. Because small caps are usually the first to exhibit deterioration in the later stages of a bull market, some strength in small caps at this stage indicates a healthy bull market with further to run.
This week the AD line makes another new all time high. This divergence is bullish and strongly supports the main Elliott wave count.
DAILY CHART
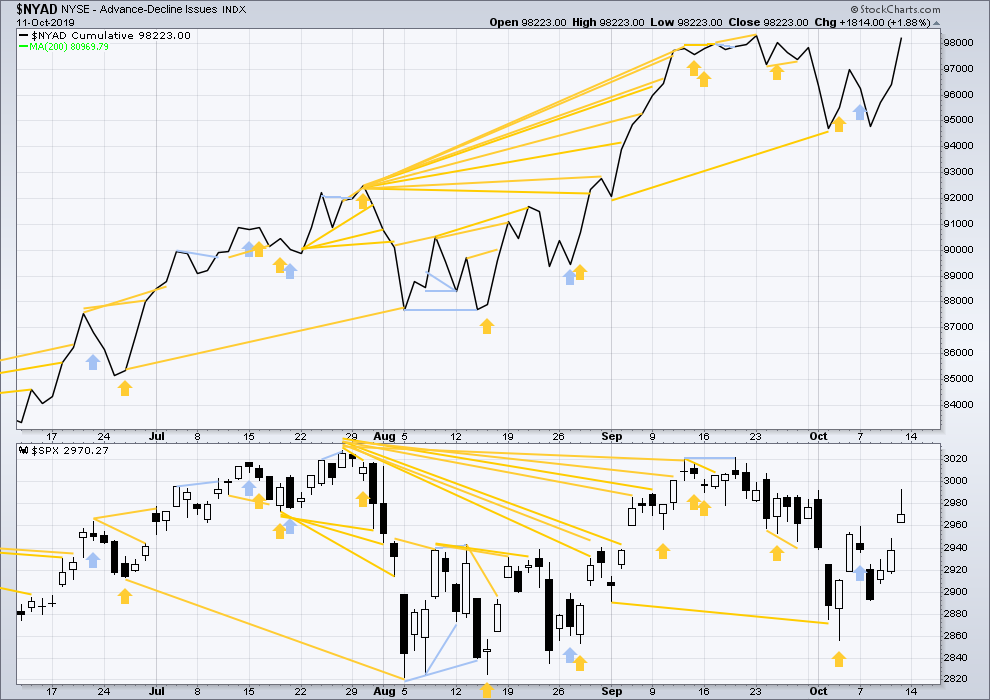
Click chart to enlarge. Chart courtesy of StockCharts.com. So that colour blind members are included, bearish signals
will be noted with blue and bullish signals with yellow.
Breadth should be read as a leading indicator.
On Friday both the AD line and price have moved higher. Neither have made new short-term swing highs. However, while price is a reasonable distance off its last swing high on the 19th of September, the AD line is not. Breadth is still rising faster than price; this is bullish.
VOLATILITY – INVERTED VIX CHART
WEEKLY CHART
Click chart to enlarge. Chart courtesy of StockCharts.com. So that colour blind members are included, bearish signals
will be noted with blue and bullish signals with yellow.
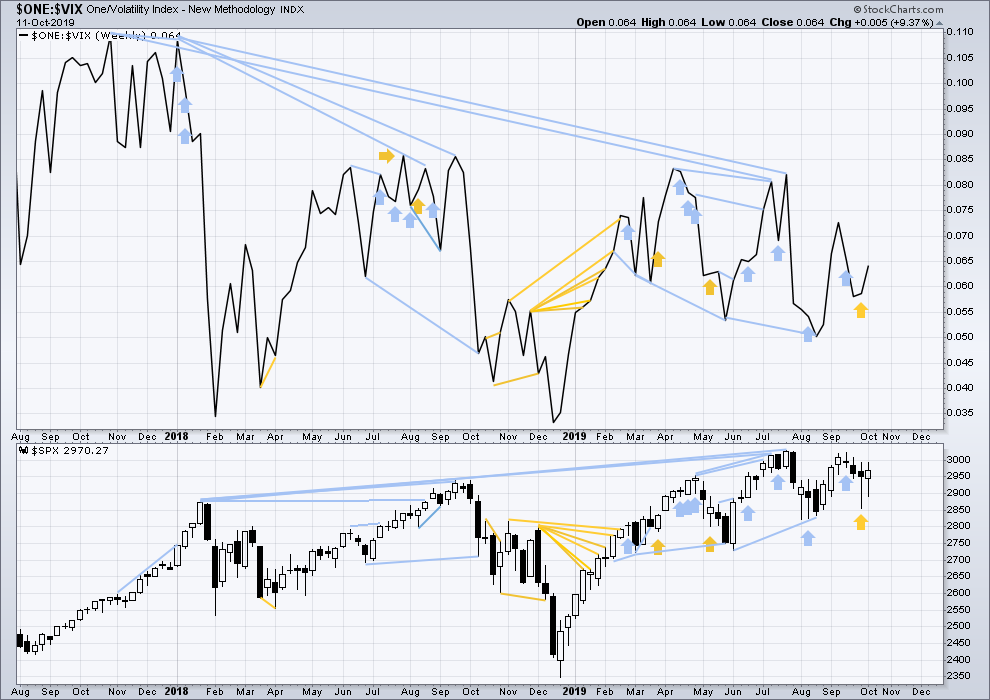
The all time high for inverted VIX (which is the same as the low for VIX) was on 30th October 2017. There is now nearly two years of bearish divergence between price and inverted VIX.
The rise in price is not coming with a normal corresponding decline in VIX; VIX remains elevated. This long-term divergence is bearish and may yet develop further as the bull market matures.
This divergence may be an early warning, a part of the process of a top developing that may take years. It may not be useful in timing a trend change.
This week both price and inverted VIX have moved higher. Neither have made new short-term swing highs. There is no new divergence.
DAILY CHART
Click chart to enlarge. Chart courtesy of StockCharts.com. So that colour blind members are included, bearish signals
will be noted with blue and bullish signals with yellow.
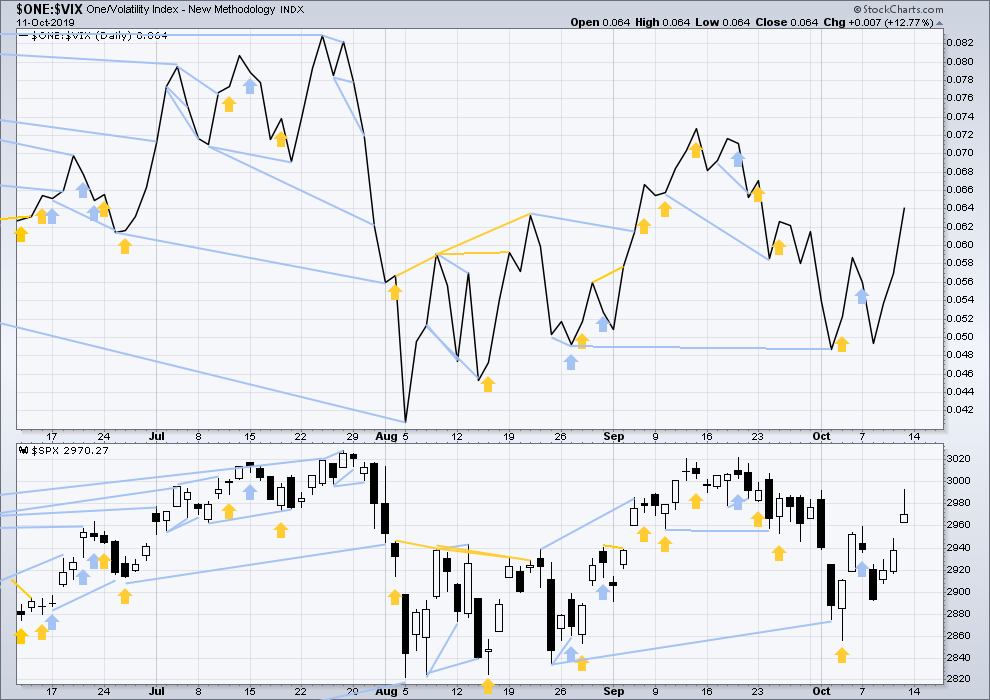
On Friday both price and inverted VIX have moved higher. There is no new short-term divergence.
DOW THEORY
Dow Theory confirmed a bear market in December 2018. This does not necessarily mean a bear market at Grand Super Cycle degree though; Dow Theory makes no comment on Elliott wave counts. On the 25th of August 2015 Dow Theory also confirmed a bear market. The Elliott wave count sees that as part of cycle wave II. After Dow Theory confirmation of a bear market in August 2015, price went on to make new all time highs and the bull market continued.
DJIA: 23,344.52 – a close on the 19th of December at 23,284.97 confirms a bear market.
DJT: 9,806.79 – price has closed below this point on the 13th of December.
S&P500: 2,532.69 – a close on the 19th of December at 2,506.96 provides support to a bear market conclusion.
Nasdaq: 6,630.67 – a close on the 19th of December at 6,618.86 provides support to a bear market conclusion.
With all the indices having moved higher following a Dow Theory bear market confirmation, Dow Theory would confirm a bull market if the following highs are made:
DJIA: 26,951.81 – a close above this point has been made on the 3rd of July 2019.
DJT: 11,623.58 – to date DJT has failed to confirm an ongoing bull market.
S&P500: 2,940.91 – a close above this point was made on the 29th of April 2019.
Nasdaq: 8,133.30 – a close above this point was made on the 26th of April 2019.
GOLD
Again, downwards movement fits the main Elliott wave count best. Also, at the end of the week, volume supports the main Elliott wave count.
All three Elliott wave counts remain valid
Summary: A new low below 1,456.64 would provide confidence that the downward trend has resumed. The short-term target may be at 1,420. The main Elliott wave count still expects downwards movement next week.
A new high above 1,534.62 would add confidence to a more bullish outlook at least for the short term. The target would then be at 1,572, 1,652 or 1,693.
For the bigger picture, the bearish Elliott wave count expects a new downwards trend to last one to several years has begun already, or may begin after one more high. Confidence in this view may be had if price makes a new low by any amount at any time frame below 1,346.45.
The bullish Elliott wave count expects a primary degree fourth wave has completed and the upwards trend has resumed.
Grand SuperCycle analysis is here.
Monthly charts were last published here with video here.
BEARISH ELLIOTT WAVE COUNT
WEEKLY CHART
Click chart to enlarge.
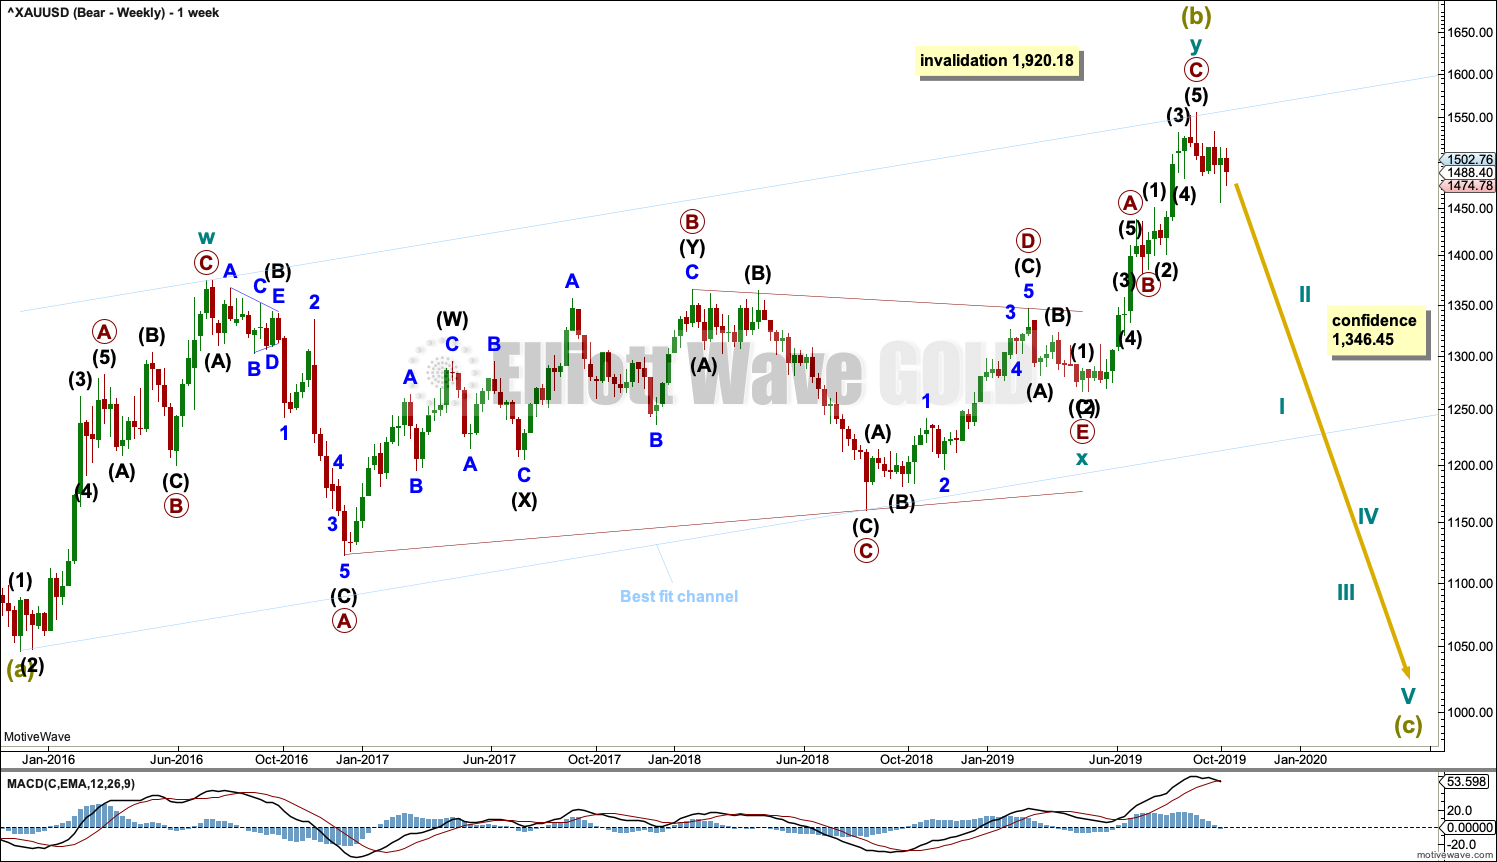
It is possible that Super Cycle wave (b) is complete as a double zigzag.
The first zigzag in the double is labelled cycle wave w. The double is joined by a three in the opposite direction, a triangle labelled cycle wave x. The second zigzag in the double is labelled cycle wave y.
The purpose of the second zigzag in a double is to deepen the correction. Cycle wave y has achieved this purpose.
A new low below 1,346.45 would add strong confidence to this wave count. At that stage, the bullish Elliott wave count would be invalidated.
A wide best fit channel is added in light blue. This channel contains all of Super Cycle wave (b) and may provide resistance and support. Copy this channel over to daily charts.
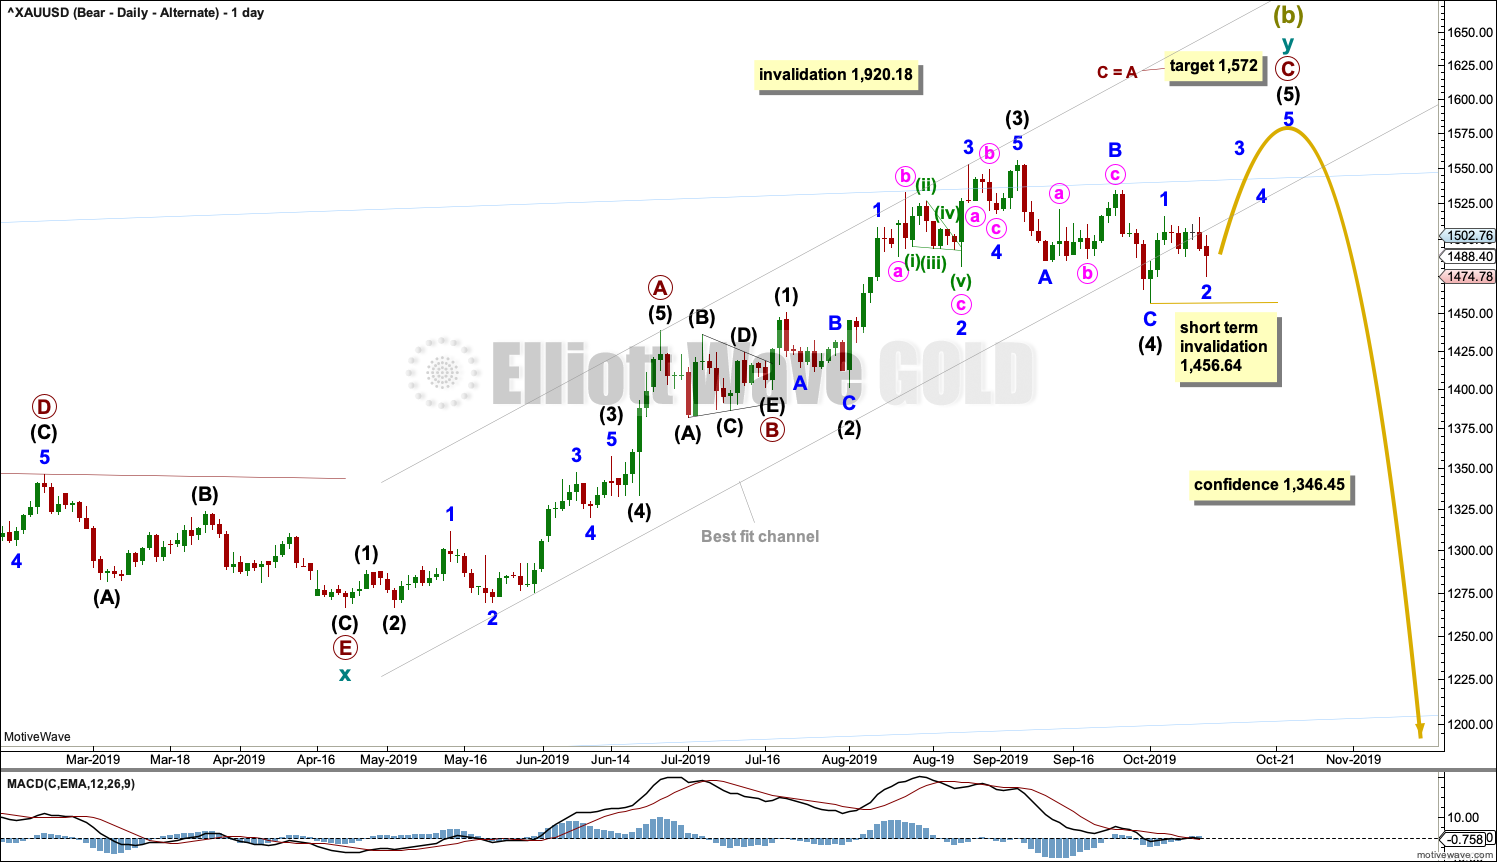
DAILY CHART
Click chart to enlarge.
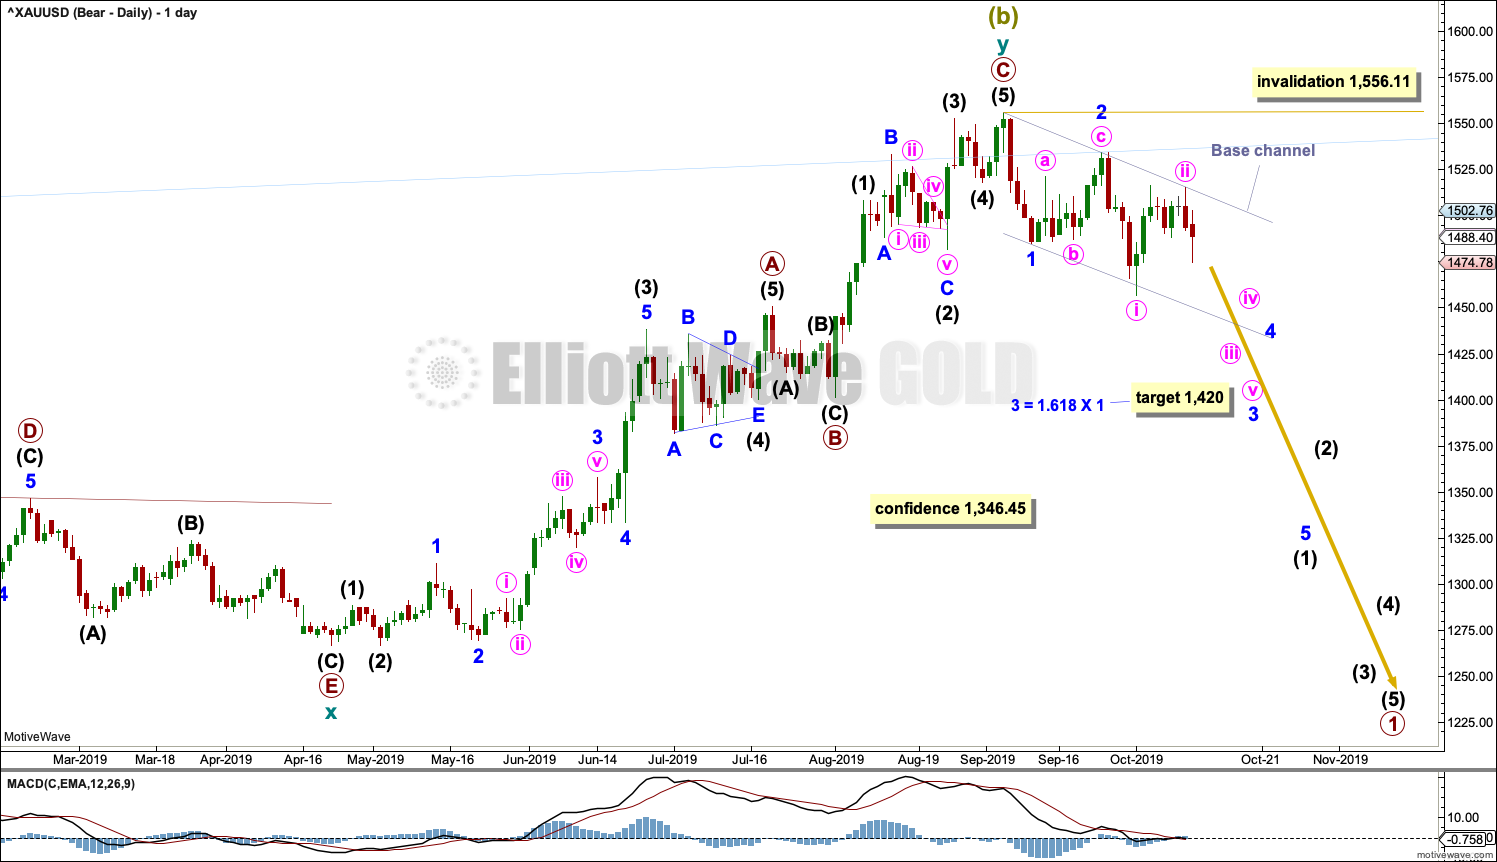
Cycle wave y may be a complete zigzag. Within both of primary waves A and C, there is good proportion between intermediate waves (2) and (4). Within both of primary waves A and C, there is good alternation in structure of intermediate waves (2) and (4).
Within cycle wave y, there is no Fibonacci Ratio between primary waves A and C.
Draw a base channel on daily charts about minor waves 1 and 2. Draw the first trend line from the start of minor wave 1 to the end of minor wave 2, then place a parallel copy on the end of minor wave 1. The upper edge of this channel is where price has found resistance this week. Along the way down, minor wave 3 should exhibit enough power to break below support at the lower edge of the base channel.
Gold usually fits within base channels at the start of new movements but not always. Occasionally second wave corrections can be deep and time consuming and can breach base channels.
ALTERNATE DAILY CHART
Click chart to enlarge.
This wave count exactly follows the expected pathway for Silver. If your own analysis suggests these markets should move together (although the correlation co-efficient shows they do not always do so), then this may be your preferred Elliott wave count.
It is possible that the double zigzag for Super Cycle wave (b) may be incomplete and may yet require one more high. A target is calculated for primary wave C to reach the most common Fibonacci Ratio of equality in length with primary wave A.
Within primary wave C, intermediate wave (3) fits very well as an impulse: There is no overlap between minor waves 4 and 2; minor wave 3 is not the shortest actionary wave; minor wave 5 is not truncated; and minor wave 4 exhibits alternation with minor wave 2 as an expanded flat and minor wave 4 as a zigzag. Minor wave 3 is 4.47 longer than 0.618 the length of minor wave 1, and minor wave 5 is 2.83 short of 0.382 the length of minor wave 1. Minor wave 4 is more brief than minor wave 2, which is normal for this market.
Intermediate wave (4) is longer in duration than intermediate wave (2), but the difference is reasonable enough to be acceptable.
Within intermediate wave (5), no second wave correction may move beyond the start of its first wave below 1,456.64.
BULLISH ELLIOTT WAVE COUNT
WEEKLY CHART
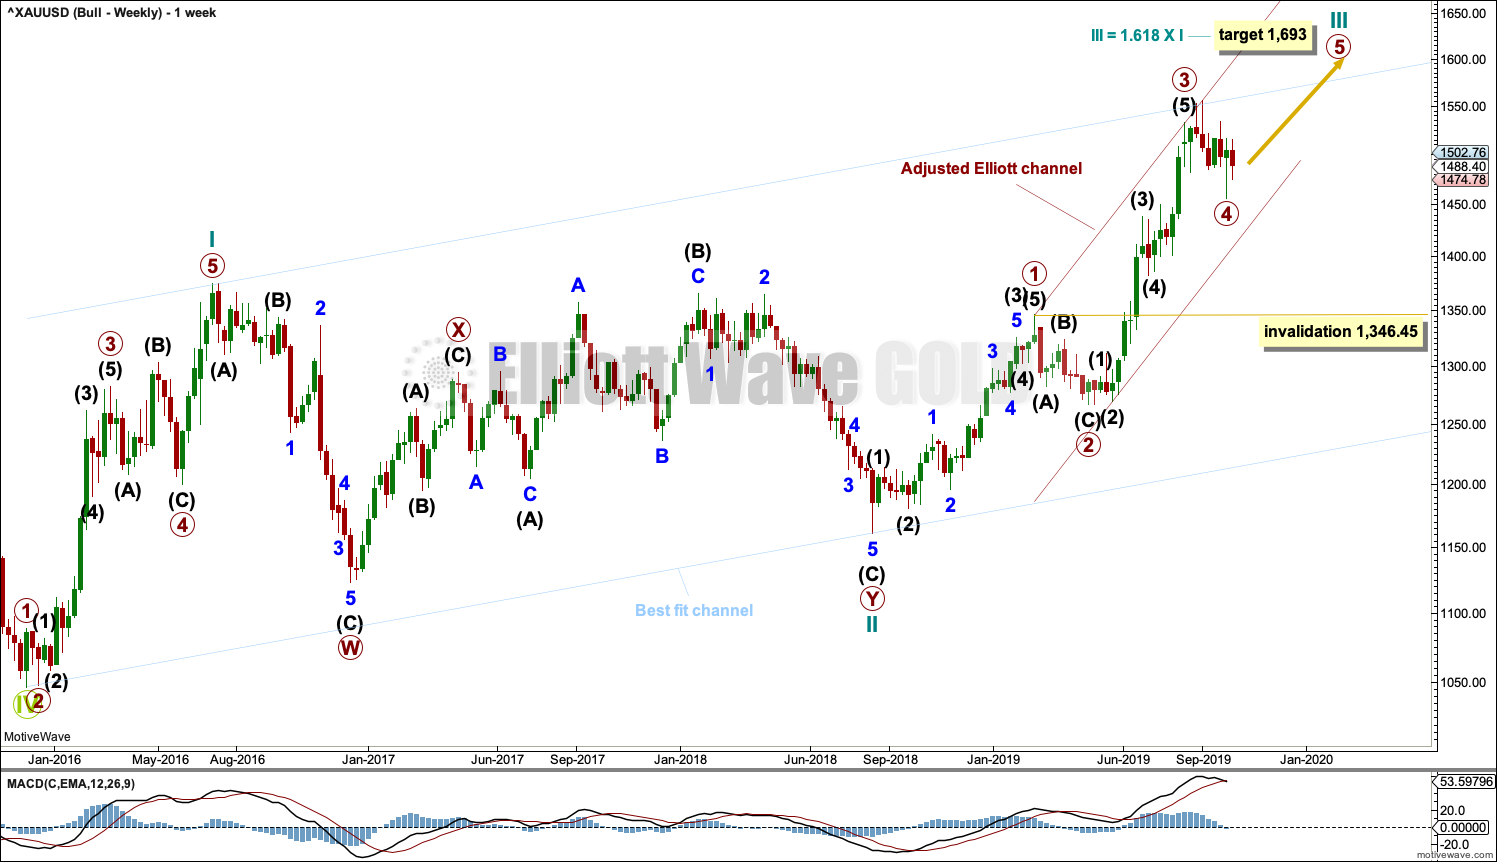
Click chart to enlarge.
This wave count sees the the bear market complete at the last major low for Gold in November 2015.
If Gold is in a new bull market, then it should begin with a five wave structure upwards on the weekly chart. However, the biggest problem with this wave count is the structure labelled cycle wave I because this wave count must see it as a five wave structure, but it looks more like a three wave structure.
Commodities often exhibit swift strong fifth waves that force the fourth wave corrections coming just prior and just after to be more brief and shallow than their counterpart second waves. It is unusual for a commodity to exhibit a quick second wave and a more time consuming fourth wave, and this is how cycle wave I is labelled. This wave count still suffers from this very substantial problem, and for this reason the bearish wave count is still considered because it has a better fit in terms of Elliott wave structure.
Cycle wave II subdivides well as a double combination: zigzag – X – expanded flat.
Cycle wave III may have begun. Within cycle wave III, primary waves 1 and 2 may now be complete. Primary wave 3 has now moved above the end of primary wave 1 meeting a core Elliott wave rule. It has now moved far enough to allow room for primary wave 4 to unfold and remain above primary wave 1 price territory. Primary wave 4 may not move into primary wave 1 price territory below 1,346.45.
Cycle wave III so far for this wave count would have been underway now for 60 weeks. It is beginning to exhibit some support from volume and increasing ATR. This wave count now has some support from classic technical analysis.
The channel drawn about cycle wave III is an adjusted Elliott channel. The lower edge is pulled lower.
Add the wide best fit channel to weekly and daily charts.
DAILY CHART

Click chart to enlarge.
Primary wave 4 is labelled as possibly complete. The structure still fits as a flat correction, but it may be complete as a regular flat. Within the flat, intermediate wave (B) may fit as a double combination: flat – X – zigzag. Intermediate wave (C) has moved below the end of intermediate wave (A) avoiding a truncation and a very rare running flat.
Primary wave 2 lasted 43 sessions. Primary wave 4 may have been over in 35 sessions, one longer than a Fibonacci 34.
It is also possible that primary wave 4 may be incomplete and may continue lower. Primary wave 4 may not move into primary wave 1 price territory below 1,346.45.
TECHNICAL ANALYSIS
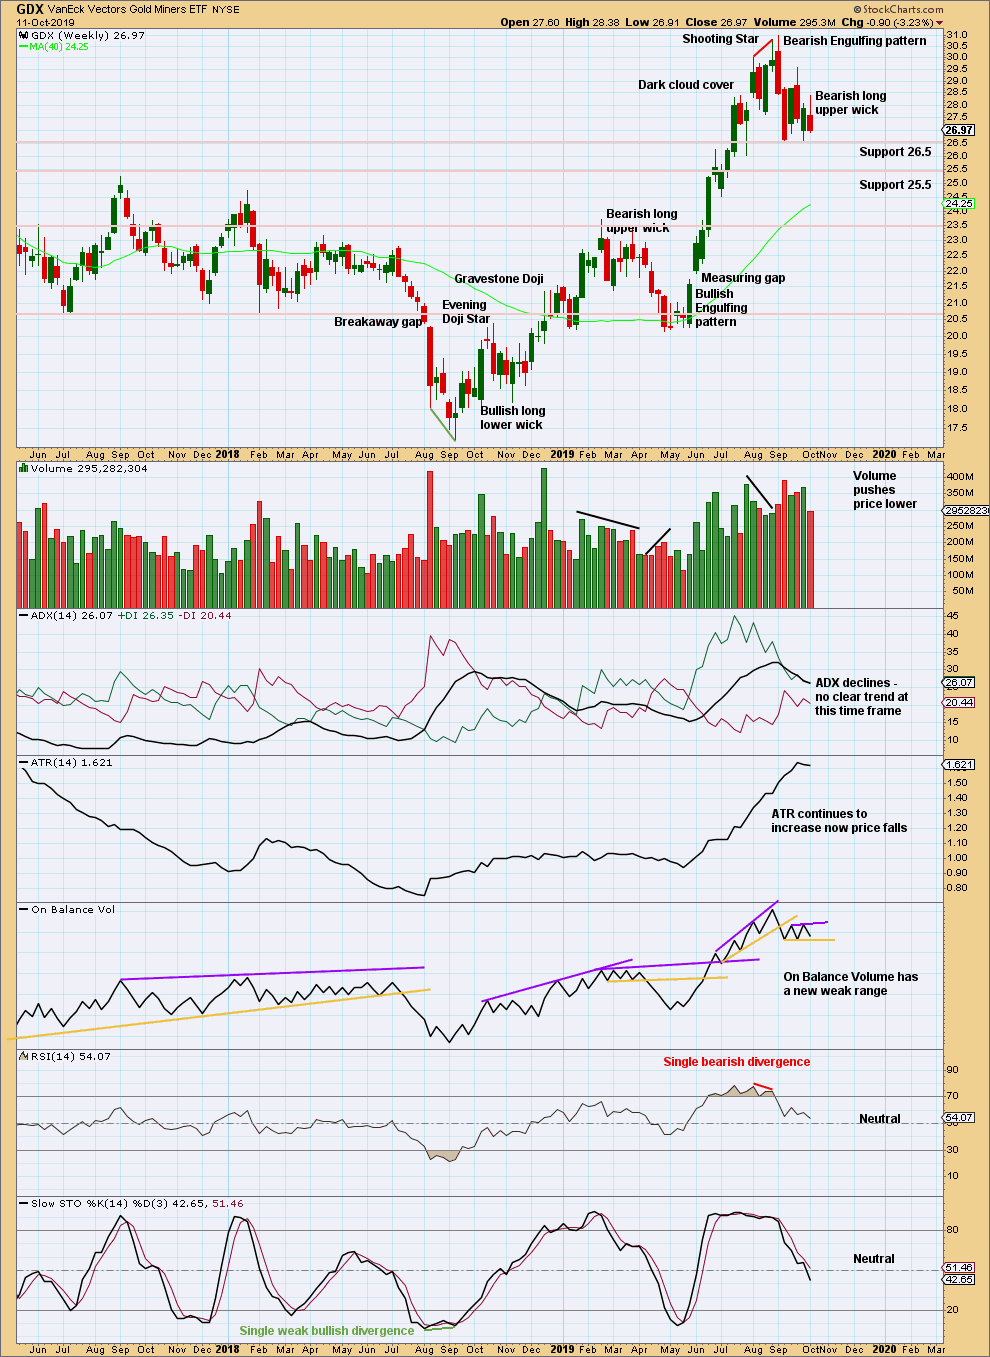
WEEKLY CHART
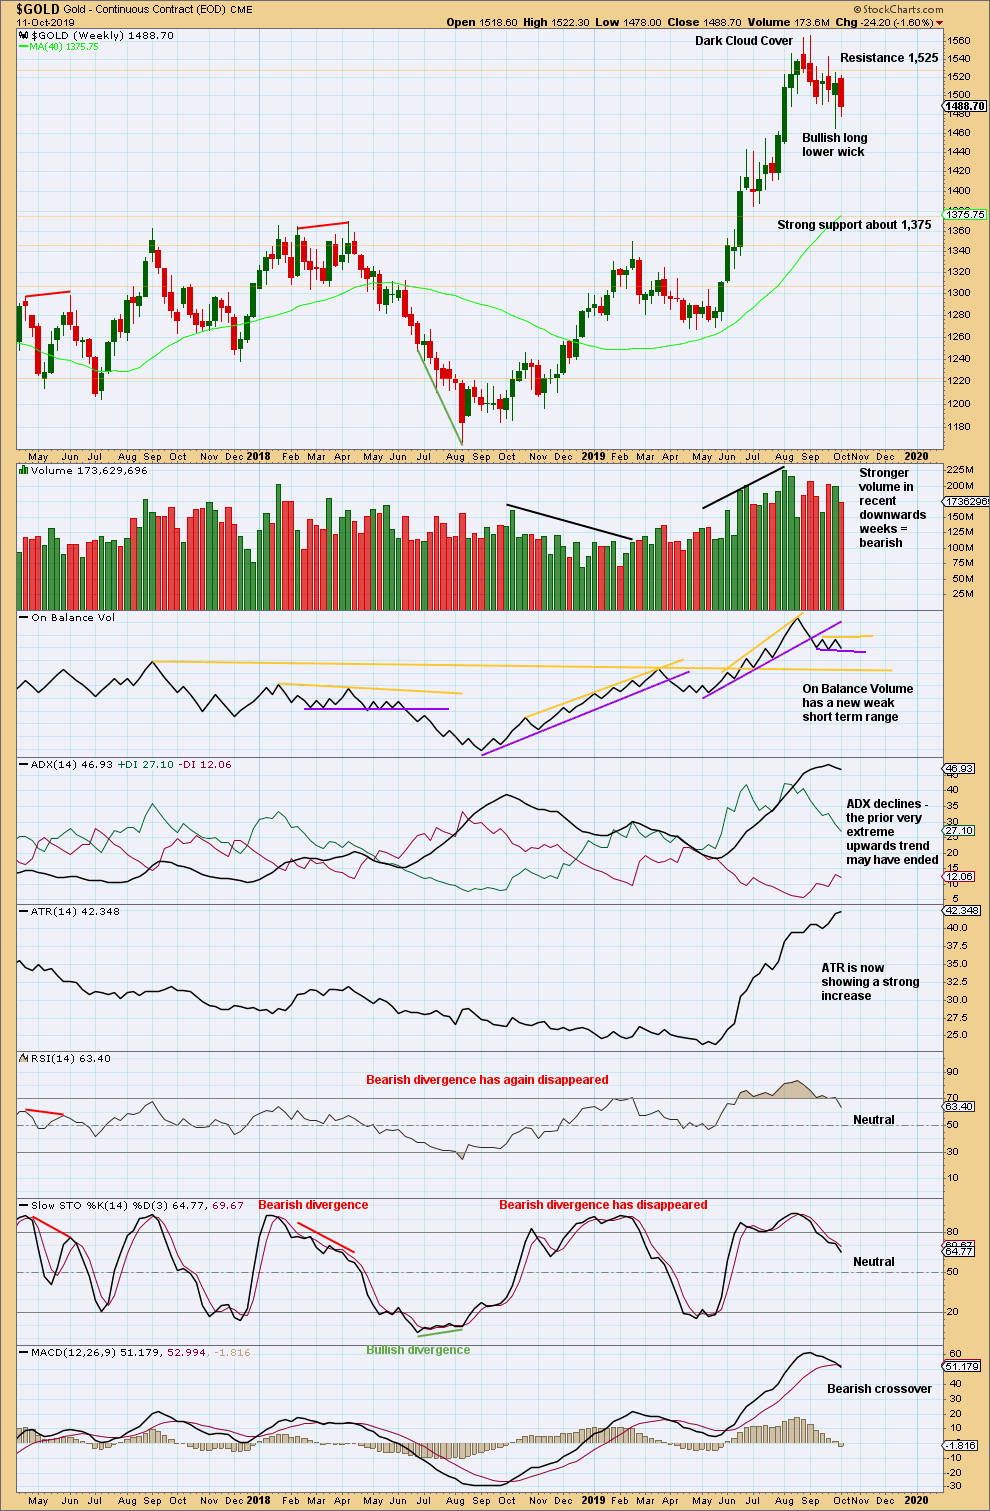
Click chart to enlarge. Chart courtesy of StockCharts.com.
When trends reach very extreme, candlestick reversal patterns should be given weight. The Dark Cloud Cover bearish reversal pattern is given more bearish weight from the long upper wick.
This pullback has brought RSI and Stochastics down from overbought and ADX down from very extreme. It looks like a high may be in place for Gold, but it is also possible that one final high may yet be seen before a major trend change.
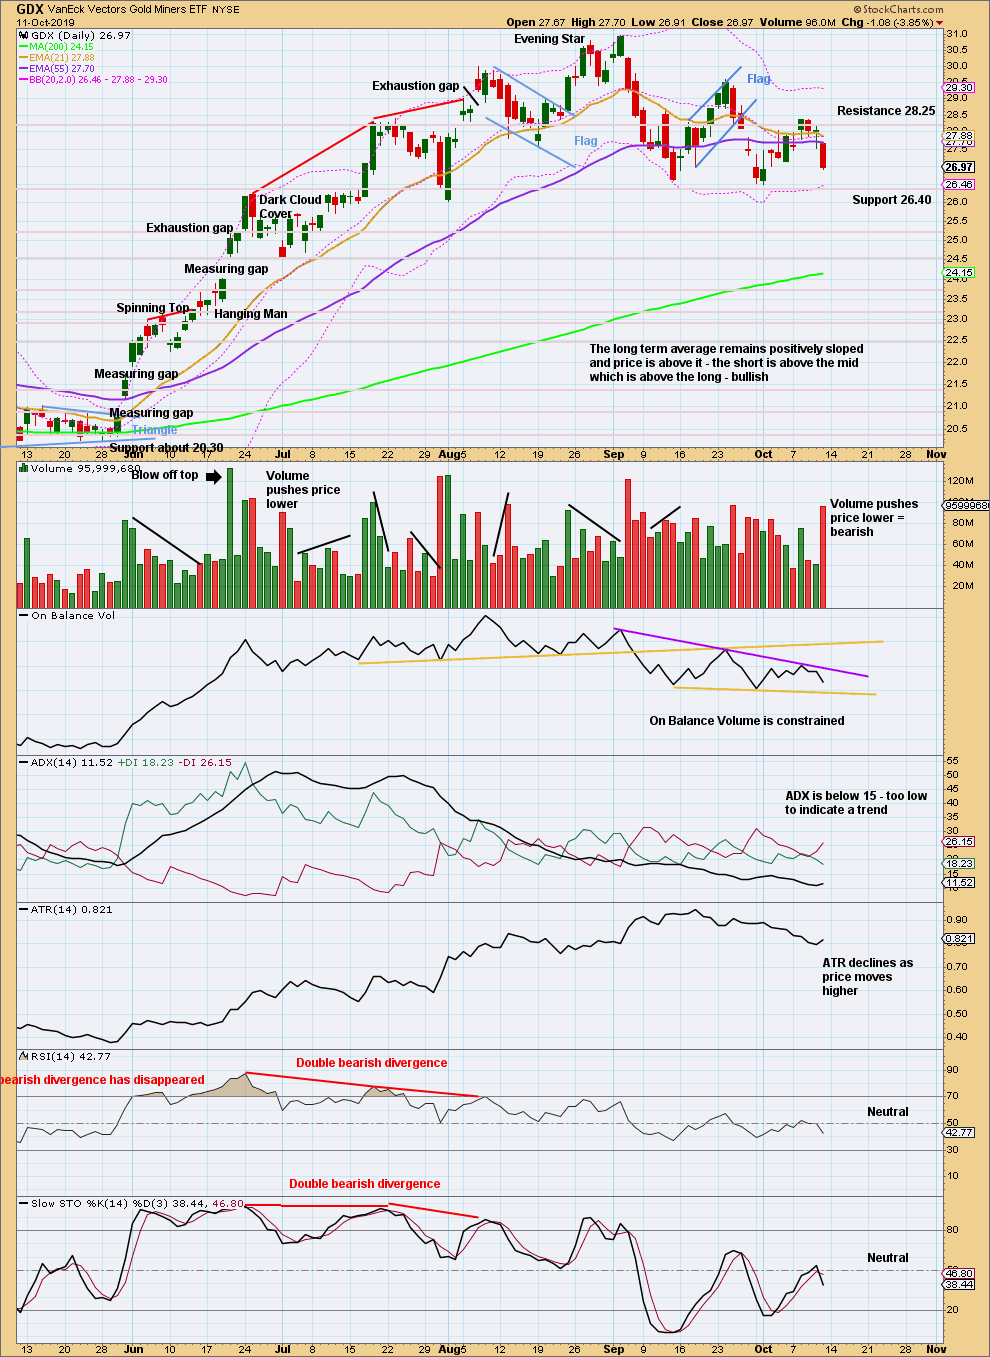
DAILY CHART
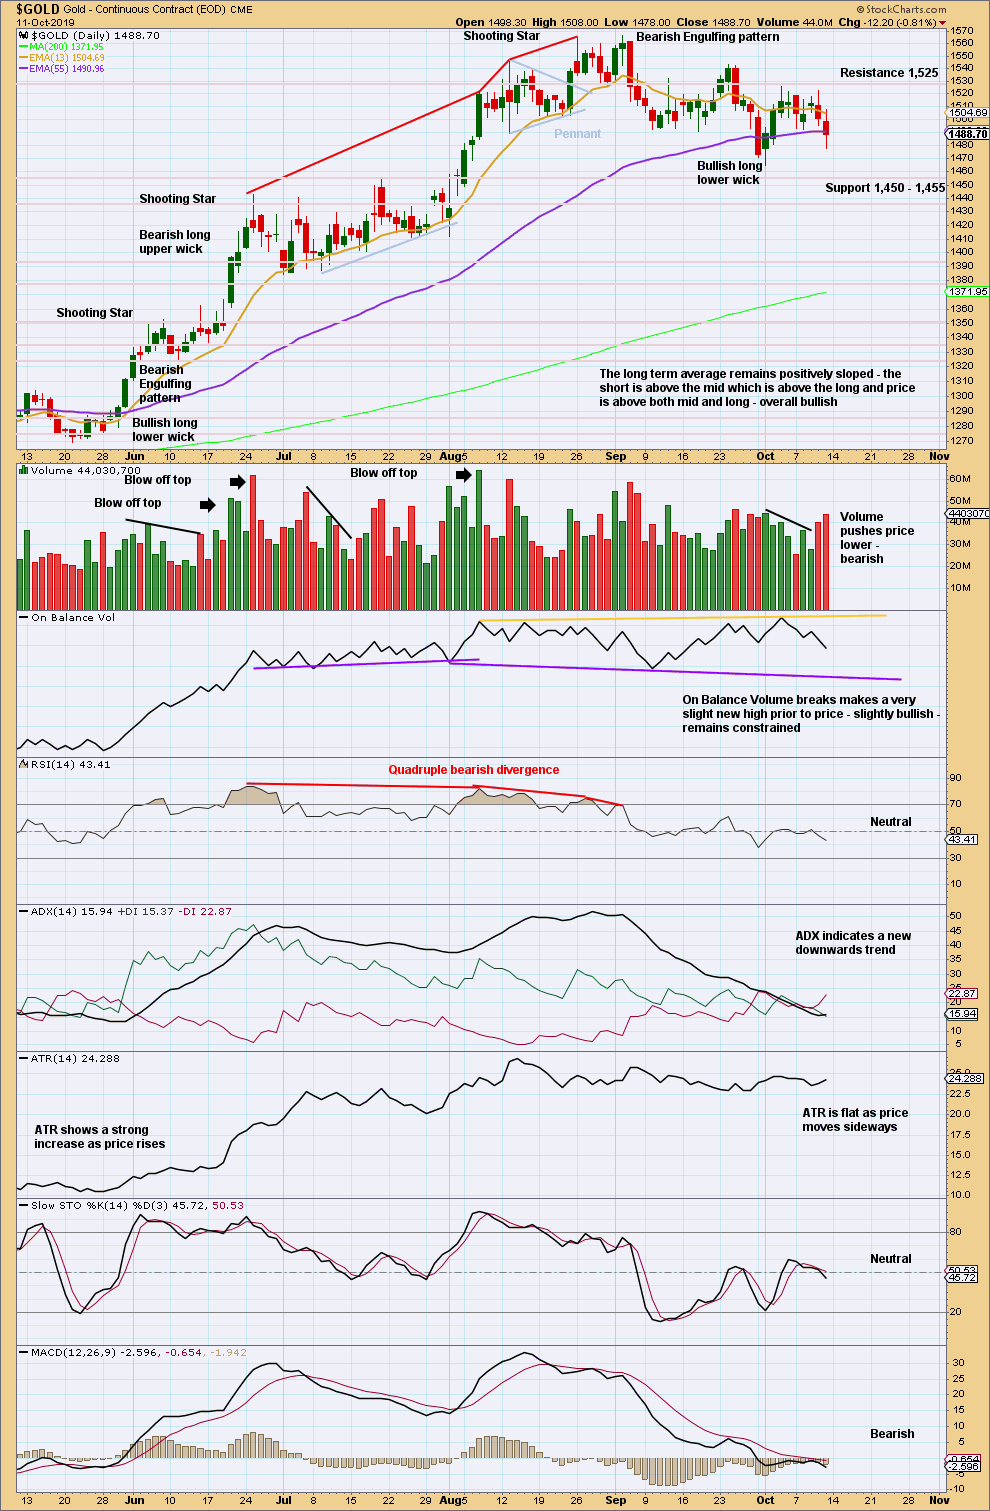
Click chart to enlarge. Chart courtesy of StockCharts.com.
Since the last high on the 4th of September, there has been a new swing low (on the 30th of September) and now a series of (so far) two lower swing lows and two lower swing highs. In conjunction with a very strong Bearish Engulfing pattern on the 5th of September and the prior upwards trend reaching very extreme, it looks like Gold may have had a trend change.
Price is range bound at the moment. A new low below 1,465 may be a downwards breakout. A new high above 1,543.30 may be an upwards breakout.
Some support from volume pushing price lower supports the view that a downwards breakout may be imminent.
GDX WEEKLY CHART
Click chart to enlarge. Chart courtesy of StockCharts.com.
This weekly candlestick is bearish.
GDX DAILY CHART
Click chart to enlarge. Chart courtesy of StockCharts.com.
Overall, it still looks most likely that a high is in place for GDX. Look for downwards movement to find support at identified horizontal support lines.
US OIL
The main Elliott wave count expected upward movement for the week, which is exactly what has happened. A large Elliott wave triangle looks to be completing.
Summary: The bearish wave count looks most likely to follow a triangle pattern here, with an upwards swing to end short of the upper A-C trend line.
For the short term, a new low now below 51.90 would indicate the downwards swing is not complete. The target would then be at 46.55.
The bullish alternate wave count would have confidence above 76.90. At that stage, a target for a third wave to end would be at 89.80.
MAIN ELLIOTT WAVE COUNT – BEARISH
MONTHLY CHART
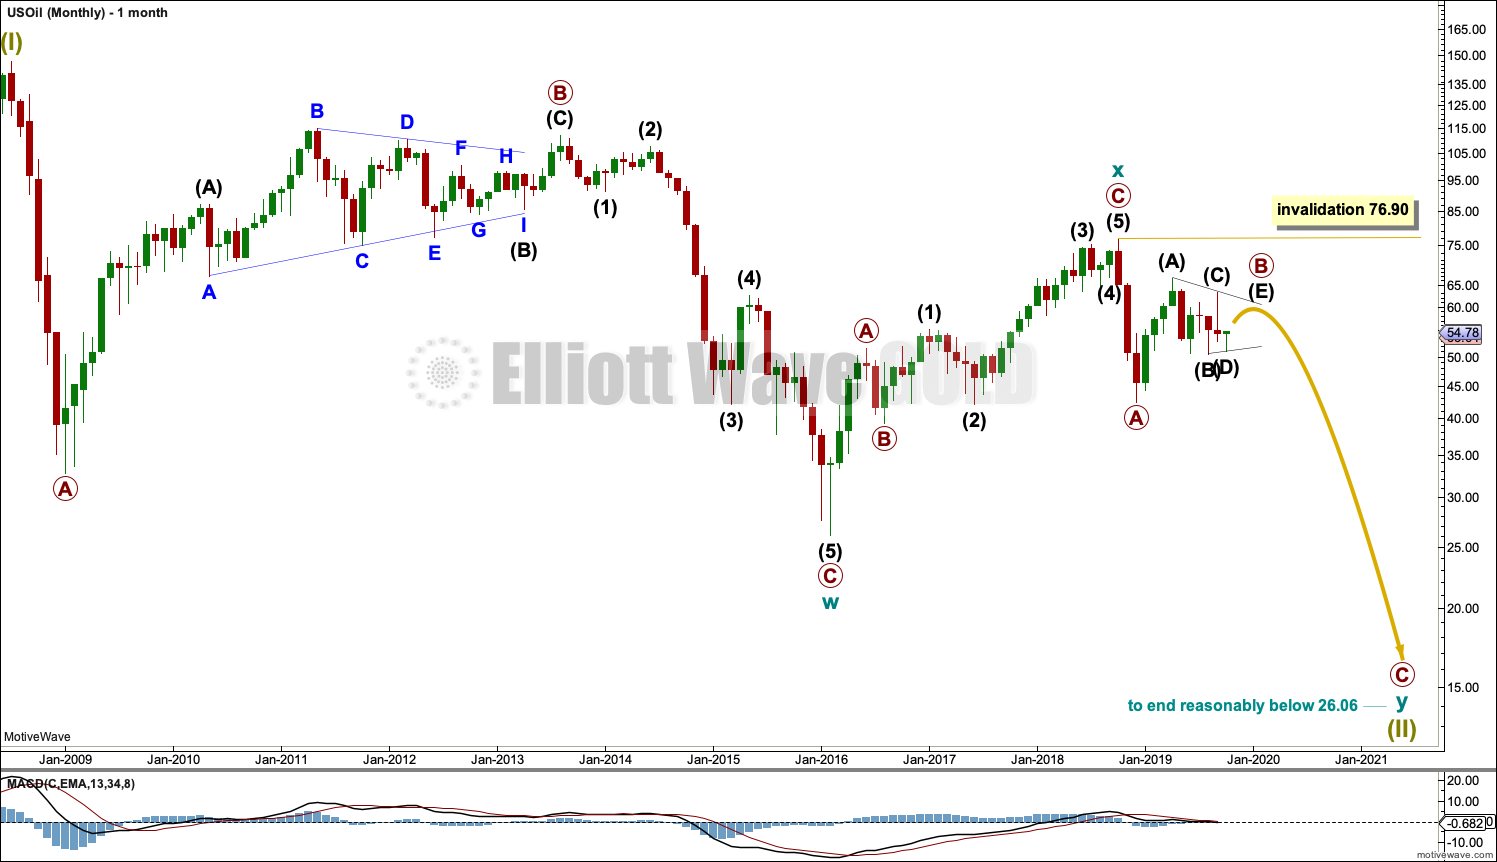
Click chart to enlarge.
The basic Elliott wave structure is five steps forward and three steps back. This Elliott wave count expects that US Oil is still within a three steps back pattern, which began in July 2008. The Elliott wave count expects that the bear market for US Oil continues.
This Elliott wave corrective structure is a double zigzag, which is a fairly common structure. The correction is labelled Super Cycle wave (II).
The first zigzag in the double is complete and labelled cycle wave y. The double is joined by a three in the opposite direction labelled cycle wave x, which subdivides as a zigzag. The second zigzag in the double may now have begun, labelled cycle wave w.
The purpose of a second zigzag in a double zigzag is to deepen the correction when the first zigzag does not move price deep enough. To achieve this purpose cycle wave y may be expected to move reasonably below the end of cycle wave w at 26.06. When primary wave B may be complete then the start of primary wave C may be known and a target may be calculated.
Cycle wave y is expected to subdivide as a zigzag, which subdivides 5-3-5.
Cycle wave w lasted 7.6 years and cycle wave x lasted 2.7 years. Cycle wave y may be expected to last possibly about a Fibonacci 5 or 8 years.
Primary wave B may not move beyond the start of primary wave A above 76.90.
WEEKLY CHART
Click chart to enlarge.
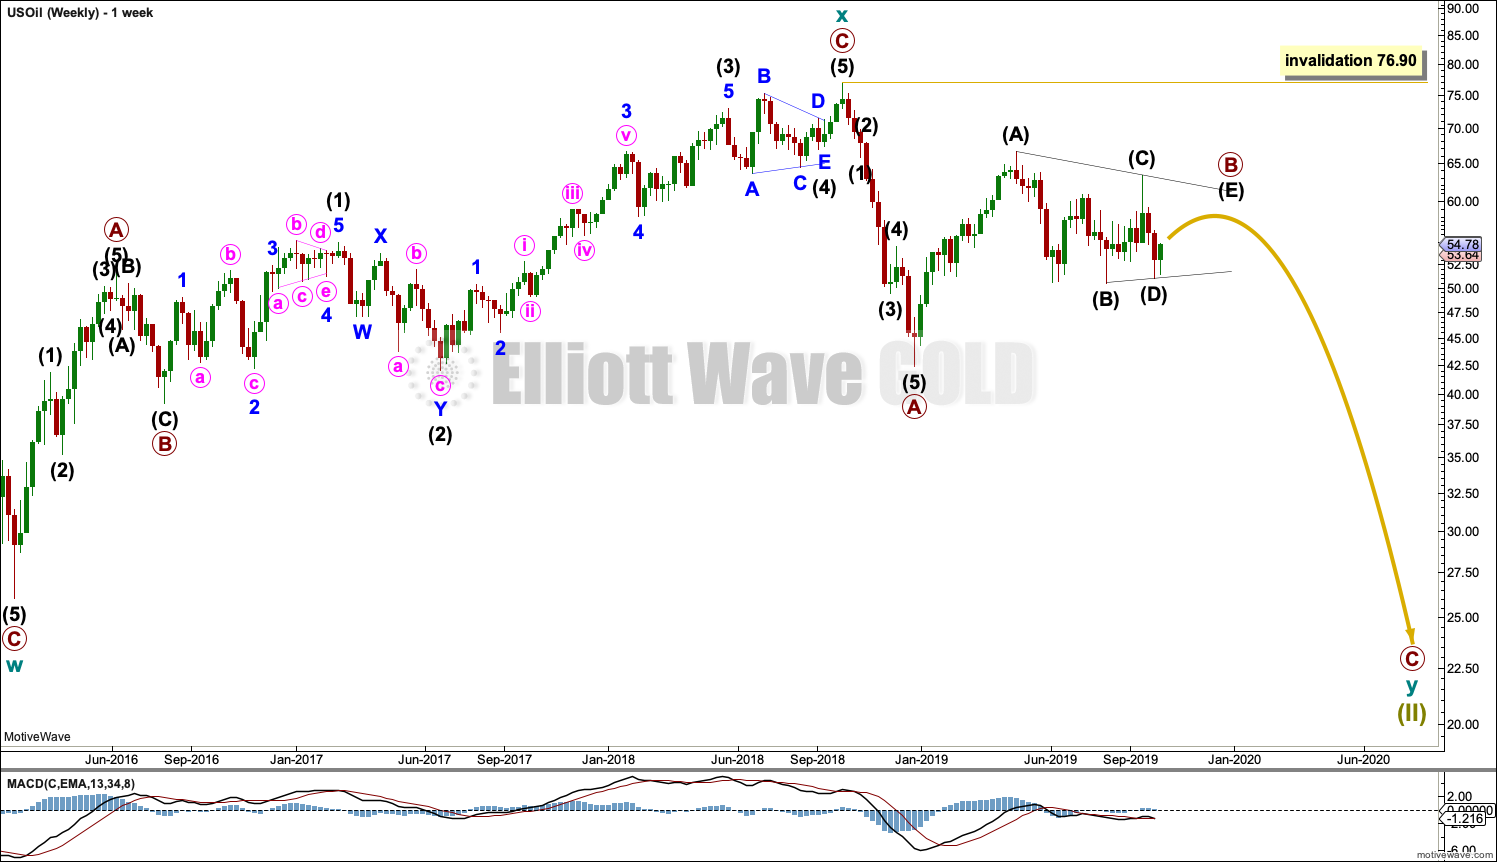
This weekly chart shows all of cycle waves x and y so far.
Cycle wave y is expected to subdivide as a zigzag. A zigzag subdivides 5-3-5. Primary wave A must subdivide as a five wave structure if this wave count is correct.
Primary wave A may be a complete five wave impulse at the last low.
Primary wave B may now be continuing further as a triangle or combination. Both ideas are outlined in daily charts below, and a triangle is labelled on the weekly chart.
When primary wave B may be complete, then a downwards breakout would be expected for primary wave C.
Primary wave B may not move beyond the start of primary wave A above 76.90.
DAILY CHART
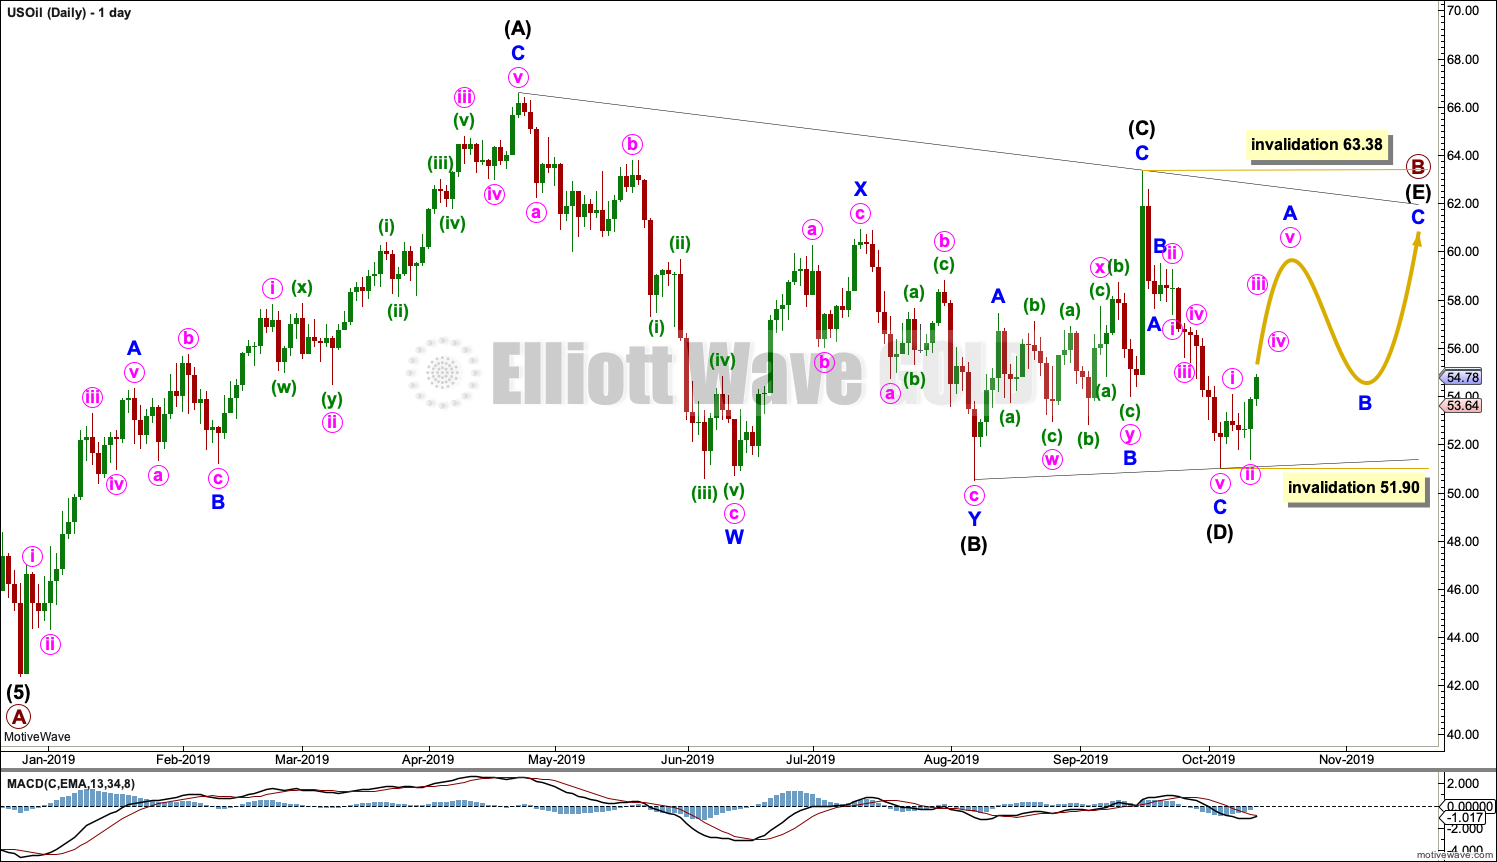
Click chart to enlarge.
Note that monthly and weekly charts are on a semi-log scale, but this daily chart is on an arithmetic scale. This makes a slight difference to trend channels.
Elliott wave triangles are always continuation patterns. When primary wave B is complete, then a downwards breakout would be expected for primary wave C.
This chart considers a triangle for primary wave B. The triangle may be a regular contracting triangle.
Within a contracting triangle: intermediate wave (C) may not move beyond the end of intermediate wave (A); intermediate wave (D) may not move beyond the end of intermediate wave (B); intermediate wave (E) may not move beyond the end of intermediate wave (C) above 63.38, and would most likely fall short of the (A)-(C) trend line.
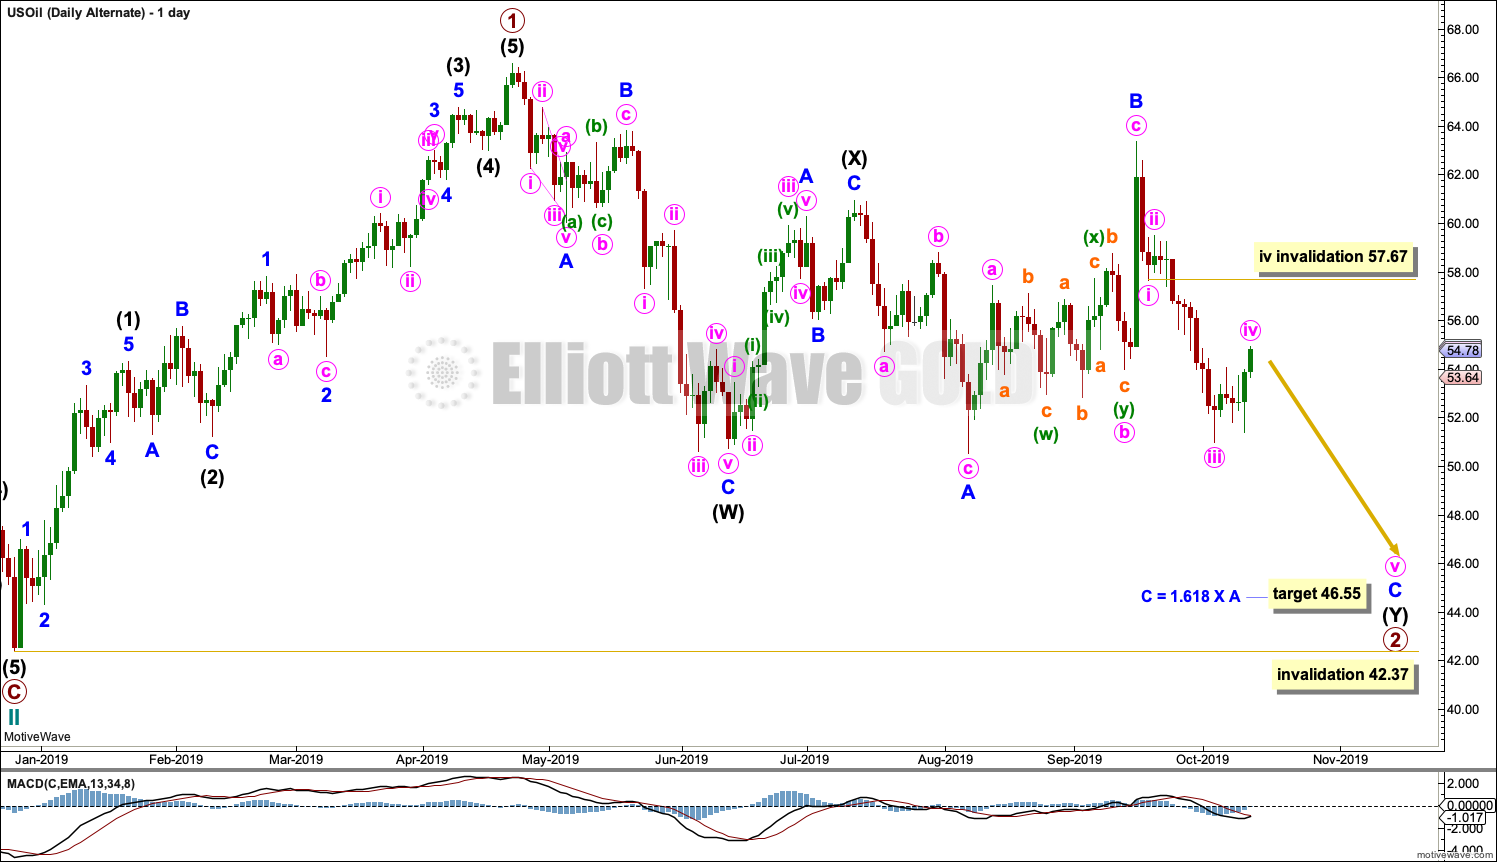
Within this contracting triangle, intermediate wave (D) now looks complete. The final sub-wave of intermediate wave (E) looks to have begun. Within the zigzag of intermediate wave (E), minor wave B may not move beyond the start of minor wave A below 51.90.
Intermediate wave (E) must complete as a zigzag, subdividing as a 5-3-5 structure.
DAILY CHART II
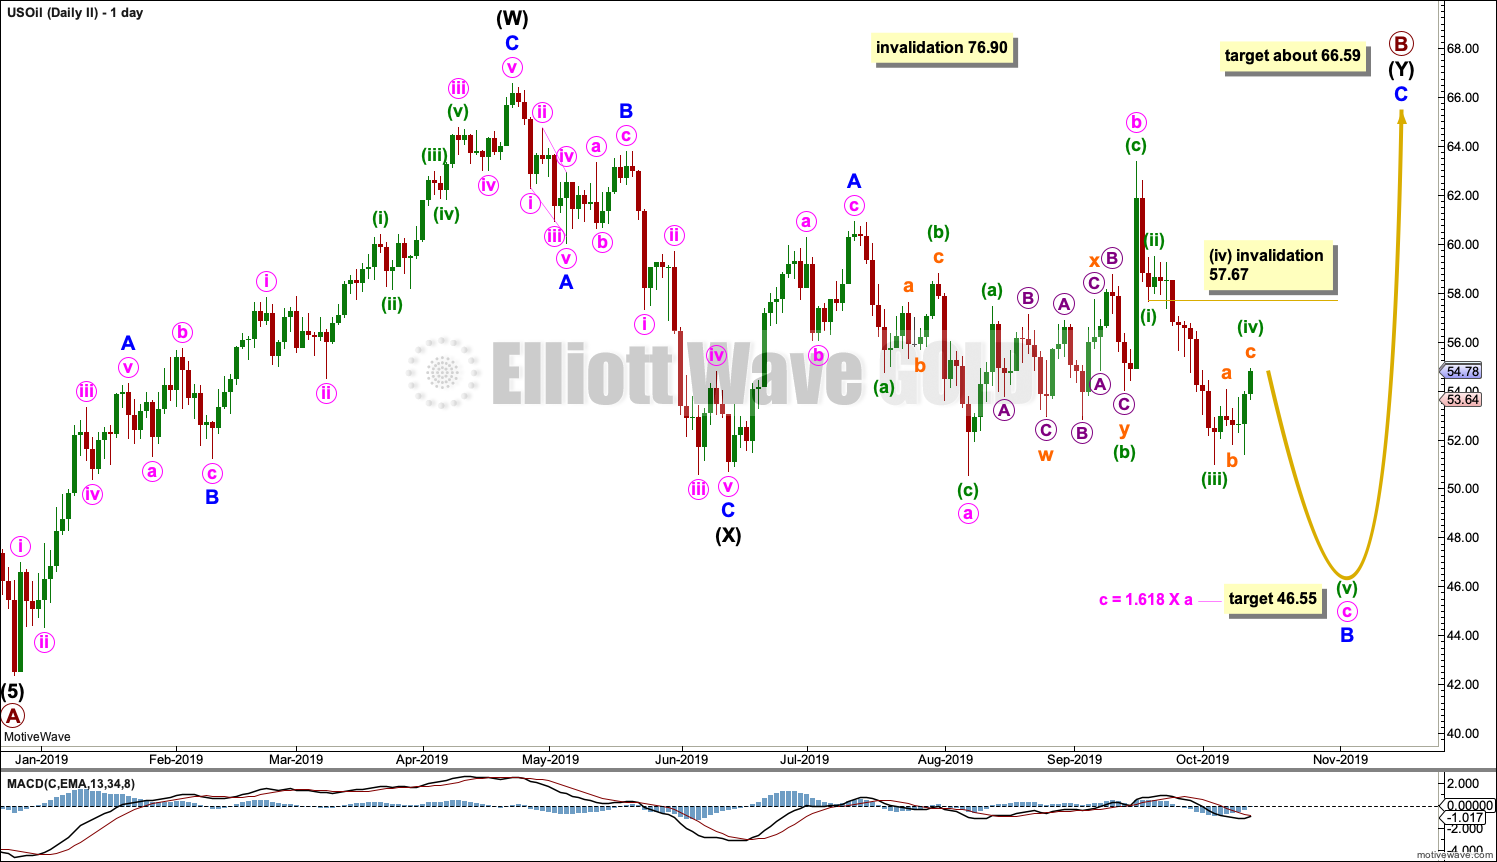
Click chart to enlarge.
When an Elliott wave triangle is considered, it is essential that alternates are also considered. Too many times an Elliott wave triangle may look to be completing only for the structure to be invalidated; the correction turns out to be something else, and the something else is almost always a combination.
Primary wave B may be a double combination: zigzag – X – flat. Intermediate wave (W) fits as a zigzag. Intermediate wave (Y) fits as a flat correction.
Within intermediate wave (Y), minor wave A may be complete. Minor wave B may be an incomplete expanded flat correction.
Within minor wave B, minute waves a and b both subdivide as three wave structures. Minute wave b is a 1.24 length of minute wave a, which is within the most common length of up to 1.38. A target is calculated for minute wave c to exhibit the most common Fibonacci Ratio to minute wave a within an expanded flat.
Minute wave c of minor wave B must now move below the end of minute wave a to avoid a truncation and a very rare running flat. It has not done so yet. Minute wave c must subdivide as a five wave structure. Within minute wave c, minuette wave (iv) may not move into minuette wave (i) price territory above 57.67.
The purpose of double combinations is to take up time and move price sideways. To achieve this purpose the second structure in the double usually ends about the same level as the first.
ALTERNATE ELLIOTT WAVE COUNT
MONTHLY CHART
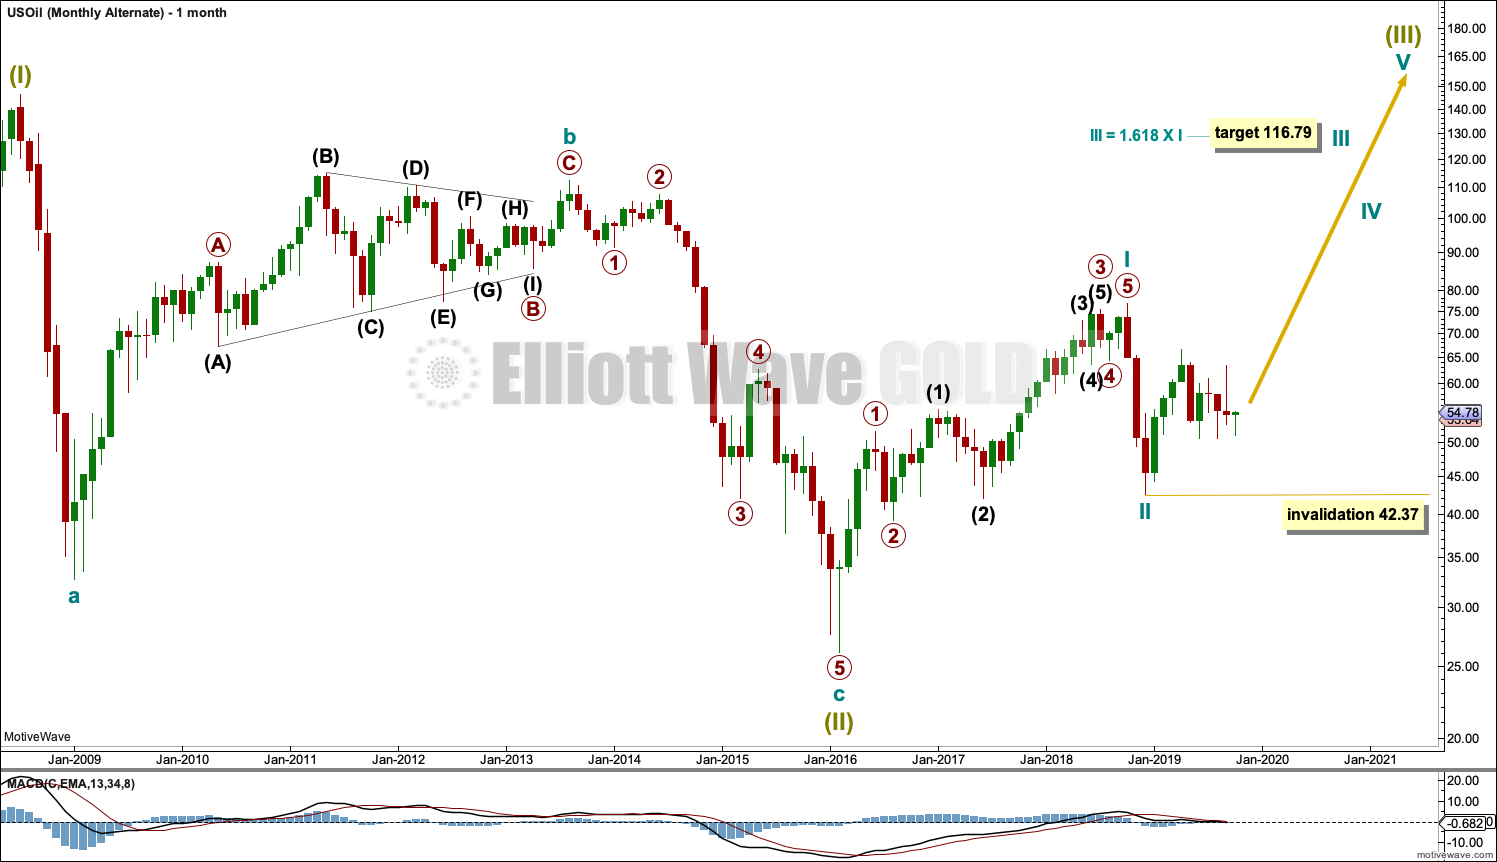
Click chart to enlarge.
It is possible that the bear market is over for Oil and a new bull market has begun.
For a bullish wave count for Oil, the upwards wave from the major low at 26.06 in February 2016 must be seen as a complete five wave impulse. This is labelled cycle wave I.
Cycle wave II may be a complete zigzag at 0.679 the depth of cycle wave I.
A target is calculated for cycle wave III to reach a common Fibonacci ratio to cycle wave I.
Within cycle wave III, no second wave correction may move beyond the start of its first wave below 42.37.
WEEKLY CHART
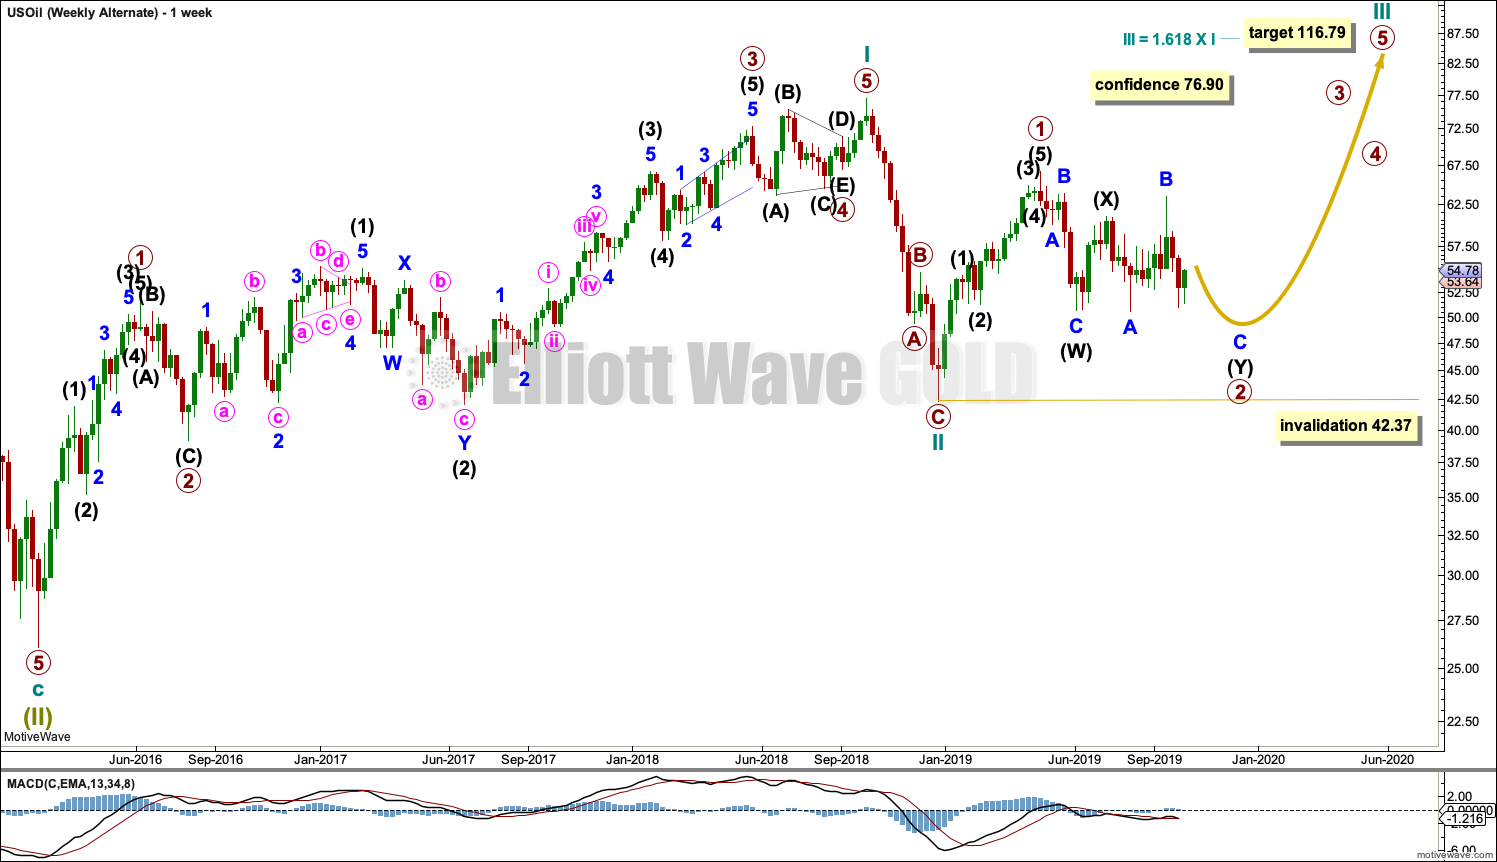
Click chart to enlarge.
This weekly chart shows detail of cycle wave I as a five wave impulse.
Cycle wave II does look best as a three. This is the only part of this wave count that has a better look than the main wave count, which sees this downwards wave as a five.
The upwards wave of primary wave 1 within cycle wave III must be seen as a five wave structure for a bullish wave count to work. This movement at lower time frames does not subdivide well at all as a five; this reduces the probability of this wave count.
Cycle wave III may only subdivide as an impulse. Within cycle wave III, so far primary wave 1 may be complete. Primary wave 2 may be moving lower as a double zigzag. Primary wave 2 may not move beyond the start of primary wave 1 below 42.37.
DAILY CHART
Click chart to enlarge.
Primary wave 2 may be continuing lower as a double combination.
The first structure in the double would be complete, a zigzag labelled intermediate wave (W). Within intermediate wave (W), minor wave C ends with a slight truncation for minute wave v. This is acceptable.
The double may be now joined by a complete three in the opposite direction, a zigzag labelled intermediate wave (X).
Intermediate wave (Y) may now be completing as an expanded flat correction. Within intermediate wave (Y), minor waves A and B both subdivide as threes, and minor wave B is a 1.24 length of minor wave A (this is within the most common range for B waves of flats from 1 to 1.38).
A target is calculated for minor wave C to exhibit the most common Fibonacci Ratio to minor wave A within an expanded flat. Within minor wave C, minute wave iv may not move into minute wave i price territory above 57.67.
Primary wave 2 may not move beyond the start of primary wave 1 below 42.37.
TECHNICAL ANALYSIS
MONTHLY CHART
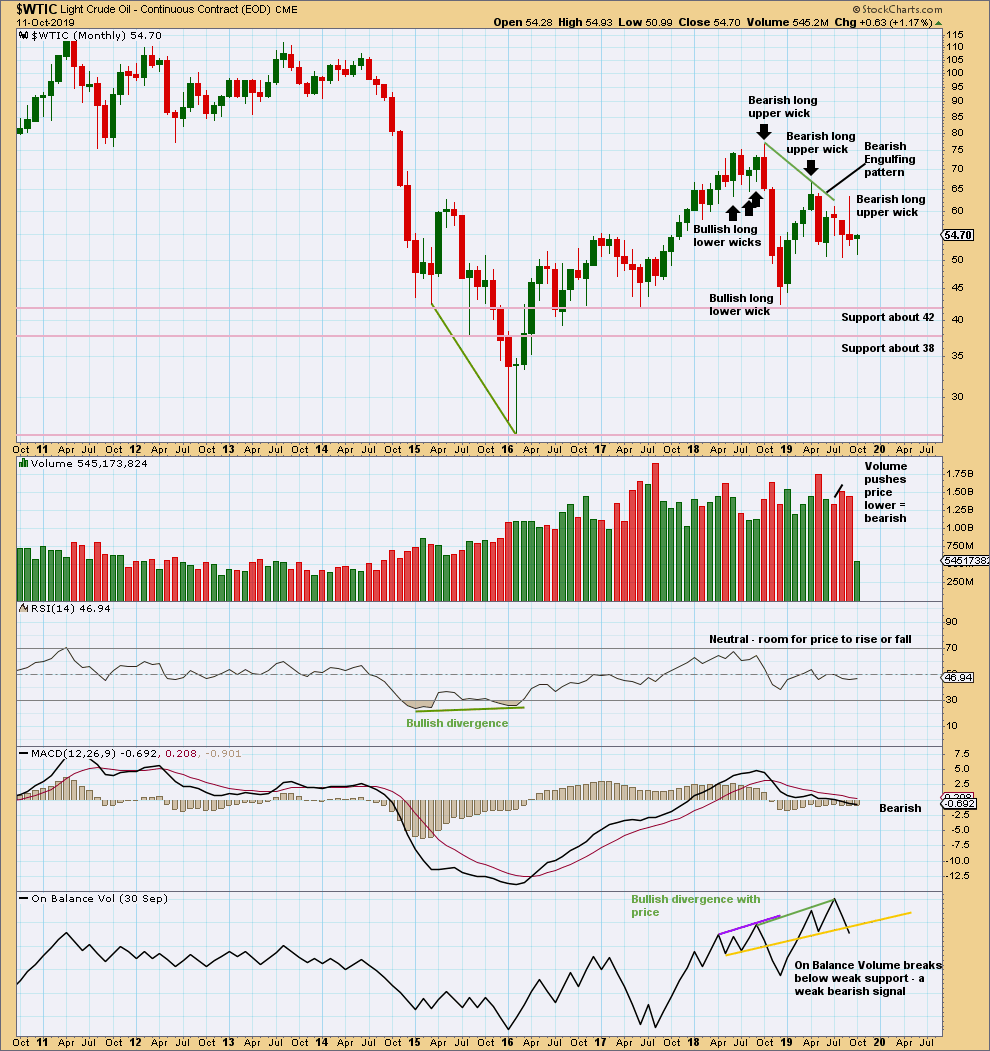
Click chart to enlarge. Chart courtesy of StockCharts.com.
September has closed with a very long upper wick. This is very bearish. This supports the main Elliott wave count.
There is now double bullish divergence between price and On Balance Volume. This supports the alternate Elliott wave count.
WEEKLY CHART
Click chart to enlarge. Chart courtesy of StockCharts.com.
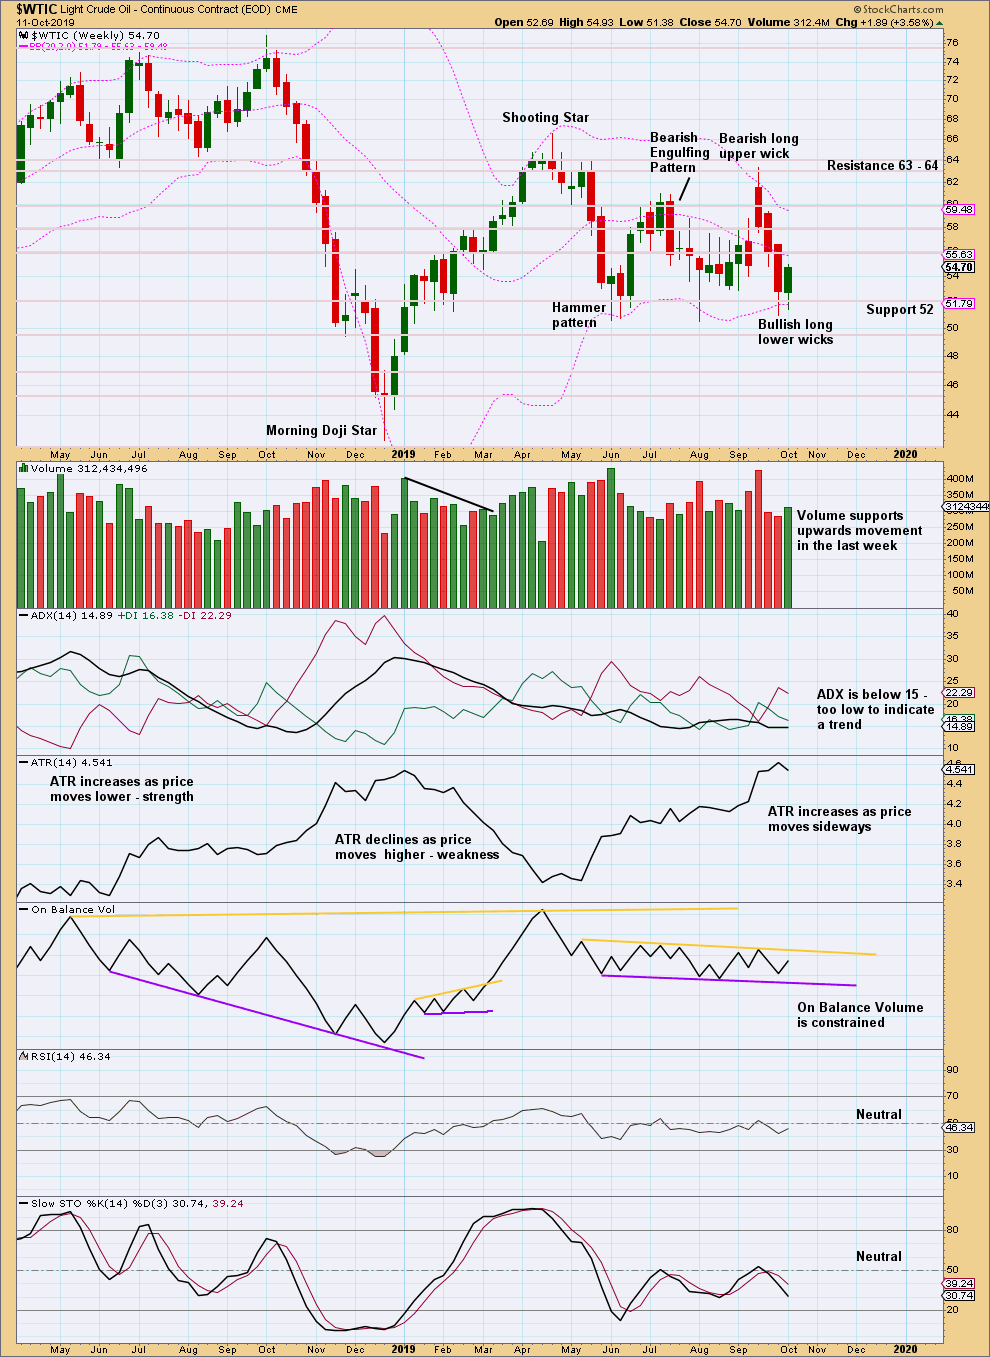
Price is back within a consolidation zone with resistance about 64 and support about 50. On Balance Volume is also range bound. A breakout is required for confidence in a new trend.
Two long lower wicks and some support this week for upwards movement suggest a downwards swing has ended and an upwards swing has begun. Look now for price to move overall higher in choppy overlapping movement until it finds resistance and Stochastics reaches overbought.
DAILY CHART
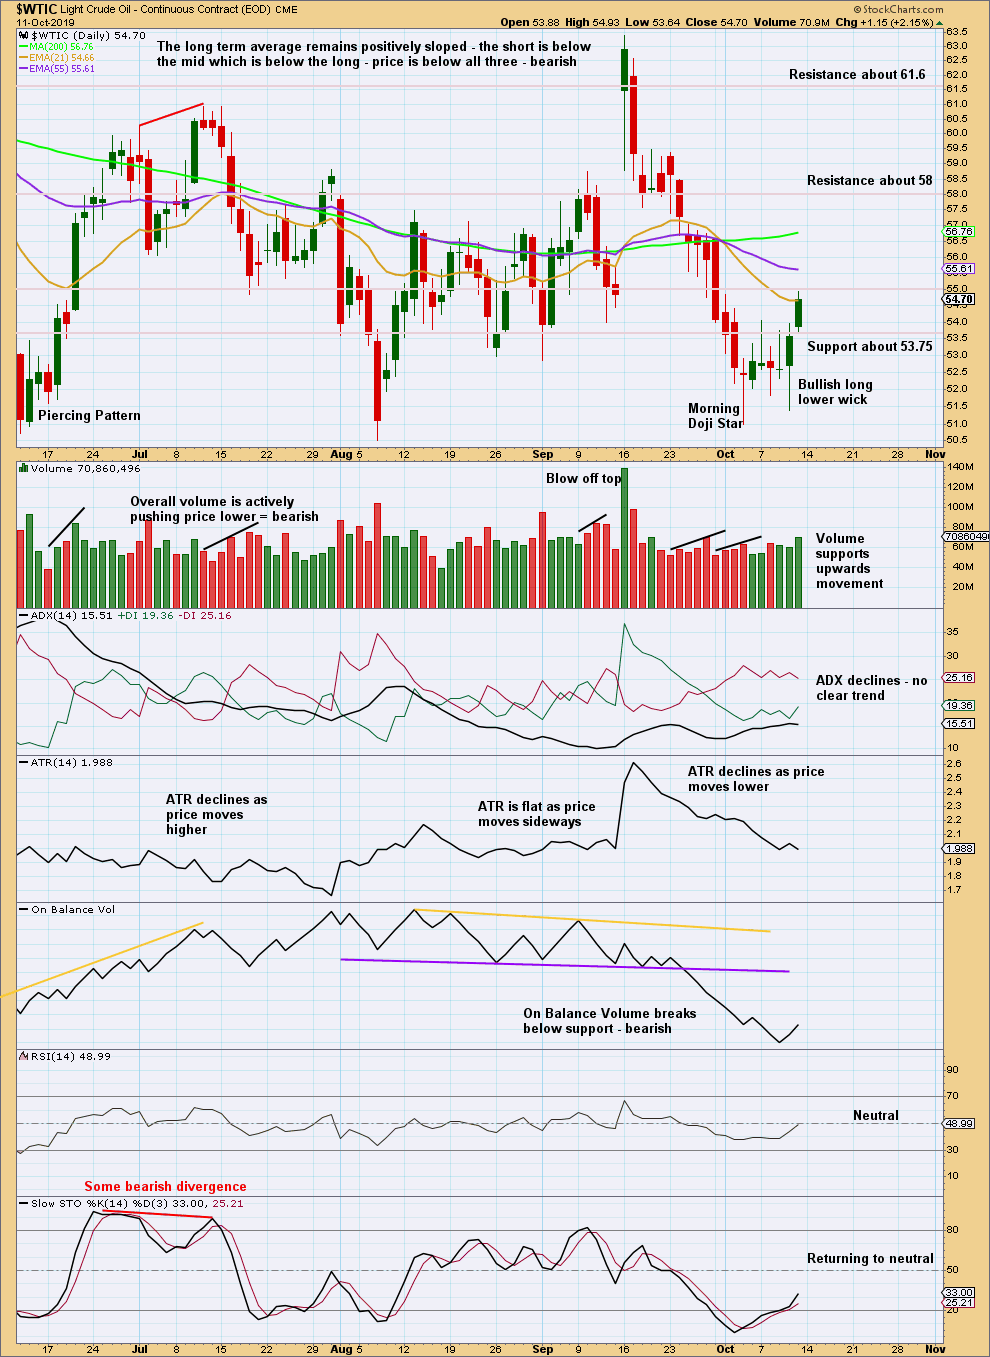
Click chart to enlarge. Chart courtesy of StockCharts.com.
An upwards swing looks likely to have begun.
—
Always practice good risk management as the most important aspect of trading. Always trade with stops and invest only 1-5% of equity on any one trade. Failure to manage risk is the most common mistake new traders make.
Hi all,
I just read this article : https://www.zerohedge.com/markets/fed-injects-1042bn-overnight-term-repos-one-day-after-start-not-qe
Before this, the Fed printed over $180B US for the Repo market in just 4 weeks starting in September… Now they just did another $104B US yesterday…. They are calling it : “Large Scale Asset Purchase Program”… LSAPP… In other words, LSAPP = QE on steroids…
I find this extremely inflationary… I became a super permabull of Gold…
Mathieu
Hi Lara,
Is it possible to get your opinion on the attached quarterly chart of Gold? It is actually GLD but I could not get $Gold (the commodity) on bigcharts.com … I do not have quarterly charts on stockcharts.com.
I found some interesting information on the quarterly chart:
1) Cycle Wave 1 looks like an impulse
2) Cycle Wave 1 Volume is very strong and the same for the current Cycle Wave 3.
3) Bollinger bands are expanding
4) On balance volume is breakout upward
5) The ADX (DMI) is starting to move upward.
I am having trouble to be bearish on this chart… What are your thoughts?
Thanks for everything as usual…
Mathieu
You need to look at a lower time frame to count that 1 and 2. There is so little detail there with quarterly candlesticks… you can really have no idea if cycle 1 is an impulse or a zigzag.
Try weekly candlesticks or better yet, daily, for that data.
Cycle 2 ends with a truncation as you have it labelled there. But again, a lower time frame is needed for this.
Thanks Lara…
So from what you are saying week after week in your videos, you are giving massive weight on the fact that Cycle 1 looks more like a 3-wave structure…. I totally understand and this is why I wanted your opinion…
For me, in my opinion, I see a lot of bullish evidence everywhere for which I cannot ignore.
In your video, you are saying that 1346 is the threshold where the bullish case is thrown out… What would be the level or indication where the bullish case would be your main Elliott wave count?
Thanks and I appreciate your time on this.
Mathieu
Yes, I give a lot of weight to that very problem, the upwards move from December 2015 to July 2016 fits so well as a three, and is problematic as a five.
Sadly, the bearish case would only be invalidated with a new ATH above 1,920.18. But I would hope that prior to that some structure within continuing upwards movement would give a strong indication as to which count is more likely first.
(and also more sadly, it is also possible that Super Cycle (a) was actually a three as it fits as a double zigzag, which would mean that Super Cycle (b) could actually make a new high above the start of Super Cycle (a) as in a huge flat correction – but it should have clear evidence of weakness)
This is because Super Cycle (b) may not move beyond the start of Super Cycle (a). Also, Super Cycle (b) could be very deep indeed and the bearish wave count at the monthly chart level would still look good. It’s a B wave. They have the greatest variety in structure and price behaviour of all the waves, they’re the hardest to analyse, hardest to trade, they’re awful.
Thanks Lara…
Total agree with you on the Elliott wave counts…
I just can’t imagine Gold back at $1000 … I am still trying to find one scenario other than default to bring us back down there…
Cheers,
Mathieu
I approach market analysis from a purely data driven POV, using only technical analysis and no fundamental analysis.
Also, EW has a strong basic underlying premise that it is our social mood, which is expressed in patterns of market movement, that drives price, and not the other way around.
Its a wildly unpopular view at this time, and so I expect many members here will find it hard to agree with it. That’s okay.
It really is quite a shift in thinking though. So my POV is that if the price of Gold does fall hard, following the bearish wave count, that towards the middle and at the end the “reasons” for the fall in price shall then be made.
But it will be price that prompts the reasons, not the other way around.
So I’m not concerned at all with trying to come up with justifications for either count, I’m more concerned with seeing which count has more support from technicals.
Because many members will disagree with this approach I aim to be providing the technical and EW portion of your own analysis, and you then take that and fit it into your whole analysis. Which is one reason I’m providing both bull and bear counts.
I understand…. I don’t have a problem that you only look at technicals… I want you to look only at technicals because you are unbiased in your view… I find it interesting that the bearish view is your main EW wave count (as the highest probability). It will be interesting if the bullish case comes to pass and when it occurs…
Right now, the bearish view on Gold does not match the US macro economics… I am still searching for a scenario in this nutty world to match the bearish EW count of Gold… I still can’t find it…
All the best,
Mathieu
Lara, Purely from an EW point, could we label the above correction (Cycle wave 2) as a WXY? Would we then be able to avoid a truncated correction?
I never knew truncation applied to corrections as well, having had always associated it with only 5th wave impulses. This is an important point that would go in my word document containing your EW salient points that I have gathered over the last two years. Unfortunately, it is still only 2 pages long.
Thanks as always.
It could be W-X-Y, and Y would not technically be truncated
BUT…
there are two different kinds of W-X-Y corrections, and they’re very different beasts
double zigzags are labelled W-X-Y and they should have a strong slope, so Y should move reasonably beyond the end of W to achieve that slope. if Y of a double zigzag doesn’t do that then it’s highly unusual, it has not achieved its purpose and the double zigzag doesn’t look right
double combinations are also labelled W-X-Y and the purpose is different, it’s to take up time and move price sideways. to achieve that purpose Y ends about the same level as W, and so can end short of W. and in the case of Y as a triangle it would need to end prior to the end of W.
double zigzags are the structures seen in sharp counter trend moves, pullbacks and bounces
double combinations are the structures seen in sideways consolidations
in the case of the chart posted above, if its a double zigzag for cycle 2 that would be a problem, so that means for it to be a combination one of the structures of W or Y needs to meet the rules regarding a flat (specifically that within the flat B must retrace a minimum 0.9 of A) for that count to make sense
Wow, thank you Lara. I am yet to see another living person with your level of expertise with EW. This goes in my Word document for sure – lots to learn from this explanation.
Honestly, I recently watched a publicly posted clip from a famous EWI personality that made the mistake of calling a correction a flat, when the B wave clearly failed to retrace 90% of A. I immediately spotted that, thanks to you. This is one of the many fine points I learned here, from you. I already have in my notes, the two different types of W-X-Ys and the most important, often missed by others, point of no w-x-y inside a w-x-y except inside the x wave. I truly thank you Lara for being such a great teacher and for sharing your expertise with us.
In the chart posted above, I see that without lower time frame data, we cannot make a definitive conclusion.
Thank you kindly.
that’s very kind, thanks Dave
IMO when I did my CMT a few years ago now, that was the one thing that really made a huge difference to my market analysis
I didn’t learn EW from it, but everything else I learned put the prior EW knowledge into a better format and everything made more sense