

S&P 500
New all time highs were expected. This week they have shown up. The Elliott wave count targets are recalculated.
Summary: The next target is at 3,179. Overall, expect upwards movement to continue and exhibit some further increase in momentum before a larger pullback arrives.
Three large pullbacks or consolidations during the next few months are expected: for minor wave 4, then intermediate (4), and then primary 4. Prior to each of these large corrections beginning, some weakness may begin to be evident. This week there is some small divergence between price and On Balance Volume, but that is all. Other technical indicators show underlying strength in this bull market.
For the short term, the next small consolidation or pullback may begin about 3,069.
The biggest picture, Grand Super Cycle analysis, is here.
Monthly charts were last published here. There are two further alternate monthly charts here.
ELLIOTT WAVE COUNTS
The two weekly Elliott wave counts below will be labelled First and Second. They may be about of even probability. When the fifth wave currently unfolding on weekly charts may be complete, then these two wave counts will diverge on the severity of the expected following bear market. To see an illustration of this future divergence monthly charts should be viewed.
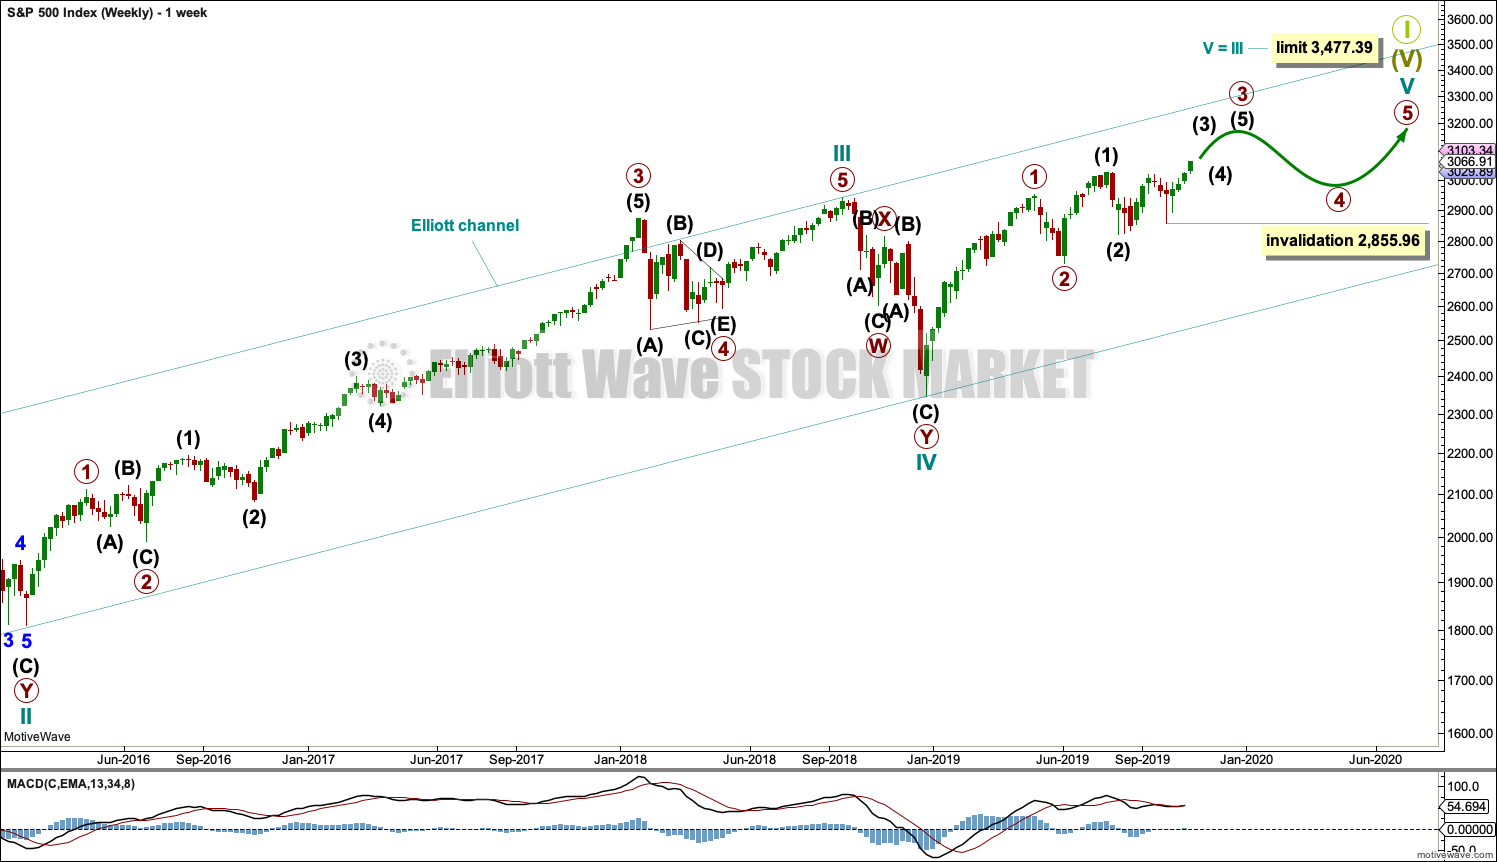
FIRST WAVE COUNT
WEEKLY CHART
Click chart to enlarge.
The basic Elliott wave structure consists of a five wave structure up followed by a three wave structure down (for a bull market). This wave count sees the bull market beginning in March 2009 as an incomplete five wave impulse and now within the last fifth wave, which is labelled cycle wave V. This impulse is best viewed on monthly charts. The weekly chart focusses on the end of it.
Elliott wave is fractal. This fifth wave labelled cycle wave V may end a larger fifth wave labelled Super Cycle wave (V), which may end a larger first wave labelled Grand Super Cycle wave I.
The teal Elliott channel is drawn using Elliott’s first technique about the impulse of Super Cycle wave (V). Draw the first trend line from the end of cycle wave I (off to the left of the chart, the weekly candlestick beginning 30th November 2014) to the end of cycle wave III, then place a parallel copy on the end of cycle wave II. This channel perfectly shows where cycle wave IV ended at support. The strongest portion of cycle wave III, the end of primary wave 3, overshoots the upper edge of the channel. This is a typical look for a third wave and suggests the channel is drawn correctly and the way the impulse is counted is correct.
Within Super Cycle wave (V), cycle wave III is shorter than cycle wave I. A core Elliott wave rule states that a third wave may never be the shortest. For this rule to be met in this instance, cycle wave V may not be longer in length than cycle wave III. This limit is at 3,477.39.
Cycle wave V may subdivide either as an impulse or an ending diagonal. Impulses are much more common. An alternate wave count, which looked at the possibility of a diagonal unfolding, has been invalidated with a new all time high.
The daily chart below will focus on movement from the end of intermediate wave (1) within primary wave 3.
In historic analysis, two further monthly charts have been published that do not have a limit to upwards movement and are more bullish than this wave count. Members are encouraged to consider those possibilities (links below summary) alongside the wave counts presented on a daily and weekly basis.
Within cycle wave V, primary waves 1 and 2 may be complete. Within primary wave 3, intermediate waves (1) and (2) may be complete. Within the middle of intermediate wave (3), no second wave correction may move beyond its start below 2,855.96.
DAILY CHART
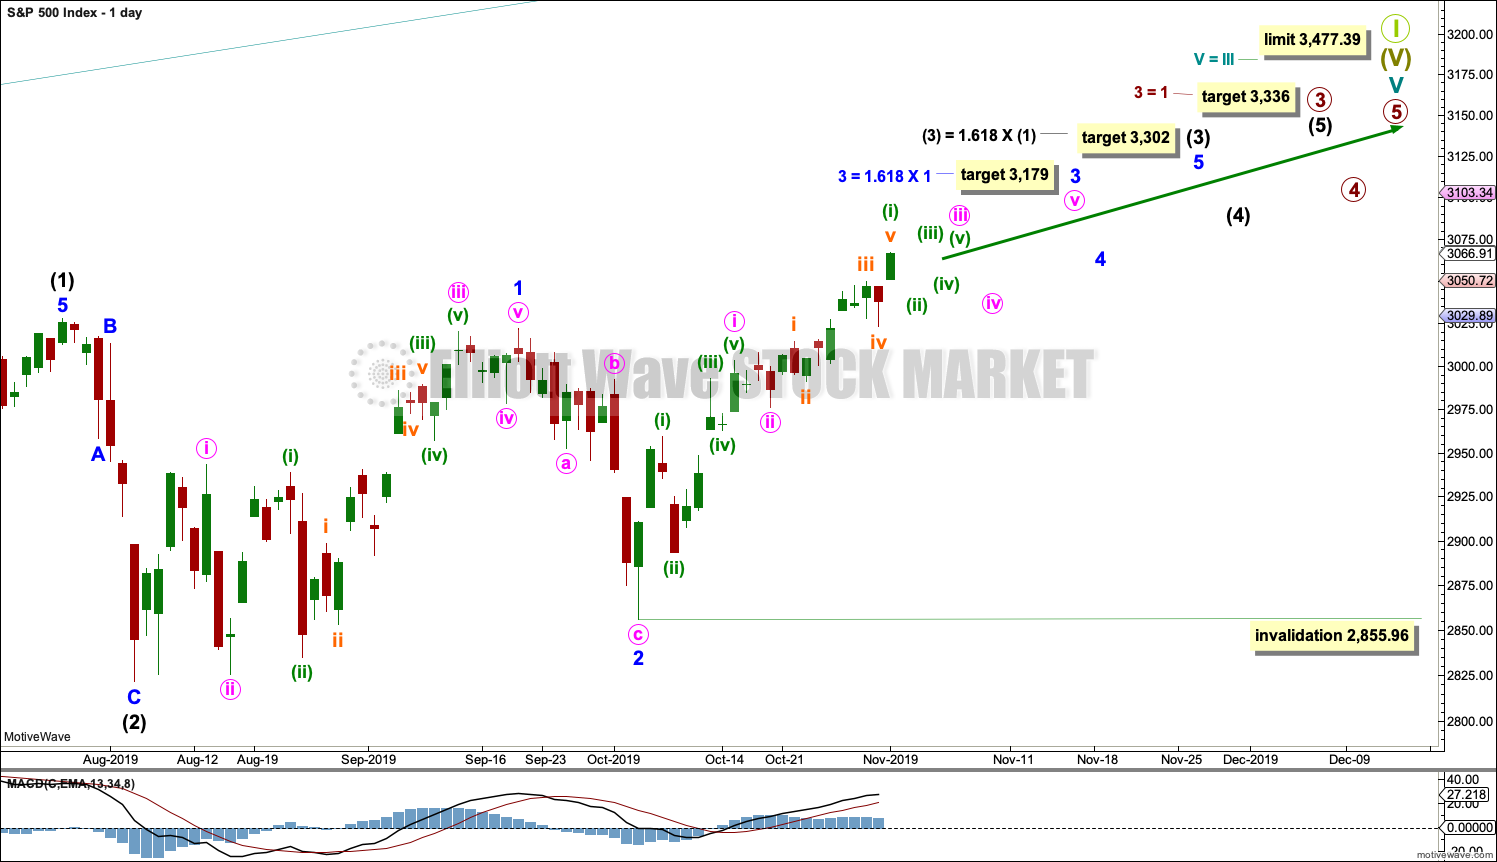
Click chart to enlarge.
Primary wave 3 may have begun.
All of primary wave 3, intermediate wave (3) and minor wave 3 may only subdivide as impulses. Within each impulse, its second wave correction may not move beyond the start of its first wave.
Minor wave 3 may be underway and may have not yet passed through its middle. Within minor wave 3, no second wave correction may move beyond its start below 2,855.96.
Intermediate wave (3) must move far enough above the end of intermediate wave (1) to then allow intermediate wave (4) to unfold and remain above intermediate wave (1) price territory.
The target for intermediate wave (3) is today recalculated. This fits with a new target calculated today for minor wave 3.
When minor wave 3 may be complete, then a multi-week pullback or consolidation for minor wave 4 may begin. Minor wave 4 must remain above minor wave 1 price territory at 3,021.99.
SECOND WAVE COUNT
WEEKLY CHART
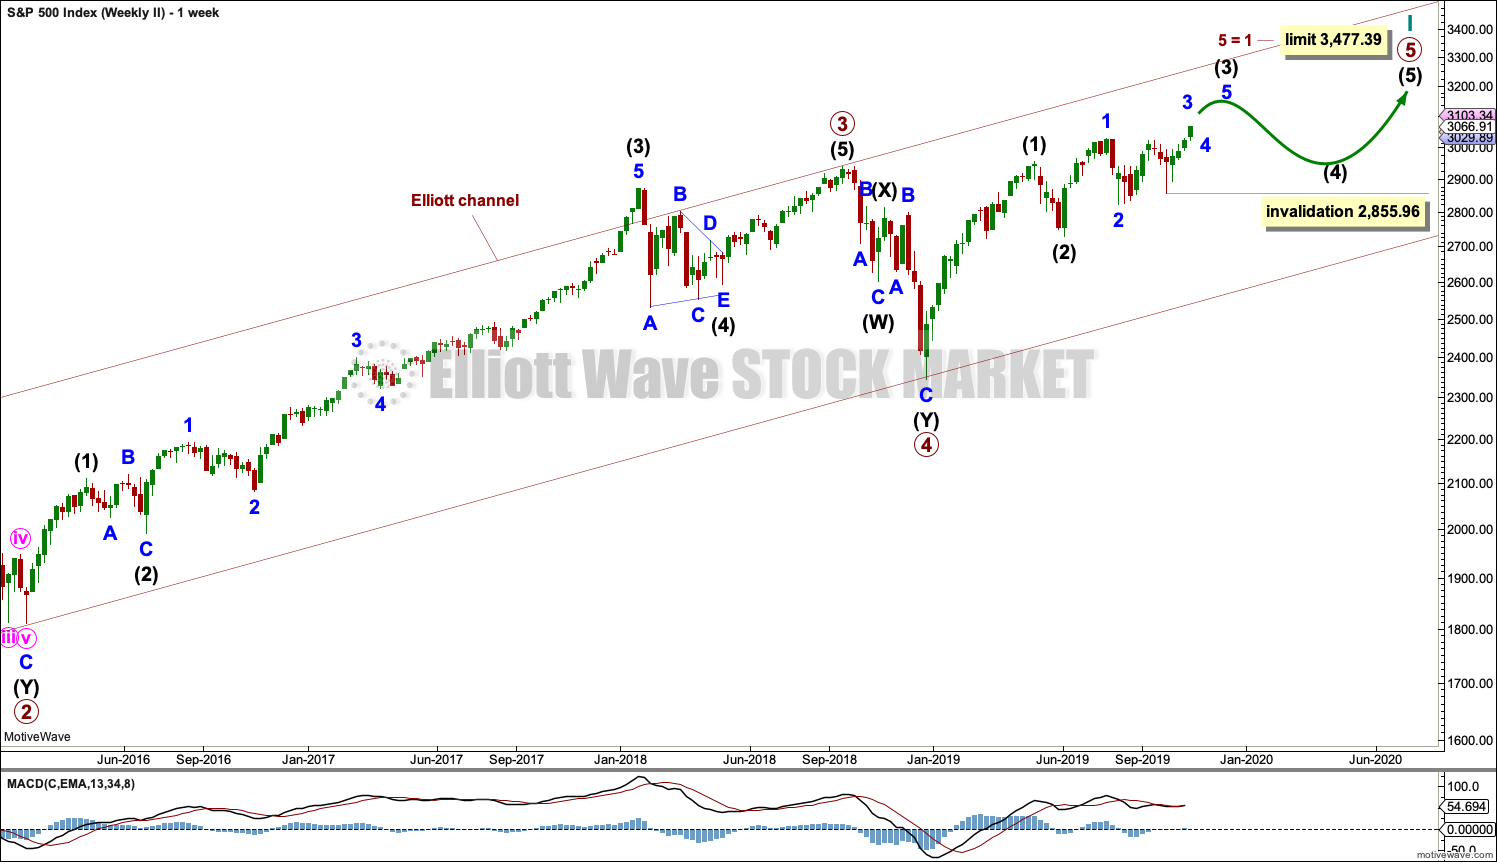
Click chart to enlarge.
This weekly chart is almost identical to the first weekly chart, with the sole exception being the degree of labelling.
This weekly chart moves the degree of labelling for the impulse beginning in March 2009 all down one degree. This difference is best viewed on monthly charts.
The impulse is still viewed as nearing an end; a fifth wave is still seen as needing to complete higher. This wave count labels it primary wave 5.
Primary wave 5 may be subdividing as either an impulse, in the same way that cycle wave V is seen for the first weekly chart.
TECHNICAL ANALYSIS
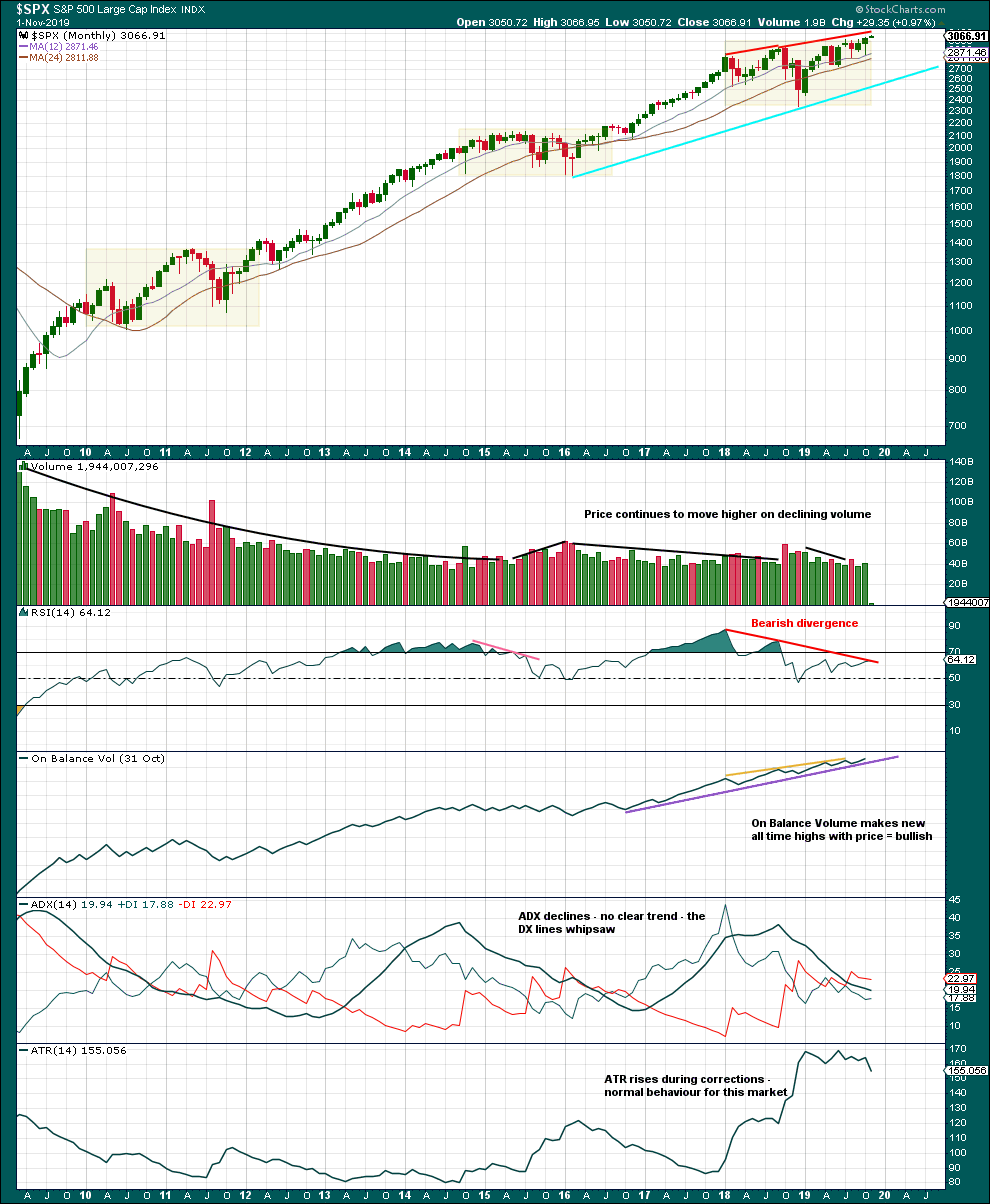
MONTHLY CHART
Click chart to enlarge. Chart courtesy of StockCharts.com.
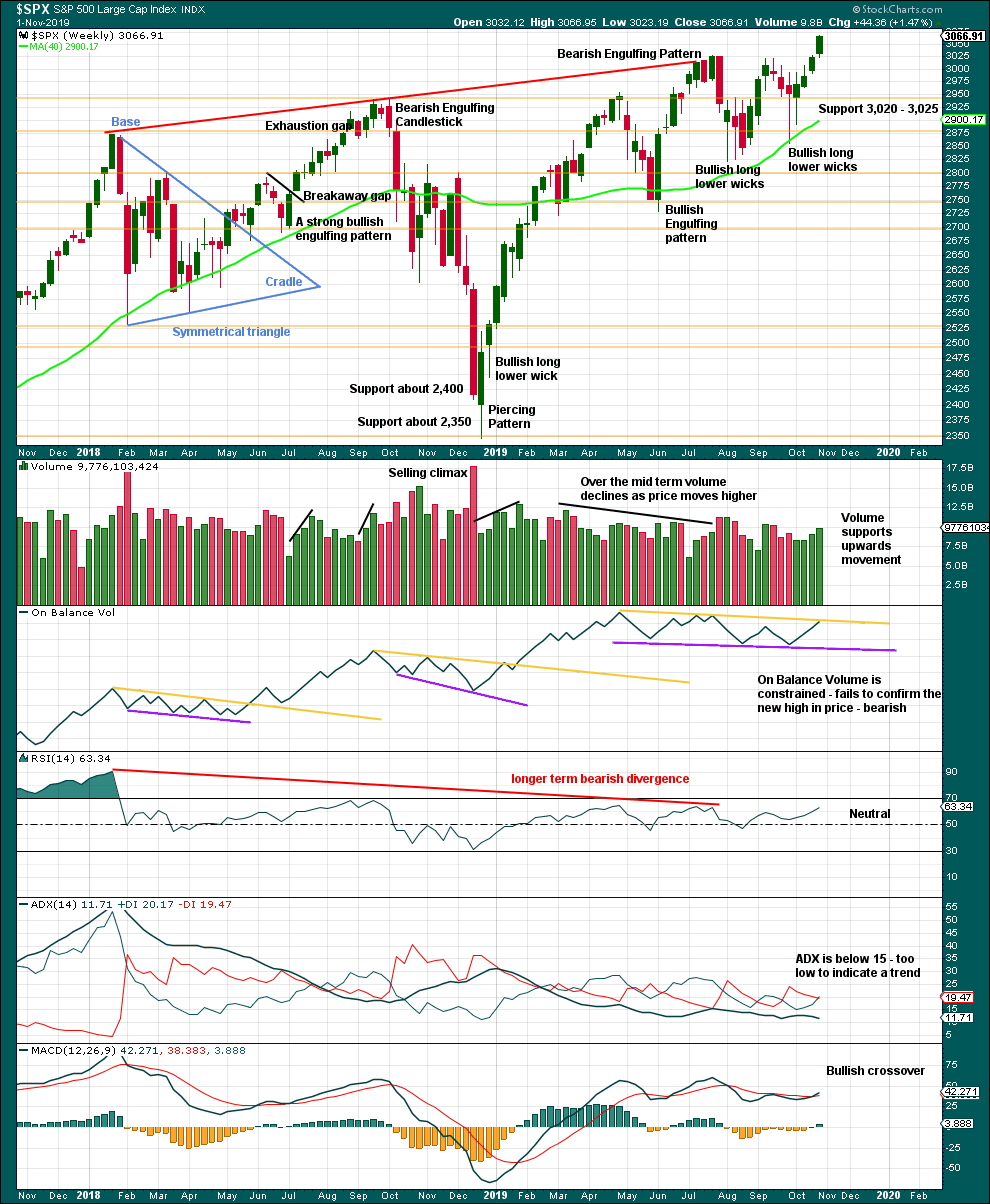
This monthly chart shows the entire bull market since its inception in March 2009. Within this bull market, there are so far three large consolidation boxes highlighted. A basic technical analysis concept is the longer price consolidates within a zone, the longer and further price may travel after a breakout. Price can back test support at prior resistance, and sometimes may re-enter the consolidation zone, before moving up and away.
Currently, price may have this week broken out of a large consolidation. It would be reasonable to now expect upwards movement for a reasonable amount of time after this breakout. It is also possible that pullbacks may re-enter the prior consolidation zone which had resistance about 3,027.
Bearish divergence between price and RSI may develop further before the bull market ends. Occasionally divergence can disappear, but for now it is valid. Given the stage that the Elliott wave count is in with a fifth wave unfolding, some developing weakness at this time frame should be expected.
Note that while On Balance Volume exhibits small divergence with price at lower time frames, it does not at the monthly chart level.
WEEKLY CHART
Click chart to enlarge. Chart courtesy of StockCharts.com.
This week sees a breakout above resistance.
Some developing bearishness in On Balance Volume this week with divergence and resistance suggests a pullback may develop sooner rather than later here.
However, it is very clear that the S&P is in an upwards trend and the bull market is continuing. Price does not move in straight lines; there will be pullbacks and consolidations along the way.
Now that resistance has been overcome and a new all time high is seen, expect a possible release of energy and any surprises should be to the upside. Corrections are normal and to be expected; they may be more short term in nature at this stage.
DAILY CHART
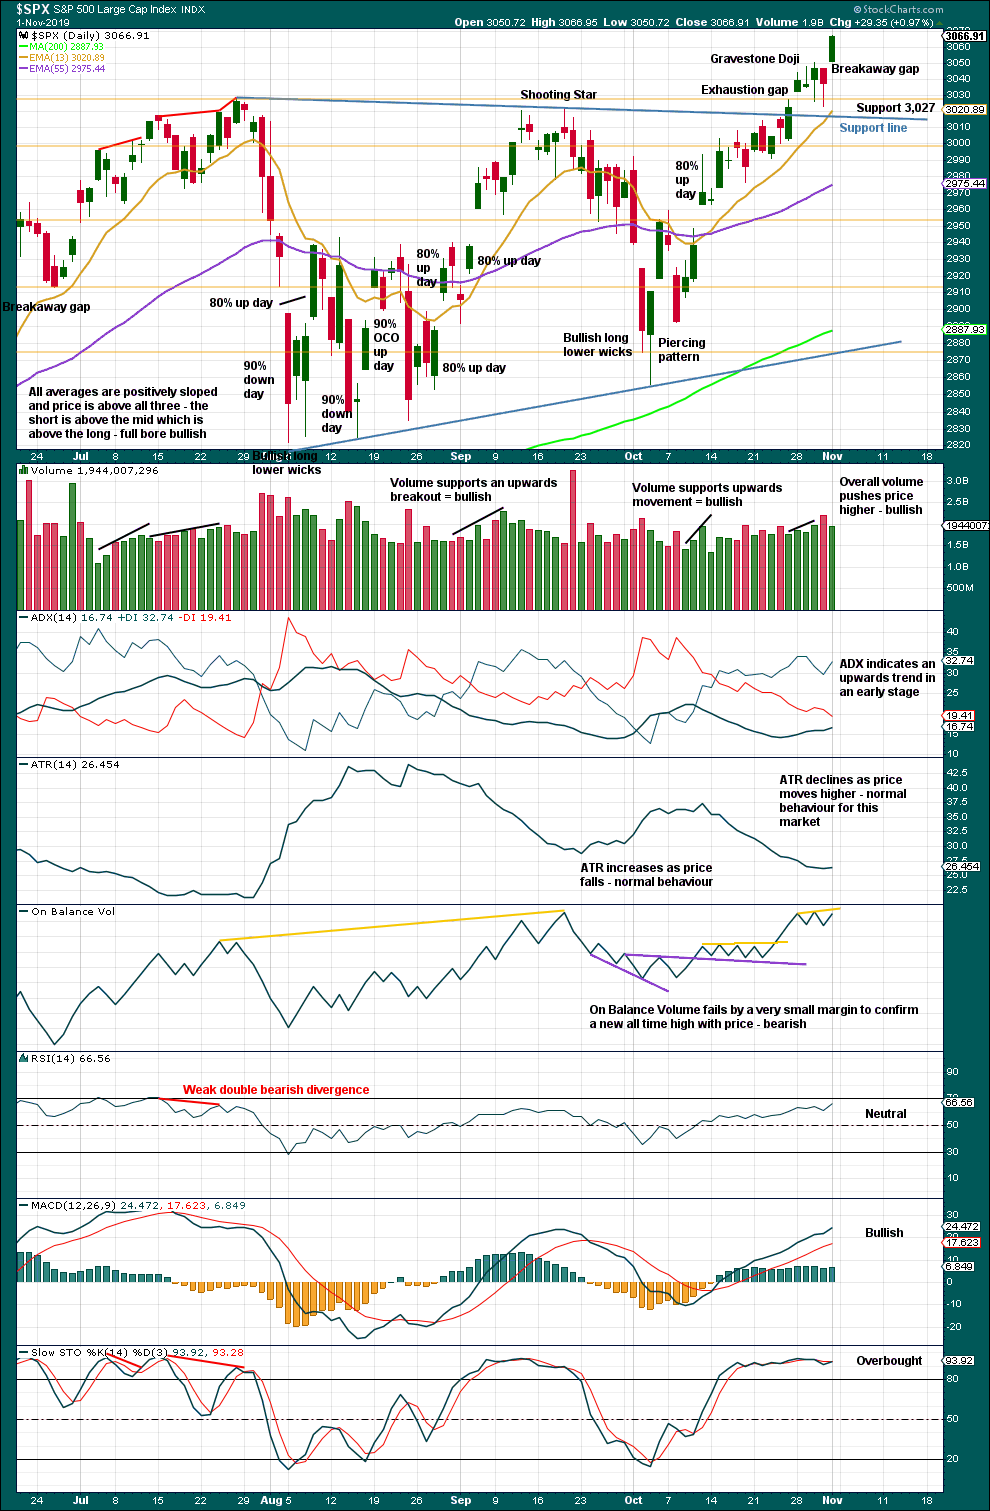
Click chart to enlarge. Chart courtesy of StockCharts.com.
Price has broken above a small correction on Friday with another gap. This may so far be labelled a breakaway gap and may offer support now about 3,046.90.
Bearishness from On Balance Volume at the daily chart level is slight and may possibly be more short term in nature. However, it may also point to a slightly deeper or more time consuming correction about to develop here. Look for strong support about 3,027 if that does happen.
BREADTH – AD LINE
WEEKLY CHART
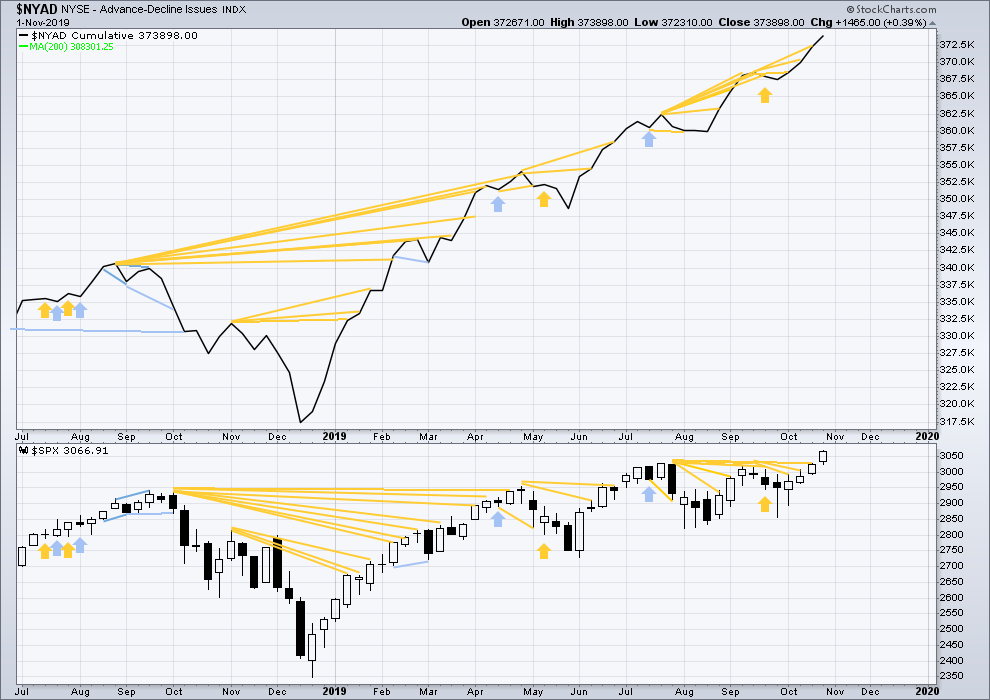
Click chart to enlarge. Chart courtesy of StockCharts.com. So that colour blind members are included, bearish signals
will be noted with blue and bullish signals with yellow.
Bear markets from the Great Depression and onwards have been preceded by an average minimum of 4 months divergence between price and the AD line with only two exceptions in 1946 and 1976. With the AD line making new all time highs continuing this week, the end of this bull market and the start of a new bear market is very likely a minimum of 4 months away, which is beginning March 2020.
In all bear markets in the last 90 years there is some positive correlation (0.6022) between the length of bearish divergence and the depth of the following bear market. No to little divergence is correlated with more shallow bear markets. Longer divergence is correlated with deeper bear markets.
If a bear market does develop here, it comes after no bearish divergence. It would therefore more likely be shallow.
This week all of small, mid and large caps have made new swing highs above the prior swing high on the 13th of September, but only large caps have made new all time highs. This upwards movement appears to be mostly driven by large caps, which is a feature of aged bull markets. This bull market at over 10 years duration certainly fits the definition of aged.
Mid and small caps are not too far off all time highs, with mid caps stronger and small caps weakest.
DAILY CHART
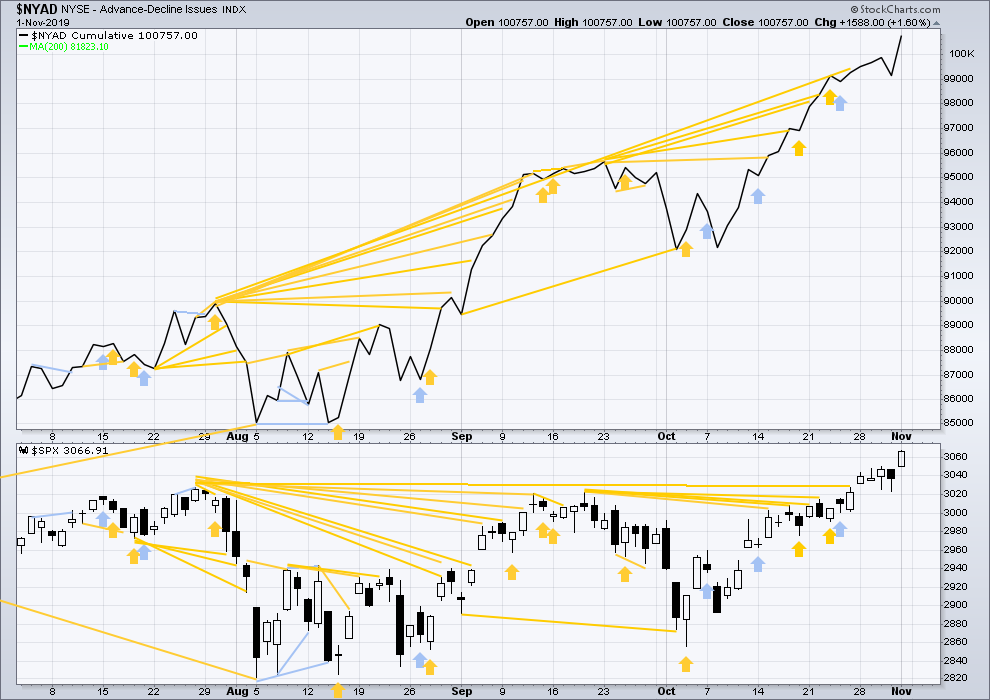
Click chart to enlarge. Chart courtesy of StockCharts.com. So that colour blind members are included, bearish signals
will be noted with blue and bullish signals with yellow.
Breadth should be read as a leading indicator.
Short-term bearish divergence noted in last analysis has been revised by Stockcharts and is no longer evident.
The AD line on Friday confirms a new all time high from price. Upwards movement has support from strongly rising market breadth. This is bullish.
VOLATILITY – INVERTED VIX CHART
WEEKLY CHART
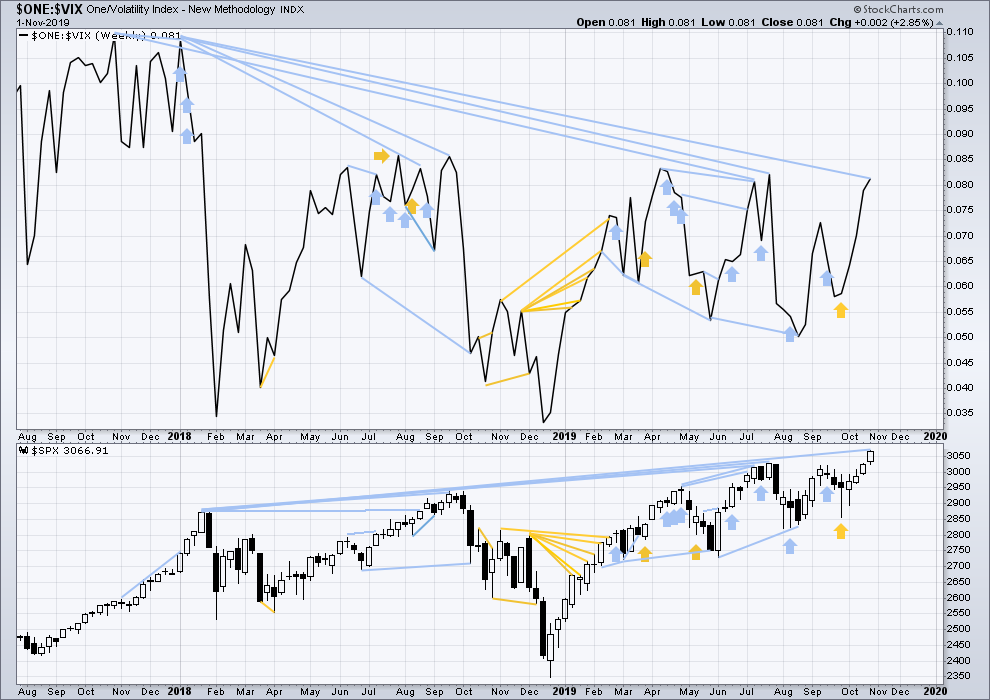
Click chart to enlarge. Chart courtesy of StockCharts.com. So that colour blind members are included, bearish signals
will be noted with blue and bullish signals with yellow.
The all time high for inverted VIX (which is the same as the low for VIX) was on 30th October 2017. There is now over two years of bearish divergence between price and inverted VIX.
The rise in price is not coming with a normal corresponding decline in VIX; VIX remains elevated. This long-term divergence is bearish and may yet develop further as the bull market matures.
This divergence may be an early warning, a part of the process of a top developing that may take years. It may is clearly not useful in timing a trend change from bull to a fully fledged bear market.
This week both price and inverted VIX have moved higher. Price has made new short-term swing highs, but inverted VIX has not. This divergence is slight and short term, and it adds to the longer term bearish divergence.
DAILY CHART
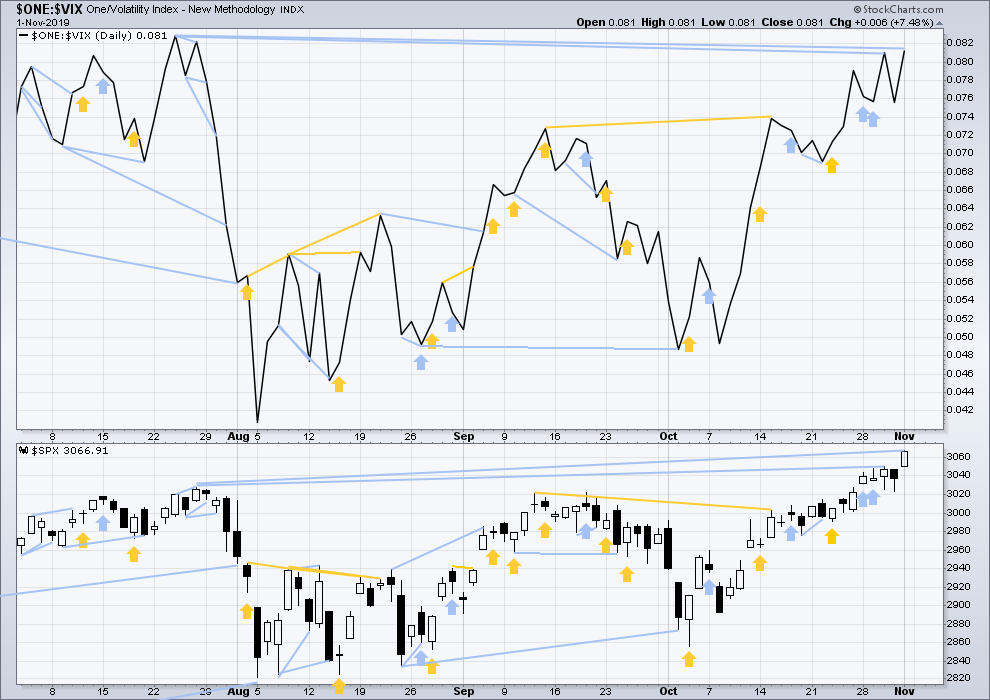
Click chart to enlarge. Chart courtesy of StockCharts.com. So that colour blind members are included, bearish signals
will be noted with blue and bullish signals with yellow.
Today both price and inverted VIX have moved higher. Price has made new mid-term swing highs, but inverted VIX has failed to make corresponding mid-term highs by a fairly small margin. This divergence is bearish.
DOW THEORY
Dow Theory confirmed a bear market in December 2018. This does not necessarily mean a bear market at Grand Super Cycle degree though; Dow Theory makes no comment on Elliott wave counts. On the 25th of August 2015 Dow Theory also confirmed a bear market. The Elliott wave count sees that as part of cycle wave II. After Dow Theory confirmation of a bear market in August 2015, price went on to make new all time highs and the bull market continued.
DJIA: 23,344.52 – a close on the 19th of December at 23,284.97 confirms a bear market.
DJT: 9,806.79 – price has closed below this point on the 13th of December.
S&P500: 2,532.69 – a close on the 19th of December at 2,506.96 provides support to a bear market conclusion.
Nasdaq: 6,630.67 – a close on the 19th of December at 6,618.86 provides support to a bear market conclusion.
With all the indices having moved higher following a Dow Theory bear market confirmation, Dow Theory would confirm a bull market if the following highs are made:
DJIA: 26,951.81 – a close above this point has been made on the 3rd of July 2019.
DJT: 11,623.58 – to date DJT has failed to confirm an ongoing bull market.
S&P500: 2,940.91 – a close above this point was made on the 29th of April 2019.
Nasdaq: 8,133.30 – a close above this point was made on the 26th of April 2019.
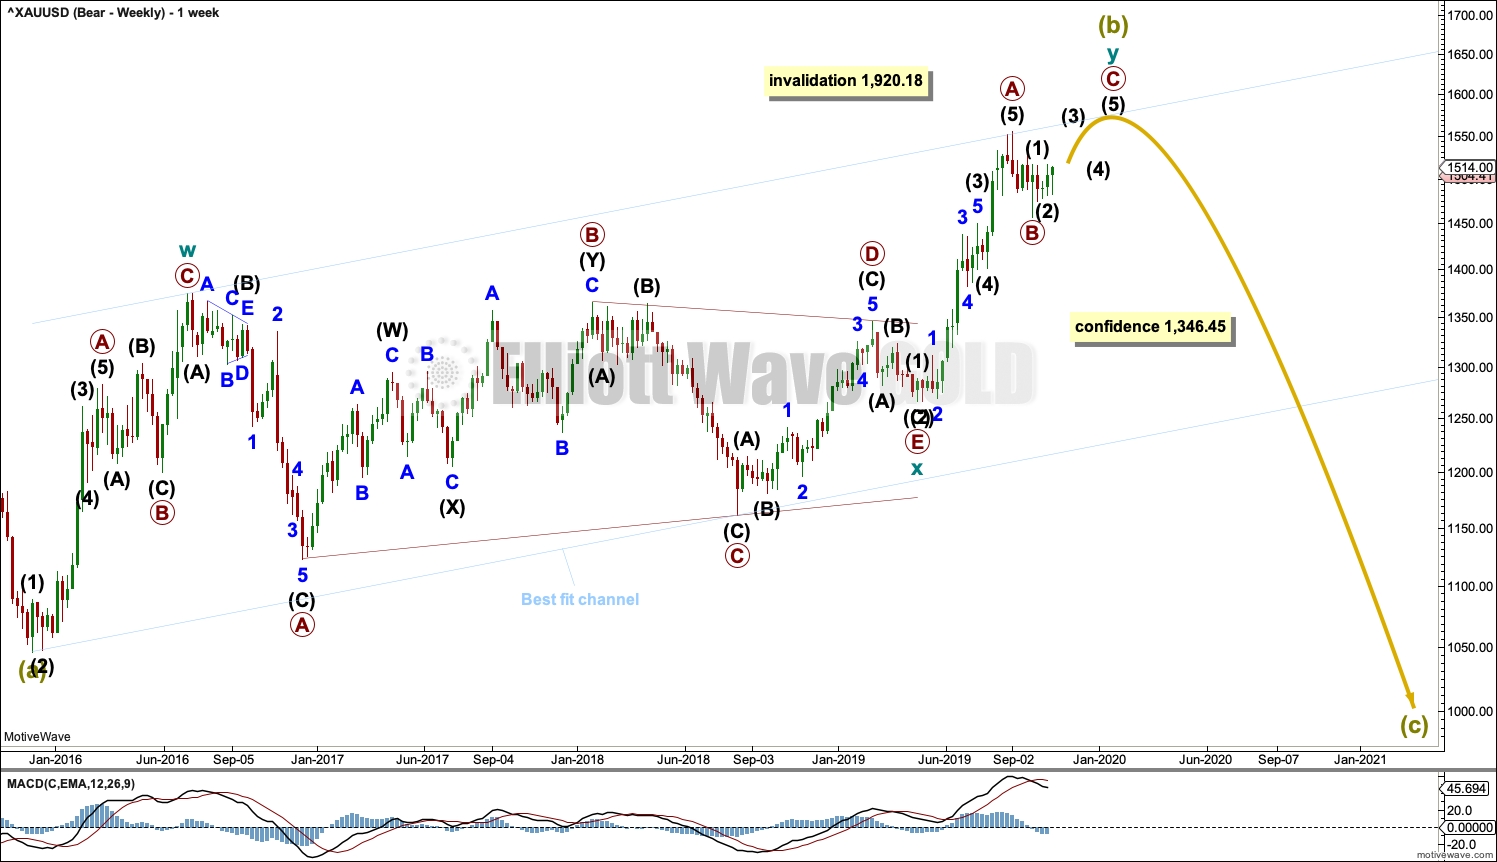
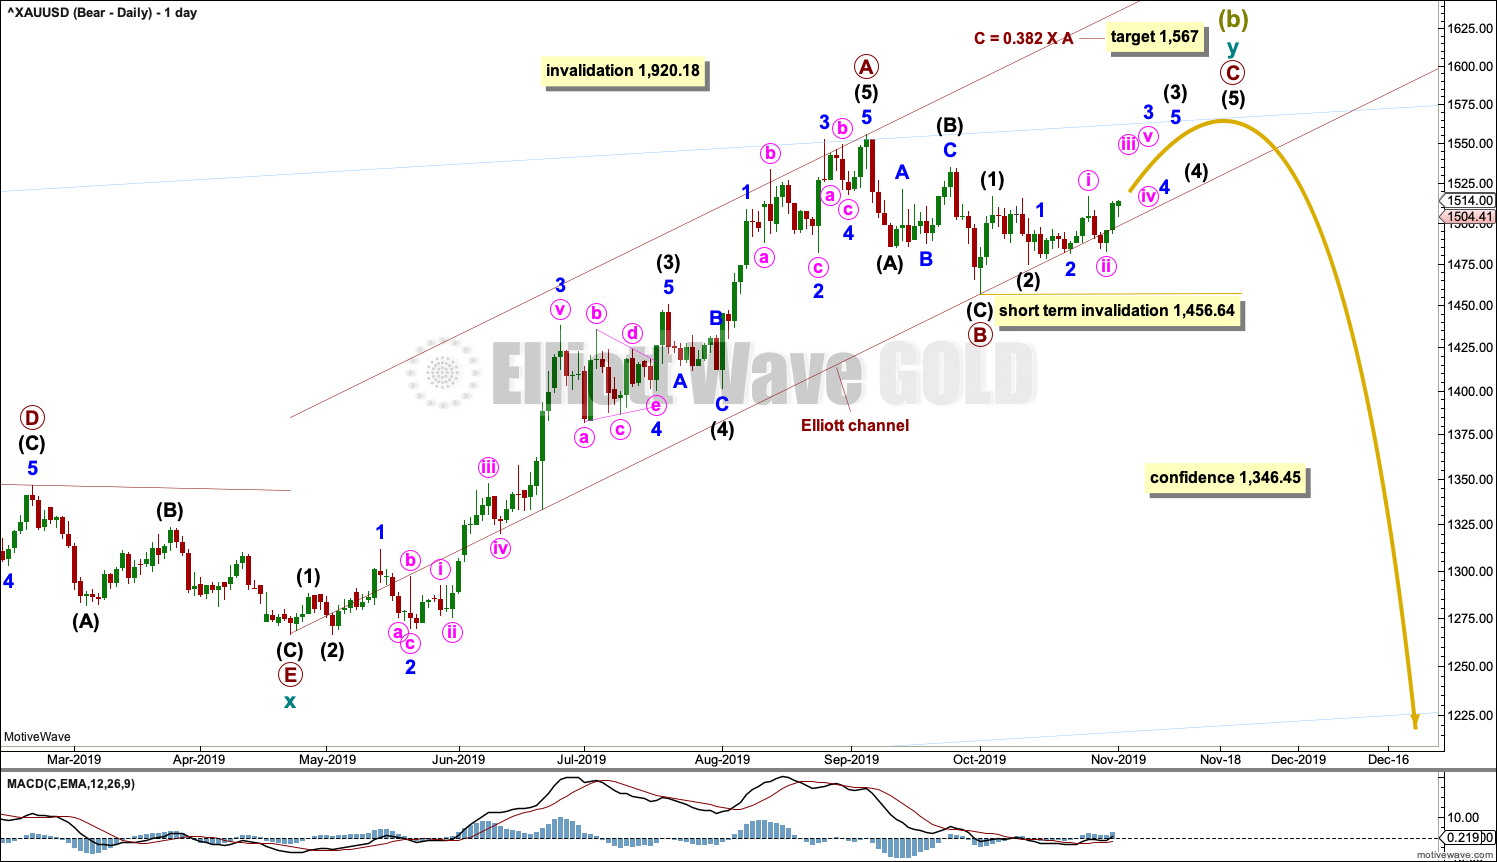
GOLD
A little upwards movement reaches resistance at the upper trend line of a small ascending triangle.
All three Elliott wave counts remain valid.
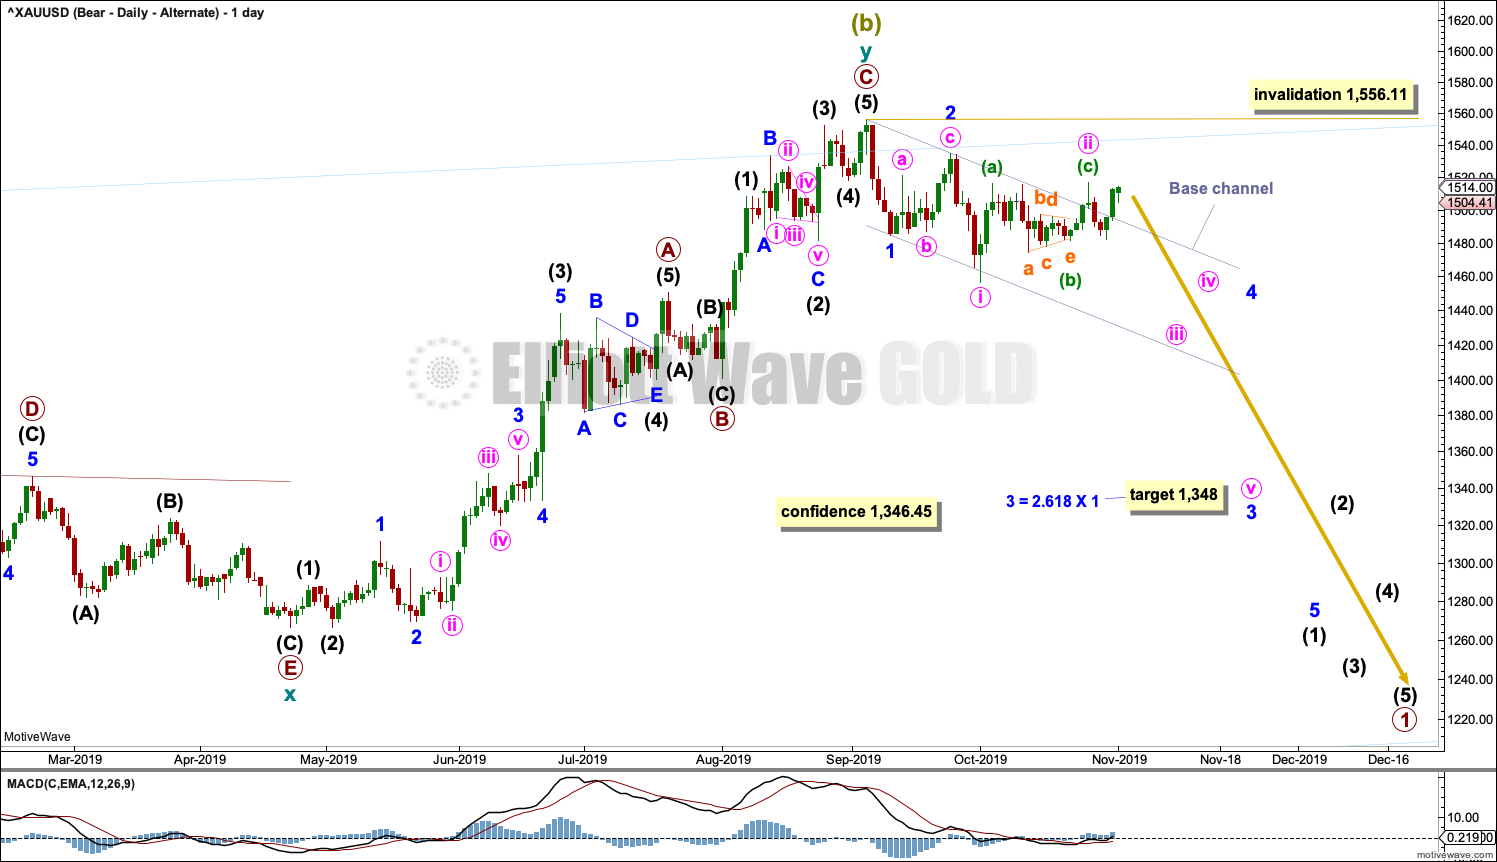
Summary: For the very short term, a new low below 1,482.52 would add confidence in a more bearish outlook. The target would be at 1,348.
For the very short term, a new high above 1,516.65 would add some confidence in a more bullish outlook. The target would then be at 1,567, 1,652 or 1,693.
Classic technical analysis suggests an ascending triangle may be continuing. An upwards breakout is expected in 8 more sessions. A target may be at 1,578.
For the bigger picture, the bearish Elliott wave count expects a new downwards trend to last one to several years may begin after one more high. The alternate bearish wave count looks at the possibility that a major high is already in. Confidence in this view may be had if price makes a new low by any amount at any time frame below 1,346.45.
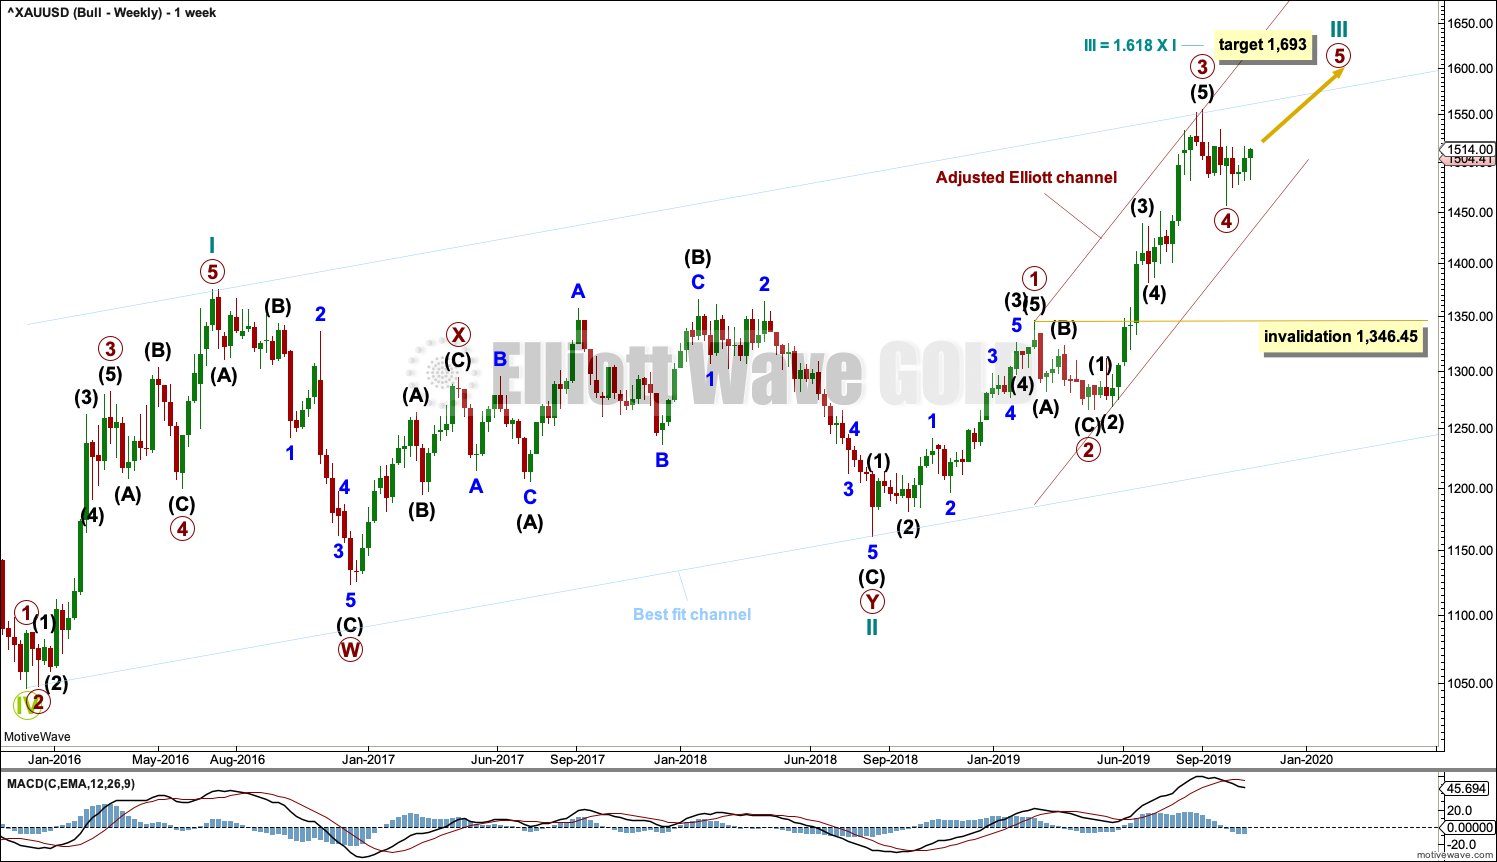
The bullish Elliott wave count expects a primary degree fourth wave has completed and the upwards trend has resumed.
Grand SuperCycle analysis is here.
Monthly charts were last published here.
BEARISH ELLIOTT WAVE COUNT
WEEKLY CHART
Click chart to enlarge.
It is possible that Super Cycle wave (b) is nearly complete as a double zigzag.
The first zigzag in the double is labelled cycle wave w. The double is joined by a three in the opposite direction, a triangle labelled cycle wave x. The second zigzag in the double is labelled cycle wave y.
The purpose of the second zigzag in a double is to deepen the correction. Cycle wave y has achieved this purpose.
A new low below 1,346.45 would add strong confidence to this wave count. At that stage, the bullish Elliott wave count would be invalidated.
A wide best fit channel is added in light blue. This channel contains all of Super Cycle wave (b) and may provide resistance and support. Copy this channel over to daily charts.
DAILY CHART
Click chart to enlarge.
This wave count exactly follows the expected pathway for Silver.
It is possible that the double zigzag for Super Cycle wave (b) may be incomplete and may yet require one more high. A target is calculated for primary wave C that expects resistance at the upper edge of the light blue best fit channel to continue.
Within cycle wave y, primary wave A may have been over at the last high. Primary wave B may now be a complete zigzag. Primary wave C may have begun. Within primary wave C, intermediate wave (2) may not move beyond the start of intermediate wave (1) below 1,456.64.
A channel is drawn about cycle wave y using Elliott’s technique for a correction. This channel is breached by some downwards movement.
It is possible to move the degree of labelling within intermediate wave (B) down one degree; intermediate wave (B) may still continue lower as a double zigzag. Within the double, wave X may be completing. If intermediate wave (B) continues lower, it would still have good proportion to intermediate wave (A). Intermediate wave (B) may not move beyond the start of intermediate wave (A) below 1,266.61.
ALTERNATE DAILY CHART
Click chart to enlarge.
Cycle wave y may be a complete zigzag. Within both of primary waves A and C, there is good proportion between intermediate waves (2) and (4). Within both of primary waves A and C, there is good alternation in structure of intermediate waves (2) and (4).
Within cycle wave y, there is no Fibonacci Ratio between primary waves A and C.
Draw a base channel on daily charts about minor waves 1 and 2. Draw the first trend line from the start of minor wave 1 to the end of minor wave 2, then place a parallel copy on the end of minor wave 1.
Gold does not always fit neatly within base channels. Occasionally, second wave corrections can be deep and time consuming and can breach base channels. This wave count remains valid. A very strong breach of the base channel reduces the probability of this wave count.
BULLISH ELLIOTT WAVE COUNT
WEEKLY CHART
Click chart to enlarge.
This wave count sees the the bear market complete at the last major low for Gold in November 2015.
If Gold is in a new bull market, then it should begin with a five wave structure upwards on the weekly chart. However, the biggest problem with this wave count is the structure labelled cycle wave I because this wave count must see it as a five wave structure, but it looks more like a three wave structure.
Commodities often exhibit swift strong fifth waves that force the fourth wave corrections coming just prior and just after to be more brief and shallow than their counterpart second waves. It is unusual for a commodity to exhibit a quick second wave and a more time consuming fourth wave, and this is how cycle wave I is labelled. This wave count still suffers from this very substantial problem, and for this reason the bearish wave count is still considered because it has a better fit in terms of Elliott wave structure.
Cycle wave II subdivides well as a double combination: zigzag – X – expanded flat.
Cycle wave III may have begun. Within cycle wave III, primary waves 1 and 2 may now be complete. Primary wave 3 has now moved above the end of primary wave 1 meeting a core Elliott wave rule. It has now moved far enough to allow room for primary wave 4 to unfold and remain above primary wave 1 price territory. Primary wave 4 may not move into primary wave 1 price territory below 1,346.45.
Cycle wave III so far for this wave count would have been underway now for 63 weeks. It exhibits some support from volume and increasing ATR. This wave count has some support from classic technical analysis.
The channel drawn about cycle wave III is an adjusted Elliott channel. The lower edge is pulled lower.
Add the wide best fit channel to weekly and daily charts.
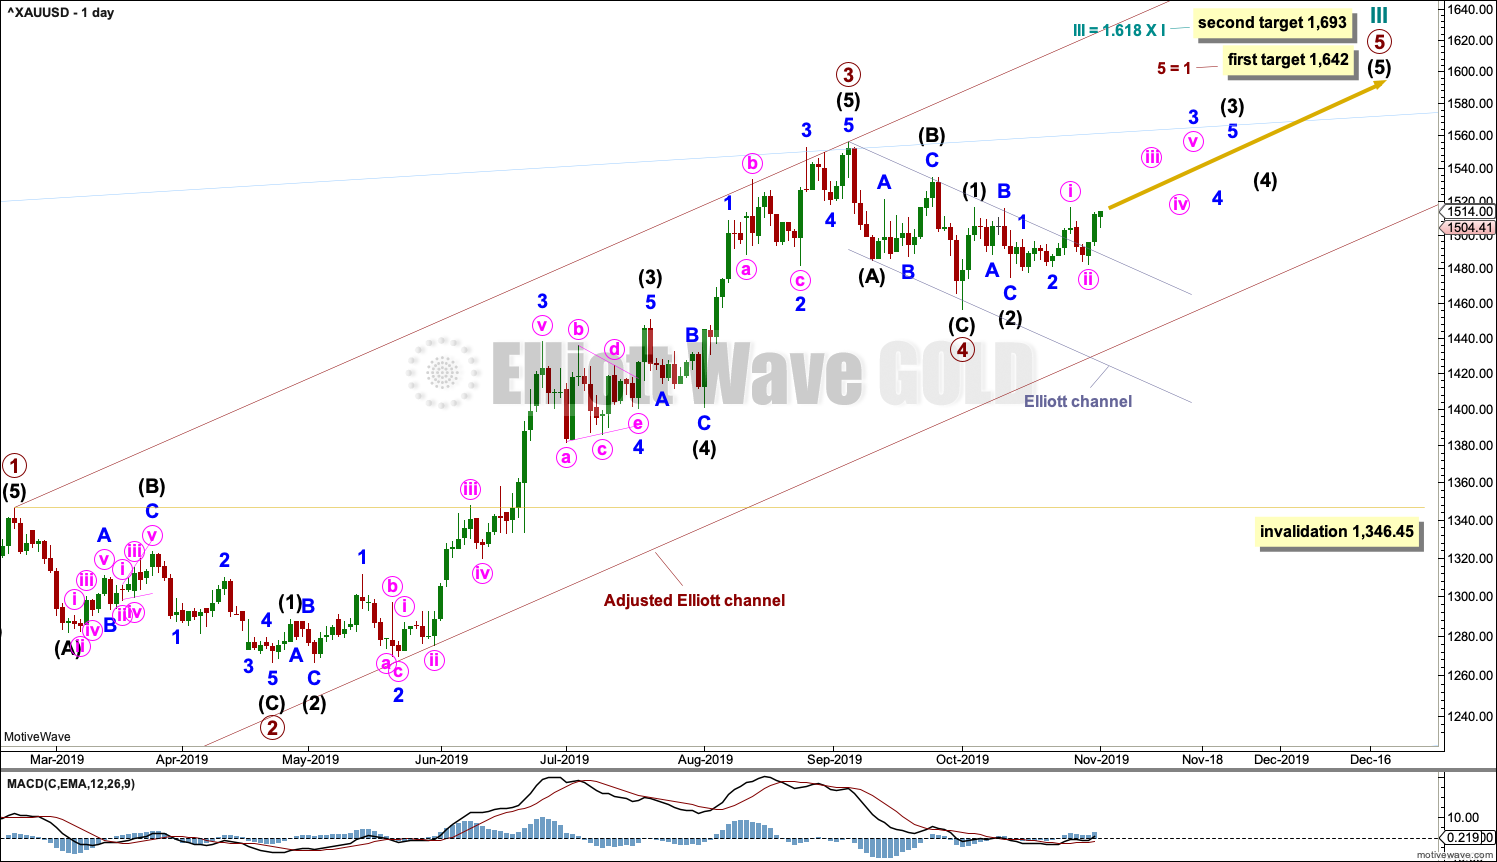
DAILY CHART
Click chart to enlarge.
Primary wave 4 is possibly complete. The structure now fits as a zigzag. It is possible that primary wave 4 could continue lower as a double zigzag. However, if primary wave 4 did continue lower, it would have to be longer in duration to primary wave 2. The proportion would not look good. This wave count would look best if primary wave 4 is over as labelled.
Primary wave 2 lasted 43 sessions. Primary wave 4 may have been over in 19 sessions. Gold’s fourth waves are often more brief in duration than its second waves; this part of the wave count has the right look.
Primary wave 4 may not move into primary wave 1 price territory below 1,346.45.
TECHNICAL ANALYSIS
MONTHLY CHART
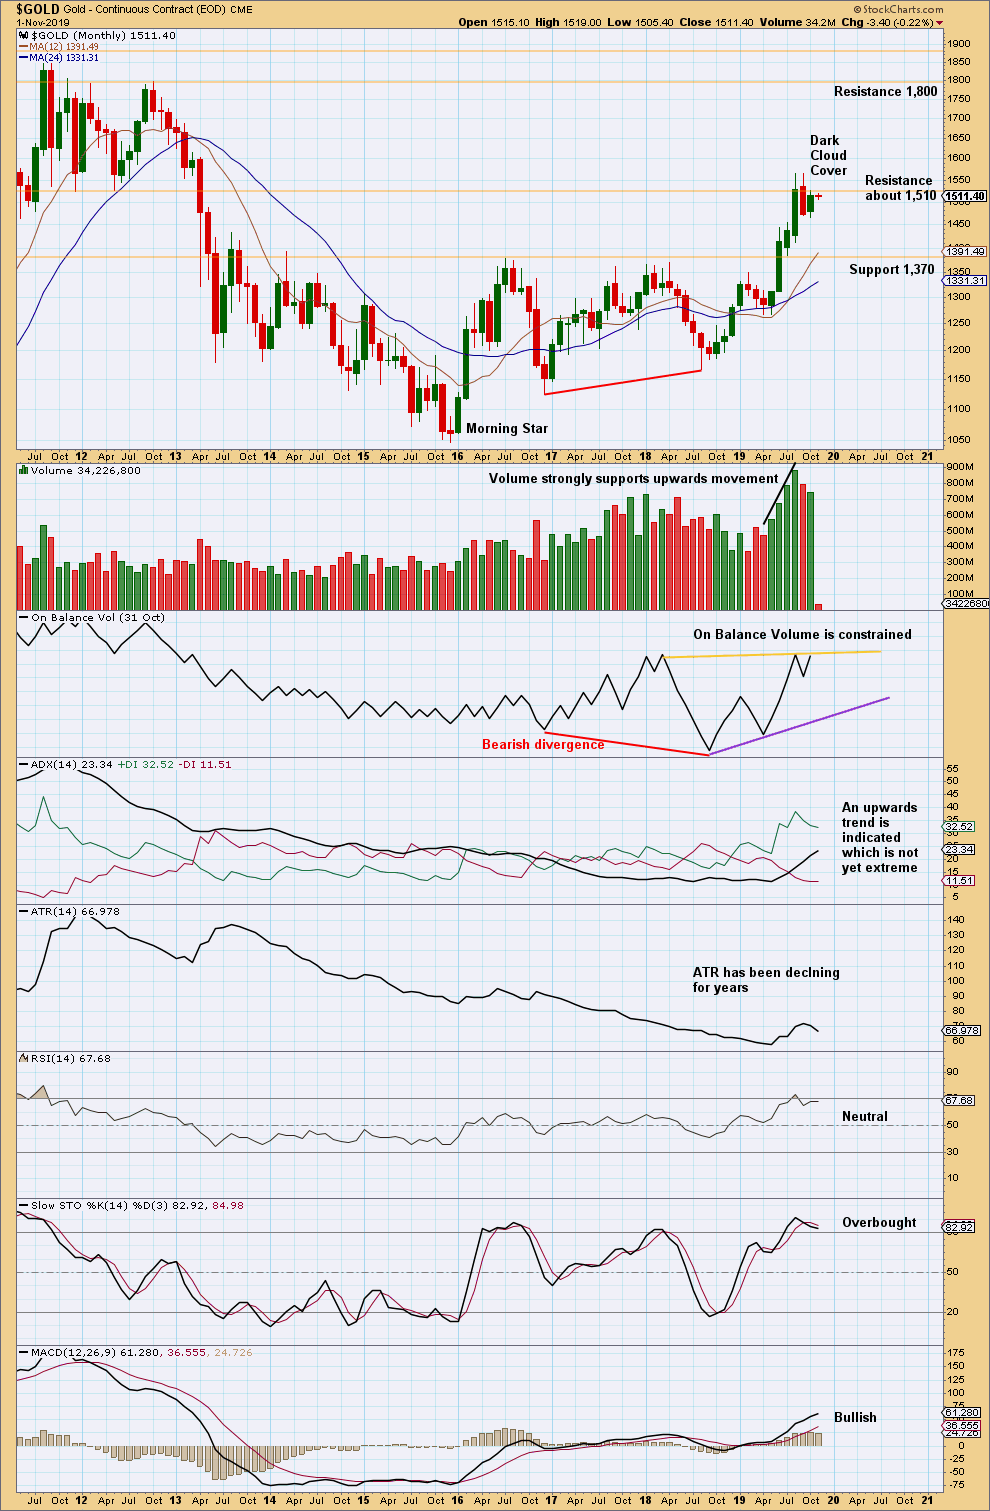
Click chart to enlarge. Chart courtesy of StockCharts.com.
Overall, this chart is bullish. However, with RSI reaching overbought at the last high, upwards movement may be limited.
The last two months of sideways movement look like a consolidation within an ongoing upwards trend.
Some suspicion regarding the current upwards trend may be warranted by bearish divergence between price and On Balance Volume at the last lows.
WEEKLY CHART
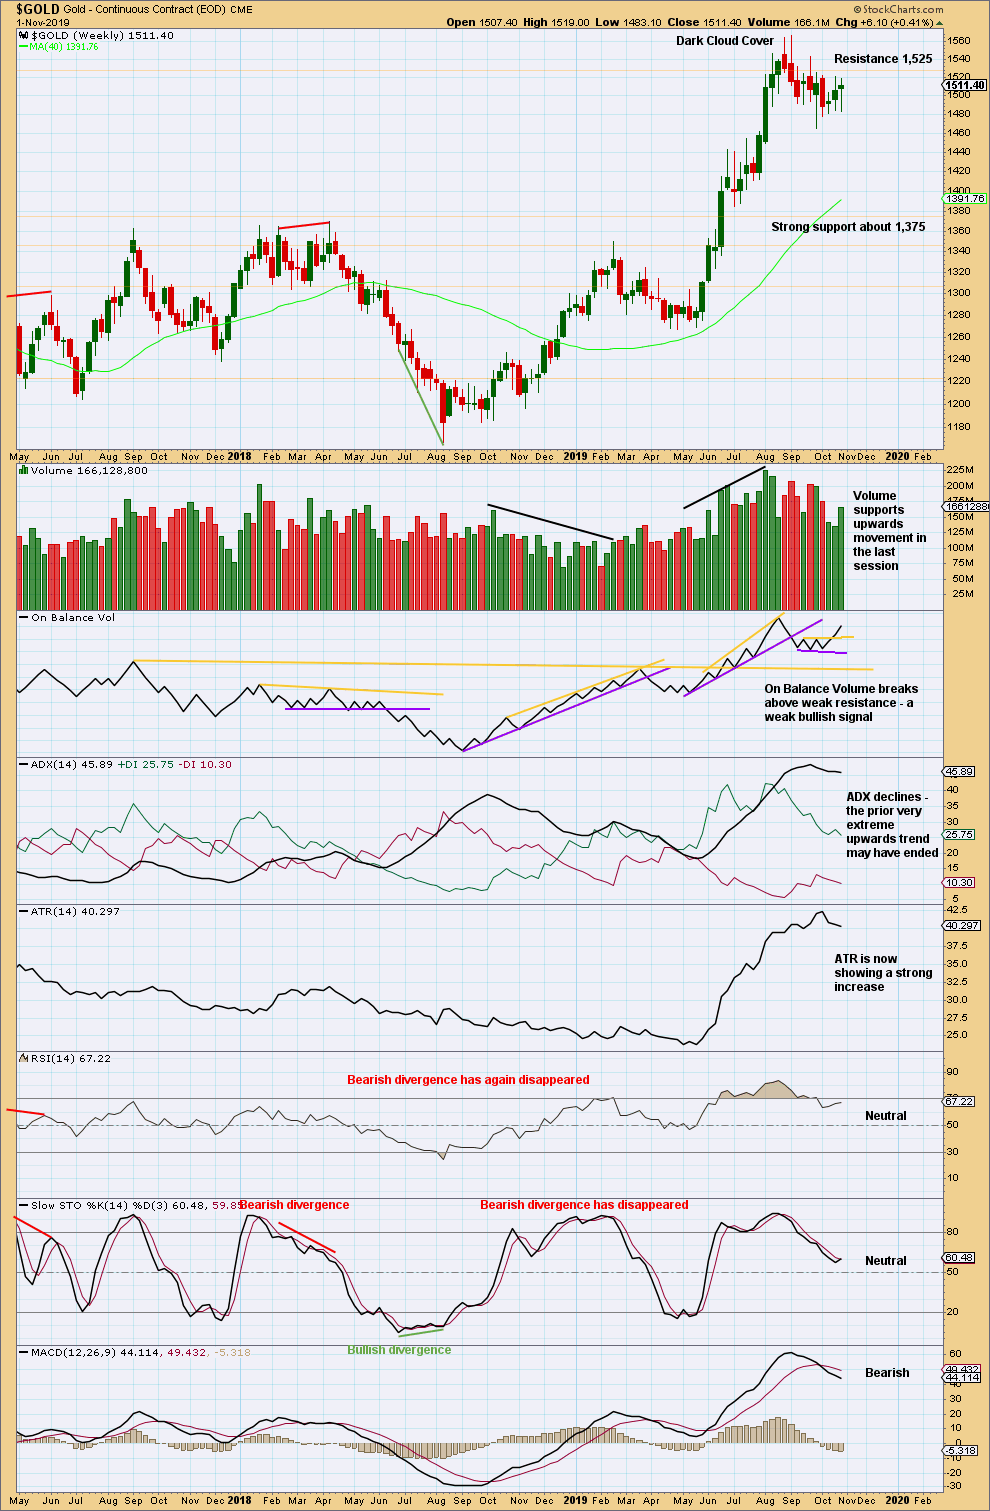
Click chart to enlarge. Chart courtesy of StockCharts.com.
When trends reach very extreme, candlestick reversal patterns should be given weight. The Dark Cloud Cover bearish reversal pattern is given more bearish weight from the long upper wick.
This pullback has brought RSI and Stochastics down from overbought and ADX down from very extreme. It looks like a high may be in place for Gold, but it is also possible that one final high may yet be seen before a major trend change.
For the short term, the picture is looking slightly more clearly bullish. Long lower wicks, support from volume for upwards movement, and a bullish signal from On Balance Volume all suggest more upwards movement just ahead.
DAILY CHART
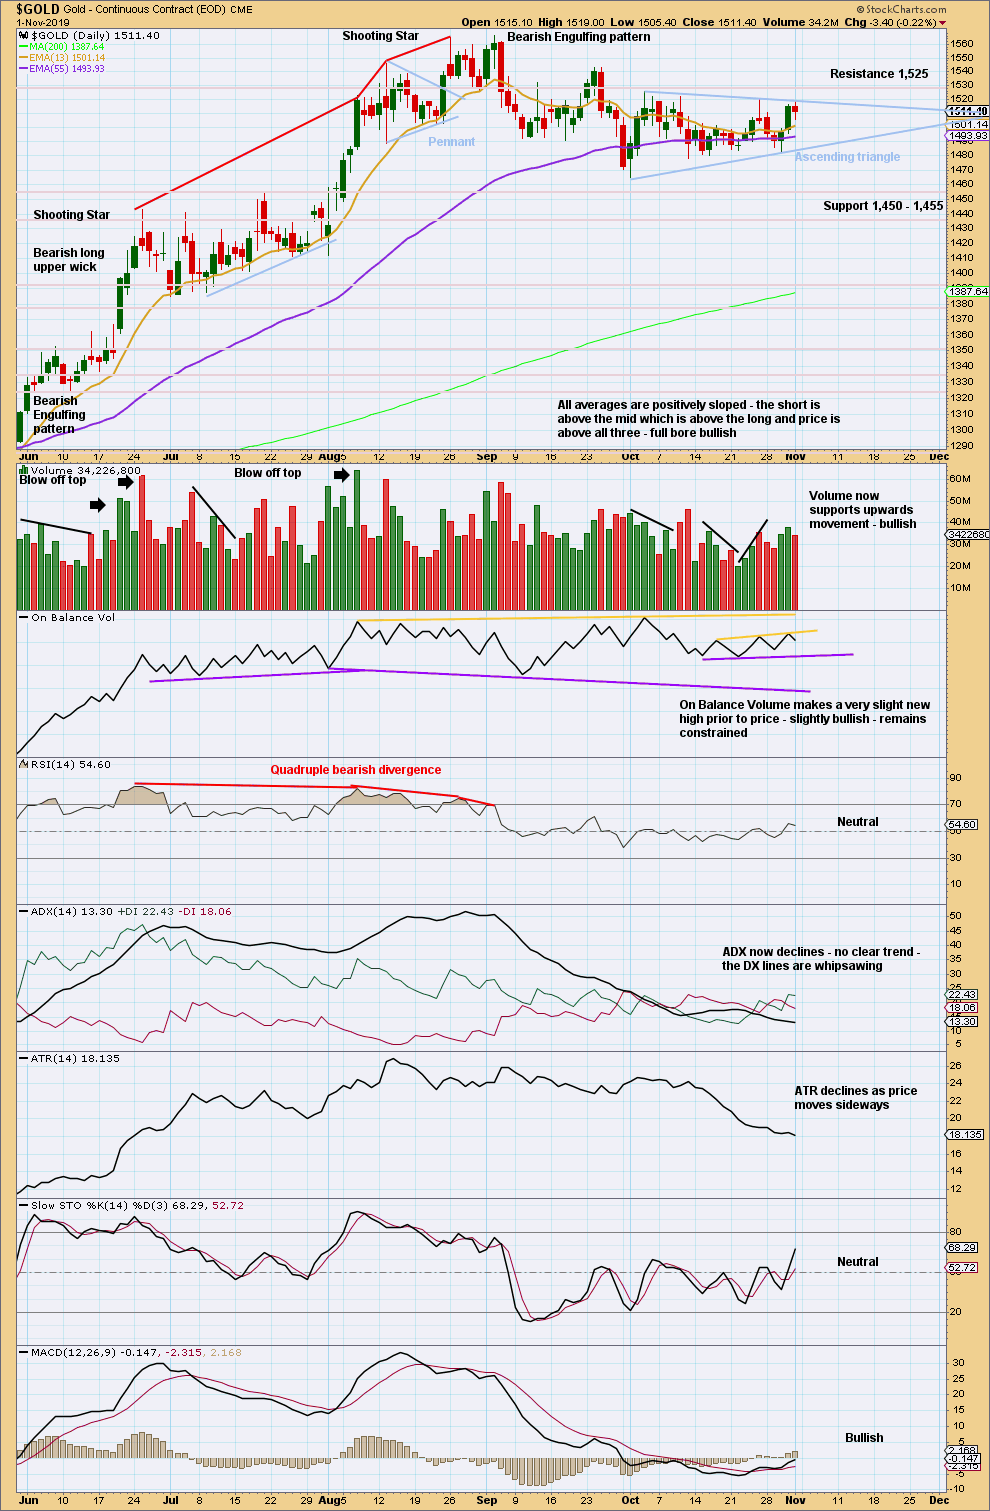
Click chart to enlarge. Chart courtesy of StockCharts.com.
Since the last high on the 4th of September, there has been a new swing low (on the 30th of September) and now a series of (so far) two lower swing lows and two lower swing highs. In conjunction with a very strong Bearish Engulfing pattern on the 5th of September and the prior upwards trend reaching very extreme, it looks like Gold may have had a trend change.
A reasonably small ascending triangle may be unfolding.
From Kirkpatrick and Dhalquist, “Technical Analysis” page 317:
“Upwards breakouts occur 77% of the time, and all breakouts usually happen roughly 61% of the distance (time) from the base to the cradle.”
A breakout may now happen in about another 9 sessions. A target would be about 1,578.
Volume and On Balance Volume support the view that an upwards breakout may occur soon.
GDX WEEKLY CHART
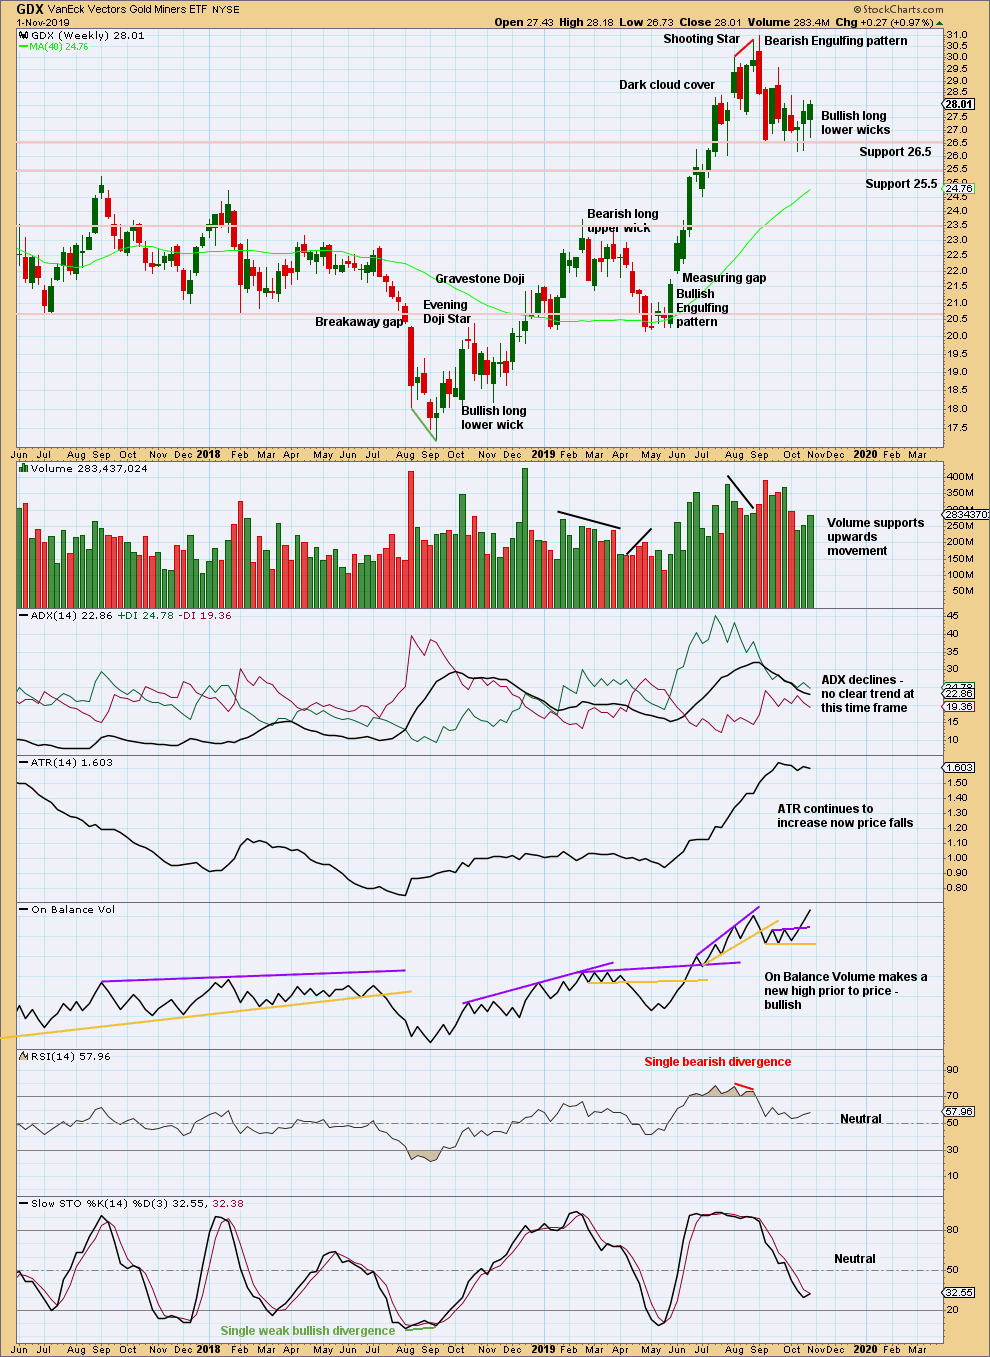
Click chart to enlarge. Chart courtesy of StockCharts.com.
The short term picture for GDX remains bullish. ADX and RSI have been bought down from extreme. There is again room for an upwards trend to continue.
GDX DAILY CHART
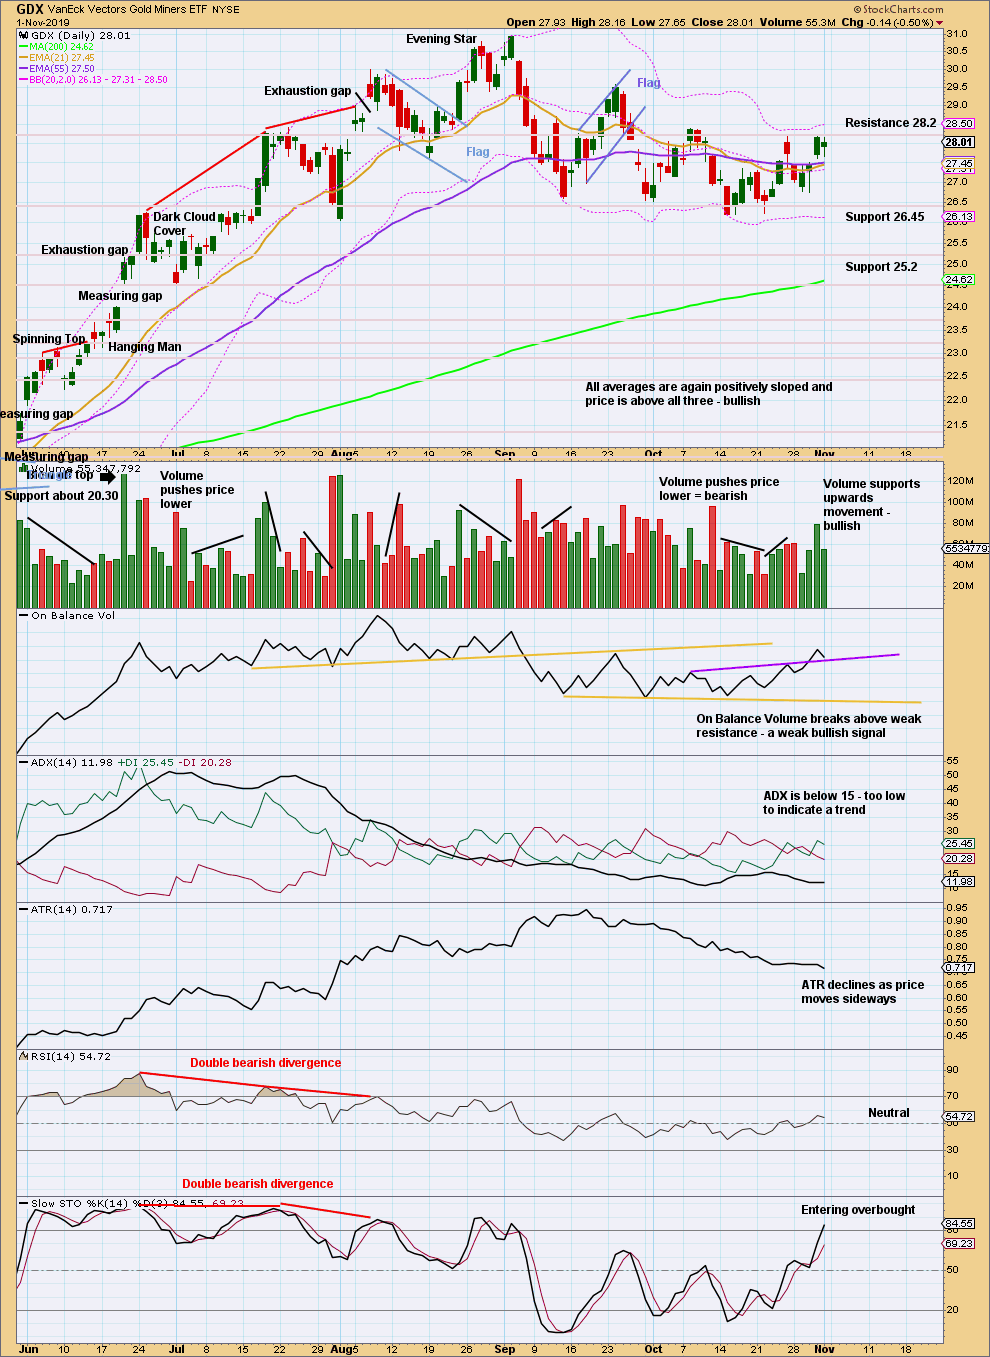
Click chart to enlarge. Chart courtesy of StockCharts.com.
There is now a series of three lower highs and three lower lows from the high on the 4th of September. It still looks like GDX may have had a trend change. This view should remain dominant while the last swing high at 28.38 on the 8th of October remains intact.
GDX continues to look bullish for the very short term. Upwards movement may be expected as fairly likely next week.
US OIL
Overall, more upwards movement was expected for the week. Again, this is what has happened.
Summary: The bearish wave count looks most likely to follow a triangle pattern here, with an upwards swing to end short of the upper A-C trend line.
The bullish wave count now also expects a triangle to complete before an upwards breakout.
At this stage, all three Elliott wave counts now expect upwards movement next week.
MAIN ELLIOTT WAVE COUNT – BEARISH
MONTHLY CHART
Click chart to enlarge.
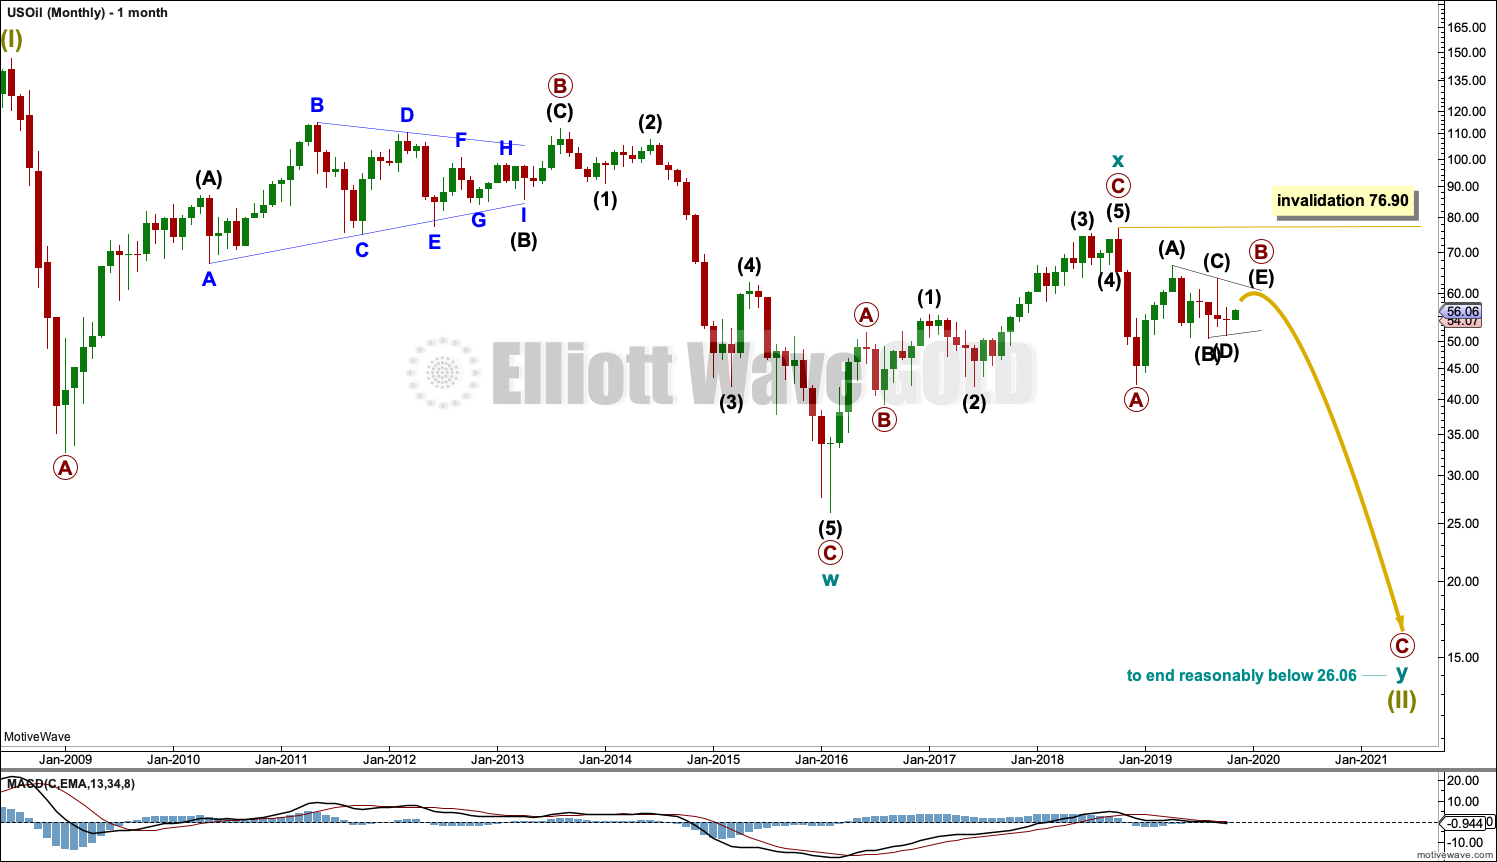
The basic Elliott wave structure is five steps forward and three steps back. This Elliott wave count expects that US Oil is still within a three steps back pattern, which began in July 2008. The Elliott wave count expects that the bear market for US Oil continues.
This Elliott wave corrective structure is a double zigzag, which is a fairly common structure. The correction is labelled Super Cycle wave (II).
The first zigzag in the double is complete and labelled cycle wave y. The double is joined by a three in the opposite direction labelled cycle wave x, which subdivides as a zigzag. The second zigzag in the double may now have begun, labelled cycle wave w.
The purpose of a second zigzag in a double zigzag is to deepen the correction when the first zigzag does not move price deep enough. To achieve this purpose cycle wave y may be expected to move reasonably below the end of cycle wave w at 26.06. When primary wave B may be complete then the start of primary wave C may be known and a target may be calculated.
Cycle wave y is expected to subdivide as a zigzag, which subdivides 5-3-5.
Cycle wave w lasted 7.6 years and cycle wave x lasted 2.7 years. Cycle wave y may be expected to last possibly about a Fibonacci 5 or 8 years.
Primary wave B may not move beyond the start of primary wave A above 76.90.
WEEKLY CHART
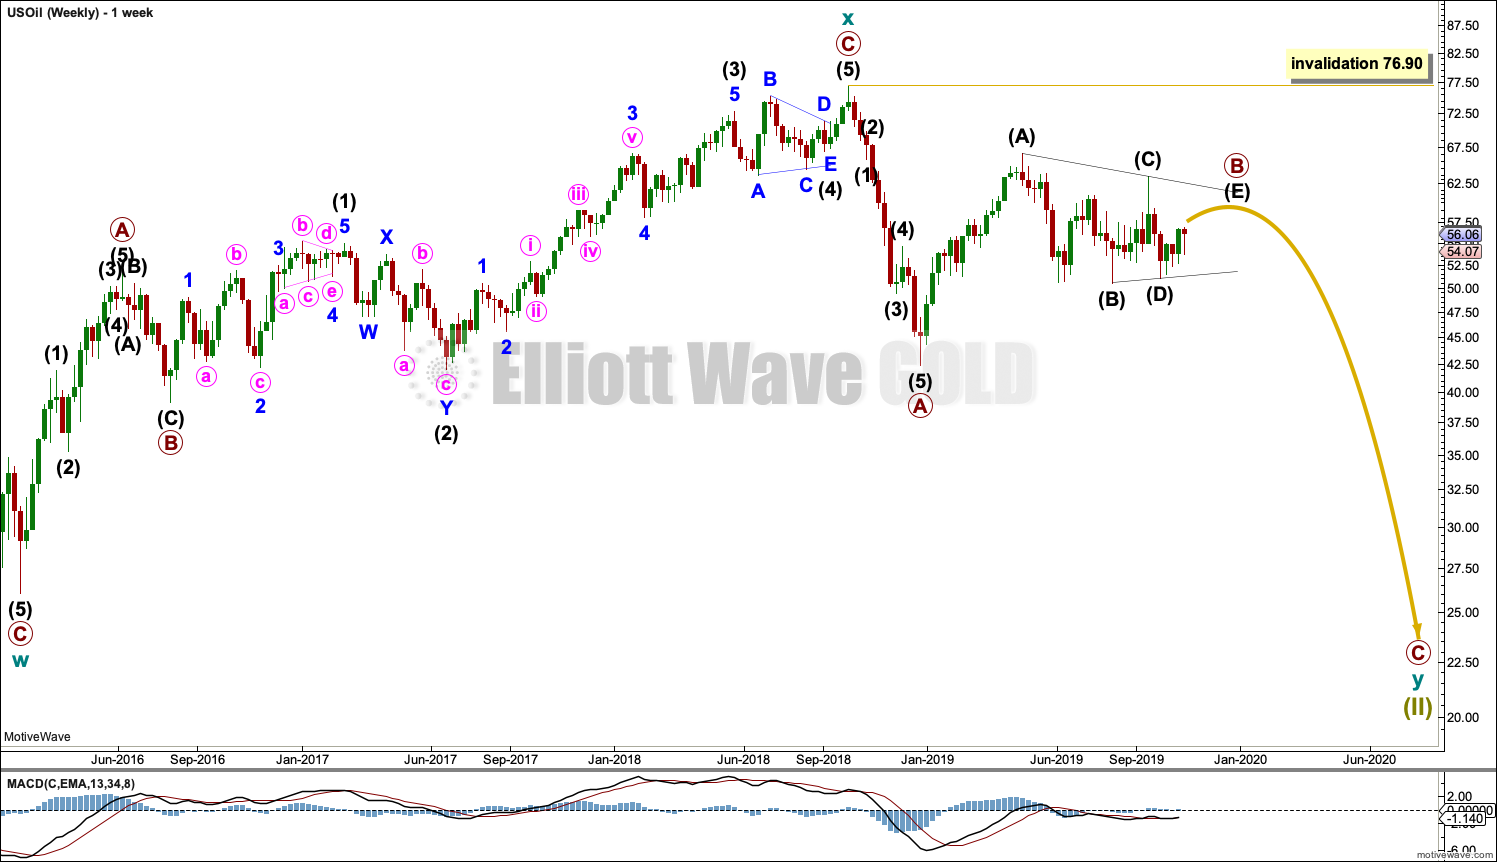
Click chart to enlarge.
This weekly chart shows all of cycle waves x and y so far.
Cycle wave y is expected to subdivide as a zigzag. A zigzag subdivides 5-3-5. Primary wave A must subdivide as a five wave structure if this wave count is correct.
Primary wave A may be a complete five wave impulse at the last low.
Primary wave B may now be continuing further as a triangle or combination. Both ideas are outlined in daily charts below, and a triangle is labelled on the weekly chart.
When primary wave B may be complete, then a downwards breakout would be expected for primary wave C.
Primary wave B may not move beyond the start of primary wave A above 76.90.
DAILY CHART
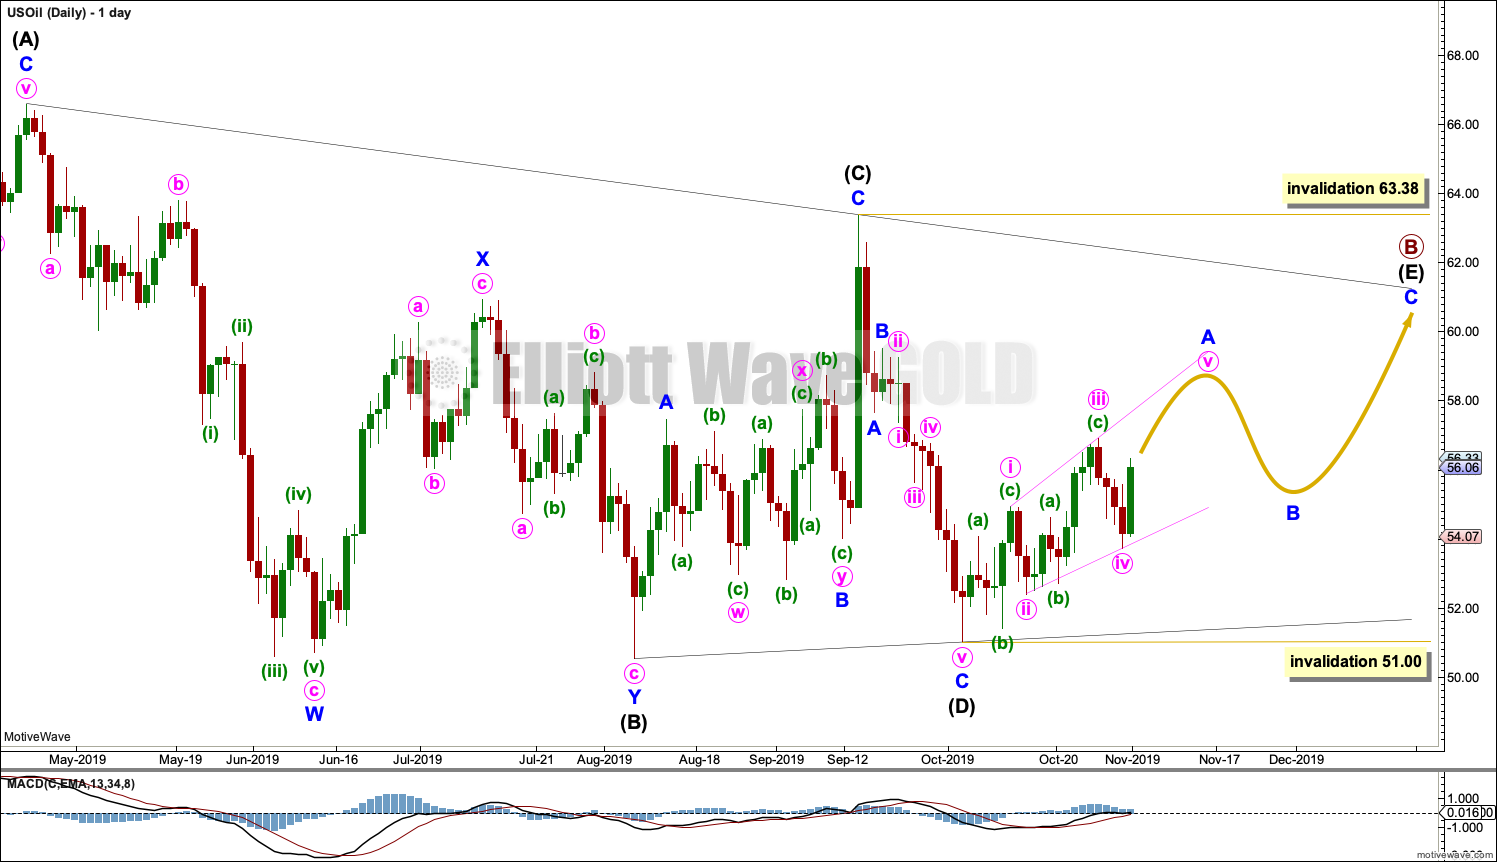
Click chart to enlarge.
Note that monthly and weekly charts are on a semi-log scale, but the daily charts are on an arithmetic scale. This makes a slight difference to trend channels.
Elliott wave triangles are always continuation patterns. When primary wave B is complete, then a downwards breakout would be expected for primary wave C.
This chart considers a triangle for primary wave B. The triangle may be a regular contracting triangle.
Within a contracting triangle: intermediate wave (C) may not move beyond the end of intermediate wave (A); intermediate wave (D) may not move beyond the end of intermediate wave (B); intermediate wave (E) may not move beyond the end of intermediate wave (C) above 63.38, and would most likely fall short of the (A)-(C) trend line.
Within this contracting triangle, intermediate wave (D) now looks complete. The final sub-wave of intermediate wave (E) looks likely now to be underway. Within the zigzag of intermediate wave (E), minor wave B may not move beyond the start of minor wave A below 51.90.
Intermediate wave (E) must complete as a zigzag, subdividing as a 5-3-5 structure. When minor wave A upwards may be complete, then a pullback or sideways consolidation should unfold over several days for minor wave B.
Minor wave A may subdivide as either an impulse or leading diagonal. Overlapping so far suggests a leading diagonal. Within a leading diagonal, minute waves i, iii and v most commonly subdivide as zigzags although they may sometimes appear to be impulses. Minute waves ii and iv may only subdivide as zigzags.
This diagonal may be expanding. If minute wave iv is over as labelled and does not continue any lower, then minute wave v should be longer than equality in length with minute wave iii at 58.24.
DAILY CHART II
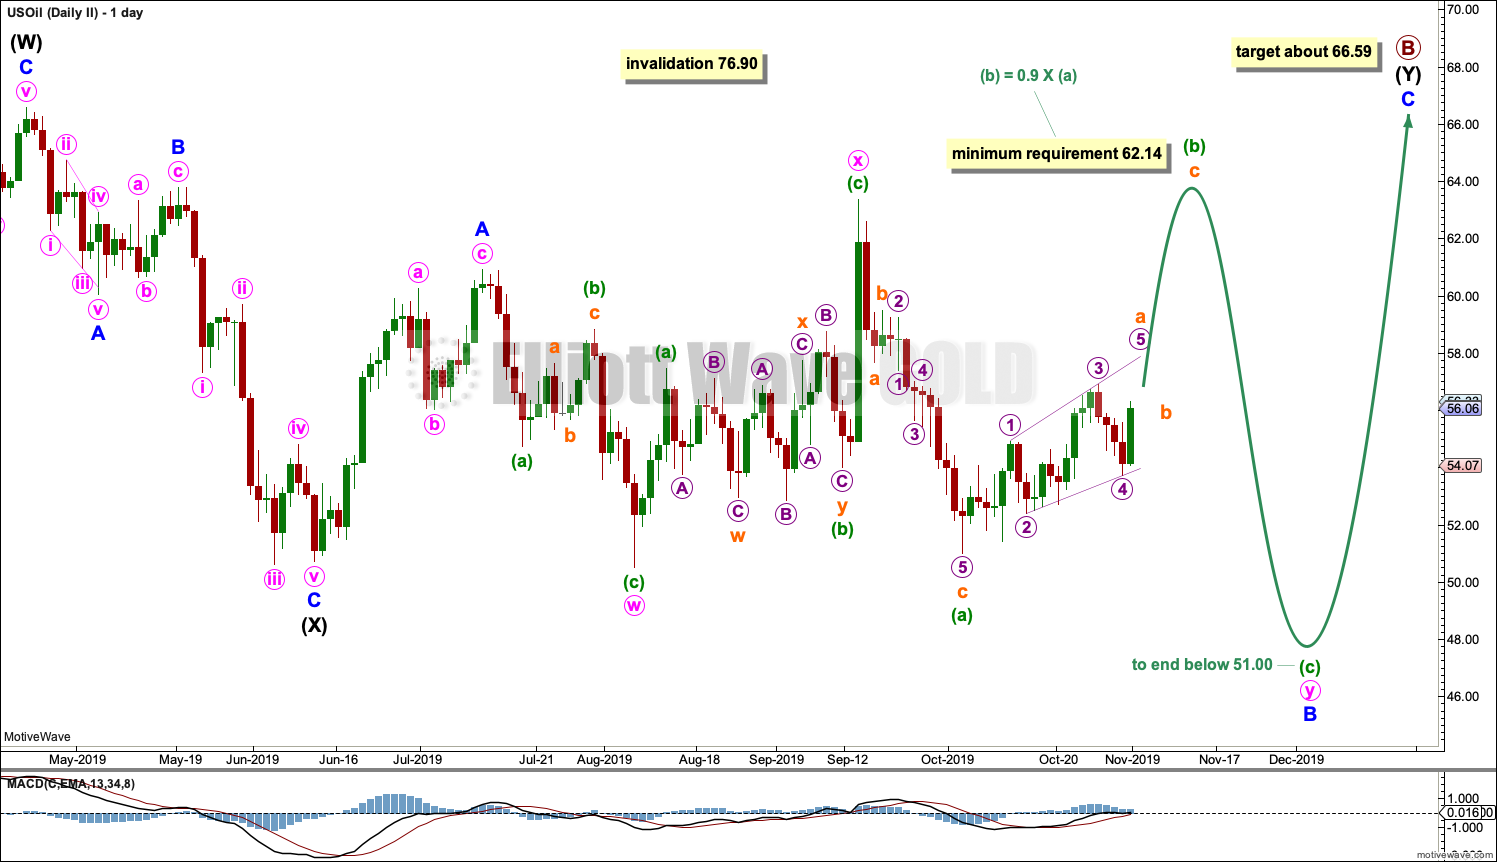
Click chart to enlarge.
When an Elliott wave triangle is considered, it is essential that alternates are also considered. Too many times an Elliott wave triangle may look to be completing only for the structure to be invalidated; the correction turns out to be something else, and the something else is almost always a combination.
Primary wave B may be a double combination: zigzag – X – flat. Intermediate wave (W) fits as a zigzag. Intermediate wave (Y) may be unfolding as a flat correction.
Within intermediate wave (Y), minor wave A may be complete. Minor wave B may be an incomplete double combination.
Within minor wave B, minute wave w may be a complete zigzag. Minute wave x may join the double in the opposite direction as a zigzag. Minute wave y may now continue as a flat correction.
Within minute wave y, minuette wave (b) must subdivide as a corrective structure and must retrace a minimum 0.9 length of minuette wave (a) at 62.14 or higher.
When minuette wave (b) has met the minimum requirement and may be a complete corrective structure, then minuette wave (c) may begin and unfold lower to end below the end of minuette wave (a) at 51.00 to avoid a truncation.
The purpose of double combinations is to take up time and move price sideways. To achieve this purpose the second structure in the double usually ends about the same level as the first.
ALTERNATE ELLIOTT WAVE COUNT
MONTHLY CHART
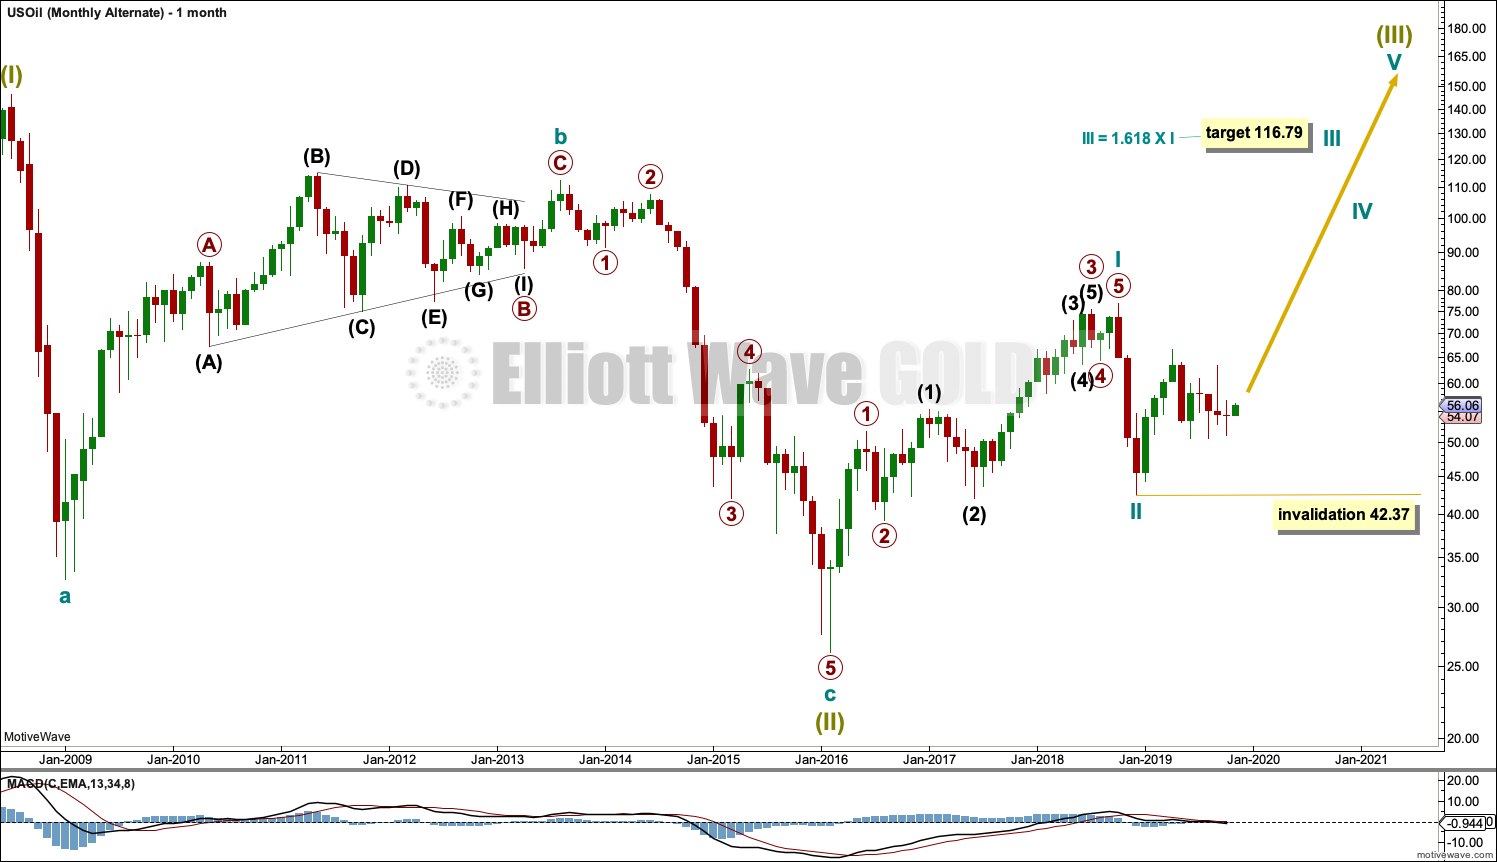
Click chart to enlarge.
It is possible that the bear market is over for Oil and a new bull market has begun.
For a bullish wave count for Oil, the upwards wave from the major low at 26.06 in February 2016 must be seen as a complete five wave impulse. This is labelled cycle wave I.
Cycle wave II may be a complete zigzag at 0.679 the depth of cycle wave I.
A target is calculated for cycle wave III to reach a common Fibonacci ratio to cycle wave I.
Within cycle wave III, no second wave correction may move beyond the start of its first wave below 42.37.
WEEKLY CHART
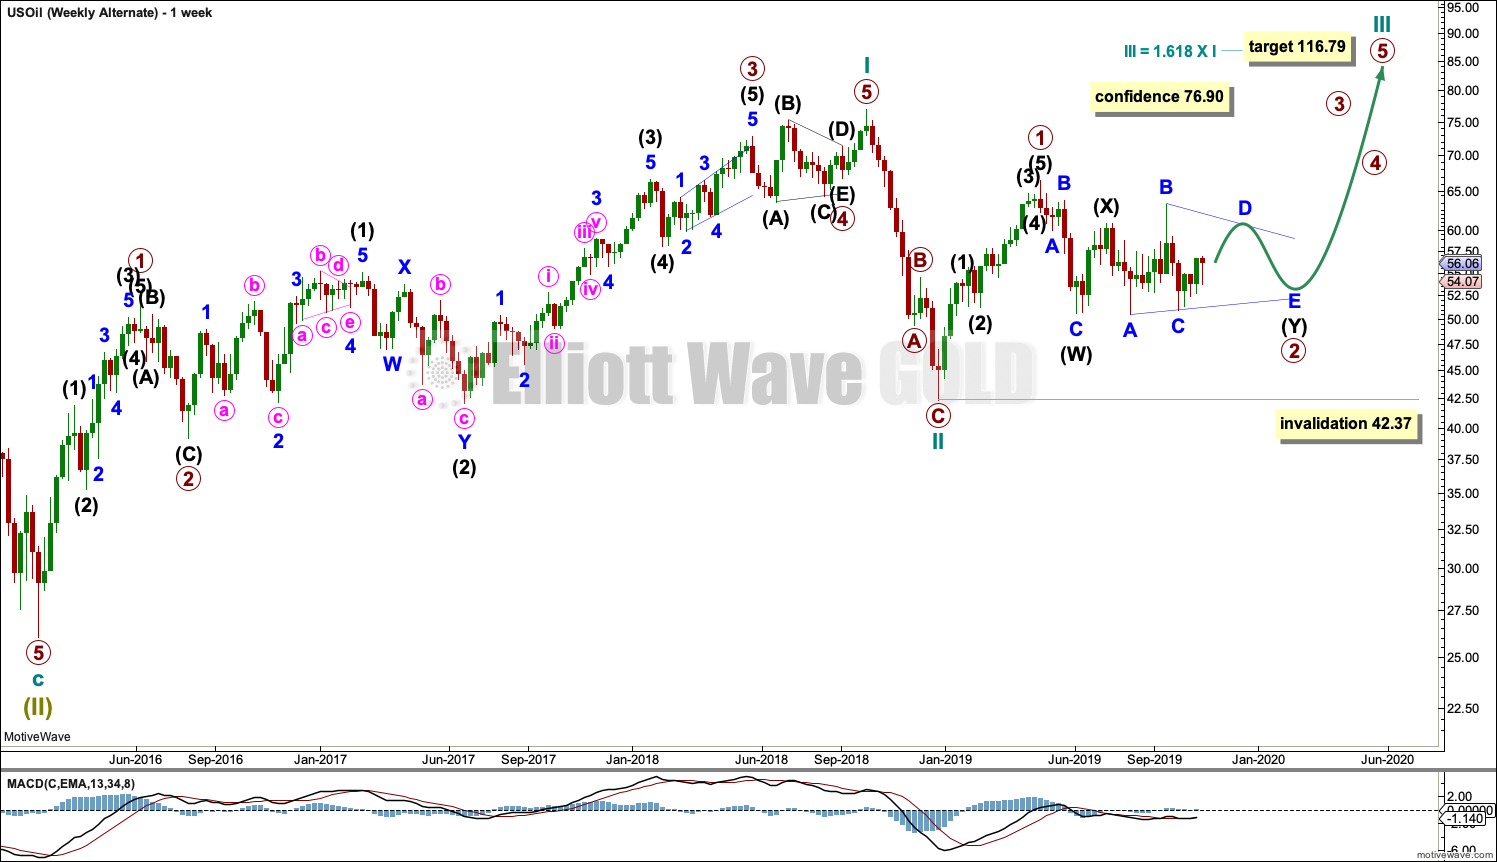
Click chart to enlarge.
This weekly chart shows detail of cycle wave I as a five wave impulse.
Cycle wave II does look best as a three. This is the only part of this wave count that has a better look than the main wave count, which sees this downwards wave as a five.
The upwards wave of primary wave 1 within cycle wave III must be seen as a five wave structure for a bullish wave count to work. This movement at lower time frames does not subdivide well as a five; this reduces the probability of this wave count.
Cycle wave III may only subdivide as an impulse. Within cycle wave III, so far primary wave 1 may be complete. Primary wave 2 may be moving lower as a double combination. Primary wave 2 may not move beyond the start of primary wave 1 below 42.37.
DAILY CHART
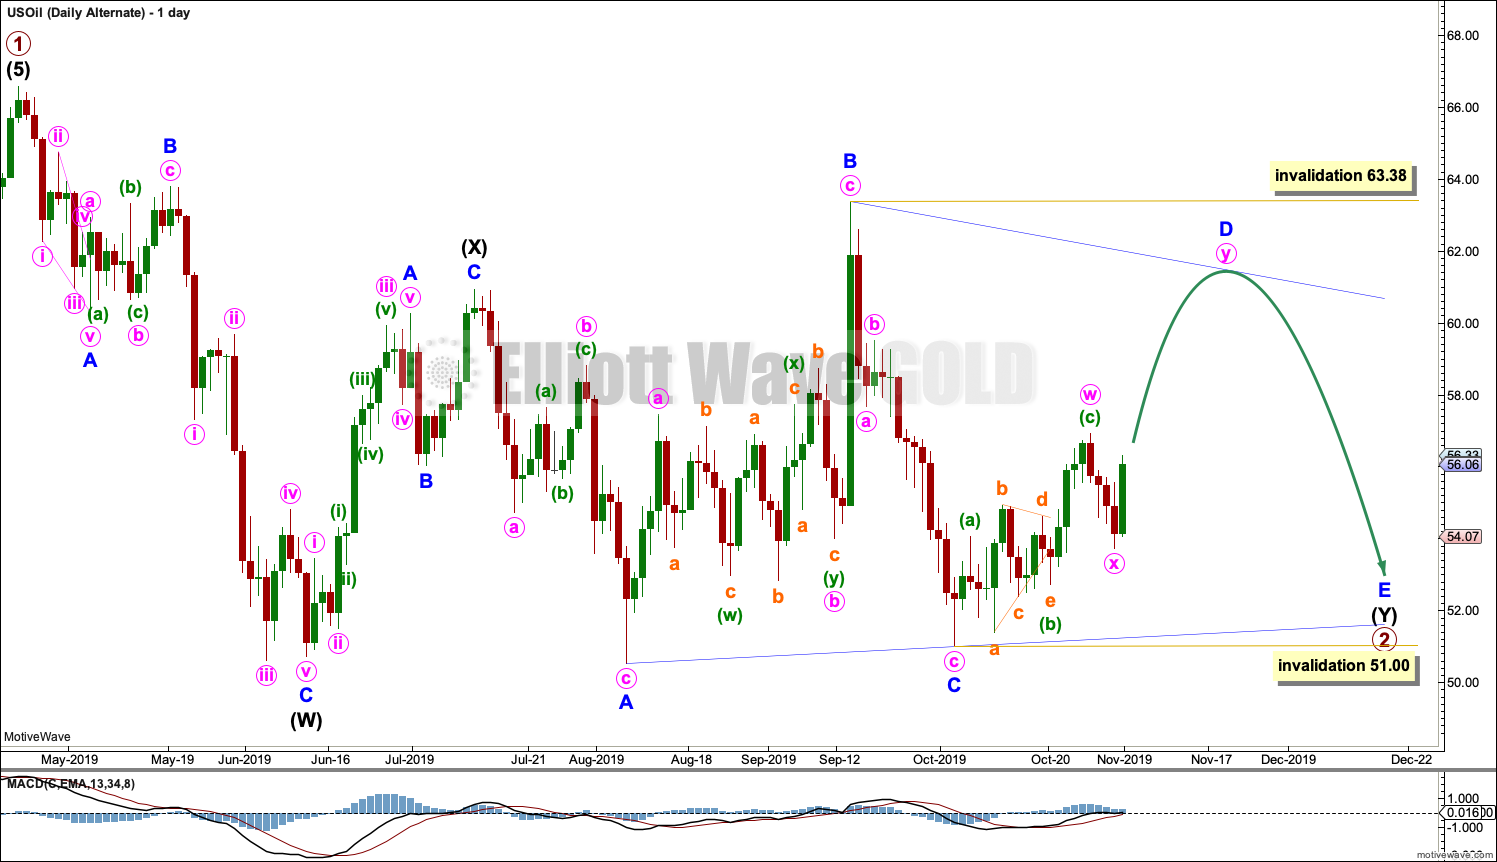
Click chart to enlarge.
Primary wave 2 may be continuing lower as a double combination.
The first structure in the double would be complete, a zigzag labelled intermediate wave (W). Within intermediate wave (W), minor wave C ends with a slight truncation for minute wave v. This is acceptable.
The double may be now joined by a complete three in the opposite direction, a zigzag labelled intermediate wave (X).
Intermediate wave (Y) may now be completing as a running contracting or barrier triangle.
Within the triangle of intermediate wave (Y), minor waves A, B and C may be complete.
Within a contracting triangle, minor wave D may not move beyond the end of minor wave B above 63.38.
Within a barrier triangle, minor wave D should end about the same level as minor wave B at 63.38, so that the B-D trend line looks essentially flat. In practice this means minor wave D may end very slightly above the end of minor wave B and the triangle may remain valid.
Minor wave D may be subdividing as a double zigzag. One of the five sub-waves of a triangle normally subdivides as a more complicated multiple; wave D is the most likely to do so.
Finally, for both a contracting and barrier triangle, minor wave E may not move beyond the end of minor wave C below 51.00.
Primary wave 2 may not move beyond the start of primary wave 1 below 42.37.
When the structure of primary wave 2 may be complete for this bullish wave count, then an upwards breakout would be expected.
TECHNICAL ANALYSIS
MONTHLY CHART
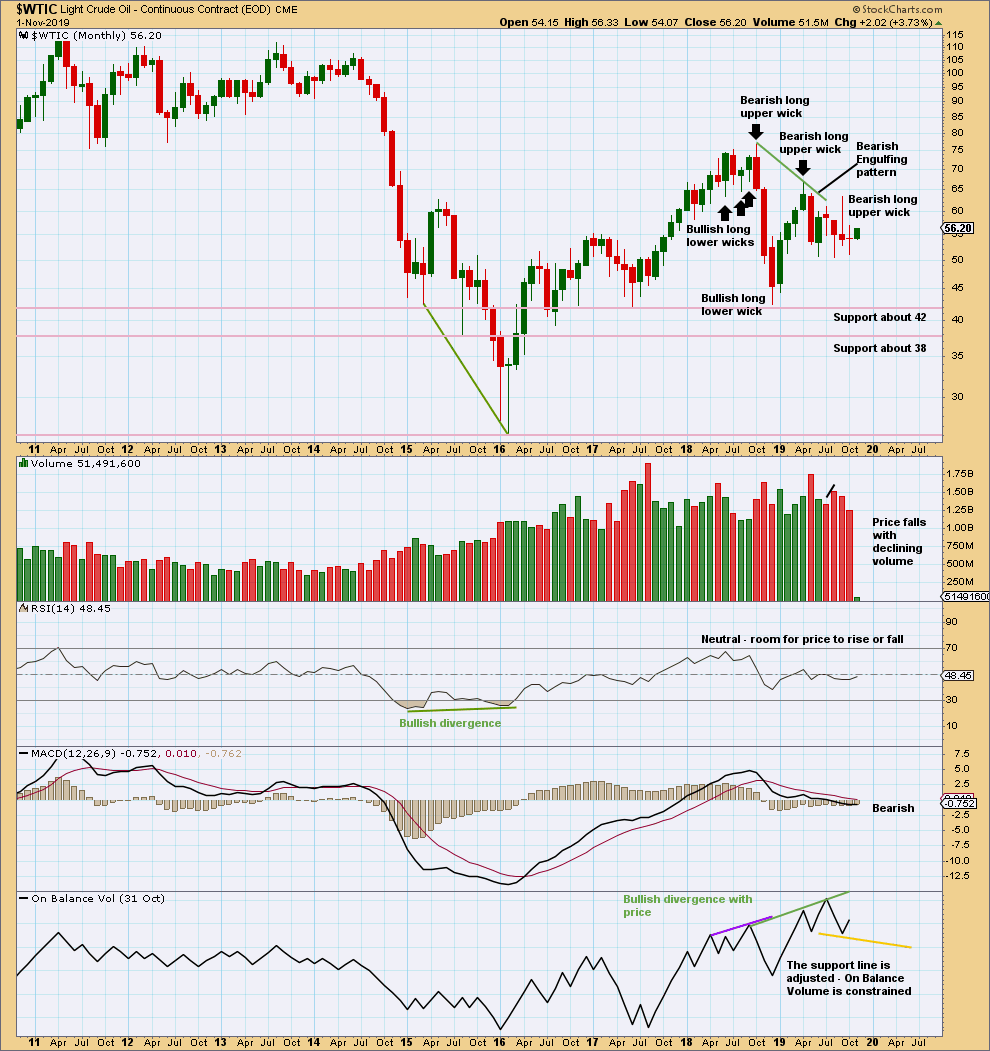
Click chart to enlarge. Chart courtesy of StockCharts.com.
September has closed with a very long upper wick. This is very bearish. This supports the main Elliott wave count.
There is now double bullish divergence between price and On Balance Volume. This supports the alternate Elliott wave count.
October continues sideways movement as a small doji.
WEEKLY CHART
Click chart to enlarge. Chart courtesy of StockCharts.com.
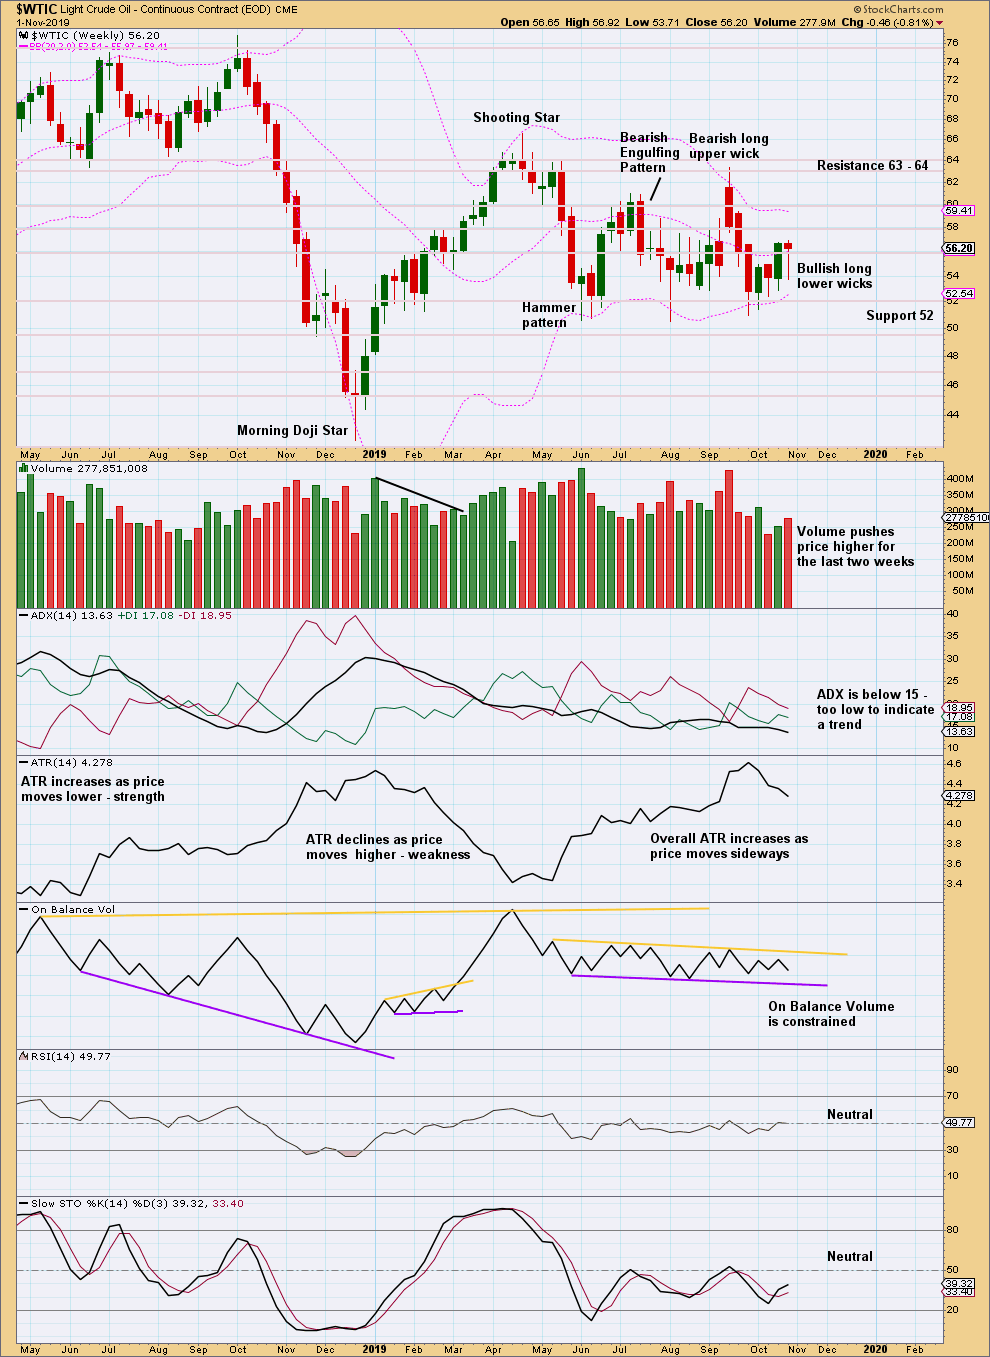
Price is back within a consolidation zone with resistance about 64 and support about 50. On Balance Volume is also range bound. A breakout is required for confidence in a new trend.
Upwards movement continues with support from volume and bullish long lower wicks. For the very short term, more upwards movement here looks most likely.
DAILY CHART
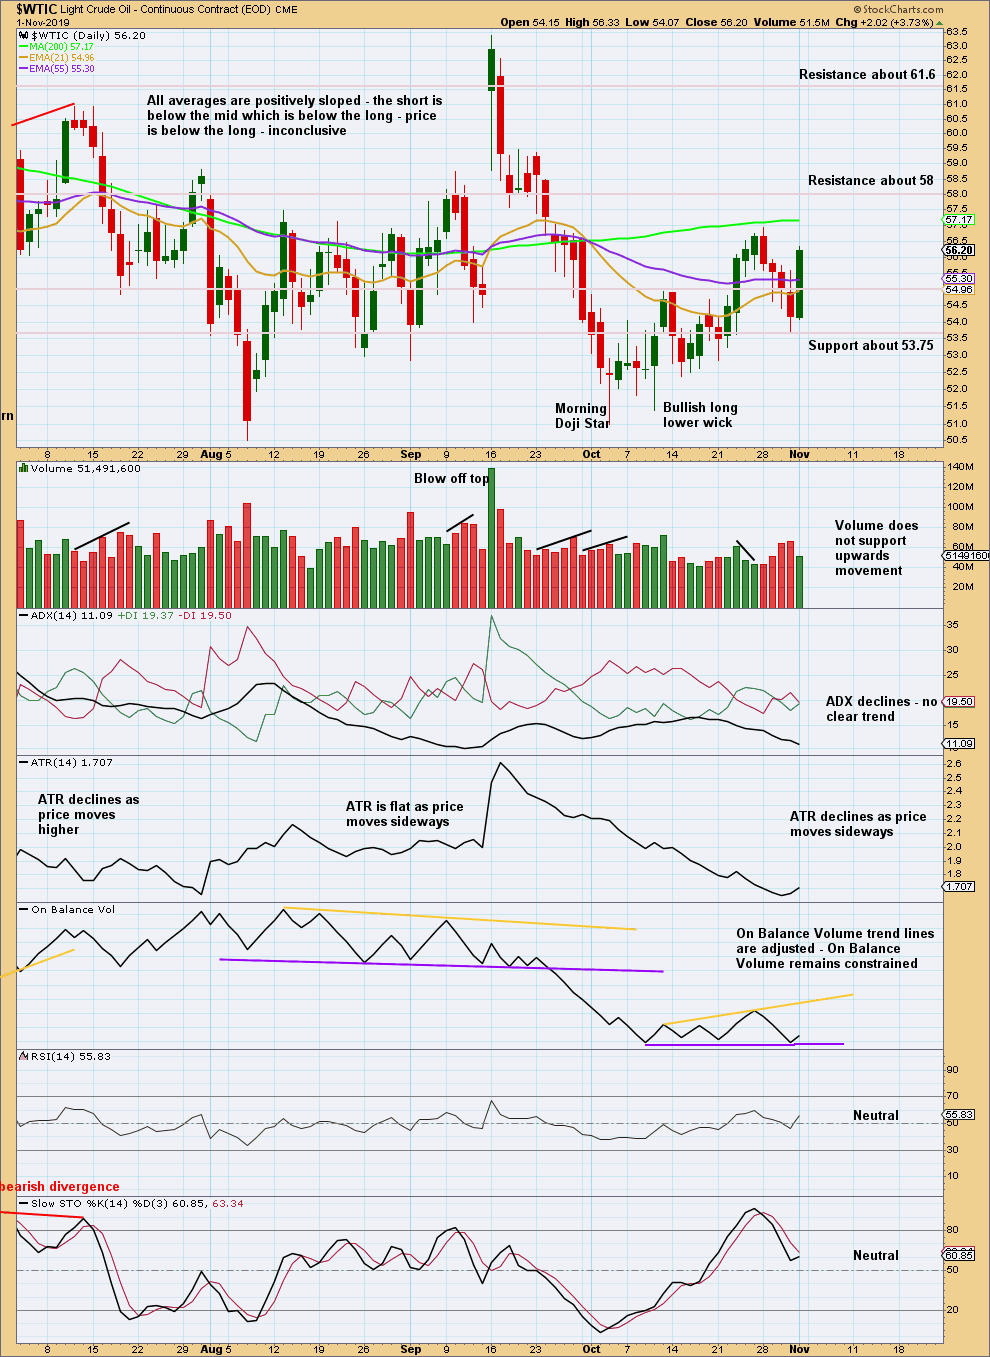
Click chart to enlarge. Chart courtesy of StockCharts.com.
On Balance Volume remains more bearish than price for the short to mid term; it has made new lows while price has made higher lows. This supports the main Elliott wave count.
—
Always practice good risk management as the most important aspect of trading. Always trade with stops and invest only 1-5% of equity on any one trade. Failure to manage risk is the most common mistake new traders make.
anyone have an opinion on shorting t bonds for cycle degree BEAR market?