
Lara’s Weekly: Elliott Wave and Technical Analysis of S&P500 and Gold and US Oil | Charts – February 21, 2020

S&P 500
Downwards movement was expected for Friday’s session, which is exactly what has happened.
The Elliott wave count uses structure and alternation to indicate where price may find support and how long a correction may last.
Summary: The trend is up. Consolidations and pullbacks may last a few weeks but should be viewed in the bigger context of an ongoing bull market. At support they may provide opportunities to join the trend.
Intermediate wave (4) may have arrived. A target for support would be about 3,259. If this expectation is wrong, it may be too low; intermediate wave (4) may be very shallow. Intermediate wave (4) may last about two to four weeks.
Two more large pullbacks or consolidations (fourth waves) during this year and possibly into next year are expected: for intermediate (4) (which may have just arrived) and then primary 4.
If price makes a new high by any amount at any time frame above 3,477.39 (even a fraction of a point on a tick chart), then this analysis switches to one of the very bullish alternate monthly charts. The next cycle degree target would then be either 4,092 or 4,213.
The biggest picture, Grand Super Cycle analysis, is here.
Monthly charts were last published here. Video here.
ELLIOTT WAVE COUNTS
FIRST WAVE COUNT
WEEKLY CHART
Click chart to enlarge.
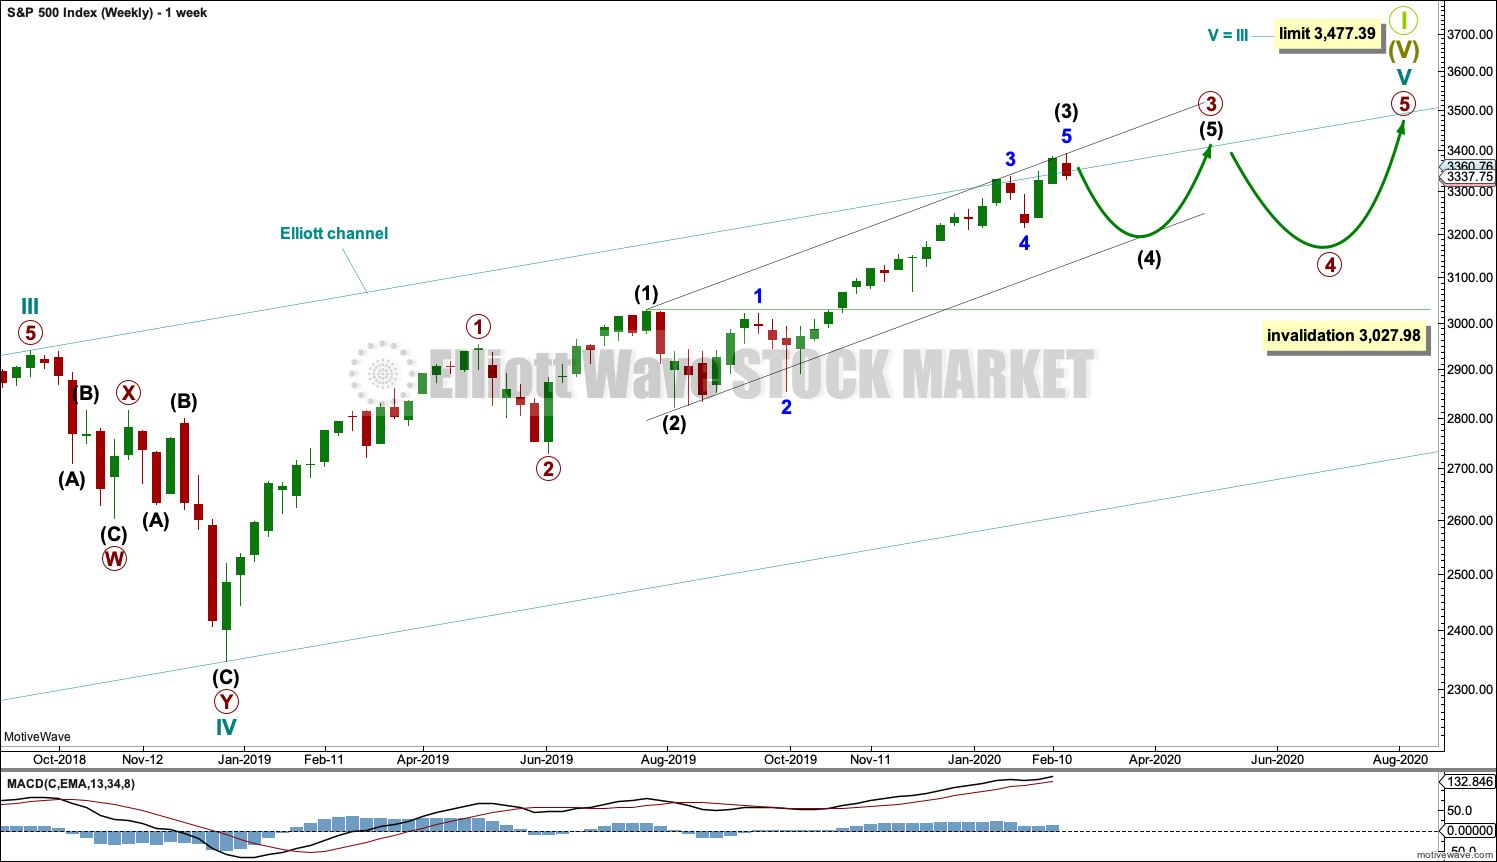
Cycle wave V may subdivide either as an impulse or an ending diagonal. Impulses are much more common, and it is clear at this stage that cycle wave V is an impulse and not a diagonal.
At this stage, cycle wave V may end within this year or possibly into next year.
A channel is drawn about the impulse of Super Cycle wave (V) using Elliott’s first technique. Draw this channel first from the high of 2,079.46 on the 5th of December 2014 to the high of 2,940.91 on the 21st of September 2018, then place a parallel copy on the low at 1,810.10 on the 11th of February 2016. Cycle wave IV found support about the lower edge.
Within Super Cycle wave (V), cycle wave III may not be the shortest actionary wave. Because cycle wave III is shorter than cycle wave I, this limits cycle wave V to no longer than equality in length with cycle wave III at 3,477.39. A new high by any amount at any time frame above this point would invalidate this main wave count in favour of one of the two alternate wave counts in the monthly chart analysis which are much more bullish.
The daily chart below will focus on movement from the end of intermediate wave (1).
Within cycle wave V, primary waves 1 and 2 may be complete. Within primary wave 3, intermediate waves (1) and (2) may be complete. Intermediate wave (3) may now also be complete. Intermediate wave (4) may not move into intermediate wave (1) price territory below 3,027.98.
Within cycle wave V, the corrections of primary wave 2, intermediate wave (2) and minor wave 2 all show up clearly on the weekly chart. For cycle wave V to have the right look, the corresponding corrections of minor wave 4, intermediate wave (4) and primary wave 4 should also show up on the weekly chart. Minor wave 4 now shows up on the weekly chart, and so now two more large multi-week corrections are needed as cycle wave V continues higher, and for this wave count the whole structure must complete at or before 3,477.39.
DAILY CHART
Click chart to enlarge.
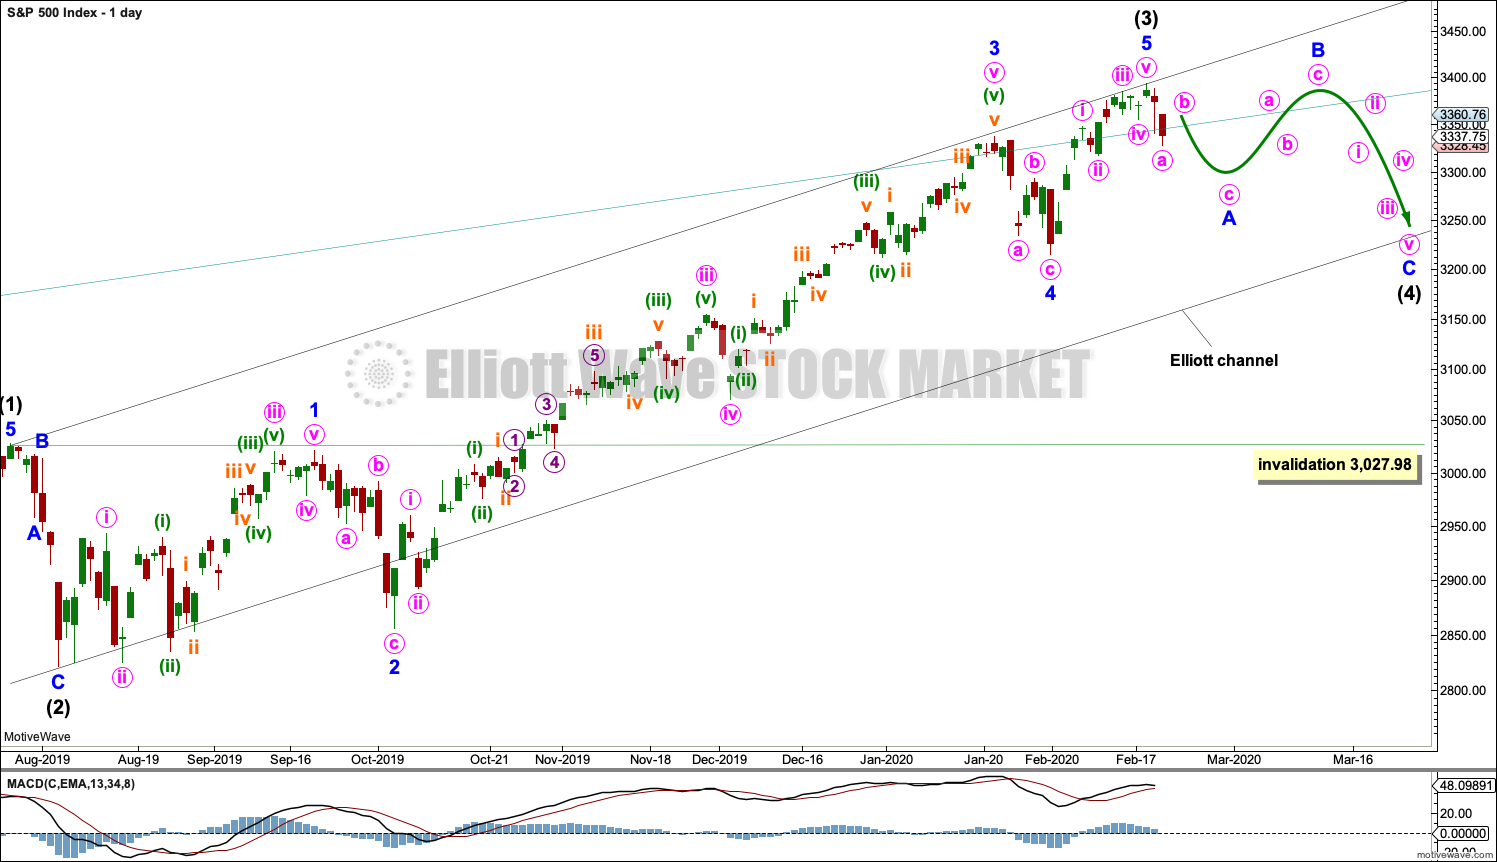
Minor waves 2 and 4 for this wave count both subdivide as zigzags; there is no alternation in structure. Minor wave 2 is deep at 0.83 the length of minor wave 1, and minor wave 4 is shallow at 0.26 the length of minor wave 3; there is alternation in depth. Minor wave 2 lasted 10 sessions and minor wave 4 lasted 7 sessions; the proportion is acceptable and gives the wave count the right look.
There is no adequate Fibonacci ratio between minor waves 1 and 3. If minor wave 5 is now complete, then it would be 5.21 points short of 0.382 the length of minor wave 3.
Intermediate wave (2) subdivides as a zigzag that lasted 6 sessions and was deep at 0.69 of intermediate wave (1). Intermediate wave (4) may subdivide as any corrective structure, most likely one of either a flat, combination or triangle. It may also unfold as a zigzag.
Intermediate wave (4) should show up on the weekly chart, so it should last at least one week and possibly as long as three or four weeks if it is a more time consuming structure such as a triangle or combination.
Intermediate wave (4) may end within the price territory of one lesser degree; minor wave 4 has its price territory from 3,337.77 to 3,214.68.
Use Elliott’s first technique to draw a channel about primary wave 3. Draw the first trend line from the ends of intermediate wave (1) to intermediate wave (3) then place a parallel copy on the end of intermediate wave (2). Intermediate wave (4) may find support about the lower edge of this channel.
ALTERNATE DAILY CHART
Click chart to enlarge.
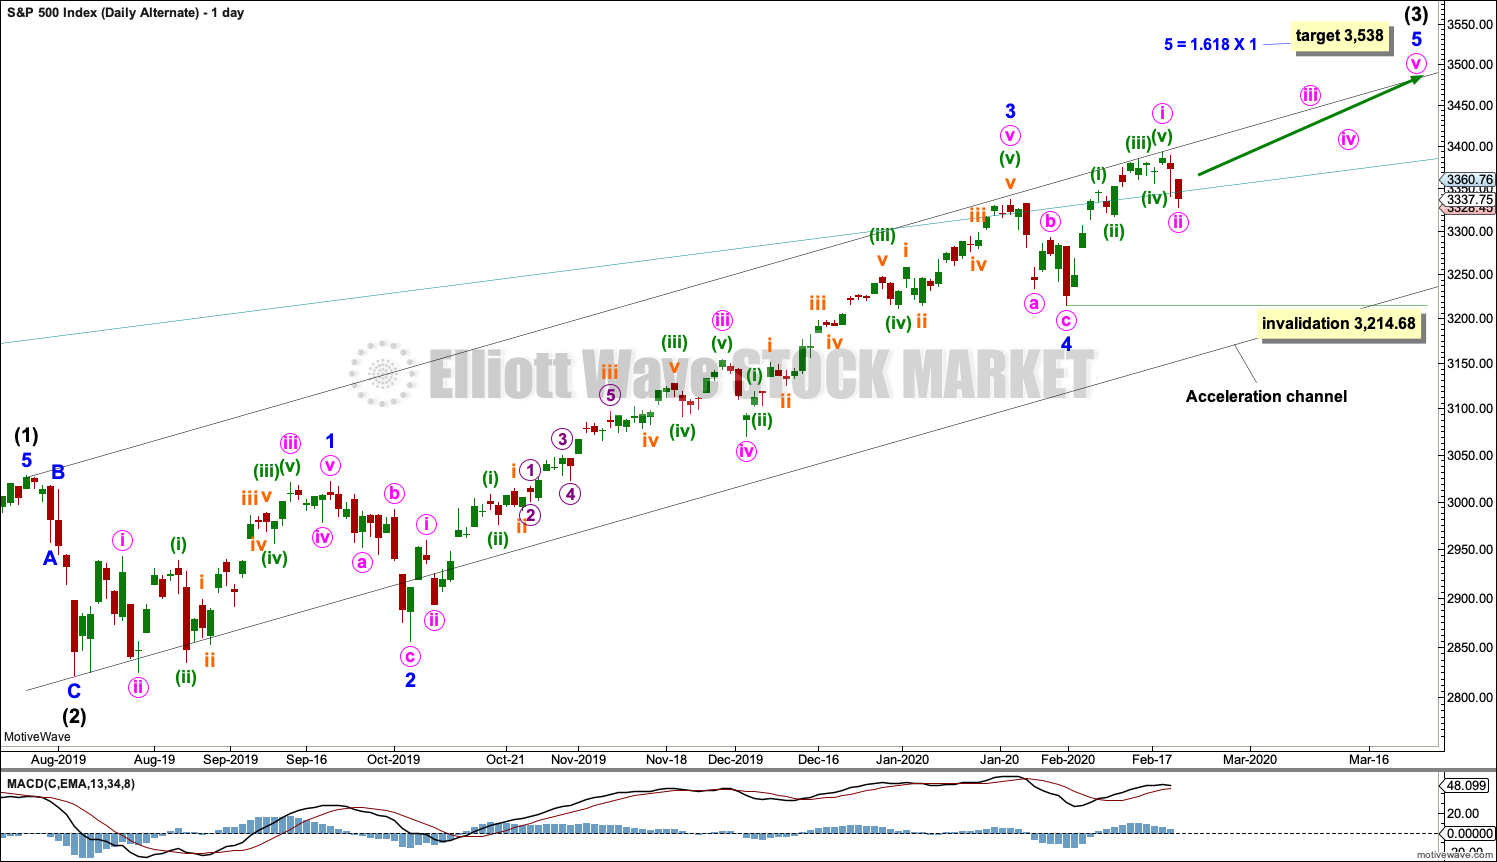
Alternatively, it is possible that intermediate wave (3) may still be incomplete.
This wave count moves the degree of labelling within minor wave 5 down one degree. Minor wave 5 may extend and continue higher. Within minor wave 5, minute wave i may be complete at the last high and minute wave ii may not move beyond the start of minute wave i below 3,214.68.
The target calculated for this alternate wave count only works with one of the more bullish monthly charts. The structure of cycle wave V would be the same.
SECOND WAVE COUNT
WEEKLY CHART
Click chart to enlarge.
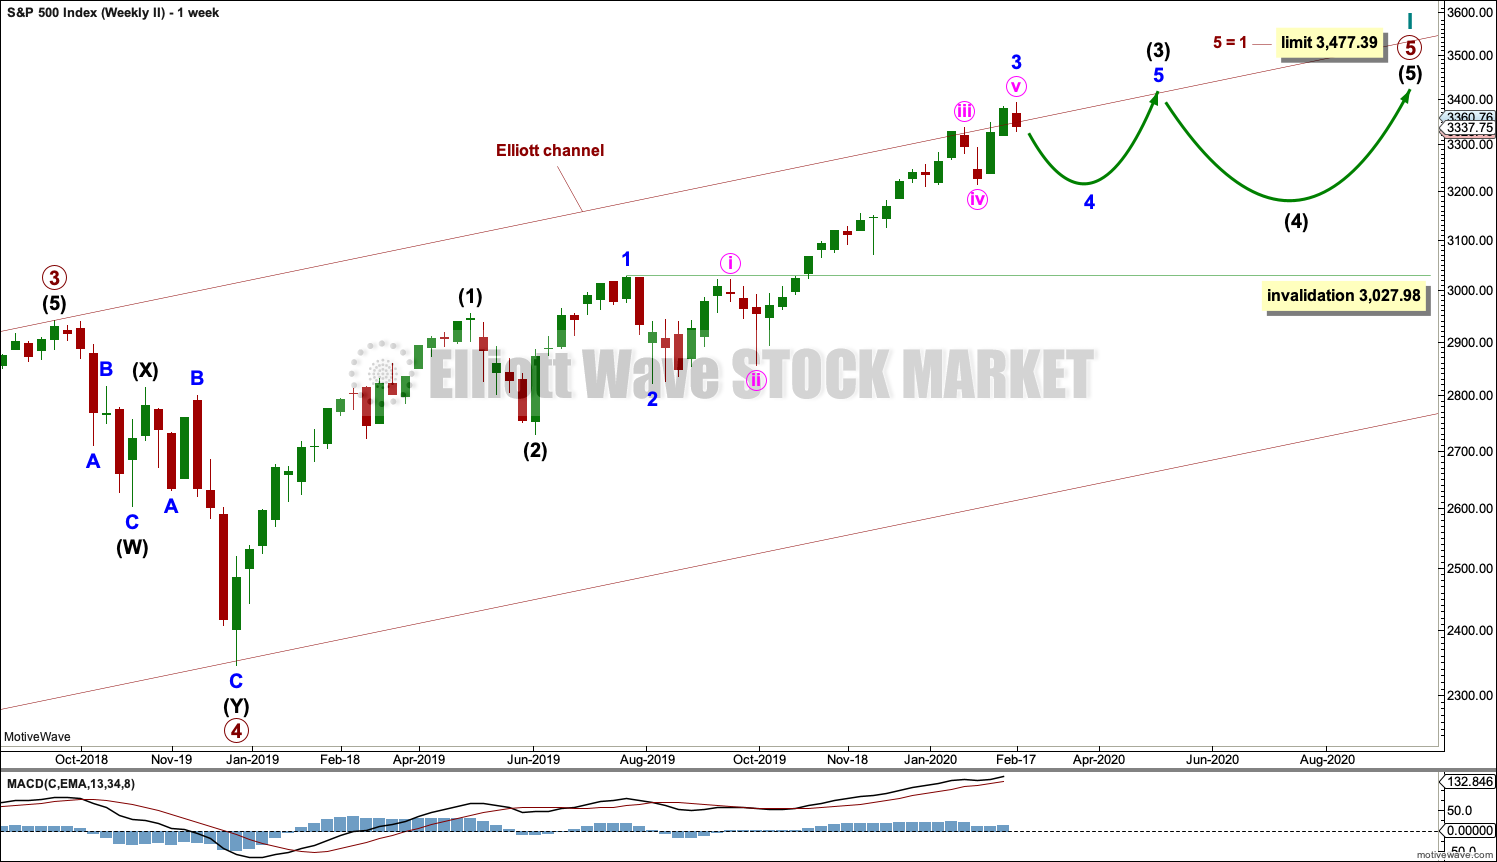
This second wave count sees all subdivisions from the end of the March 2009 low in almost the same way, with the sole difference being the degree of labelling.
If the degree of labelling for the entirety of this bull market is all moved down one degree, then only a first wave at cycle degree may be nearing an end.
When cycle wave I is complete, then cycle wave II should meet the technical definition of a bear market as it should retrace more than 20% of cycle wave I, but it may end about either the 0.382 or 0.618 Fibonacci Ratios of cycle wave I. Cycle wave II may end close to the low of primary wave II within cycle wave I, which is at 1,810.10. It is also possible that cycle wave II could be fairly shallow and only barely meet the definition of a bear market.
The impulse is still viewed as nearing an end; a fifth wave is still seen as needing to complete higher. This wave count labels it primary wave 5. Primary wave 5 may still need another year to two or so to complete, depending upon how time consuming the corrections within it may be.
Primary wave 5 may be subdividing as an impulse, in the same way that cycle wave V is seen for the first weekly chart.
TECHNICAL ANALYSIS
WEEKLY CHART
Click chart to enlarge. Chart courtesy of StockCharts.com.
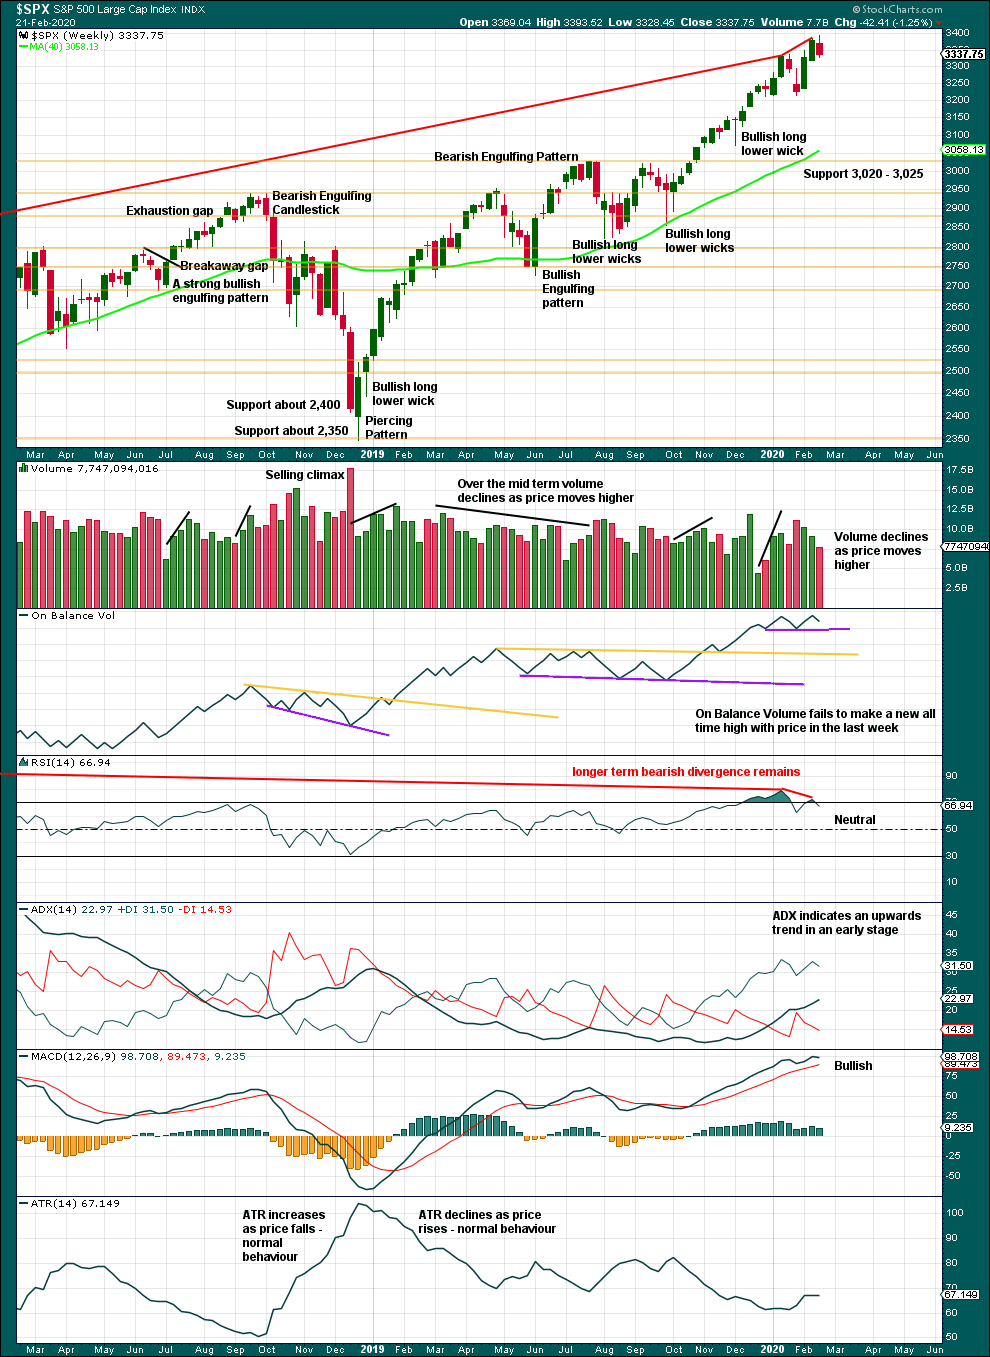
It is very clear that the S&P is in an upwards trend and the bull market is continuing. Price does not move in straight lines; there will be pullbacks and consolidations along the way.
This chart is overall bullish. There are no signs of weakness in upwards movement.
This bull market beginning in March 2009 has been characterised now for many years by rising price on declining volume. Despite all technical textbooks stating this is unsustainable, it has now been sustained for over a decade. This is concerning for an eventual bearish move as it may mean that support below is thin and weak, but for now the bull market continues. A decline in volume in current market conditions shall not be read necessarily as bearish.
Further pullbacks or consolidations will unfold. Do not expect price to move in a straight line. Pullbacks to support in a bull market may be used as opportunities to join an established trend.
Continued bearish divergence for the short term between price and RSI suggests the risk of a pullback remains high.
This week sees upwards movement, but this is not confirmed by On Balance Volume.
DAILY CHART
Click chart to enlarge. Chart courtesy of StockCharts.com.
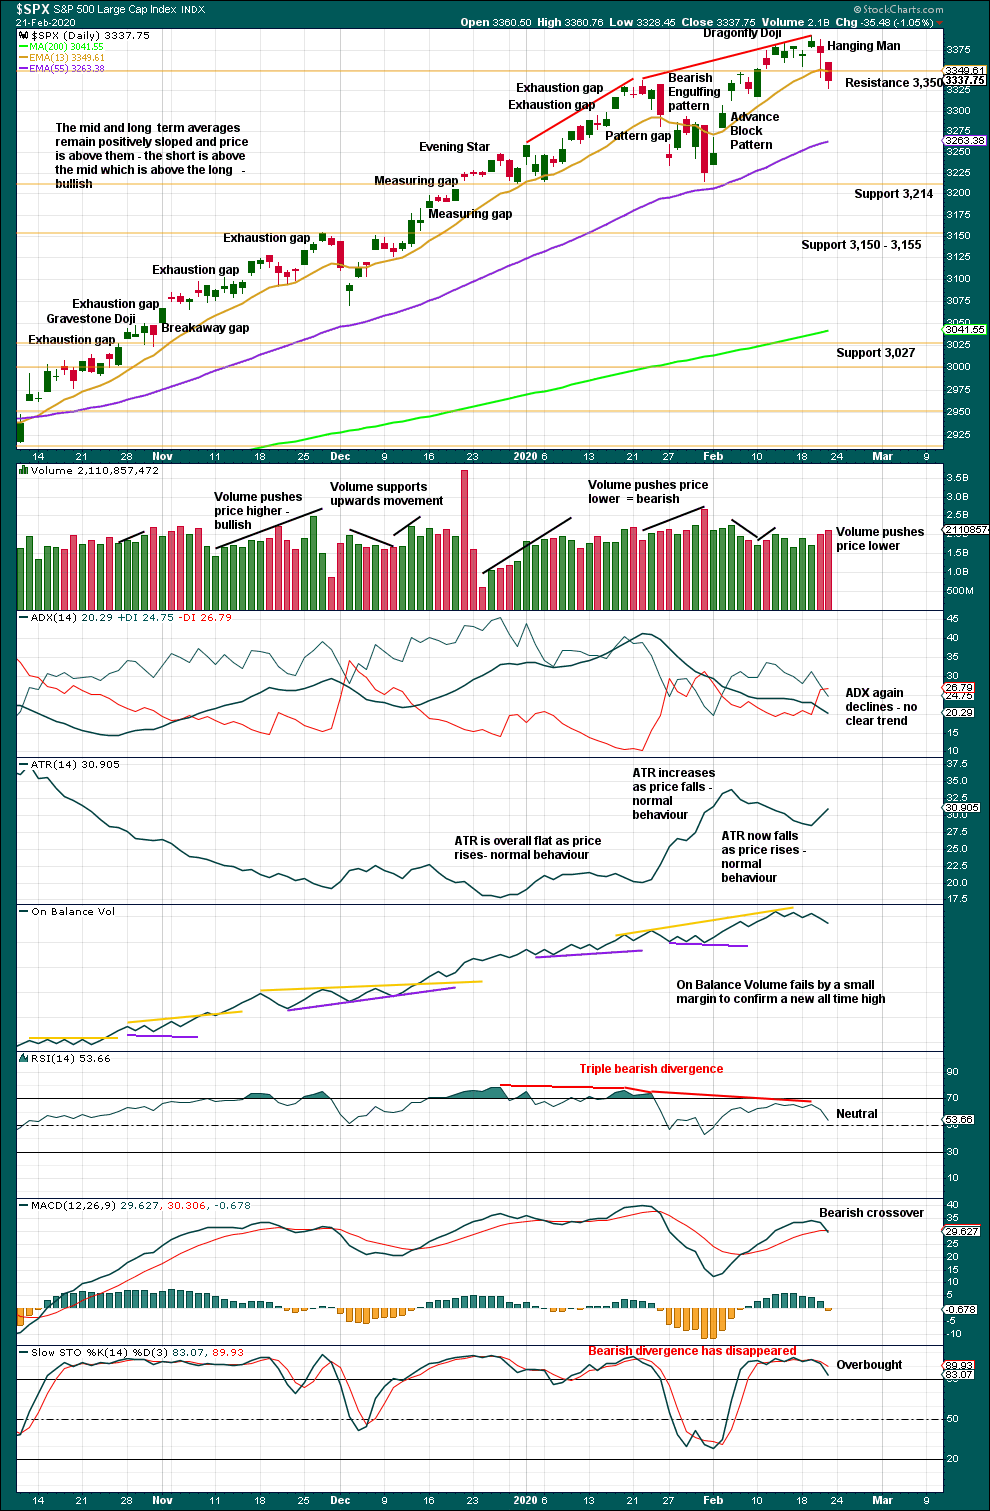
The larger trend, particularly at the monthly time frame, remains up. Expect pullbacks and consolidations to be more short term in nature although they can last a few weeks.
Look for next support about 3,214.
There is now a small cluster of candlestick reversal patterns in two Dragonfly doji and now a Hanging Man. Bearish divergence between price and RSI remains and supports the main Elliott wave count.
BREADTH – AD LINE
WEEKLY CHART
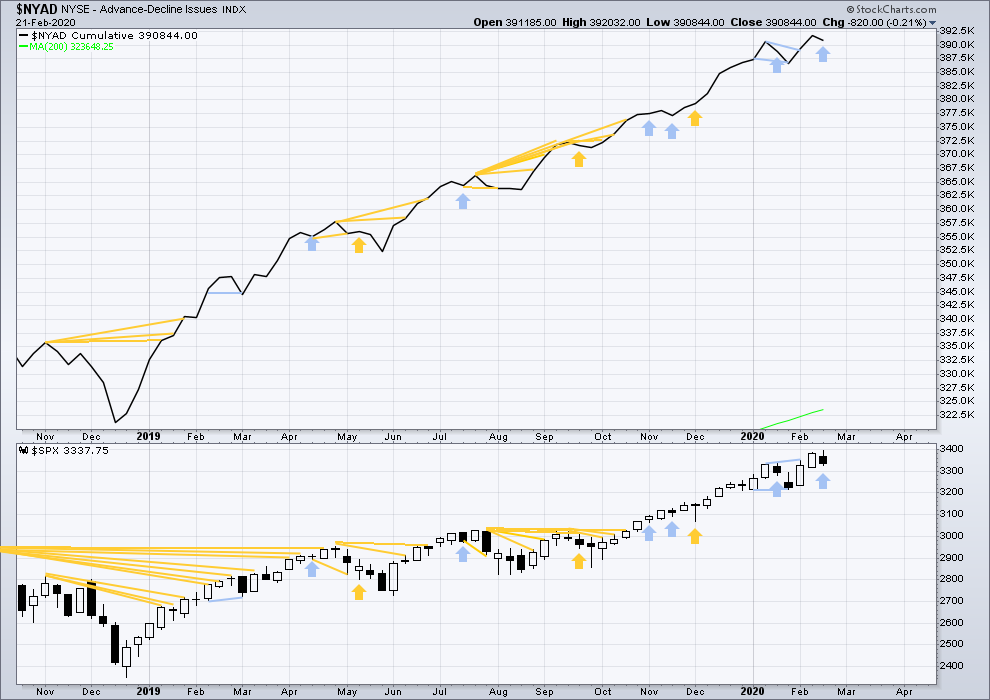
Click chart to enlarge. Chart courtesy of StockCharts.com. So that colour blind members are included, bearish signals will be noted with blue and bullish signals with yellow.
Bear markets from the Great Depression and onwards have been preceded by an average minimum of 4 months divergence between price and the AD line with only two exceptions in 1946 and 1976. With the AD line making new all time highs last week, the end of this bull market and the start of a new bear market is very likely a minimum of 4 months away, which is mid June 2020.
In all bear markets in the last 90 years there is some positive correlation (0.6022) between the length of bearish divergence and the depth of the following bear market. No to little divergence is correlated with more shallow bear markets. Longer divergence is correlated with deeper bear markets.
If a bear market does develop here, it comes after no bearish divergence. It would therefore more likely be shallow.
This week price has moved higher, but the AD line has moved lower. This single week instance of bearish divergence supports the main Elliott wave count.
Large caps all time high: 3,393.52 on 19th February 2020.
Mid caps all time high: 2,109.43 on 20th February 2020.
Small caps all time high: 1,100.58 on 27th August 2018.
DAILY CHART
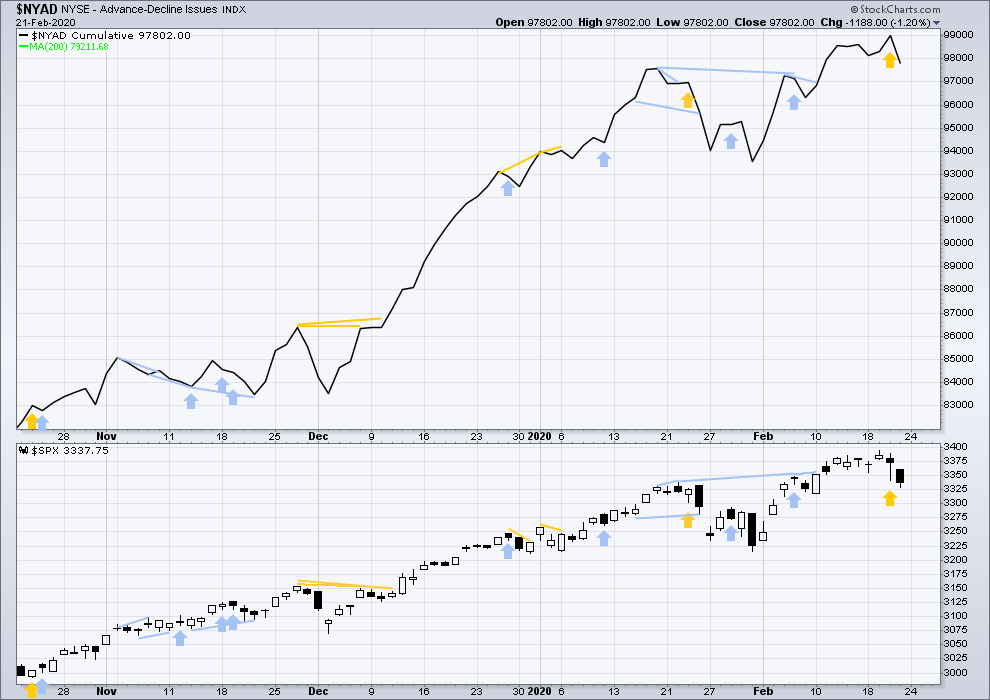
Click chart to enlarge. Chart courtesy of StockCharts.com. So that colour blind members are included, bearish signals will be noted with blue and bullish signals with yellow.
Breadth should be read as a leading indicator.
Bullish divergence noted in Thursday’s analysis was not followed by any downwards movement. It is considered to have failed.
Both price and the AD line moved lower on Friday. There is no new short-term divergence.
VOLATILITY – INVERTED VIX CHART
WEEKLY CHART
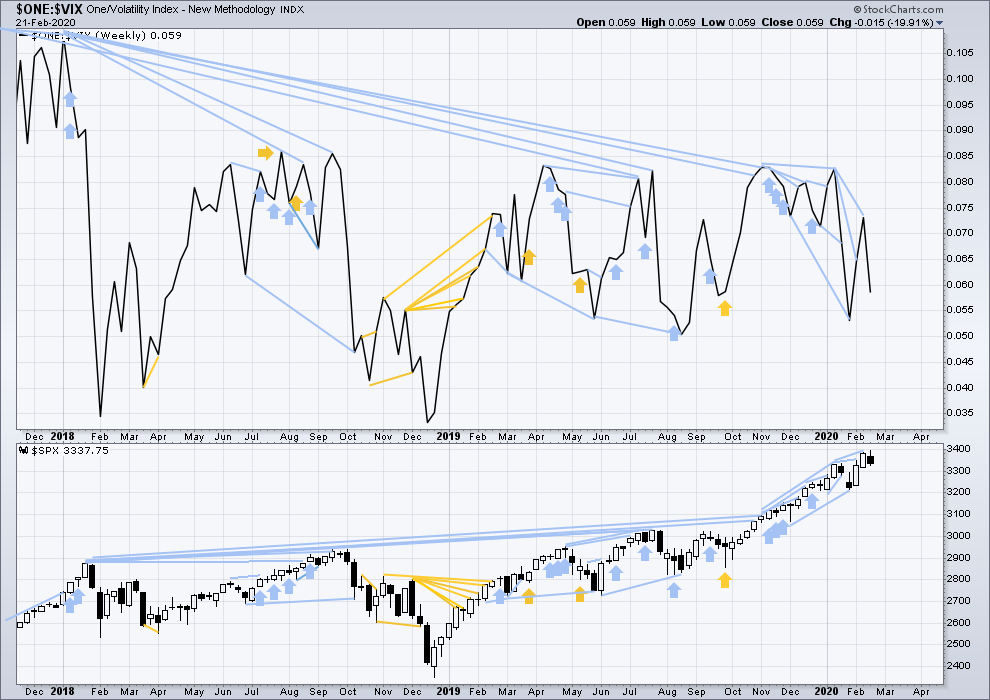
Click chart to enlarge. Chart courtesy of StockCharts.com. So that colour blind members are included, bearish signals will be noted with blue and bullish signals with yellow.
The all time high for inverted VIX was on 30th October 2017. There is now over two years of bearish divergence between price and inverted VIX.
The rise in price is not coming with a normal corresponding decline in VIX; VIX remains elevated. This long-term divergence is bearish and may yet develop further as the bull market matures.
This divergence may be an early warning, a part of the process of a top developing that may take years. It is clearly not useful in timing a trend change from bull to a fully fledged bear market.
This week both price and inverted VIX have moved lower. There is no new short-term divergence.
DAILY CHART
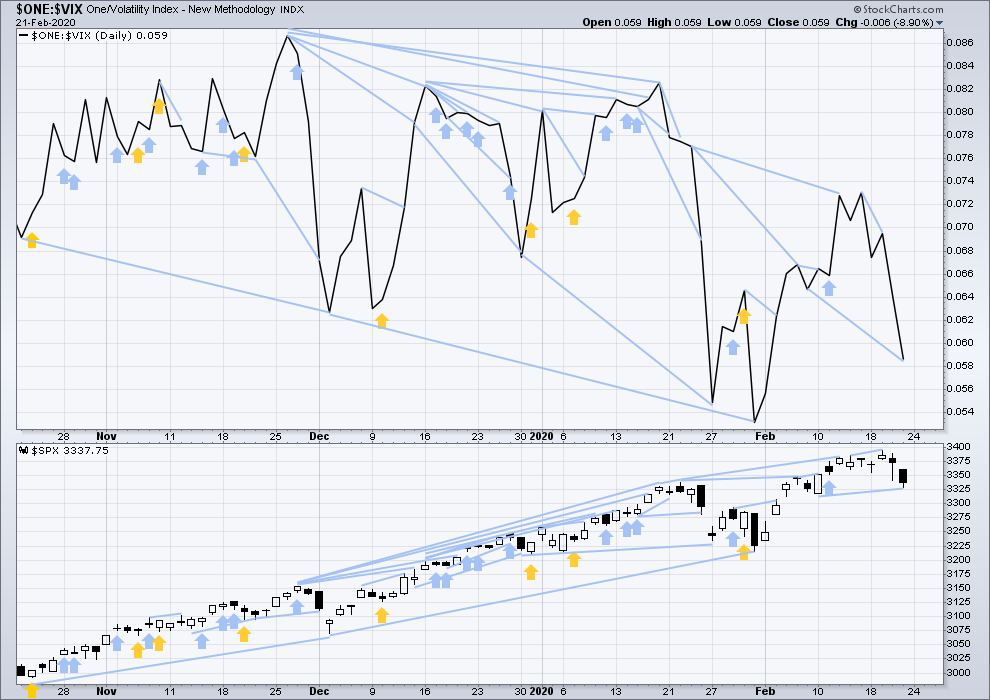
Click chart to enlarge. Chart courtesy of StockCharts.com. So that colour blind members are included, bearish signals will be noted with blue and bullish signals with yellow.
Both price and inverted VIX moved lower on Friday. Inverted VIX has made a new low below the prior swing low of 7th/10th February, but price has not. This divergence is bearish and supports the main Elliott wave count.
DOW THEORY
Dow Theory confirmed a bear market in December 2018. This does not necessarily mean a bear market at Grand Super Cycle degree though; Dow Theory makes no comment on Elliott wave counts. On the 25th of August 2015 Dow Theory also confirmed a bear market. The Elliott wave count sees that as part of cycle wave II. After Dow Theory confirmation of a bear market in August 2015, price went on to make new all time highs and the bull market continued.
DJIA: 23,344.52 – a close on the 19th of December at 23,284.97 confirms a bear market.
DJT: 9,806.79 – price has closed below this point on the 13th of December.
S&P500: 2,532.69 – a close on the 19th of December at 2,506.96 provides support to a bear market conclusion.
Nasdaq: 6,630.67 – a close on the 19th of December at 6,618.86 provides support to a bear market conclusion.
With all the indices having moved higher following a Dow Theory bear market confirmation, Dow Theory would confirm a bull market if the following highs are made:
DJIA: 26,951.81 – a close above this point has been made on the 3rd of July 2019.
DJT: 11,623.58 – to date DJT has failed to confirm an ongoing bull market.
S&P500: 2,940.91 – a close above this point was made on the 29th of April 2019.
Nasdaq: 8,133.30 – a close above this point was made on the 26th of April 2019.
GOLD
Upwards movement continued as expected, although the targets at 1,626 to 1,630 were inadequate.
Summary: New targets are at 1,719 (bear wave count) or 1,834 (bull wave count).
Conditions are now very extreme; a blow off top may continue to form next week. A high may be in place within another one to very few days.
Grand SuperCycle analysis is here.
Monthly charts were last updated here.
BEARISH ELLIOTT WAVE COUNT
WEEKLY CHART
Click chart to enlarge.
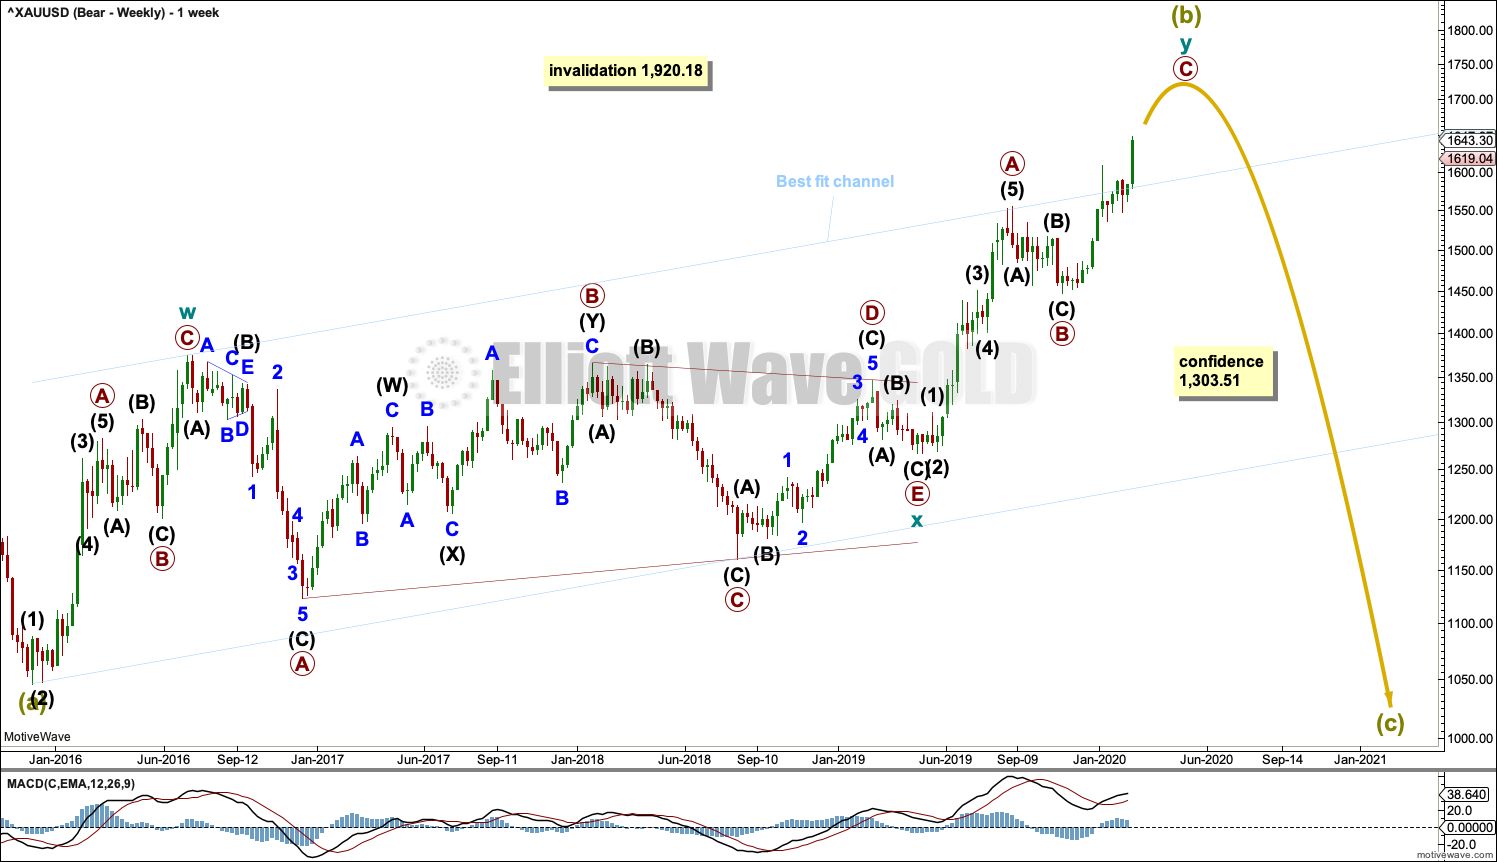
Super Cycle wave (b) may be an incomplete double zigzag.
The first zigzag in the double is labelled cycle wave w. The double is joined by a three in the opposite direction, a triangle labelled cycle wave x. The second zigzag in the double is labelled cycle wave y.
The purpose of the second zigzag in a double is to deepen the correction. Cycle wave y has achieved this purpose.
A wide best fit channel is added in light blue. Copy this channel over to daily charts. Price is now above the upper edge of this channel, which may now provide some support.
DAILY CHART
Click chart to enlarge.
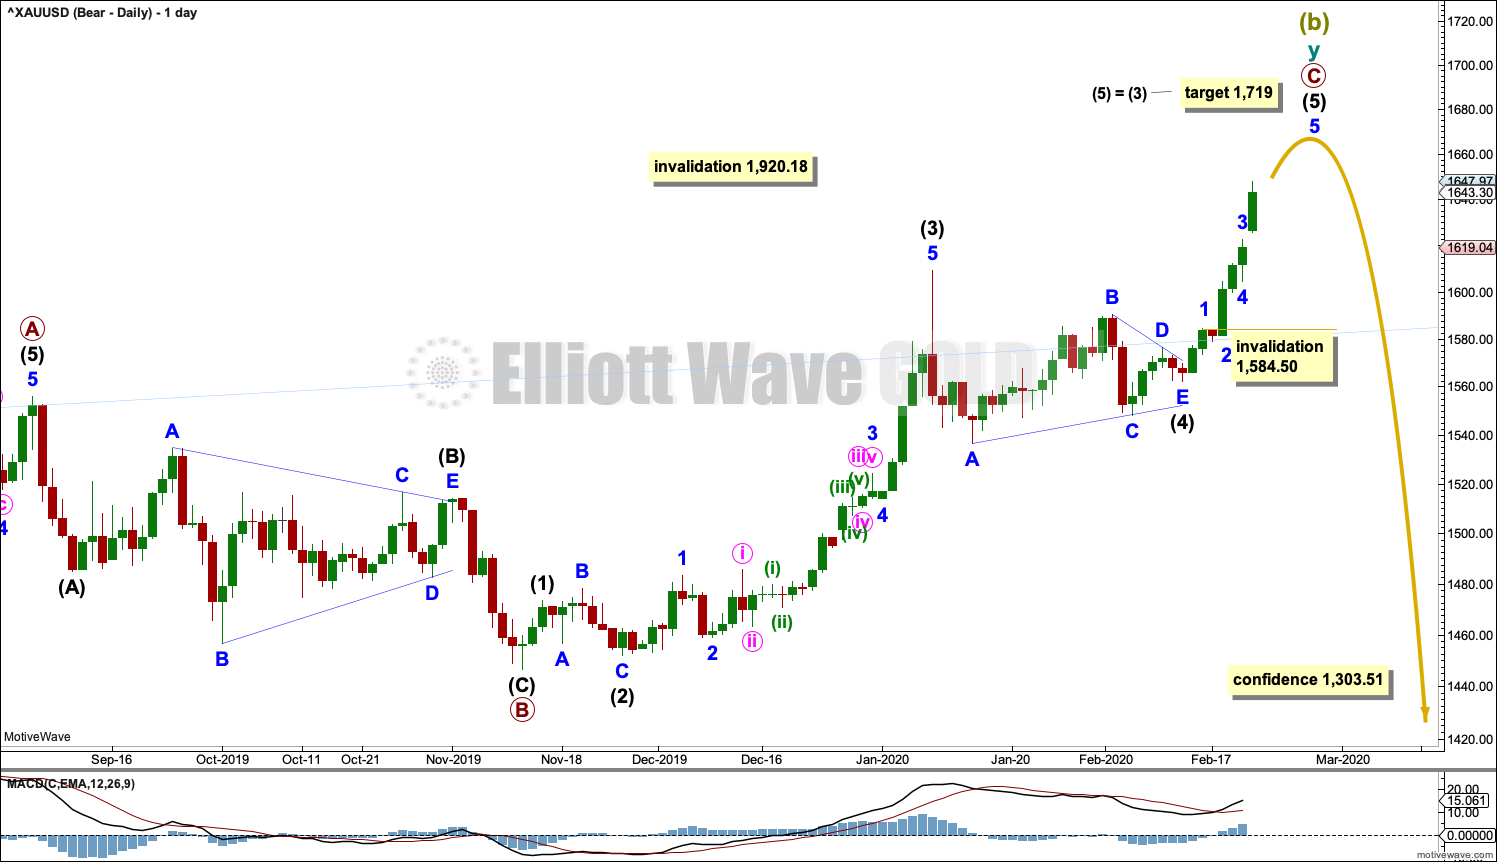
Super Cycle wave (b) may be close to completion. It may end next week.
Within the zigzag of cycle wave y, primary waves A and B may be complete and primary wave C must subdivide as a five wave structure. Primary wave C may be an impulse that may now be close to completion.
Within the impulse of primary wave C, intermediate wave (2) subdivides as an expanded flat, which lasted 8 sessions, and intermediate wave (4) may most likely be a triangle that lasted 25 sessions. There is disproportion between these corrections, which is not typical behaviour for this market; but with other wave counts now invalidated, this wave count remains as the sole explanation for recent movement.
A new target is calculated for primary wave C to end.
Within intermediate wave (5), minor wave 4 may not move into minor wave 1 price territory below 1,584.50.
BULLISH ELLIOTT WAVE COUNT
WEEKLY CHART
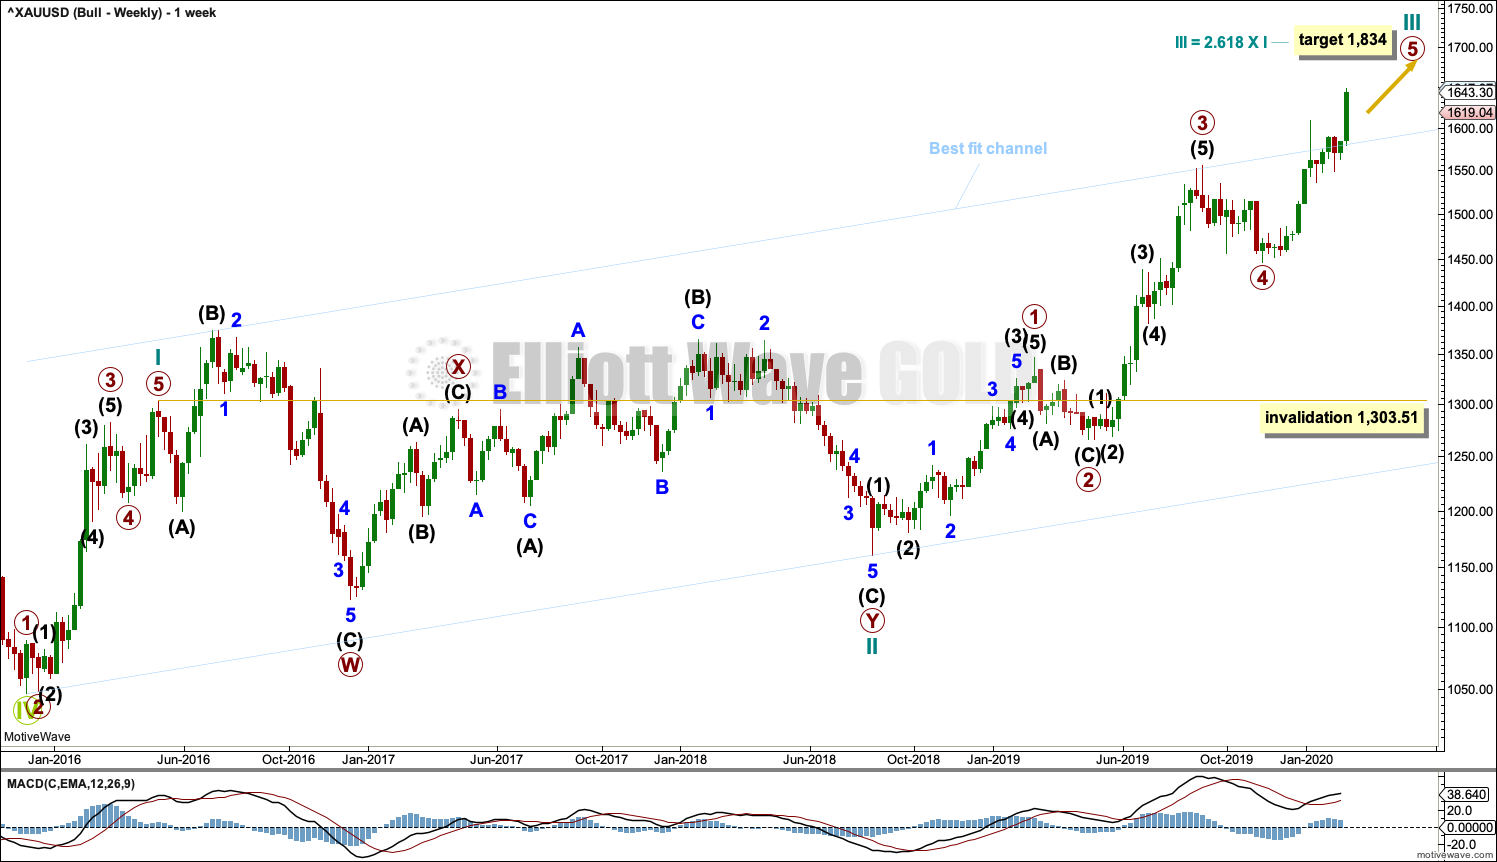
Click chart to enlarge.
This wave count sees the the bear market complete at the last major low for Gold on 3 December 2015.
If Gold is in a new bull market, then it should begin with a five wave structure upwards on the weekly chart.
Cycle wave I fits as a five wave impulse with reasonably proportionate corrections for primary waves 2 and 4. This resolves a previous major problem with the bullish wave count.
Cycle wave II now fits as a double flat. However, a problem arises with the relabelling of this structure. Within the first flat correction labelled primary wave W, this wave count now needs to ignore what looks like an obvious triangle from July to September 2016 (this can be seen labelled as a triangle on the bear wave count above). This movement must now be labelled as a series of overlapping first and second waves.
Cycle wave III may be incomplete. A target is calculated based upon the most common Fibonacci ratio for primary wave 5 within the impulse of cycle wave III.
Add the wide best fit channel to weekly and daily charts.
DAILY CHART
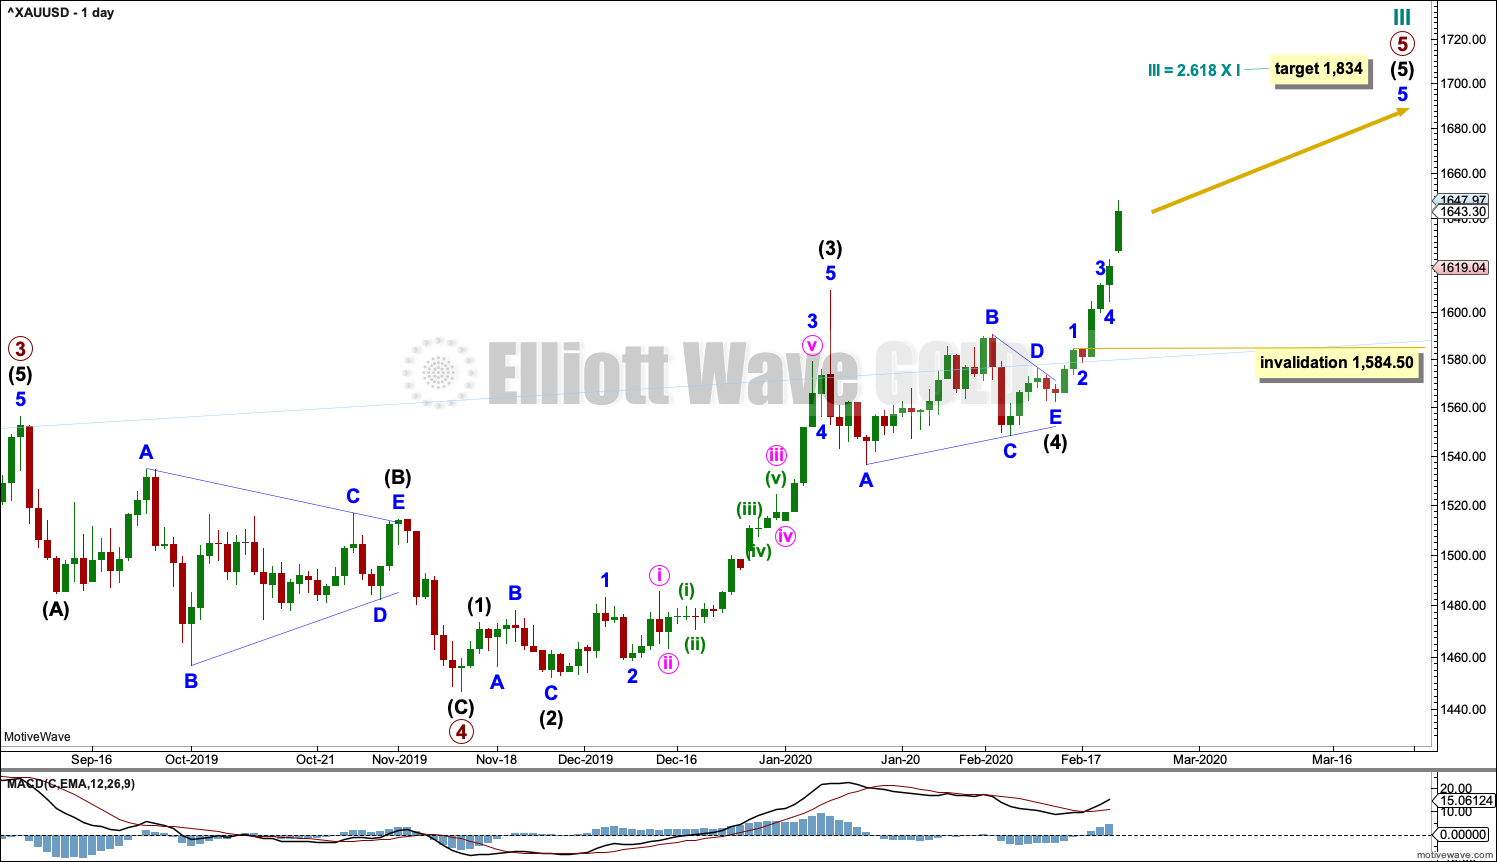
Click chart to enlarge.
Cycle wave III may be an incomplete impulse. Within the impulse, primary waves 1 through to 4 may be complete and primary wave 5 may be an incomplete impulse.
Within primary wave 5, intermediate waves (1) through to (4) may be incomplete. Within intermediate wave (5), minor wave 4 may not move into minor wave 1 price territory below 1,584.50.
TECHNICAL ANALYSIS
WEEKLY CHART
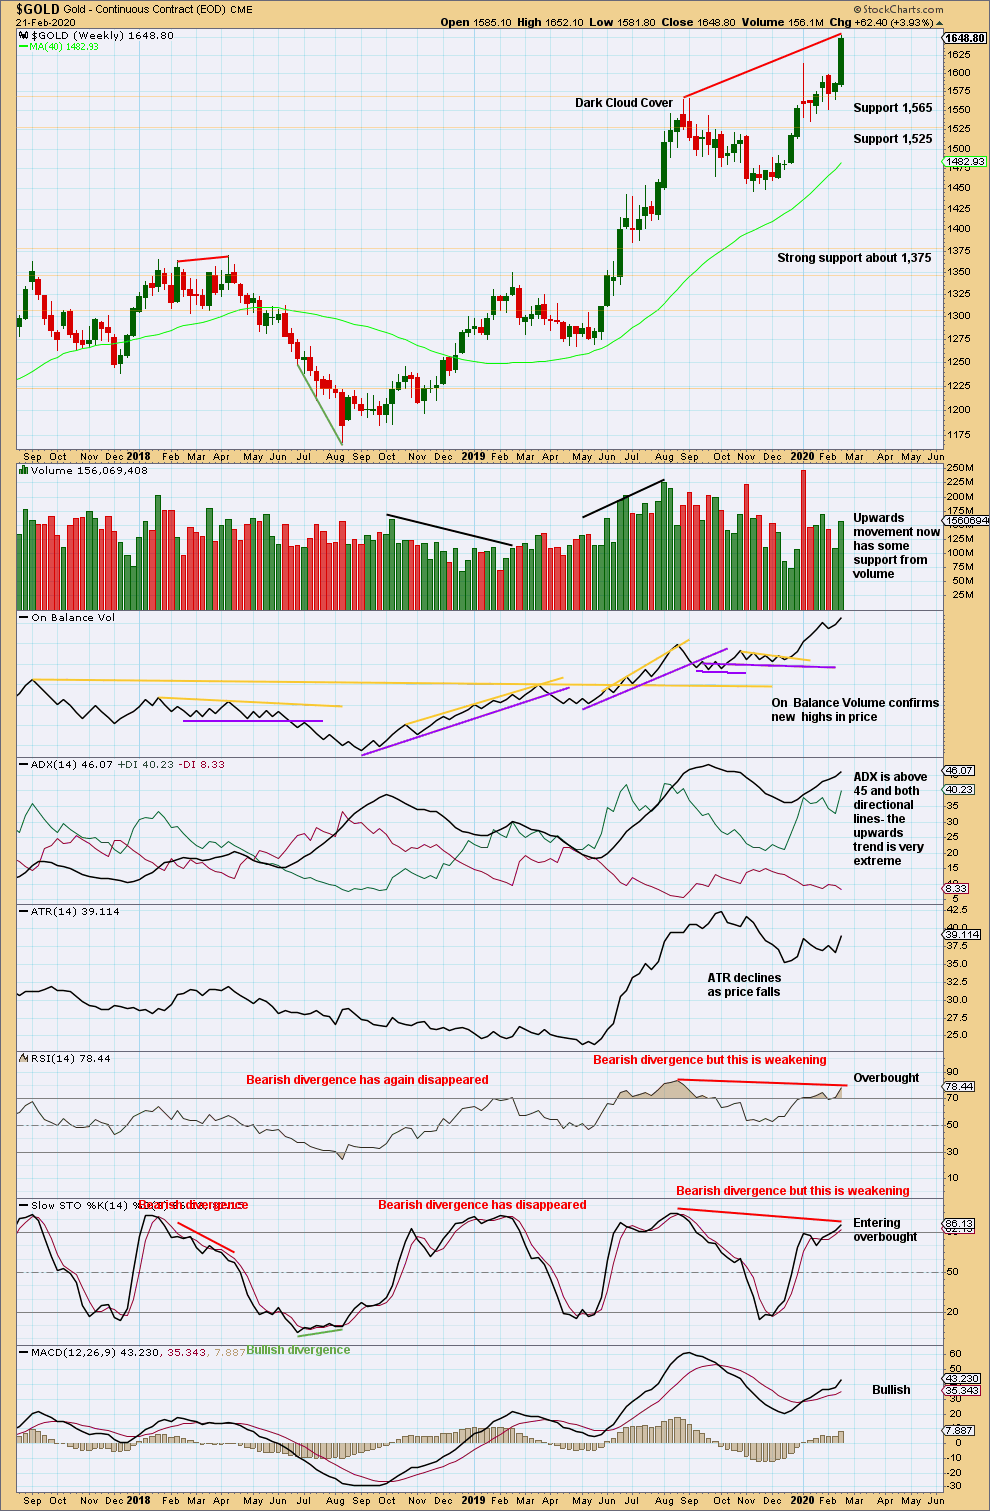
Click chart to enlarge. Chart courtesy of StockCharts.com.
Bullish divergence between price and On Balance Volume has now been followed by upwards movement from price to new highs. This divergence may now be resolved.
The trend is very extreme and RSI is overbought. This trend may be expected to end fairly soon, although extreme conditions can persist for another one to very few weeks.
DAILY CHART
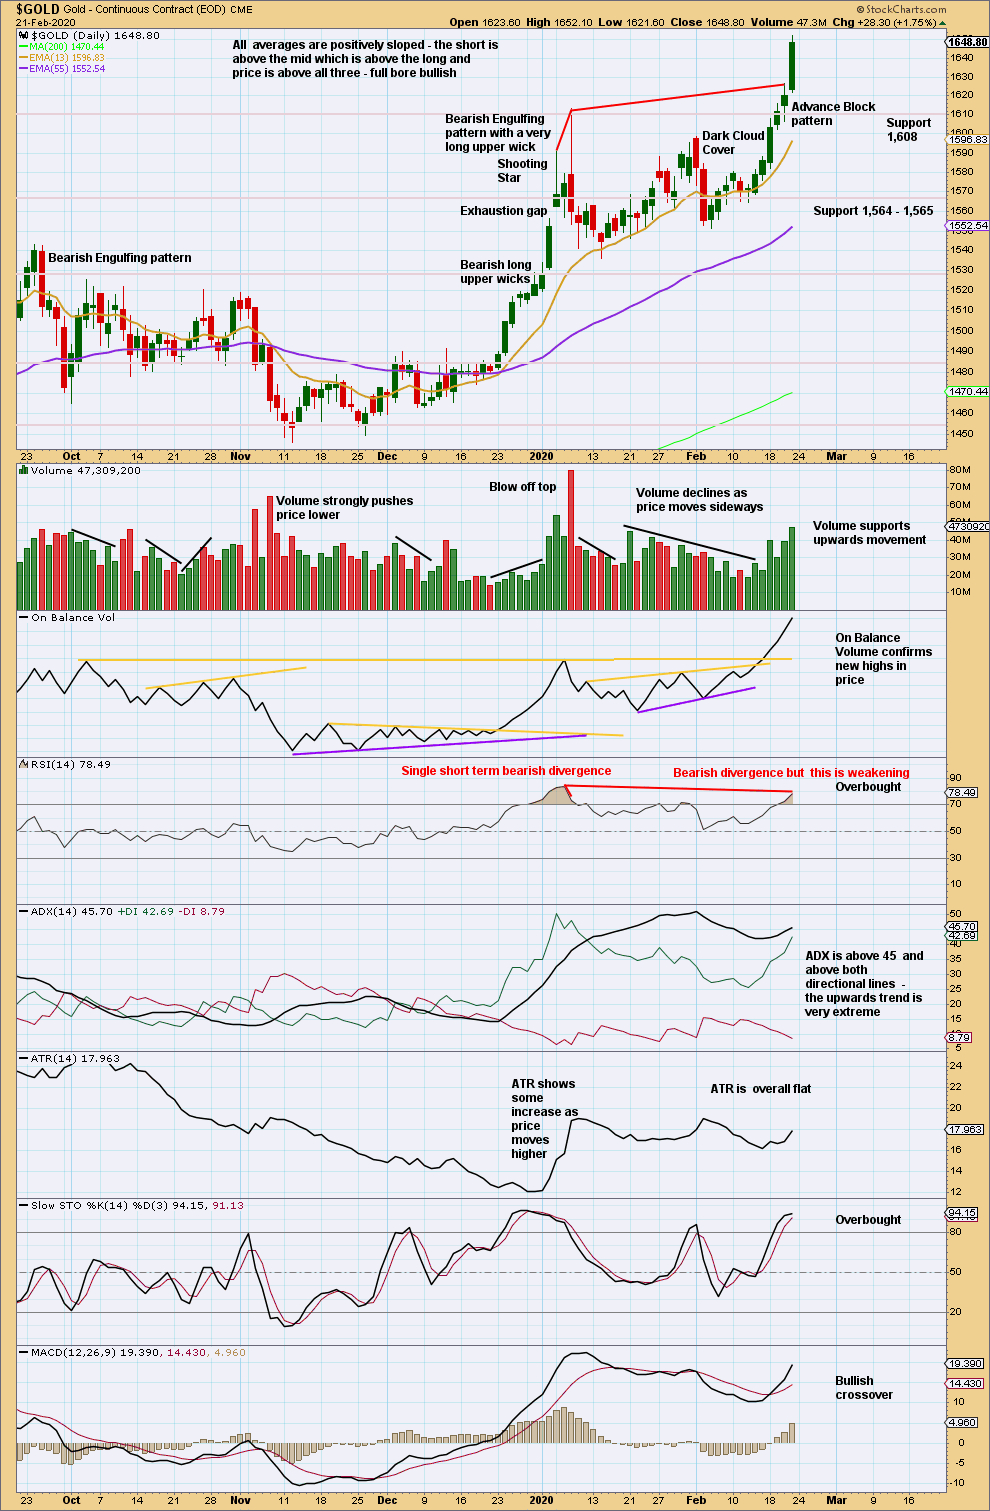
Click chart to enlarge. Chart courtesy of StockCharts.com.
Conditions are very extreme at both weekly and daily time frames. ADX is very extreme. RSI is overbought.
A blow off top may be forming. These can unfold over a few days; they are not necessarily single day events. There is a good example on this chart from 3rd to 8th January 2020.
A strong close on Friday with price near highs for the session and strong ATR indicates more upwards movement as likely on Monday. Look for a candlestick reversal pattern or a long upper wick to signal the end of the blow off top.
GDX WEEKLY CHART
Click chart to enlarge. Chart courtesy of StockCharts.com.
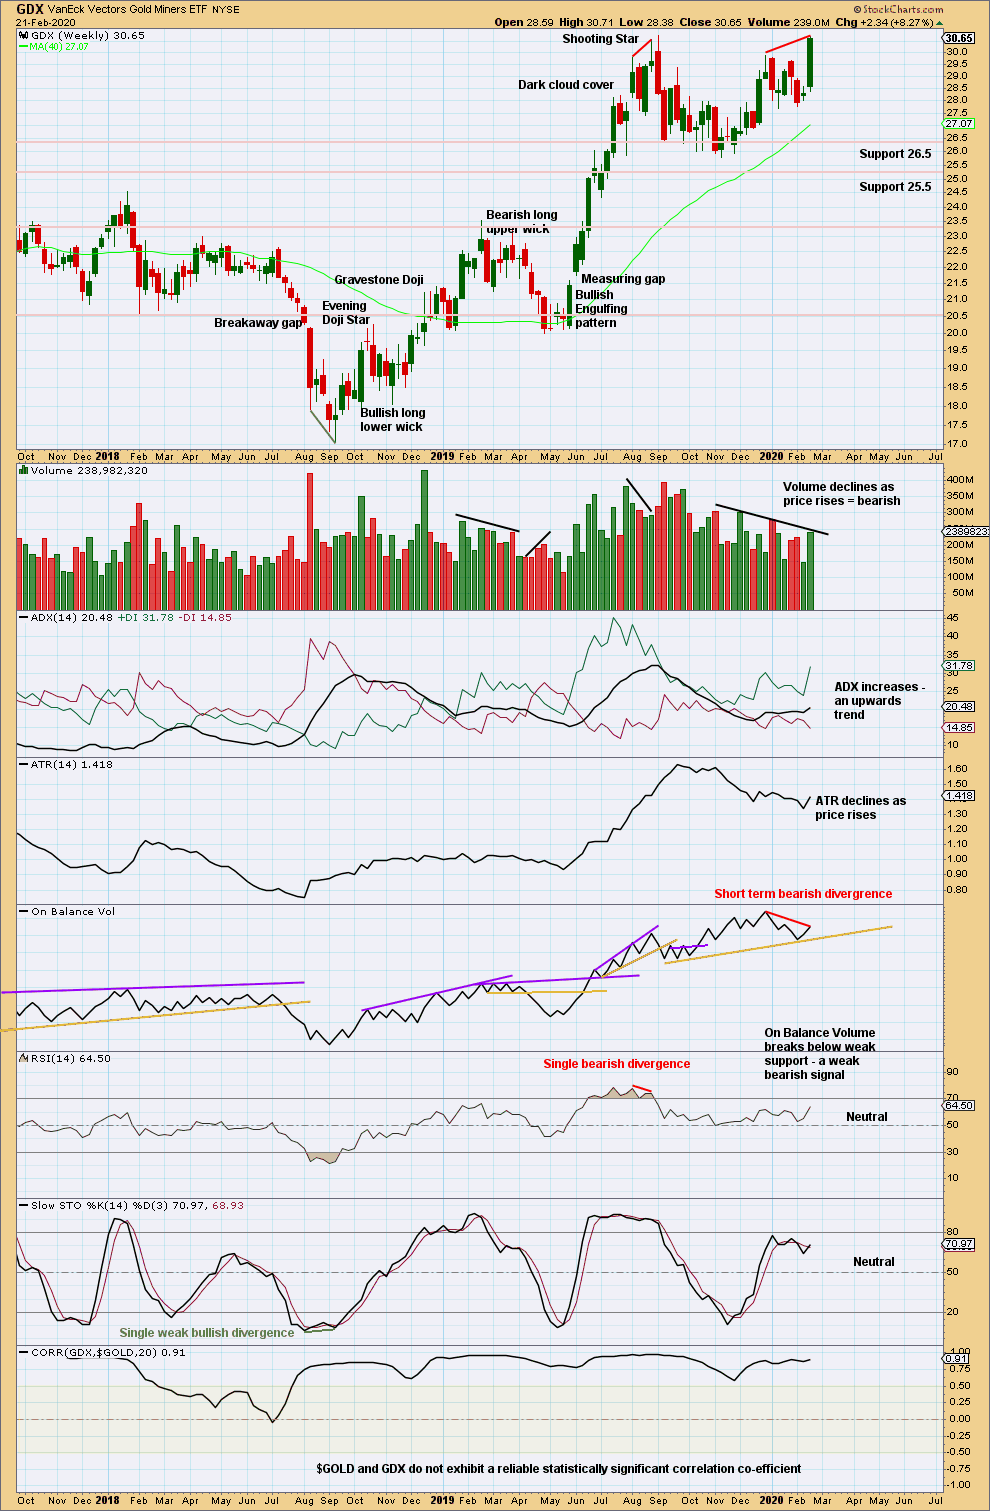
While Gold has made new highs, GDX has not by a very small margin.
The week has closed strongly suggesting more upwards movement next week. Some weakness is evident in bearish divergence with RSI and overall declining volume, although the last week was stronger than the week prior.
GDX DAILY CHART
Click chart to enlarge. Chart courtesy of StockCharts.com.
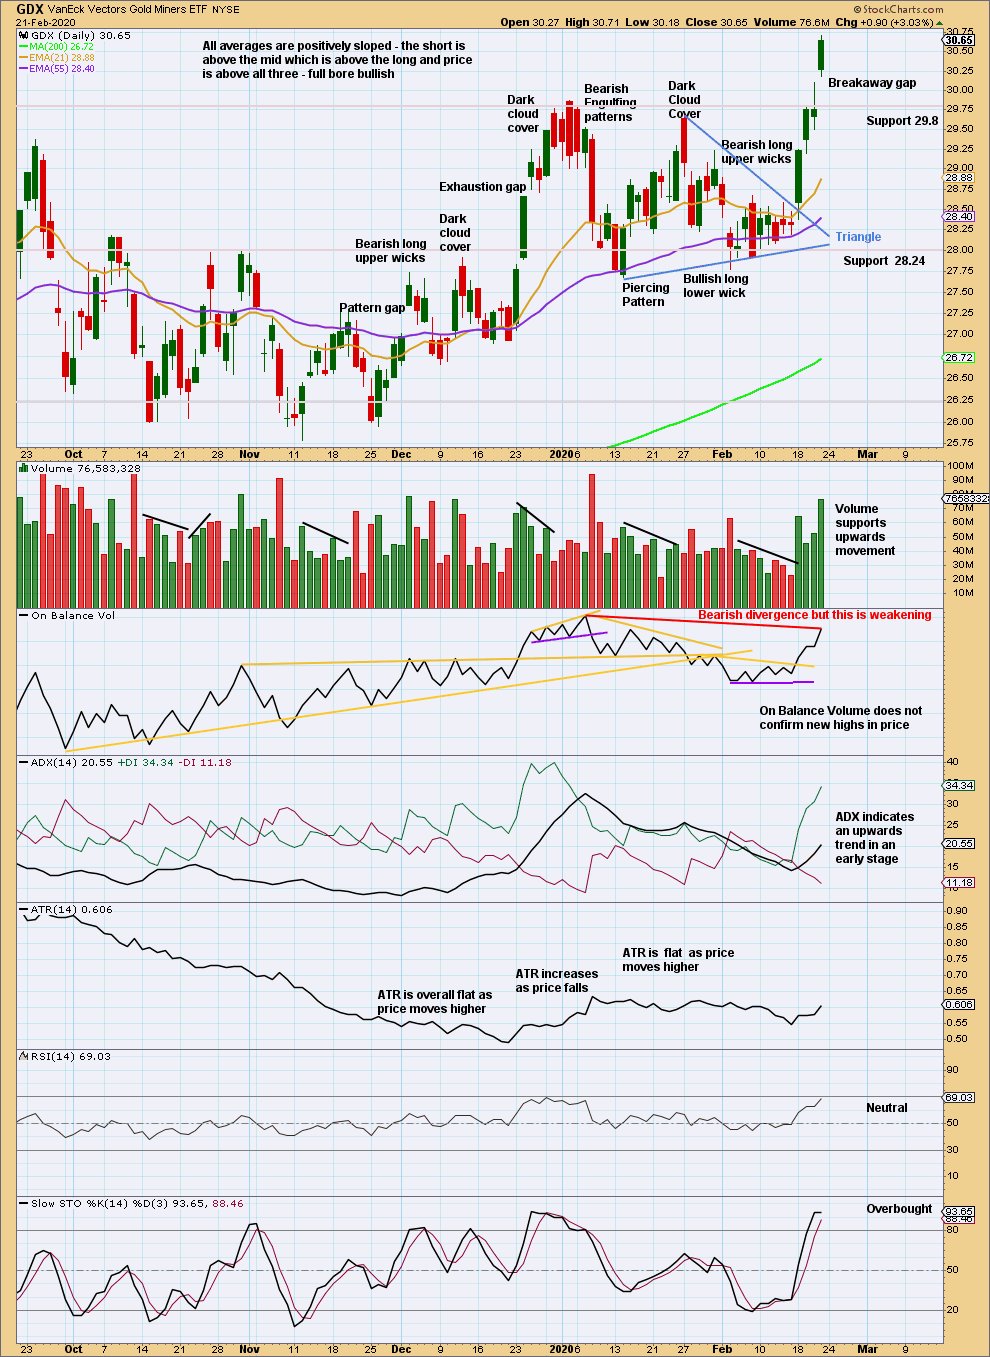
A target calculated from the triangle is at 30.47. The target is met and slightly exceeded.
A breakaway gap may now offer support at 30.10. A target calculated from the gap and using the prior consolidation is at 32.37.
If the breakaway gap is closed with a new low below 30.10, then it may be renamed an exhaustion gap and a trend change may be indicated.
US OIL
Upwards movement has continued for another week exactly as expected. The main wave count still has the same target and expects a breakout from this consolidation to be downwards, when the upwards swing is complete.
Summary: Both the bullish and bearish Elliott wave counts expect upwards movement to continue for a few more weeks. The target for the main bearish count is at 65.83.
MAIN ELLIOTT WAVE COUNT – BEARISH
MONTHLY CHART
Click chart to enlarge.
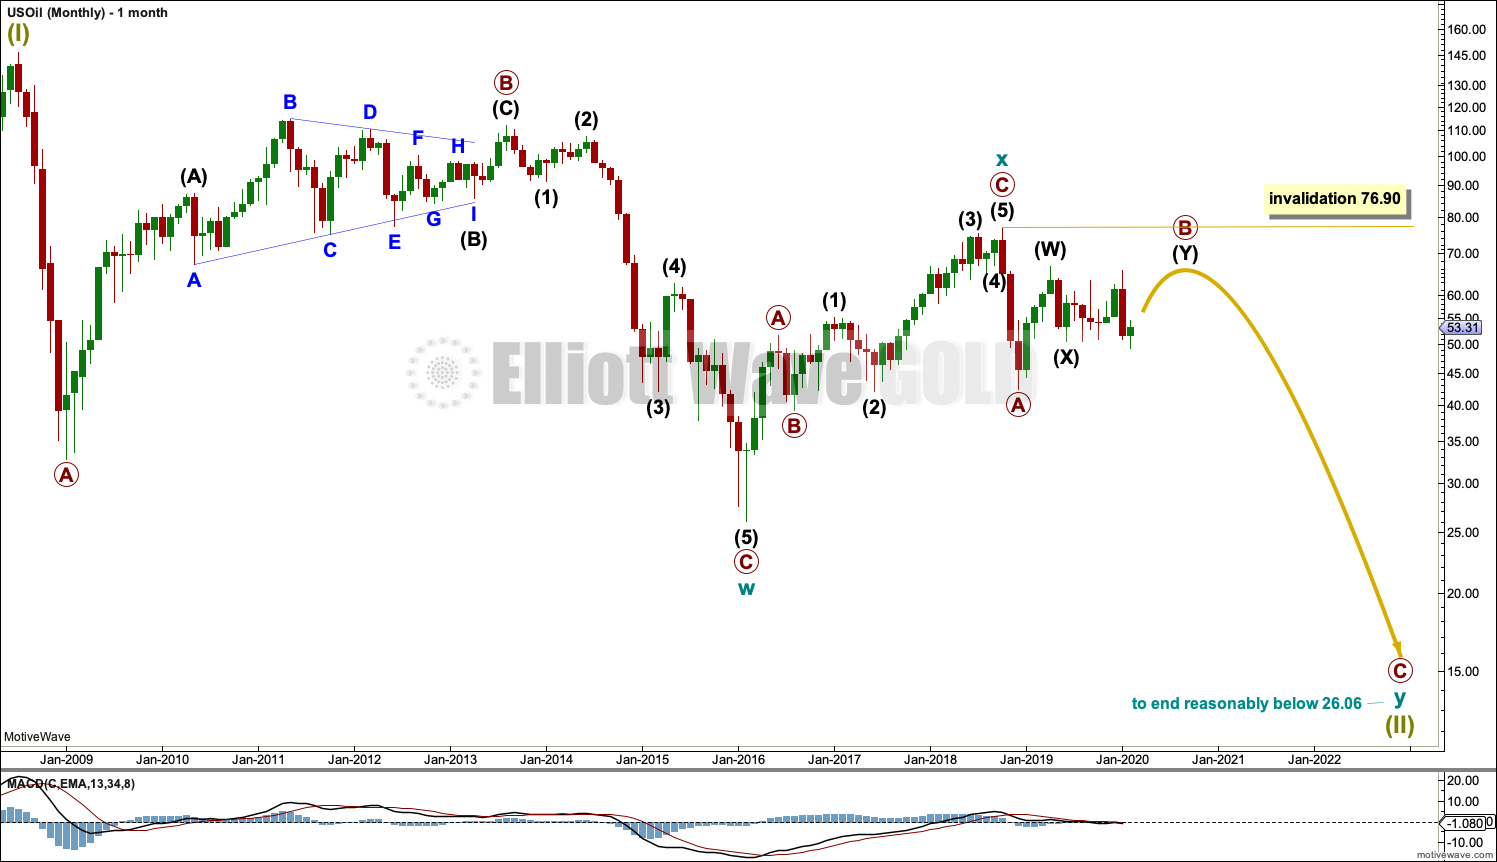
The basic Elliott wave structure is five steps forward and three steps back. This Elliott wave count expects that US Oil is still within a three steps back pattern, which began in July 2008. The Elliott wave count expects that the bear market for US Oil continues.
This Elliott wave corrective structure is a double zigzag, which is a fairly common structure. The correction is labelled Super Cycle wave (II).
The first zigzag in the double is complete and labelled cycle wave w. The double is joined by a three in the opposite direction labelled cycle wave x, which subdivides as a zigzag. The second zigzag in the double may now have begun, labelled cycle wave y.
The purpose of a second zigzag in a double zigzag is to deepen the correction when the first zigzag does not move price deep enough. To achieve this purpose cycle wave y may be expected to move reasonably below the end of cycle wave w at 26.06. When primary wave B may be complete then the start of primary wave C may be known and a target may be calculated.
Cycle wave y is expected to subdivide as a zigzag, which subdivides 5-3-5.
Cycle wave w lasted 7.6 years and cycle wave x lasted 2.7 years. Cycle wave y may be expected to last possibly about a Fibonacci 5 or 8 years.
Primary wave B may not move beyond the start of primary wave A above 76.90.
WEEKLY CHART
Click chart to enlarge.
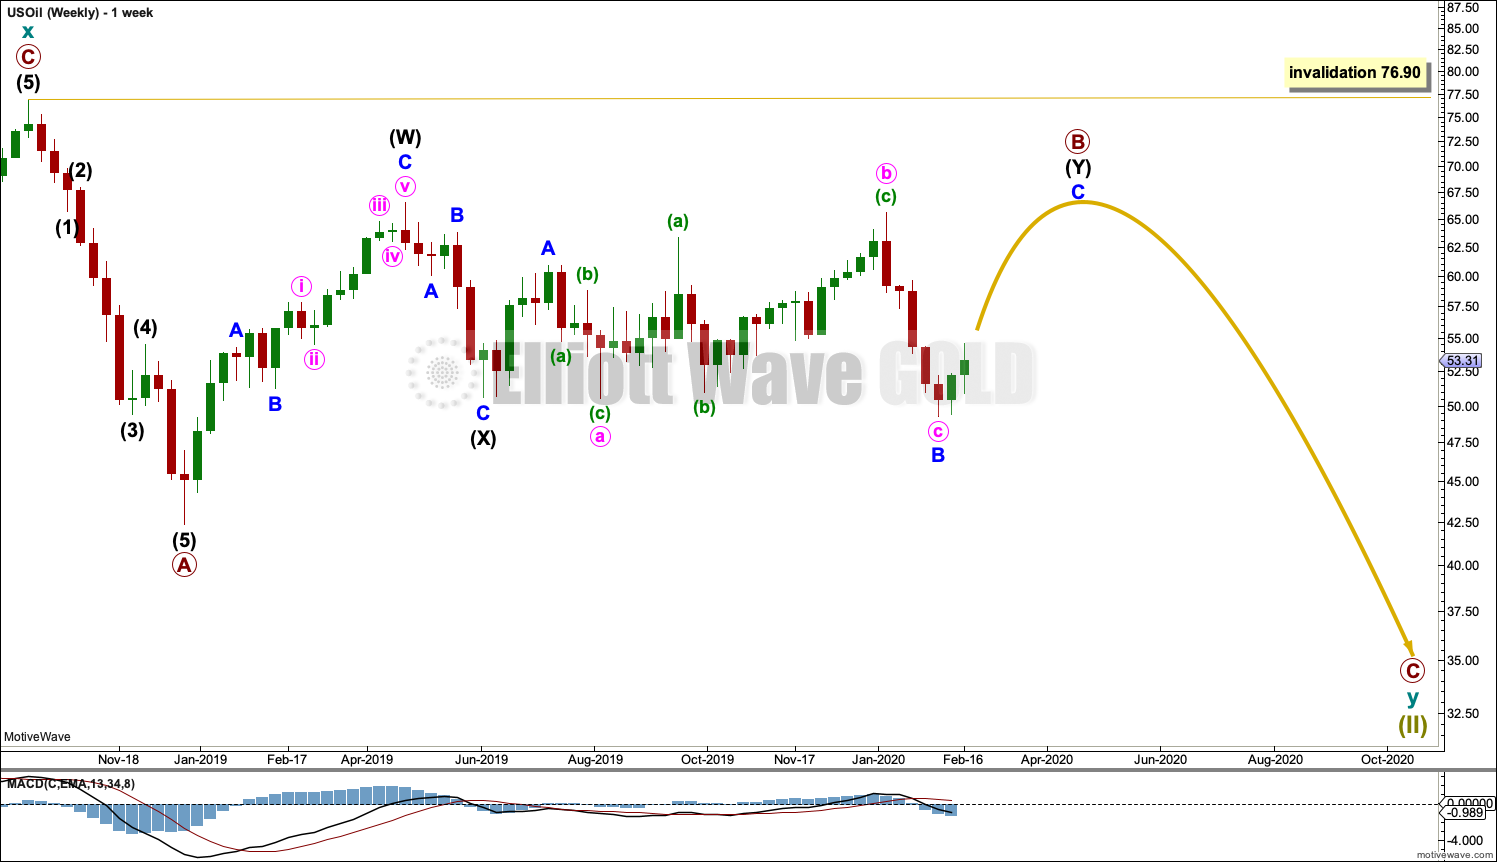
This weekly chart shows all of cycle wave y so far.
Cycle wave y is expected to subdivide as a zigzag. A zigzag subdivides 5-3-5. Primary wave A must subdivide as a five wave structure if this wave count is correct.
Primary wave A may be a complete five wave impulse at the last low.
Primary wave B may be a double combination: zigzag – X – flat. Intermediate wave (W) fits as a zigzag. Intermediate wave (Y) may be unfolding as a flat correction.
Within intermediate wave (Y), minor wave A may be complete. Minor wave B may be a complete expanded flat. Minor wave C may now move upwards to complete the flat correction of intermediate wave (Y).
Within the flat correction of intermediate wave (Y), minor wave C would be very likely to make at least a slight new high above the end of minor wave A at 60.93 to avoid a truncation and a very rare running flat.
When primary wave B may be complete, then a downwards breakout would be expected for primary wave C.
Primary wave B may not move beyond the start of primary wave A above 76.90.
DAILY CHART
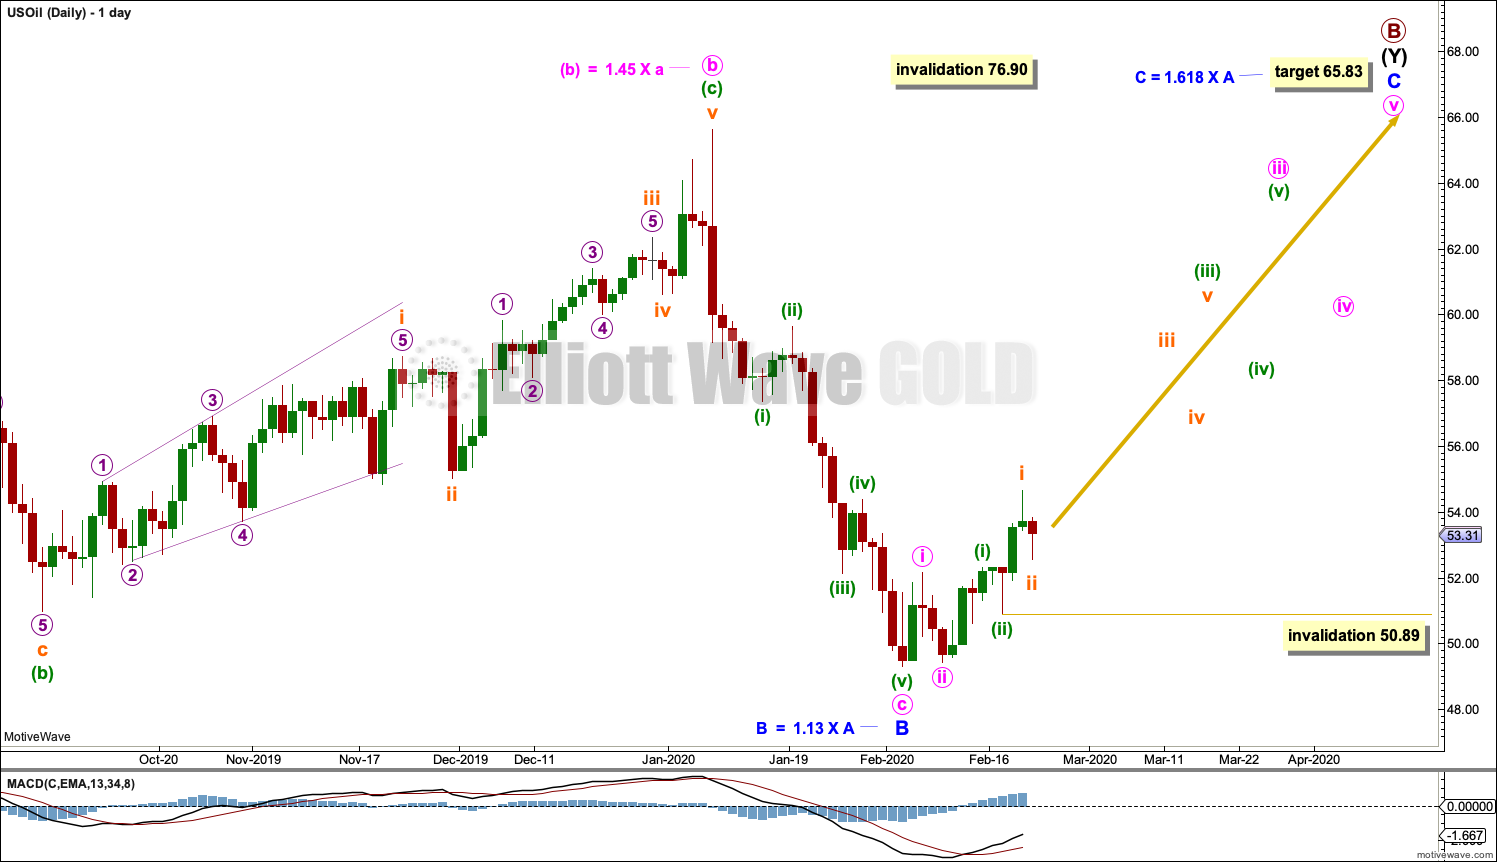
Click chart to enlarge.
This daily chart shows the end of intermediate wave (Y).
Intermediate wave (Y) may be subdividing as a flat correction. Within the flat, minor waves A and B both subdivide as threes. Minor wave B at 1.13 the length of minor wave A is within the most common range of 1 to 1.38. The target calculated for minor wave C expects it to exhibit the most common Fibonacci ratio to minor wave A.
A new high above 54.38 could not be a second wave correction within minuette wave (v) within minute wave c, so at that stage minute wave c and minor wave B would most likely be complete.
There may now be within minor wave C a series of three overlapping first and second waves complete. An increase in upwards momentum may begin over the next very few weeks.
Subminuette wave ii may not move beyond the start of subminuette wave i below 50.89.
ALTERNATE ELLIOTT WAVE COUNT
MONTHLY CHART
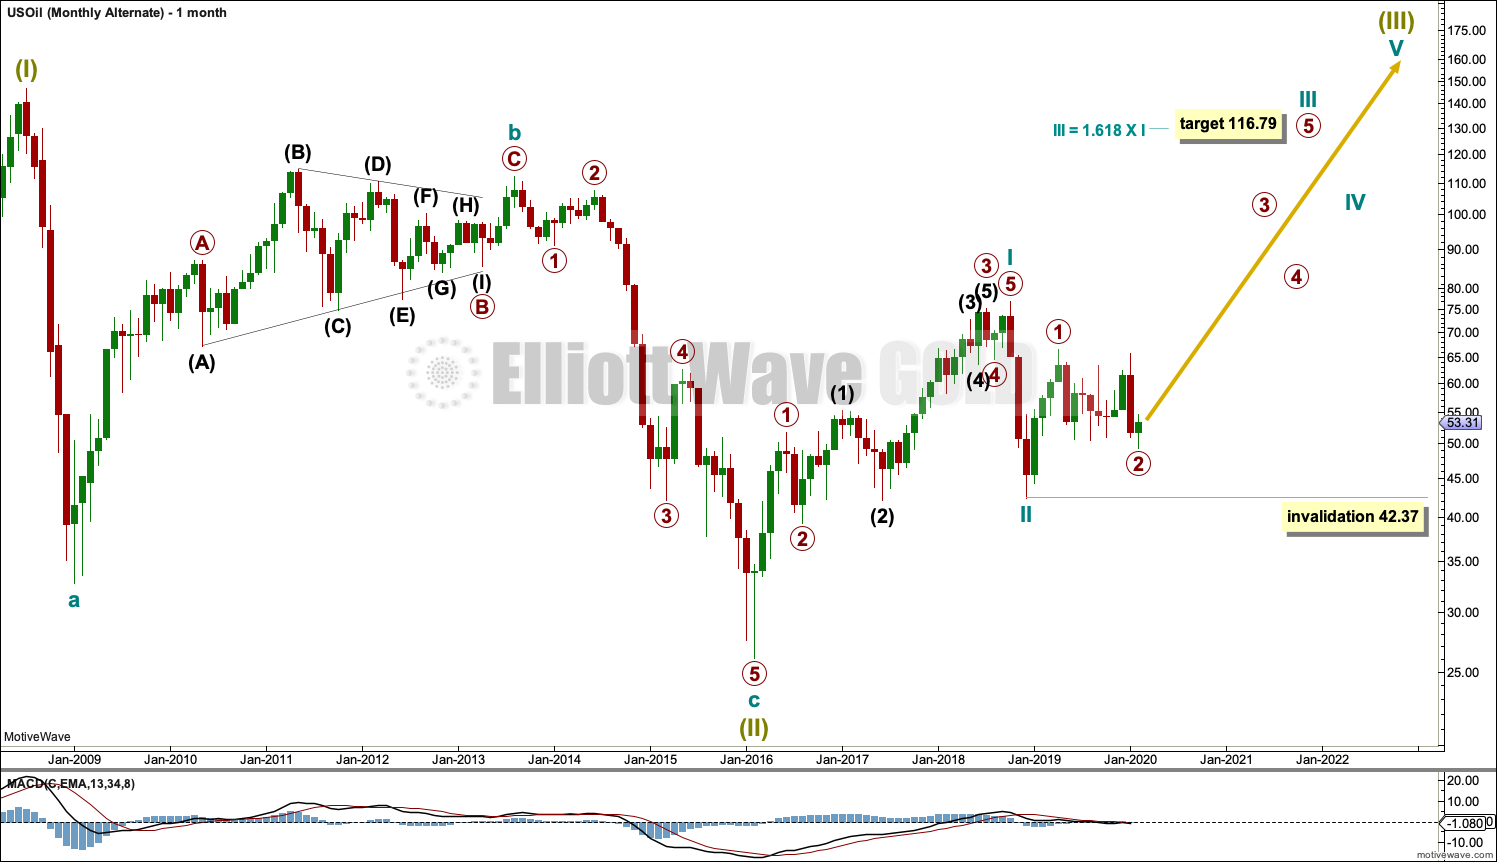
Click chart to enlarge.
It is possible that the bear market is over for Oil and a new bull market has begun.
For a bullish wave count for Oil, the upwards wave from the major low at 26.06 in February 2016 must be seen as a complete five wave impulse. This is labelled cycle wave I.
Cycle wave II may be a complete zigzag at 0.679 the depth of cycle wave I.
A target is calculated for cycle wave III to reach a common Fibonacci ratio to cycle wave I.
Within cycle wave III, no second wave correction may move beyond the start of its first wave below 42.37.
WEEKLY CHART
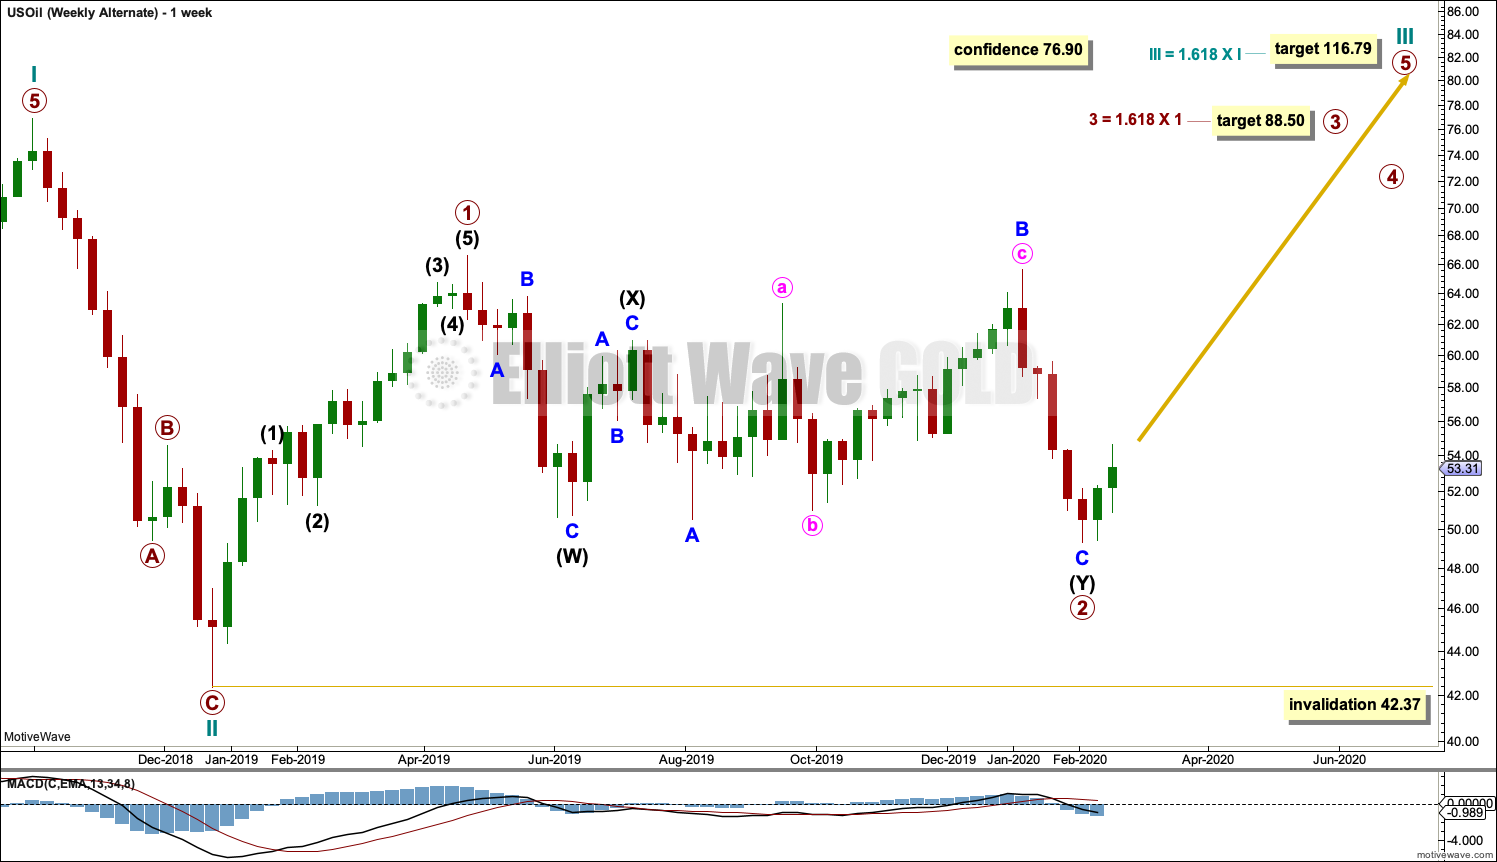
Click chart to enlarge.
Cycle wave II does look best as a three. This is the only part of this wave count that has a better look than the main wave count, which sees this downwards wave as a five.
The upwards wave of primary wave 1 within cycle wave III must be seen as a five wave structure for a bullish wave count to work. This movement at lower time frames does not subdivide well as a five; this reduces the probability of this wave count.
Cycle wave III may only subdivide as an impulse. Within cycle wave III, so far primary waves 1 and 2 may be complete. If it continues any lower, then primary wave 2 may not move beyond the start of primary wave 1 below 42.37.
A target calculated for primary wave 3 expects it to exhibit a common Fibonacci ratio to primary wave 1.
DAILY CHART
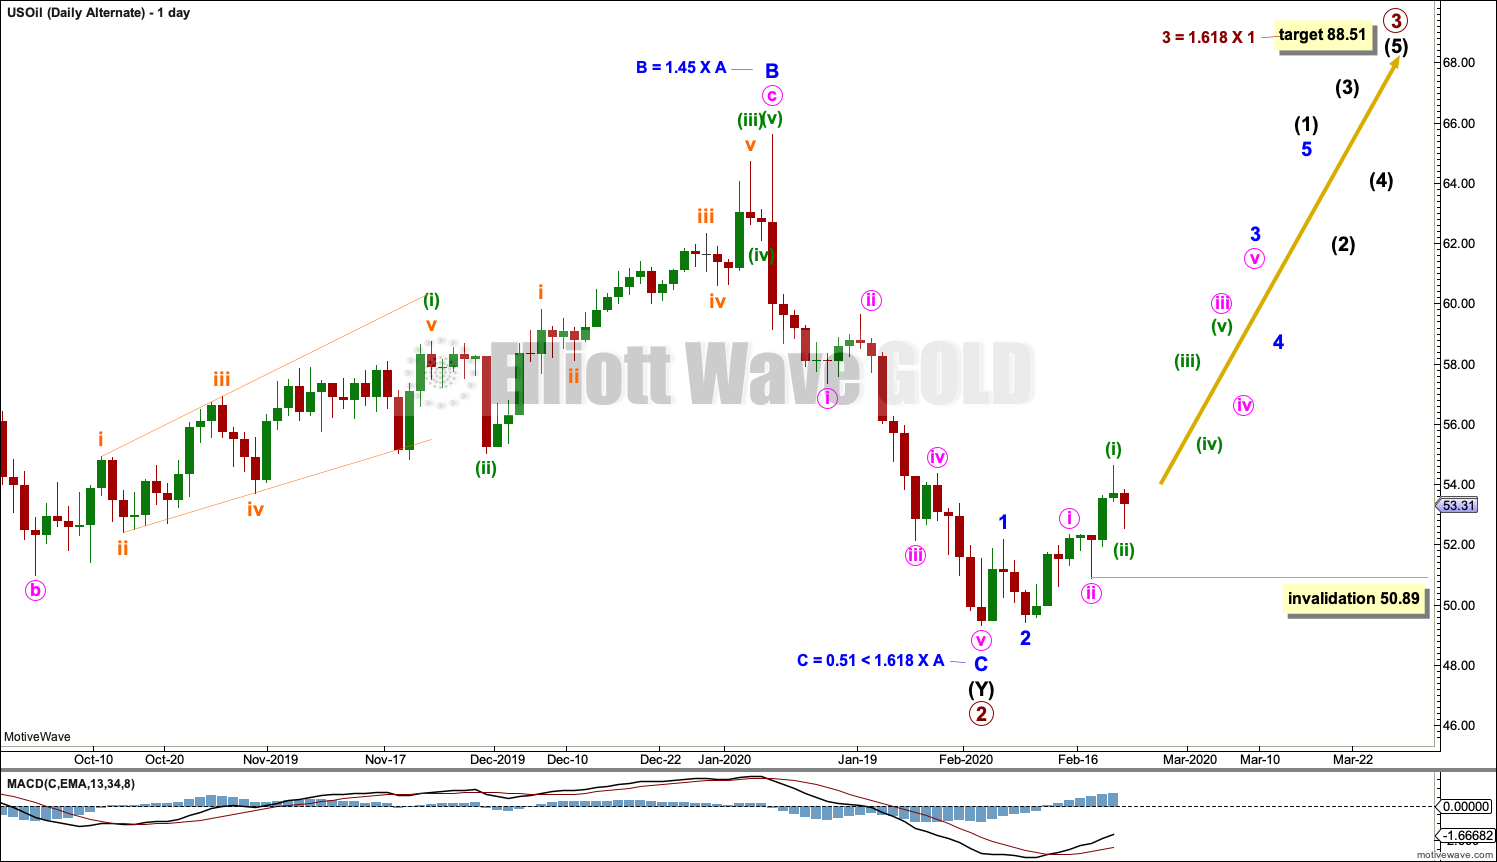
Click chart to enlarge.
Primary wave 2 may now be a complete double combination.
Primary wave 3 may have begun. It may only subdivide as an impulse.
Intermediate wave (1) within primary wave 3 may only subdivide as a five wave motive structure, most likely an impulse. There may now be within intermediate wave (1) a complete series of three overlapping first and second waves. An increase in upwards momentum may begin.
Minuette wave (ii) may not move beyond the start of minuette wave (i) below 50.89.
TECHNICAL ANALYSIS
MONTHLY CHART
Click chart to enlarge. Chart courtesy of StockCharts.com.
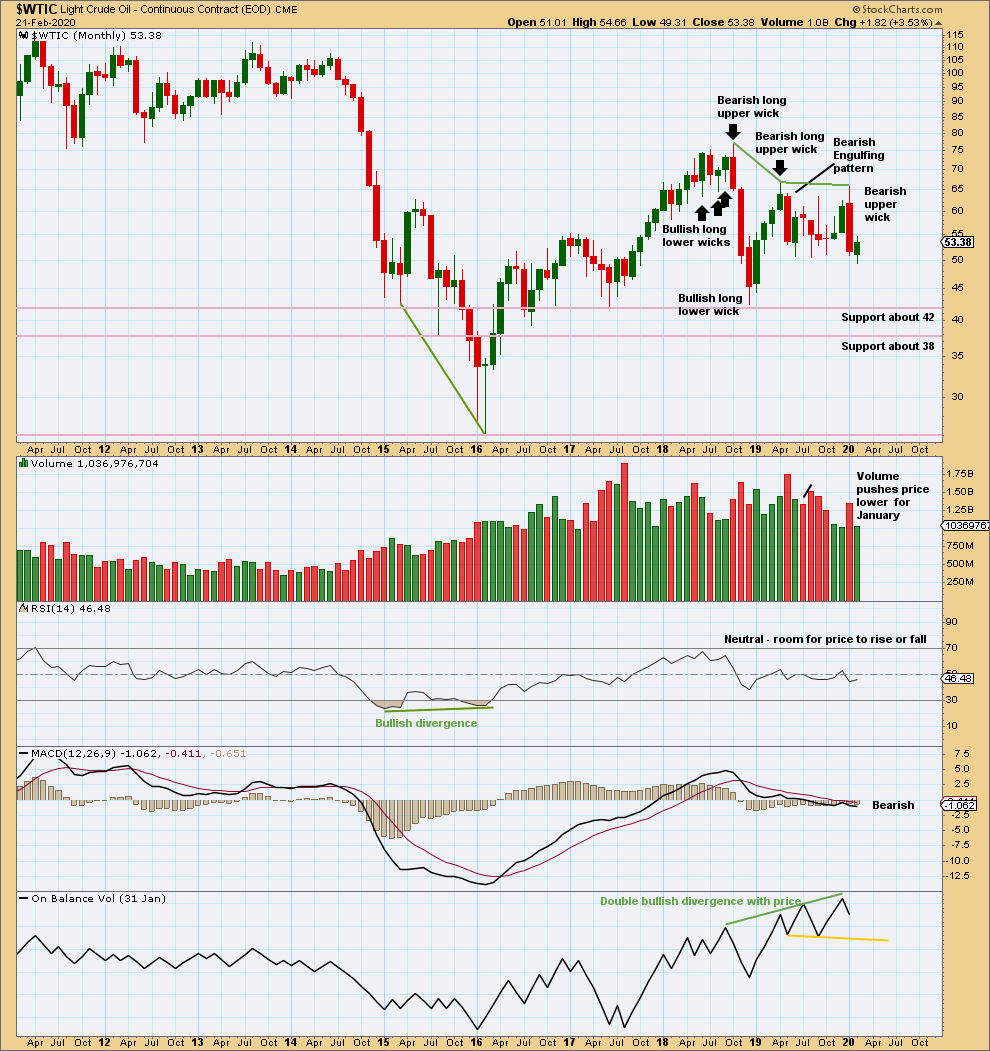
There is now double bullish divergence between price and On Balance Volume. This supports the alternate Elliott wave count.
Overall, price has been moving sideways for a few months now. Within this sideways movement, the downwards month of May has greatest range and volume; this supports the main Elliott wave count. Upwards movement for December lacks support from volume. Now downwards movement for January exhibits increased range and support from volume. The volume profile remains bearish; this supports the main Elliott wave count. More weight is given to this evidence than to divergence with On Balance Volume, as that tends to be a little less reliable.
WEEKLY CHART
Click chart to enlarge. Chart courtesy of StockCharts.com.
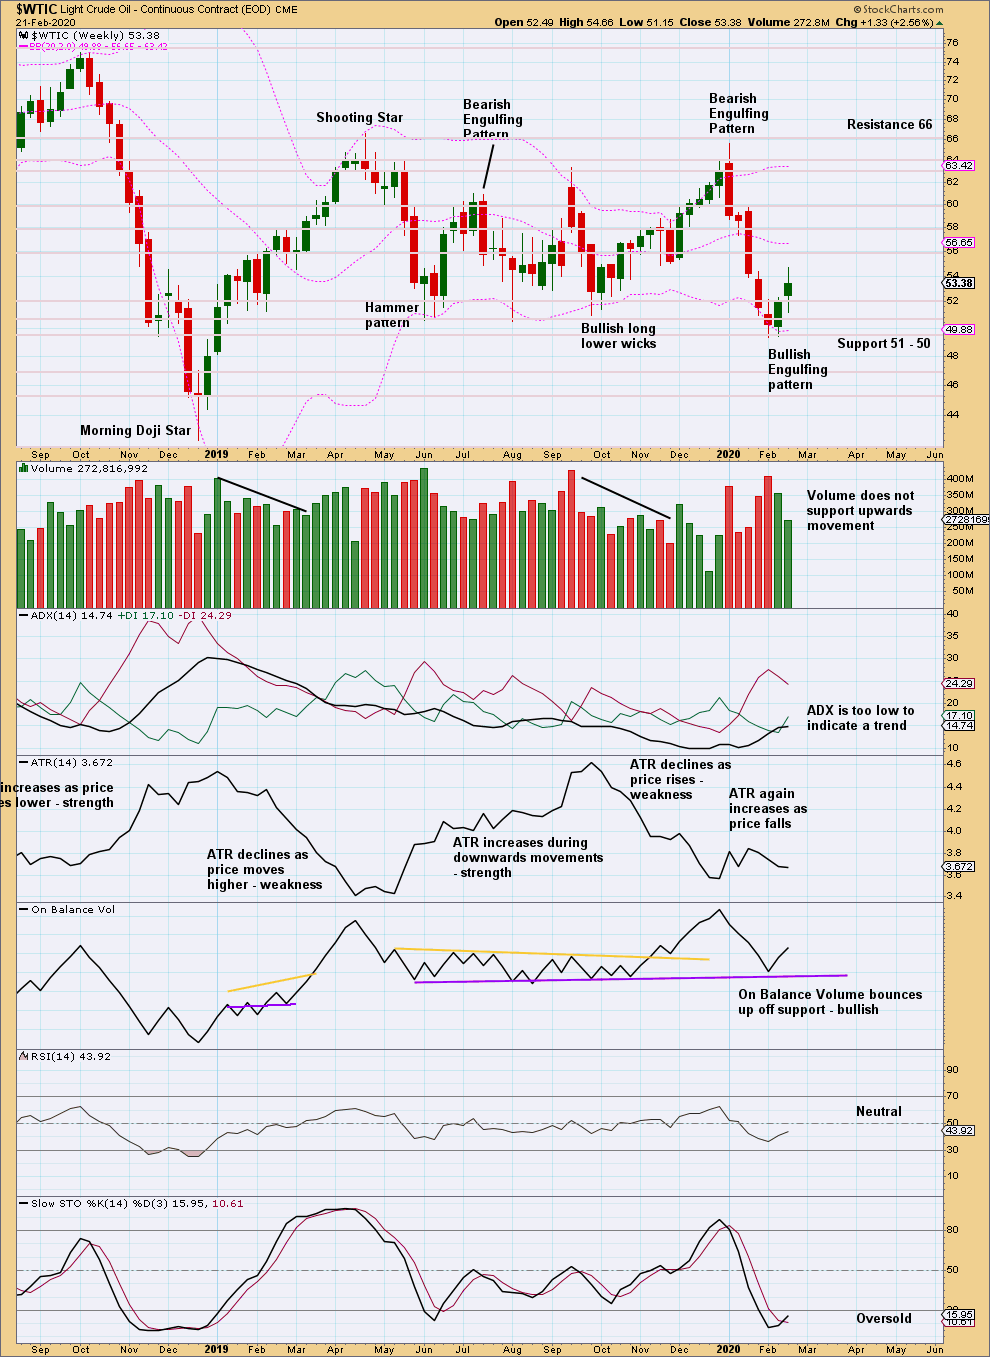
Price is consolidating, swinging from support to resistance and back again. Support is about 50 – 51 and resistance is about 66. A downwards swing may now be over; price reached support and Stochastics reached oversold. A bullish signal last week from On Balance Volume is reasonable as the support line is long held, tested multiple times and close to horizontal.
It is now reasonable to expect an upwards swing to resistance has begun, indicated by a bullish candlestick pattern at support while Stochastics was oversold.
When price consolidates, each swing is normally very choppy and overlapping. Do not expect price to move in a straight line.
A lack of support from volume this week for upwards movement is not concerning. It may indicate a small pullback to again test support could unfold here.
DAILY CHART
Click chart to enlarge. Chart courtesy of StockCharts.com.
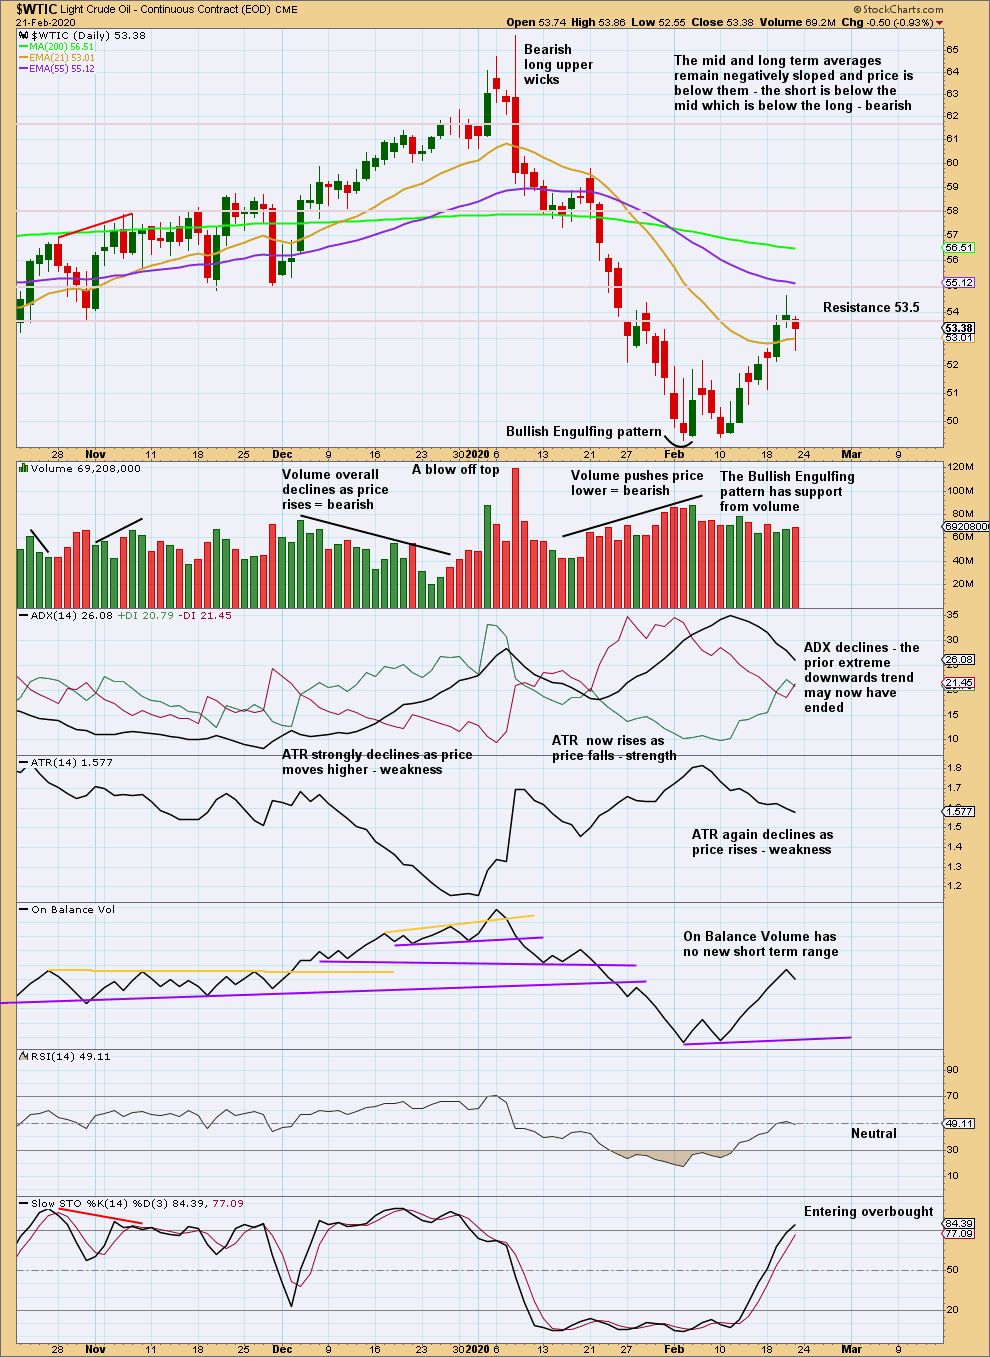
The weekly time frame is best to view the larger consolidation. This daily time frame focusses more on each swing within the larger consolidation.
The downwards swing at this time frame is viewed as a downwards trend. The trend reached extreme. Stochastics and RSI reached oversold. Thereafter, a bullish candlestick reversal pattern that has support from volume suggests a trend change. This supports the Elliott wave analysis.
Friday’s candlestick has a long lower wick, which is bullish for the short term.
—
Always practice good risk management as the most important aspect of trading. Always trade with stops and invest only 1-5% of equity on any one trade. Failure to manage risk is the most common mistake new traders make.
Updated daily and weekly charts for the S&P
The impulse is invalidated. The only other possible structure is the less common ending diagonal for this fifth wave.
For the ending diagonal to complete and meet all Elliott wave rules, it must complete before the limit. The fifth wave of the diagonal must be longer than the third wave. So it must begin below 2,812.68.
Within primary 4 there should be a quick sharp bounce or a sideways consolidation for intermediate wave (B). That may begin very soon now, conditions are deeply oversold.
Updated daily chart
Thanks Lara,
What about if Grand Cycle 1 finished on October 2018? We can have a large running triangle or expanded flat… Those are possibilities that I am leaning to….
Thanks for your continuous insights…
Mathieu
Hello Lara
We broke the 3027 level so it what count we are in now? Where is the target on the alternate count now for this move down? I do not see the alternate count on your last update.
Thanks
Miro
Because it was invalidated, there are many possibilities….. Yes, an ending diagonal is a possibility but I am leaning more that the October 2018 high was probably the end of Grand Cycle I… And from there, we might have a very long Running triangle forming OR an expanded flat… I hope Lara can look into those possibilities as well…
wow…. The current count is invalidated…. I believe it is good news for the bulls but the bull market of the S&P 500 might last much longer….
“because” the bull market of the S&P 500 might last much longer…. The reason is that I believe the EW count has change to 1-2, 1-2 since the 2018 Christmas bottom … So we haven’t done Wave 3 yet… I am sure Lara will confirm…. I believe this is very exciting for the bulls….
Am trying to fathom this with minor experience. You’re suggested “1-2, 1-2” may also be written “(1)-(2), 1-2” on the Daily chart as found back on July 13, 2019?
No from the weekly charts…. But when I looked at this further, I think the high of October 2018 might the end of the Cycle 1 and we have been in correction mode since then… If it is so, then from October 2018, we might have a running triangle forming or an expanded flat…. I am not buying that this bull market will end in a diagonal…. The market breath does not support it…. I think this is a panic and it will snap back quickly…. For now, thats my opinion….
It could be an expanding diagonal – though I’ve not seen many so maybe clutching at straws.
That would certainly catch both the bulls and bears off guard!
Lara,
I think we are looking at a triangle here for the S&P. I hope wave A is done. This correction could last till May. Any thoughts?
I like your updated Oil charts thanks!
I’m leaning towards a triangle too.
I don’t think wave A is quite done yet though, the last two hourly candlesticks today have bearish long upper wicks and price remains well within a channel that contains this fall.
Draw a channel on the hourly chart that contains this big fall from 20th Feb to today, when that is breached by upwards movement then expect wave A is done.
That may happen tomorrow, or the day after.
Comment on US Oil:
The way I had labelled minute c as complete in the analysis above had great proportions and good Fibonacci ratios… but with this drop of the last two days the start of the new wave up no longer looks right.
So I’m reverting to the original target for minor B, and although now within minute c there is not a great proportion between minuette waves (ii) and (iv), overall this does still have a reasonable look.
Hi Lara, Oil broke through the last low today, and also closed below your target of 48.81. Could we be looking at going back to a previous target of $44, before we resume the uptrend?
The target at 48.81 has been reached and passed now by 0.5.
I don’t think a new target needs to be calculated, I would expect a trend change here and the end of this downwards swing and a new upwards swing to begin.
Oil has overshot its support line. It has closed below support on a downwards day with support from volume. Technically this may be a downwards breakout.
If my wave count is wrong it may be in expecting primary B is incomplete and needs one final upwards swing. It could have been over at the last high on 8th January 2020.
Hi Lara,
I went back to look at your Natural Gas analysis, and noticed that Natural Gas price has moved side ways and is now stradling the channel. How strongly do we respect the channels, and when do we discard them?
It overshot the upper edge of the channel and has now strongly returned to within the channel.
Channels are guidelines. This one wasn’t breached by a full daily candlestick fully outside and not touching the channel, it was only overshot. When that happens it’s not considered an indication of a trend change.
When a channel is breached by a full daily candlestick outside and not touching the channel by a day which moves in the opposite direction (not just a small sideways day) then it can be taken as an indication of a potential trend change.
There’s nothing 100% certain in technical analysis (nor in fundamental either). We can say that a channel breach is on balance of probabilities indication of a trend change.
Hi Lara,
Is it possible the upwards movement in Oil over the last approx 2 weeks is actual a 4th wave correction and we are setting up for a 5th wave down?
Yep. Chart above
Lara, The drop in USOIL since February 20th suggests to me that we are actually still in Minute i which started in early February. I think that it is a leading expanding diagonal, and that today’s movement down was Minuette iv of Minute i. Do you agree?
With a new low the idea is now invalidated. So price has answered your question for us.
Hi Lara!!!
Us Oil: Daily Chart
Last week confidence confirmed
Today invalidation confirmed
My question is do we revert back to last weeks invalidation point of 49.32?
If 49.32 breaks does that mean we are starting wave 5 and still going down to a lower bottom?
Larry
Thanks,
Larry
S&P Futures are at ~3250 this morning, let’s see where the market opens – could be below the support Lara identified above.
Bloody marvelooussss
This big gap down and fall in price today has indicated the EW analysis expecting intermediate (4) has arrived is highly likely.
Now that intermediate (4) is below identified support at 3,259, next support will be at the lower edge of the black channel on the daily chart.
Lara, looking at your SPX daily, I show the lower edge of the Black channel near 3150 to 3160? Is that correct?
Price today looks like it’s going to close below that black trend line.
That channel is drawn using Elliott’s first technique. While that often shows where fourth waves find support, it’s not always. Sometimes fourth waves overshoot those channels and so when they’re done the channel has to be redrawn using Elliott’s second technique.
Hi Lara, is it possible that the dip in January & the dip in February is an expanded flat?
Thanks,
Mathieu
Reply to MathiewLapenseee:
That would be an expanded flat for minor 4 (first weekly and daily chart S&P500)
Yes, that is possible and it’s an alternate I will chart if I see enough strength off lows here (or in another day or two) to indicate a sustainable low in place.
But if upwards movement is weak I’ll stick with seeing it as intermediate (4).
Lara
Was Tuesday February 25th, a 90% down day on S&P?
Thanks
Rich