
Lara’s Weekly: Elliott Wave and Technical Analysis of S&P500 and Gold and US Oil | Charts – February 28, 2020

S&P 500
Downwards movement continued for Friday as last analysis expected. While this fall in price this week has been dramatic, it should be viewed in the larger context of the bull market that began in March 2009. Analysis of the current pullback in context of recent prior movement suggests this may be not much different from prior deeper pullbacks within the secular bull market.
Summary: There is no evidence to suggest the larger bull market is over. The current pullback is very deep and not likely to be finished yet. At its conclusion, it may present a good buying opportunity.
For the short term, a bounce or sideways consolidation may begin for wave B. Thereafter, wave C may end below 2,812.68 but not below 2,728.81.
The biggest picture, Grand Super Cycle analysis, is here.
Monthly charts were last published here. Video here.
ELLIOTT WAVE COUNTS
FIRST WAVE COUNT
MONTHLY CHART
Click chart to enlarge.
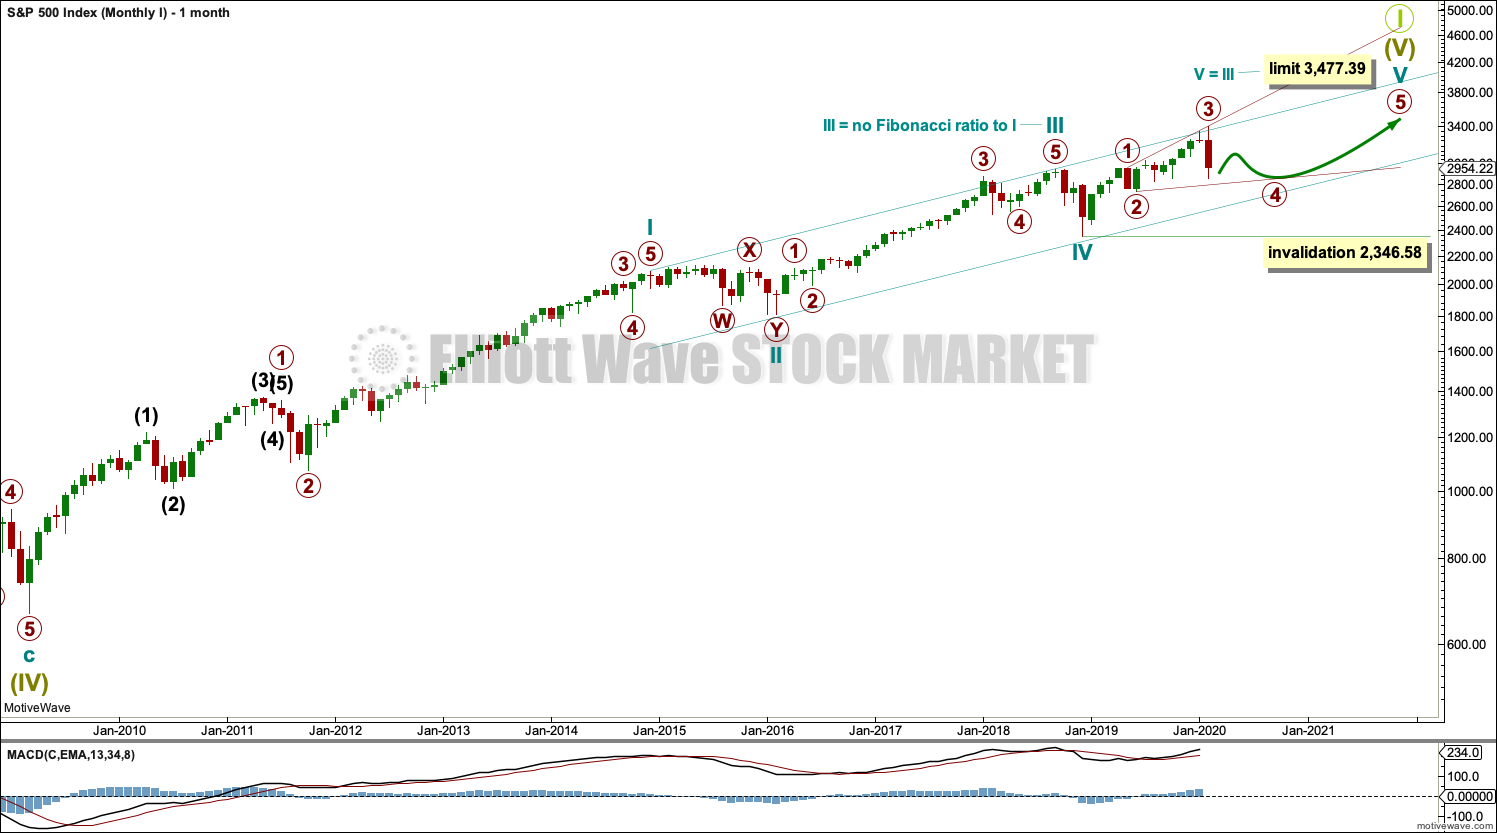
Super Cycle wave (IV) completed a 8.5 year correction. Thereafter, a bull market began for Super Cycle wave (V). The structure of Super Cycle wave (V) is incomplete. It is subdividing as an impulse.
A channel is drawn about the impulse of Super Cycle wave (V) using Elliott’s first technique. Draw this channel first from the high of 2,079.46 on the 5th of December 2014 to the high of 2,940.91 on the 21st of September 2018, then place a parallel copy on the low at 1,810.10 on the 11th of February 2016. Cycle wave IV found support about the lower edge.
There is perfect alternation between a shallow time consuming combination for cycle wave II and a deeper and more brief double zigzag for cycle wave IV. The speed and depth of cycle wave IV makes these two corrections look like they should be labelled the same degree. This wave count has the right look.
The middle of the third wave overshoots the upper edge of the Elliott channel drawn about this impulse. All remaining movement is contained within the channel. This has a typical look.
Within cycle wave V, no second wave correction may move beyond the start of its first wave below 2,346.58.
This wave count expects MACD to begin to exhibit divergence with price as price makes new highs. Cycle wave III may exhibit strongest momentum and cycle wave V may exhibit some weakness. Price is making new highs, but MACD has not. This remains the main wave count.
Within Super Cycle wave (V), cycle wave III may not be the shortest actionary wave. Because cycle wave III is shorter than cycle wave I, this limits cycle wave V to no longer than equality in length with cycle wave III at 3,477.39. A new high by any amount at any time frame above this point would invalidate this main wave count in favour of one of the two alternate monthly charts which may be seen in last published monthly analysis.
This wave count agrees with MACD. Cycle wave III exhibits strongest momentum, and primary wave 3 within cycle wave III exhibits the strongest histogram within MACD.
WEEKLY CHART
Click chart to enlarge.
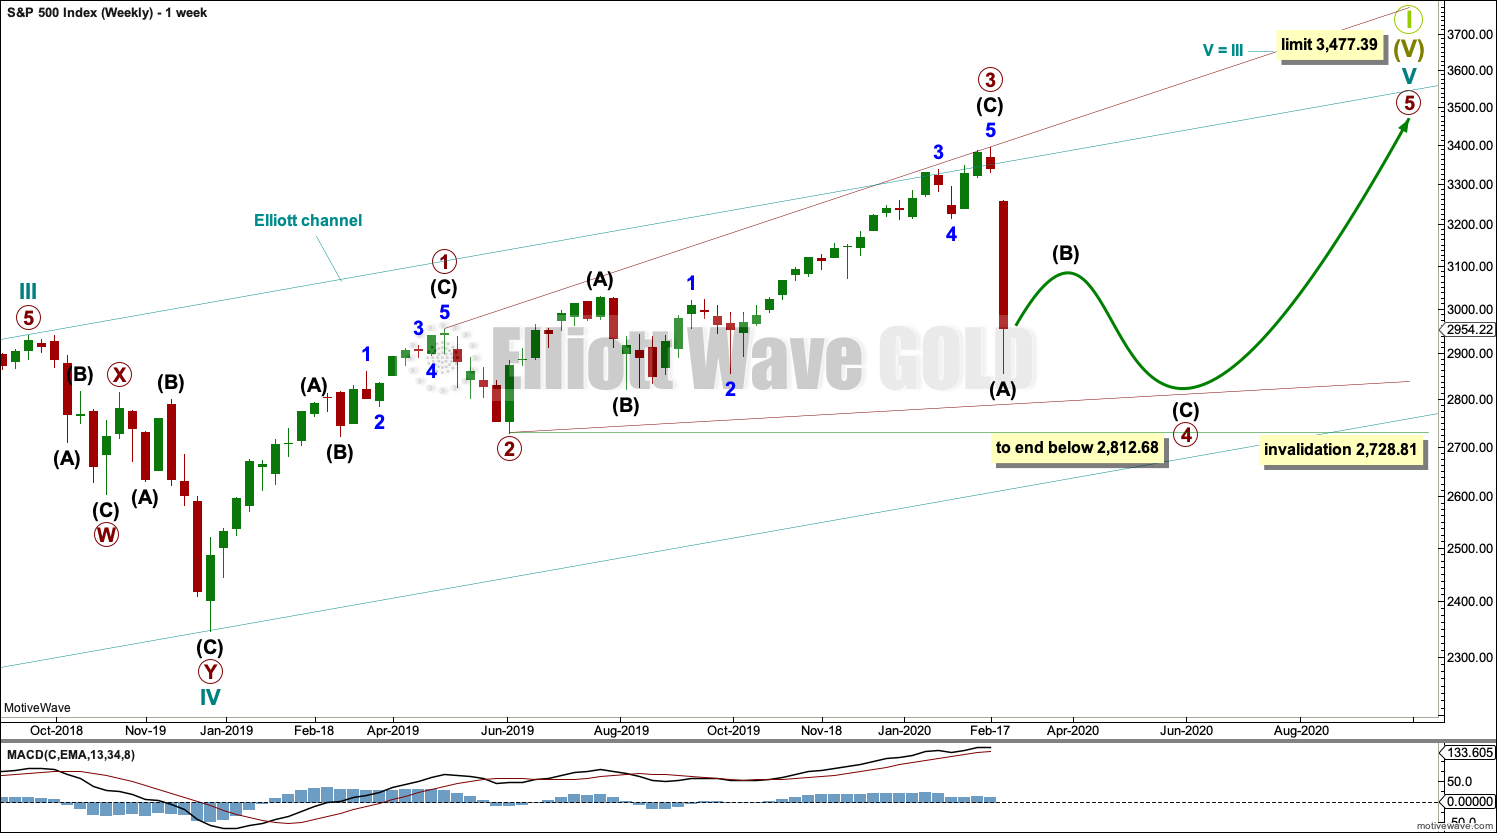
Cycle wave V may subdivide either as an impulse or an ending diagonal. Impulses are much more common, but at this stage an impulse is now invalidated and so the only remaining possible structure is a diagonal.
At this stage, cycle wave V may end within this year or possibly into next year.
The daily chart below will focus on movement from the end of intermediate wave (B) within primary wave 3.
Ending diagonals require all sub-waves to subdivide as zigzags. Primary wave 4 of a diagonal must overlap primary wave 2. This rule is now met. Primary wave 4 may not move below the end of primary wave 2 below 2,728.81.
This ending diagonal would be expanding. Primary wave 3 is longer than primary wave 1, and primary wave 4 so far is longer than primary wave 2. Primary wave 5 would need to be longer than primary wave 3 for all rules regarding wave lengths of expanding diagonals to be met.
Fourth and second waves of diagonals most commonly end somewhere between 0.66 to 0.81 of the prior wave. This gives a target zone for primary wave 4 from 2,954.81 to 2,855.10. However, this diagonal is expanding and primary wave 5 needs to be longer in length than primary wave 3, which was 664.71 points for this rule to be met. This rule needs to be met prior to the upper limit for cycle wave V at 3,477.39, so primary wave 5 would need to begin below 2,812.68.
DAILY CHART
Click chart to enlarge.
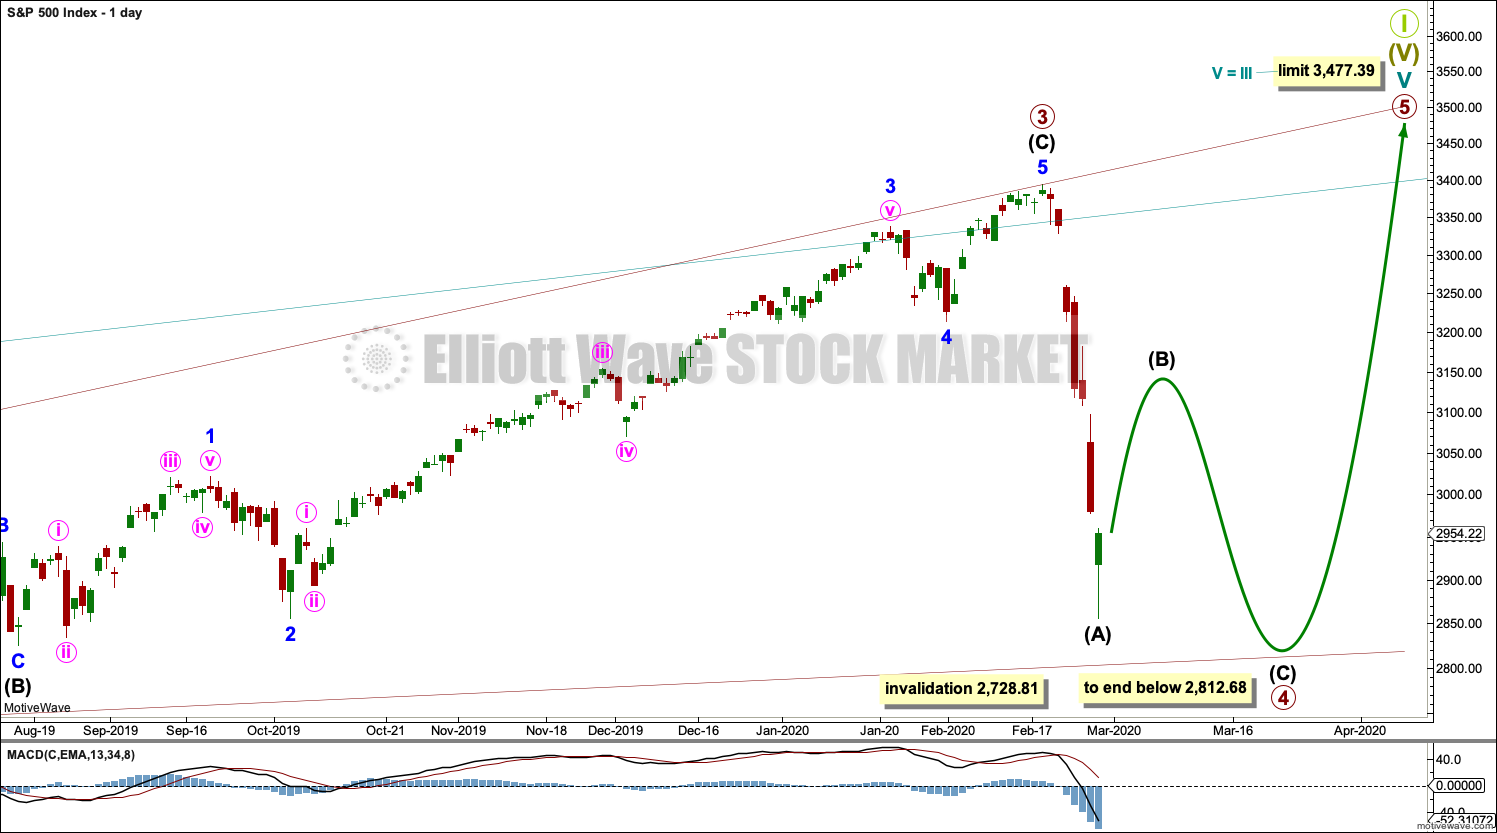
All sub-waves of an ending diagonal must subdivide as zigzags. This is the only Elliott wave structure where a third wave sub-divides as anything other than an impulse.
Primary wave 4 must subdivide as a zigzag. Within the zigzag, there would very likely be a sharp bounce or a time consuming sideways consolidation for intermediate wave (B).
Diagonals normally adhere very well to their trend lines, which may be tested within the sub-waves. The upper 1-3 trend line is tested at the end of minor wave 3 within intermediate wave (C) within primary wave 3.
Primary wave 4 may not move beyond the end of primary wave 2 below 2,728.81.
SECOND WAVE COUNT
WEEKLY CHART
Click chart to enlarge.
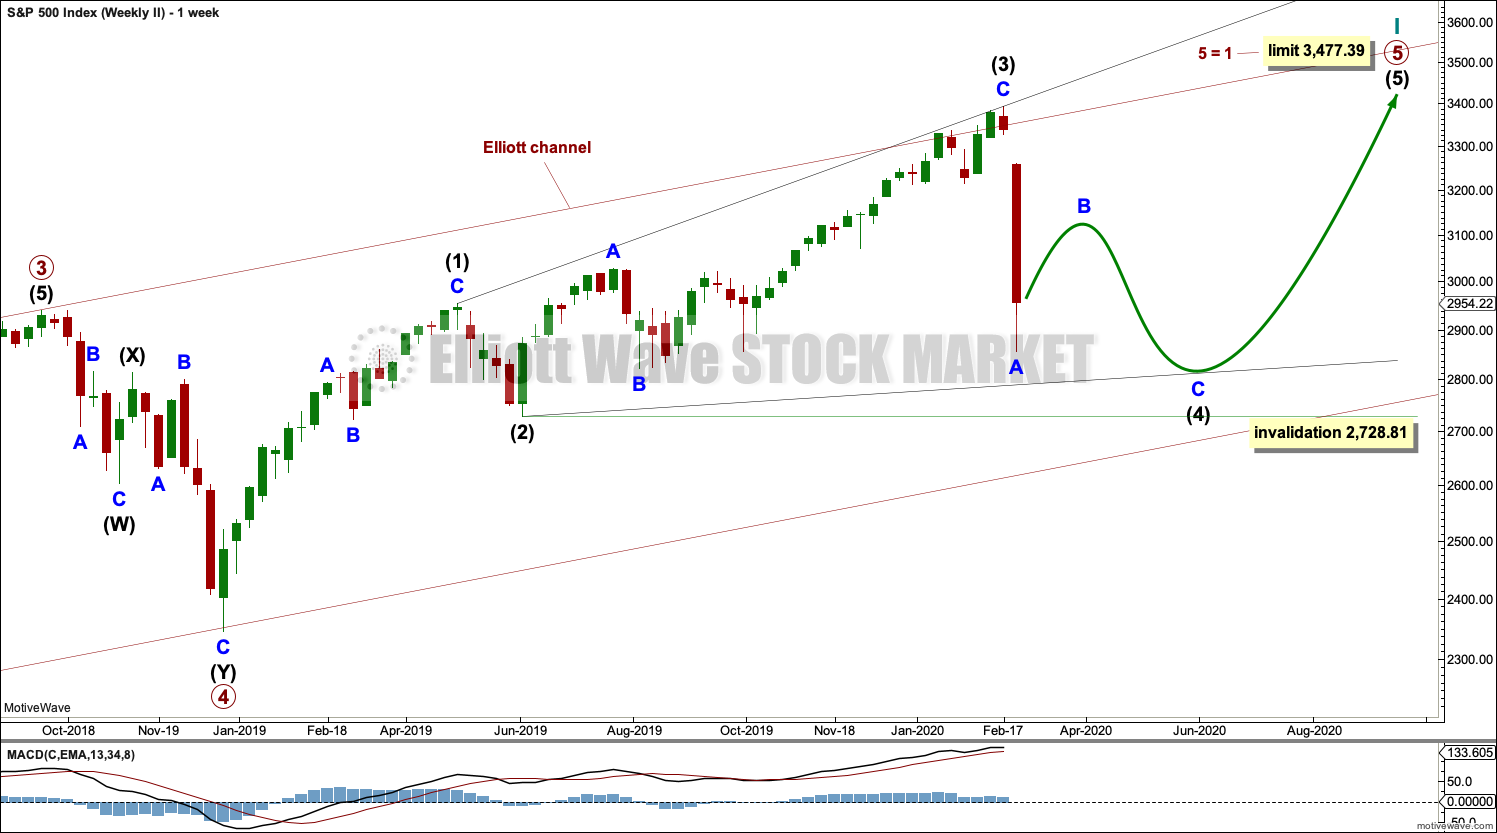
This second wave count sees all subdivisions from the end of the March 2009 low in almost the same way, with the sole difference being the degree of labelling.
If the degree of labelling for the entirety of this bull market is all moved down one degree, then only a first wave at cycle degree may be nearing an end.
When cycle wave I is complete, then cycle wave II should meet the technical definition of a bear market as it should retrace more than 20% of cycle wave I, but it may end about either the 0.382 or 0.618 Fibonacci Ratios of cycle wave I. Cycle wave II may end close to the low of primary wave II within cycle wave I, which is at 1,810.10. It is also possible that cycle wave II could be fairly shallow and only barely meet the definition of a bear market.
An ending expanding diagonal is still viewed as nearing an end. This wave count labels it primary wave 5. Primary wave 5 may still need another year to two or so to complete, depending upon how time consuming the corrections within it may be.
Primary wave 5 may be subdividing as a diagonal, in the same way that cycle wave V is seen for the first weekly chart.
TECHNICAL ANALYSIS
MONTHLY CHART
Click chart to enlarge. Chart courtesy of StockCharts.com.
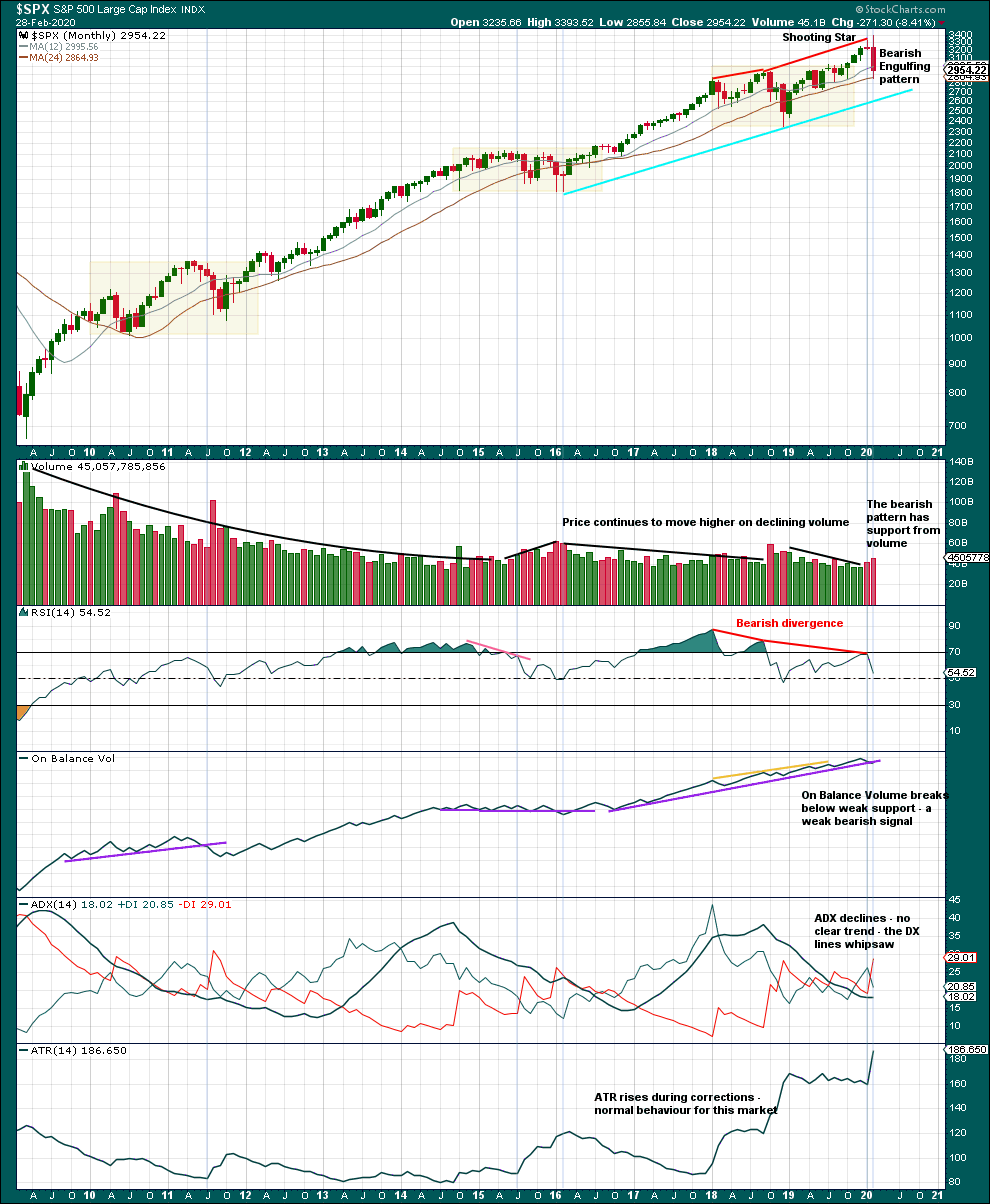
This monthly chart shows the entire bull market which began in March 2009. Three large multi-month consolidations are identified by shaded areas on this chart. Note that the first two consolidations were followed closely by a test of support, which entered the prior area of consolidation by some margin, and then by a large sustained upwards trend.
The most recent consolidation is now followed by a test of support, which has re-entered the prior area of consolidation. This test was outlined in last monthly analysis as a normal and to be expected behaviour following a multi-month consolidation. Upon the completion of this test, it would be normal for price to move up and away in a sustained bullish move.
WEEKLY CHART
Click chart to enlarge. Chart courtesy of StockCharts.com.
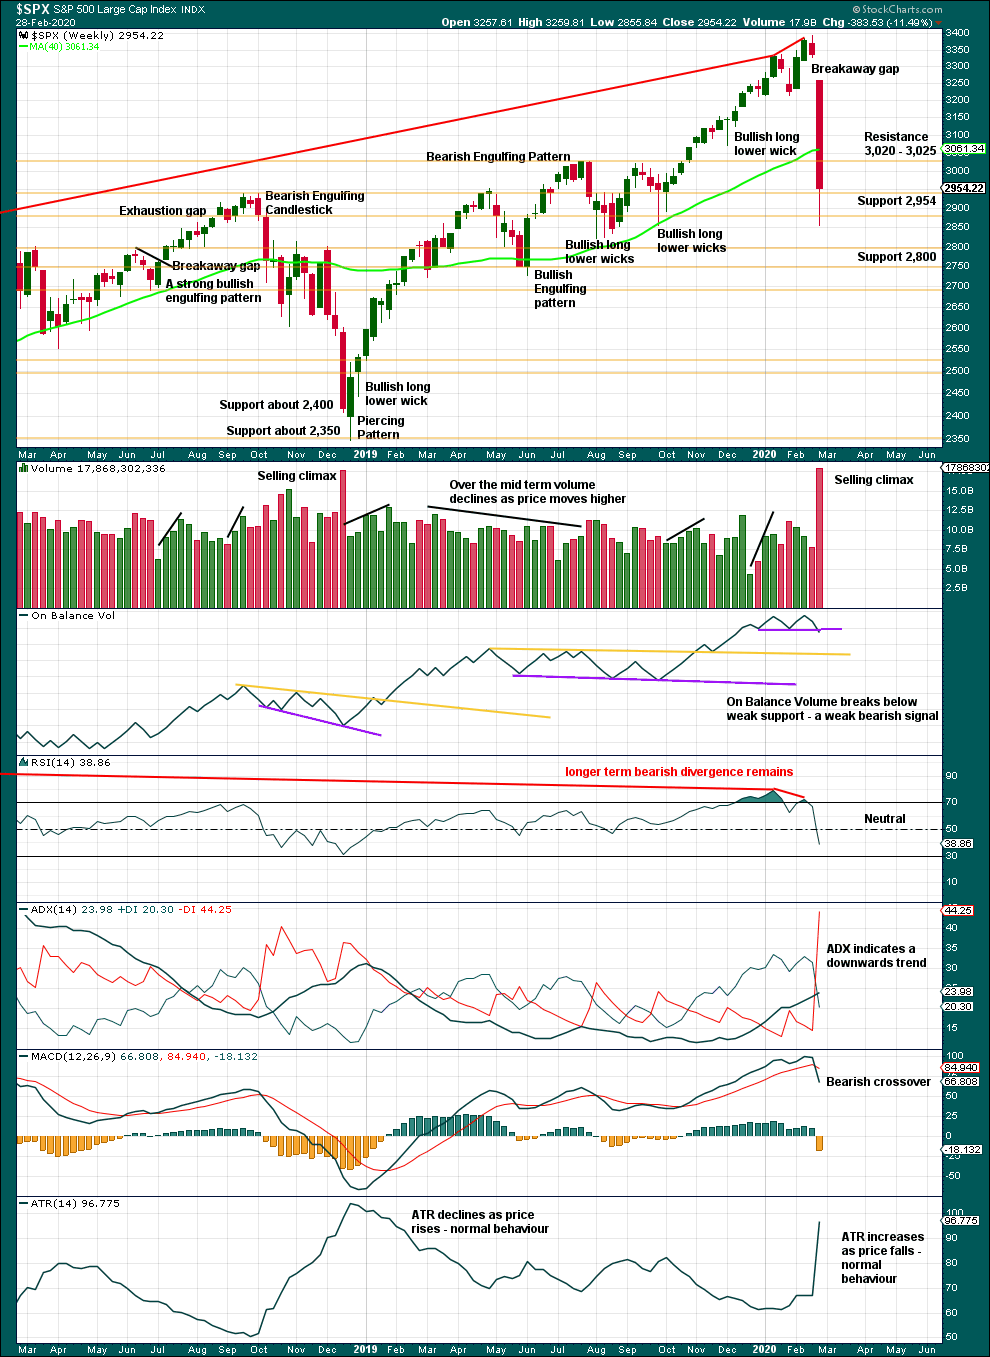
Risk of a pullback identified last week has been followed by a 15.8% drop in price (high to low) so far. This dramatic drop in price has precedent within the larger bull market. It does not necessarily mean the secular bull market must be over.
At the weekly chart level, conditions are not yet oversold; this pullback may be expected to continue further.
For the short term, the volume spike this week may be a selling climax. In conjunction with a bullish long lower wick on this weekly candlestick, a bounce may be expected about here.
DAILY CHART
Click chart to enlarge. Chart courtesy of StockCharts.com.
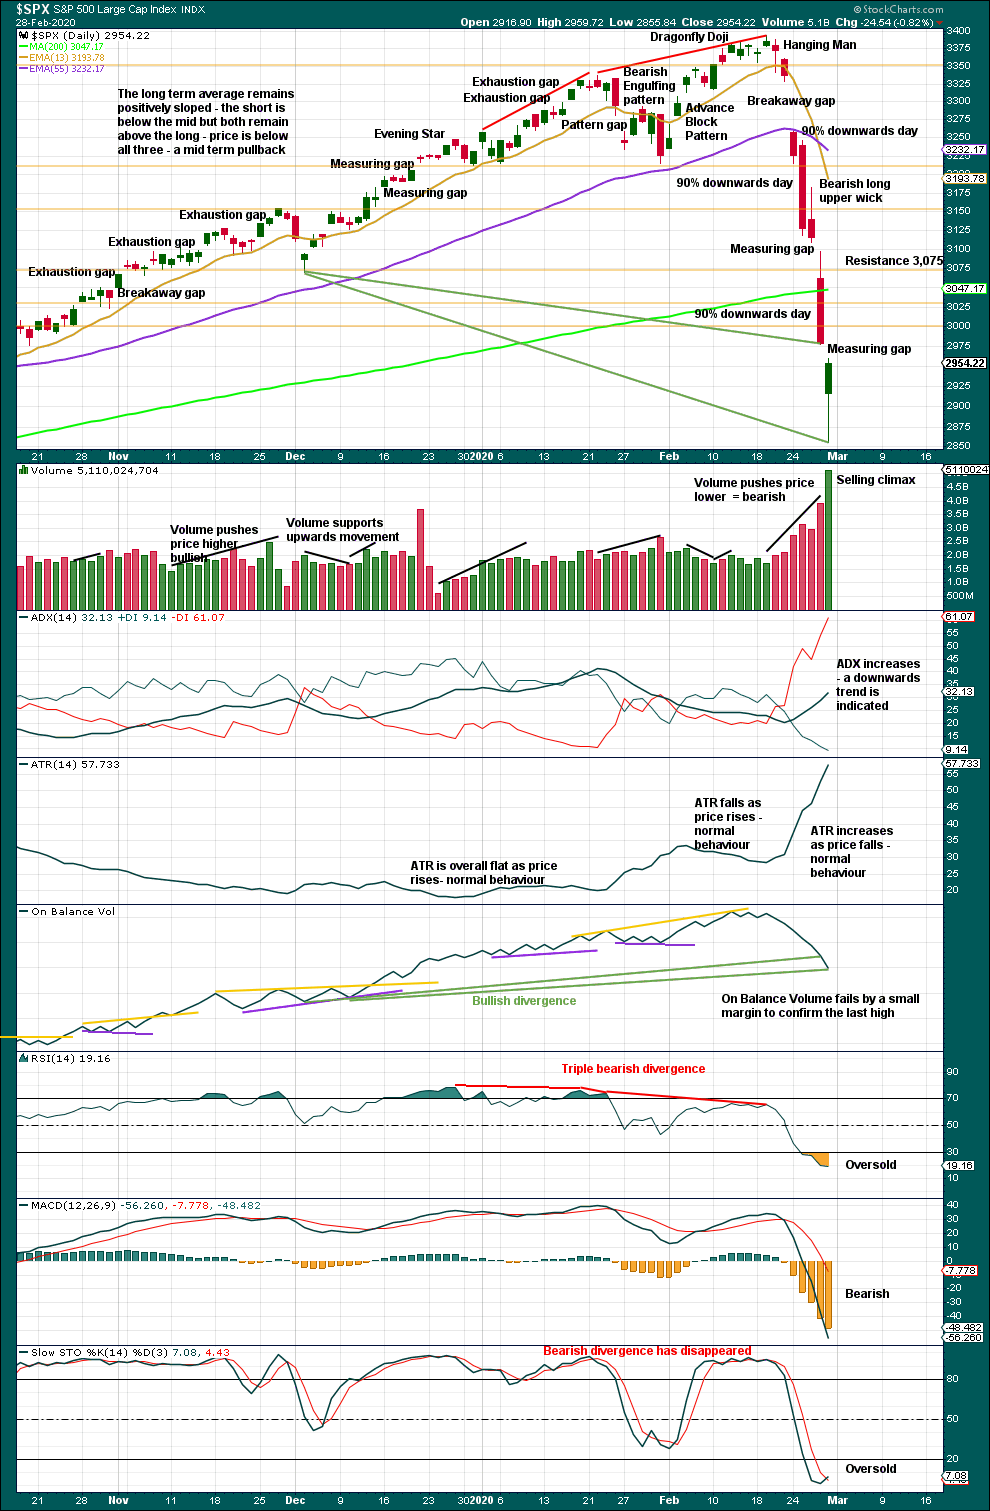
There are now three 90% downwards days in this strong downwards movement.
Following a 90% downwards day, either a 90% upwards day or two back to back 80% upwards days within 3 sessions would be required to indicate a 180°reversal in sentiment and indicate a sustainable low may be in place.
The measuring gap from Thursday gave a target at 2,946.25, which was met and exceeded.
The measuring gap from Friday now gives a target at 2,840.04, which has not quite been met by the end of Friday’s session. The long lower wick and strong close to Friday’s session suggests it may not be met.
Price is falling faster than On Balance Volume. This divergence is bullish and suggests this pullback may be an interruption to the secular bull market.
BREADTH – AD LINE
WEEKLY CHART
Click chart to enlarge. Chart courtesy of StockCharts.com. So that colour blind members are included, bearish signals will be noted with blue and bullish signals with yellow.
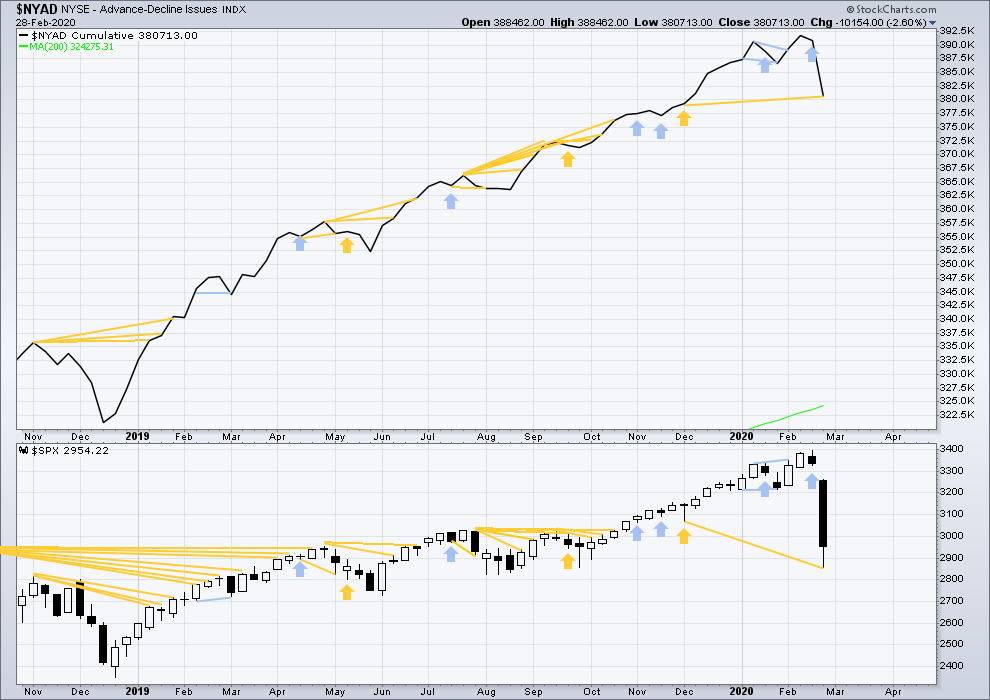
Bear markets from the Great Depression and onwards have been preceded by an average minimum of 4 months divergence between price and the AD line with only two exceptions in 1946 and 1976. With the AD line making new all time highs with last all time highs from price, the end of this bull market and the start of a new bear market is very likely a minimum of 4 months away, which is mid June 2020.
In all bear markets in the last 90 years there is some positive correlation (0.6022) between the length of bearish divergence and the depth of the following bear market. No to little divergence is correlated with more shallow bear markets. Longer divergence is correlated with deeper bear markets.
If a bear market does develop here, it comes after no bearish divergence. It would therefore more likely be shallow.
This week price and the AD line have both moved lower. Price has made new lows below the prior swing low of the week beginning 2nd December 2019, but the AD line has not. Price is falling faster than market breadth; breadth does not support this fall in price. This divergence is bullish and fairly strong, and it supports the new Elliott wave count.
Large caps all time high: 3,393.52 on 19th February 2020.
Mid caps all time high: 2,109.43 on 20th February 2020.
Small caps all time high: 1,100.58 on 27th August 2018.
DAILY CHART
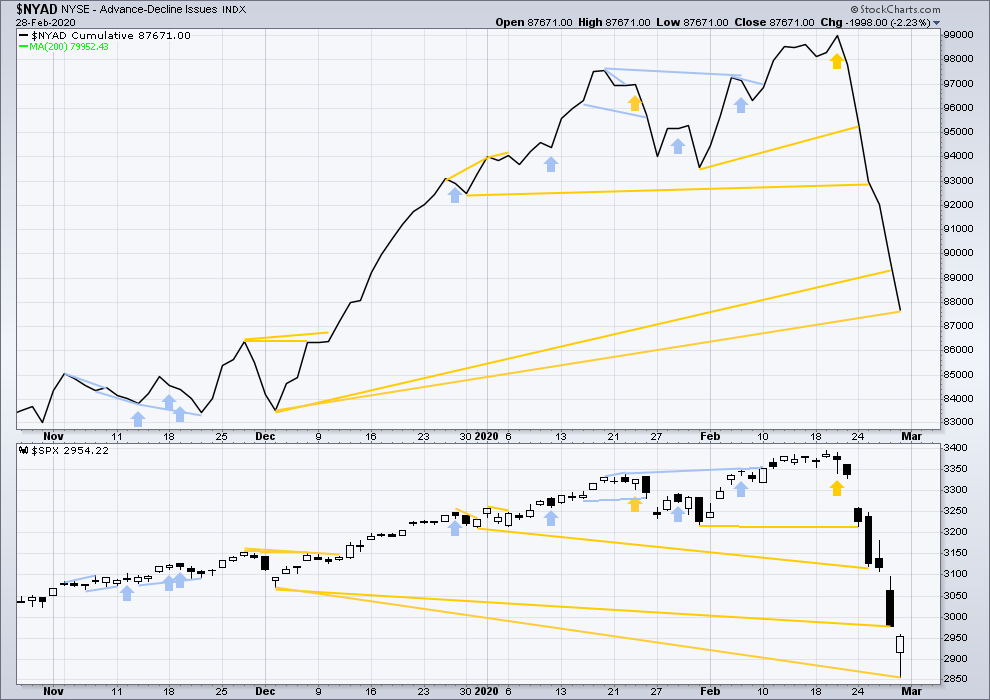
Click chart to enlarge. Chart courtesy of StockCharts.com. So that colour blind members are included, bearish signals will be noted with blue and bullish signals with yellow.
Breadth should be read as a leading indicator.
Again, price has made a new low below the prior small swing low of the 3rd of December 2019, but the AD line has not. Price is falling faster than market breadth. This divergence is bullish.
VOLATILITY – INVERTED VIX CHART
WEEKLY CHART
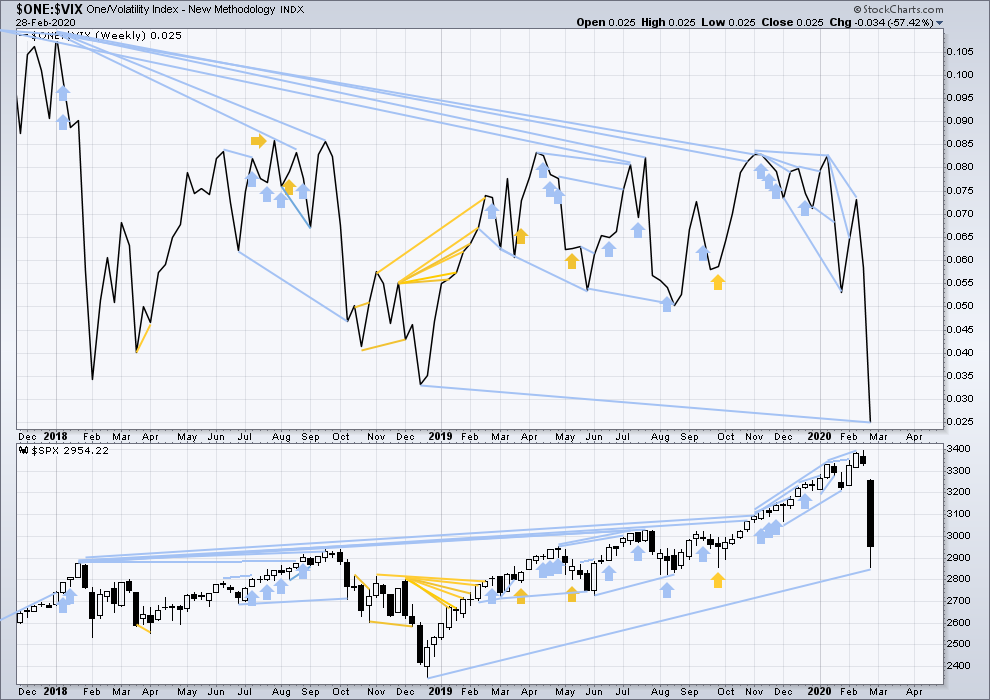
Click chart to enlarge. Chart courtesy of StockCharts.com. So that colour blind members are included, bearish signals will be noted with blue and bullish signals with yellow.
The all time high for inverted VIX was on 30th October 2017. There is now over two years of bearish divergence between price and inverted VIX.
The rise in price is not coming with a normal corresponding decline in VIX; VIX remains elevated. This long-term divergence is bearish and may yet develop further as the bull market matures.
This divergence may be an early warning, a part of the process of a top developing that may take years. It is clearly not useful in timing a trend change from bull to a fully fledged bear market.
This week both price and inverted VIX have moved lower. Inverted VIX has made new lows below prior lows of weeks beginning 17th / 24th December, but price has not. Inverted VIX is falling faster than price. This divergence is bearish. Because this disagrees with the AD line this week, it shall not be given weight in this analysis.
DAILY CHART
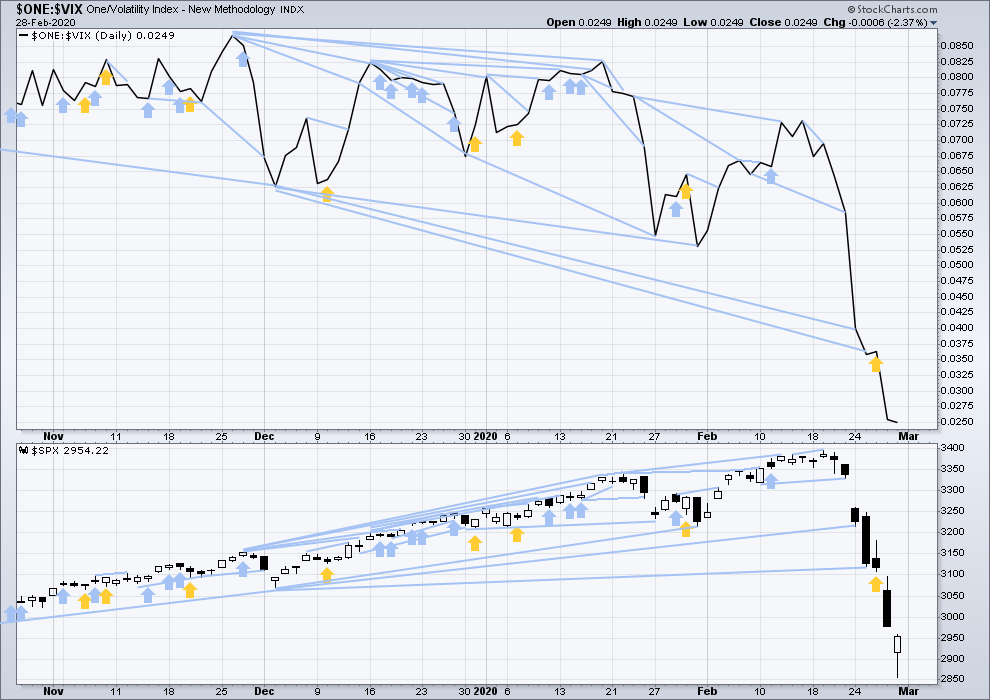
Click chart to enlarge. Chart courtesy of StockCharts.com. So that colour blind members are included, bearish signals will be noted with blue and bullish signals with yellow.
Again, both price and inverted VIX have moved to make new mid-term lows. There is no new divergence.
DOW THEORY
Dow Theory would confirm a bull market if the following highs are made:
DJIA: 26,951.81 – a close above this point has been made on the 3rd of July 2019.
DJT: 11,623.58 – to date DJT has failed to confirm an ongoing bull market.
S&P500: 2,940.91 – a close above this point was made on the 29th of April 2019.
Nasdaq: 8,133.30 – a close above this point was made on the 26th of April 2019.
Dow Theory would confirm a bear market if the following lows are made on a closing basis:
DJIA: 21,712.53
DJT: 8,636.79
S&P500: 2,346.58
Nasdaq: 7,292.22
GOLD
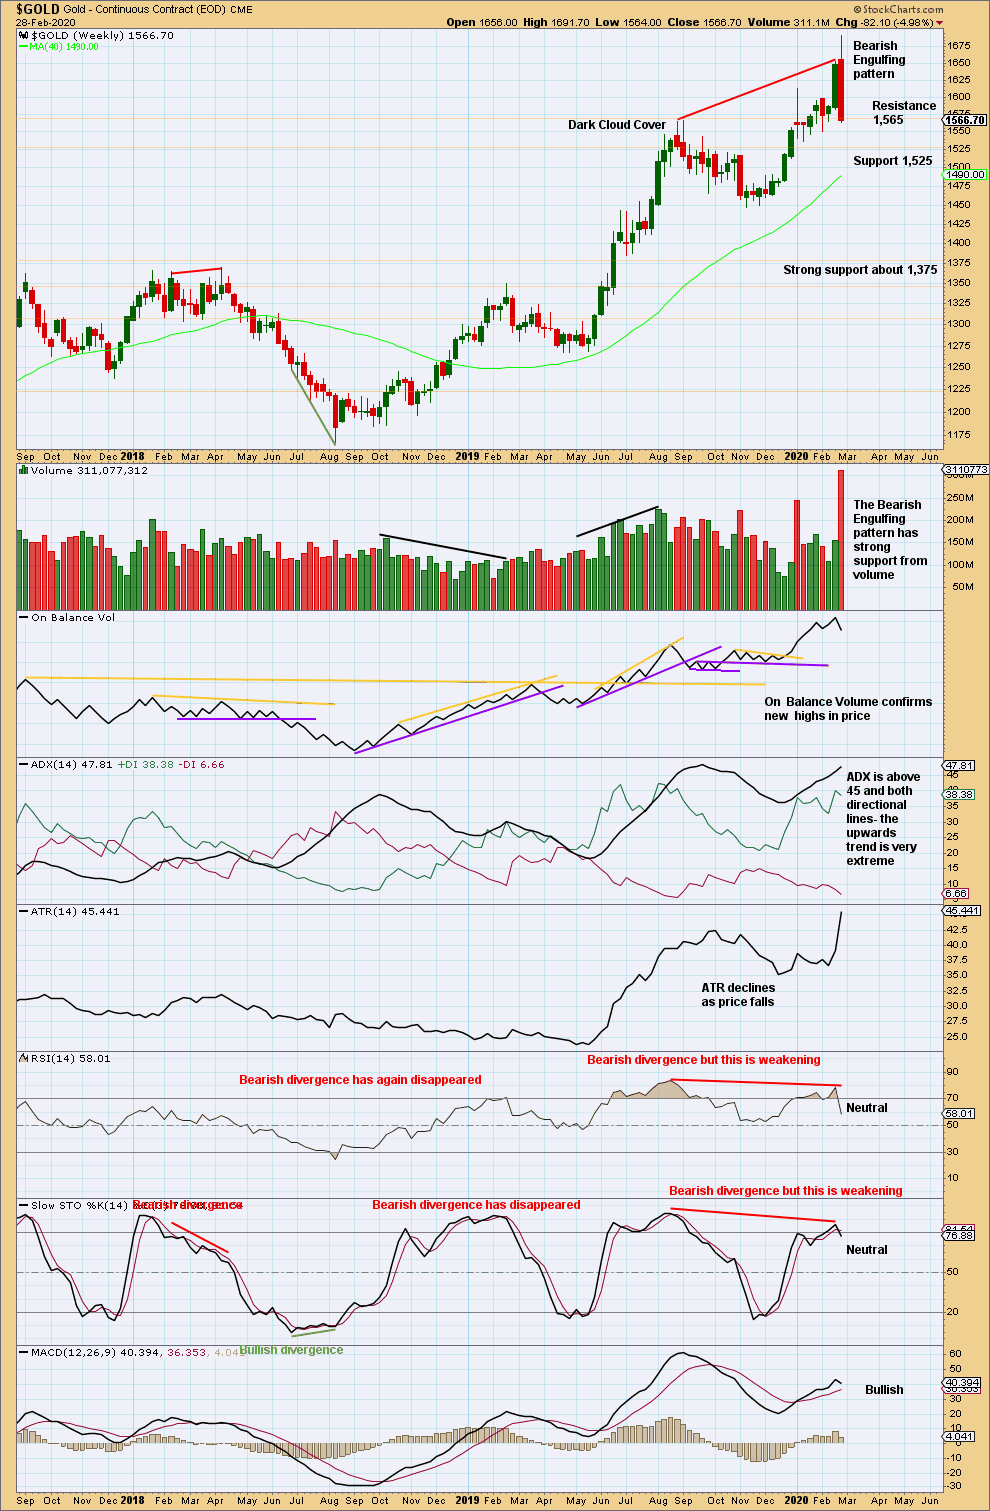
A strong bearish engulfing pattern on the weekly chart has strong support from volume. This indicates a high is in place for Gold.
Summary: The bear market may have resumed for Gold to eventually make new lows below 1,046.27. For the short term, the first five down is incomplete. Expect more downwards movement next week. When a small fourth wave correction is over, then a target for the fifth wave may be calculated.
The alternate bullish wave count now expects a cycle degree fourth wave may have just begun.
Grand SuperCycle analysis is here.
Monthly charts were last updated here.
BEARISH ELLIOTT WAVE COUNT
WEEKLY CHART
Click chart to enlarge.
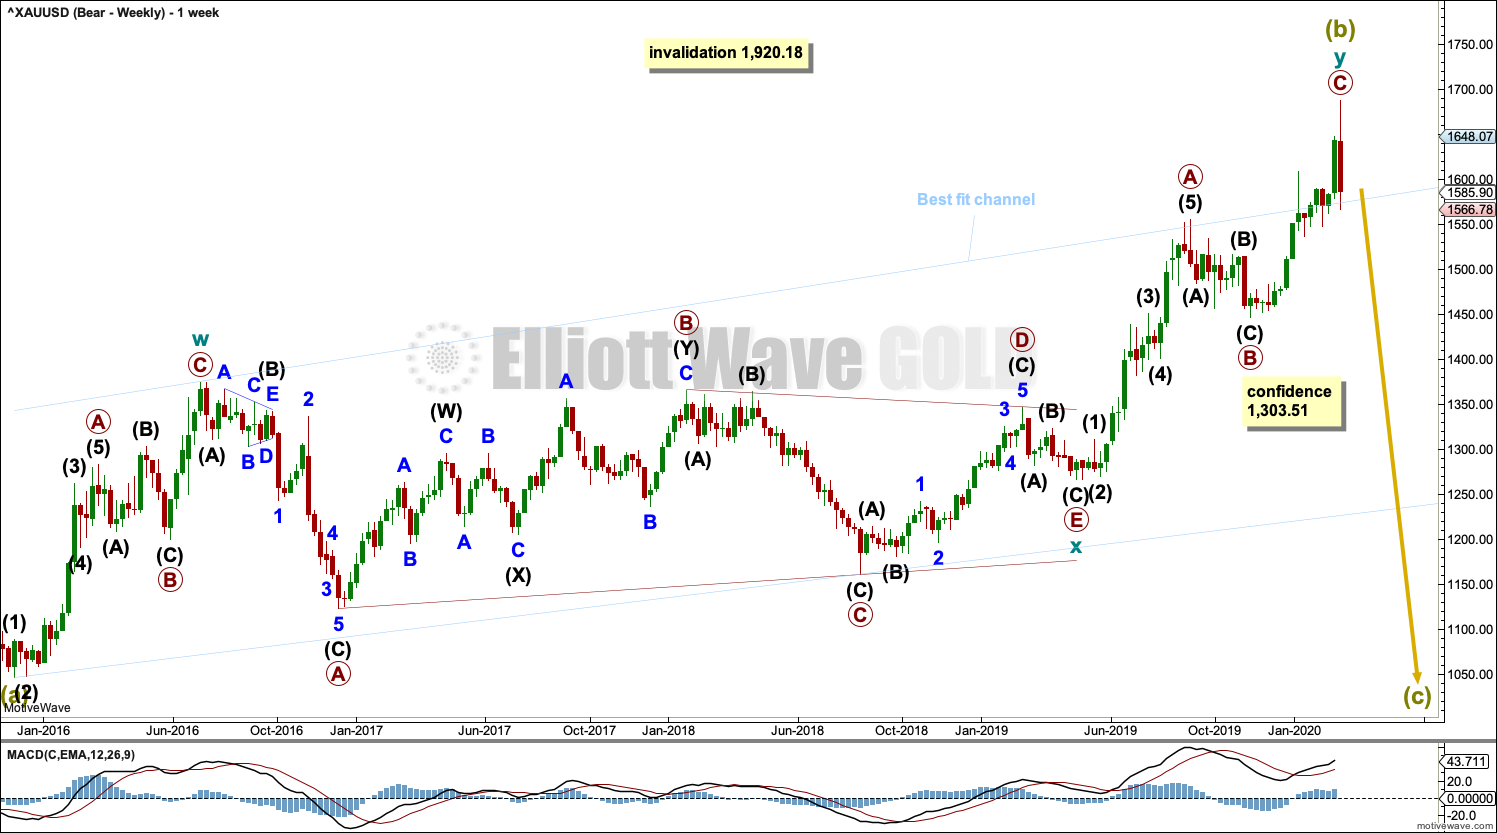
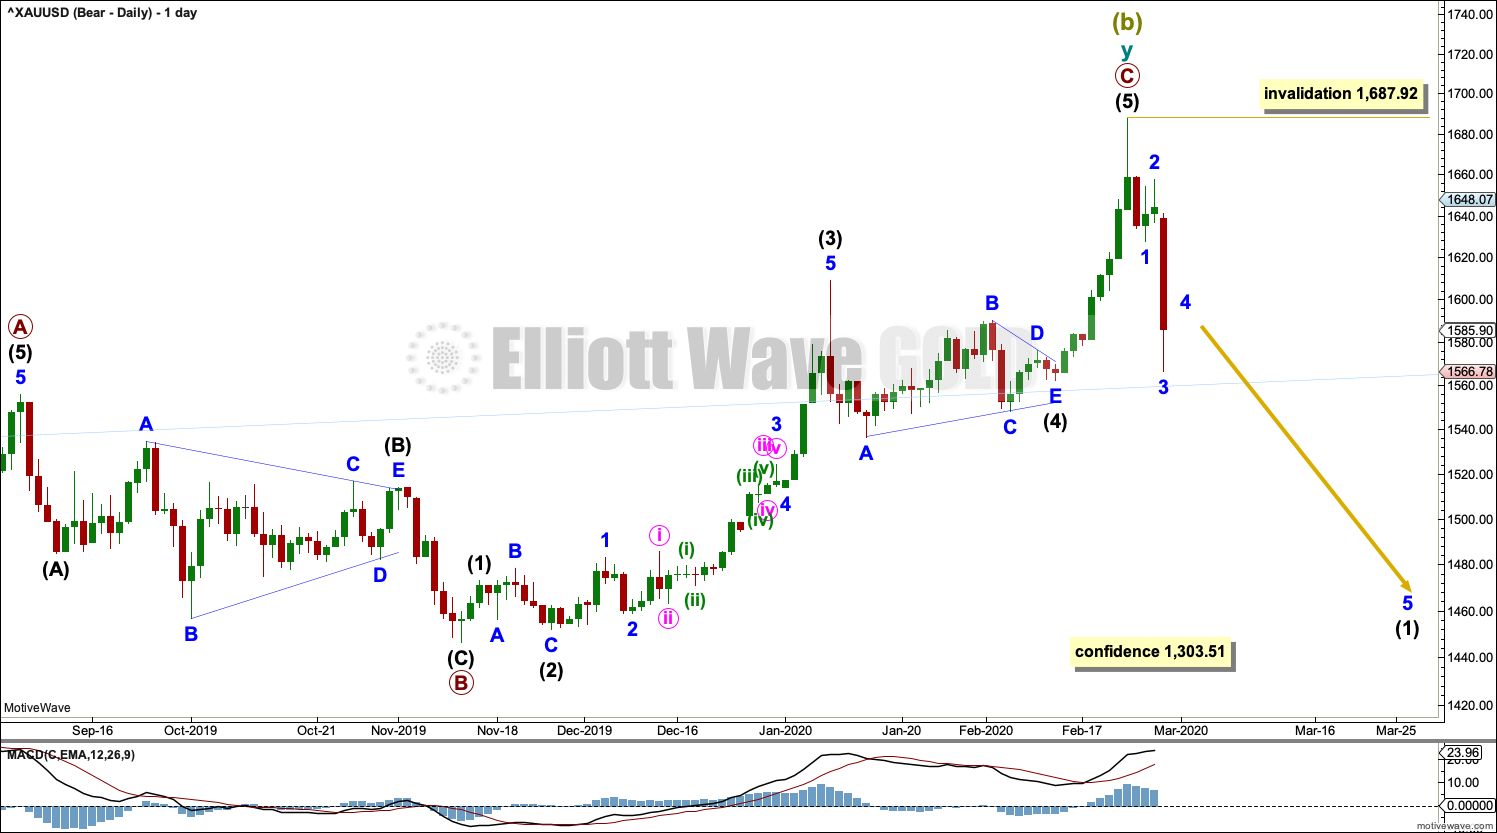
Super Cycle wave (b) may be a complete double zigzag.
The first zigzag in the double is labelled cycle wave w. The double is joined by a three in the opposite direction, a triangle labelled cycle wave x. The second zigzag in the double is labelled cycle wave y.
The purpose of the second zigzag in a double is to deepen the correction. Cycle wave y has achieved this purpose.
A wide best fit channel is added in light blue. Copy this channel over to daily charts. Price is now above the upper edge of this channel, which may now provide some support.
DAILY CHART
Click chart to enlarge.
Super Cycle wave (b) may be complete.
A new trend at Super Cycle degree should begin with a five down at all time frames. This is labelled intermediate wave (1). Following the completion of intermediate wave (1), intermediate wave (2) may not move beyond the start of intermediate wave (1) above 1,687.92.
BULLISH ELLIOTT WAVE COUNT
WEEKLY CHART
Click chart to enlarge.
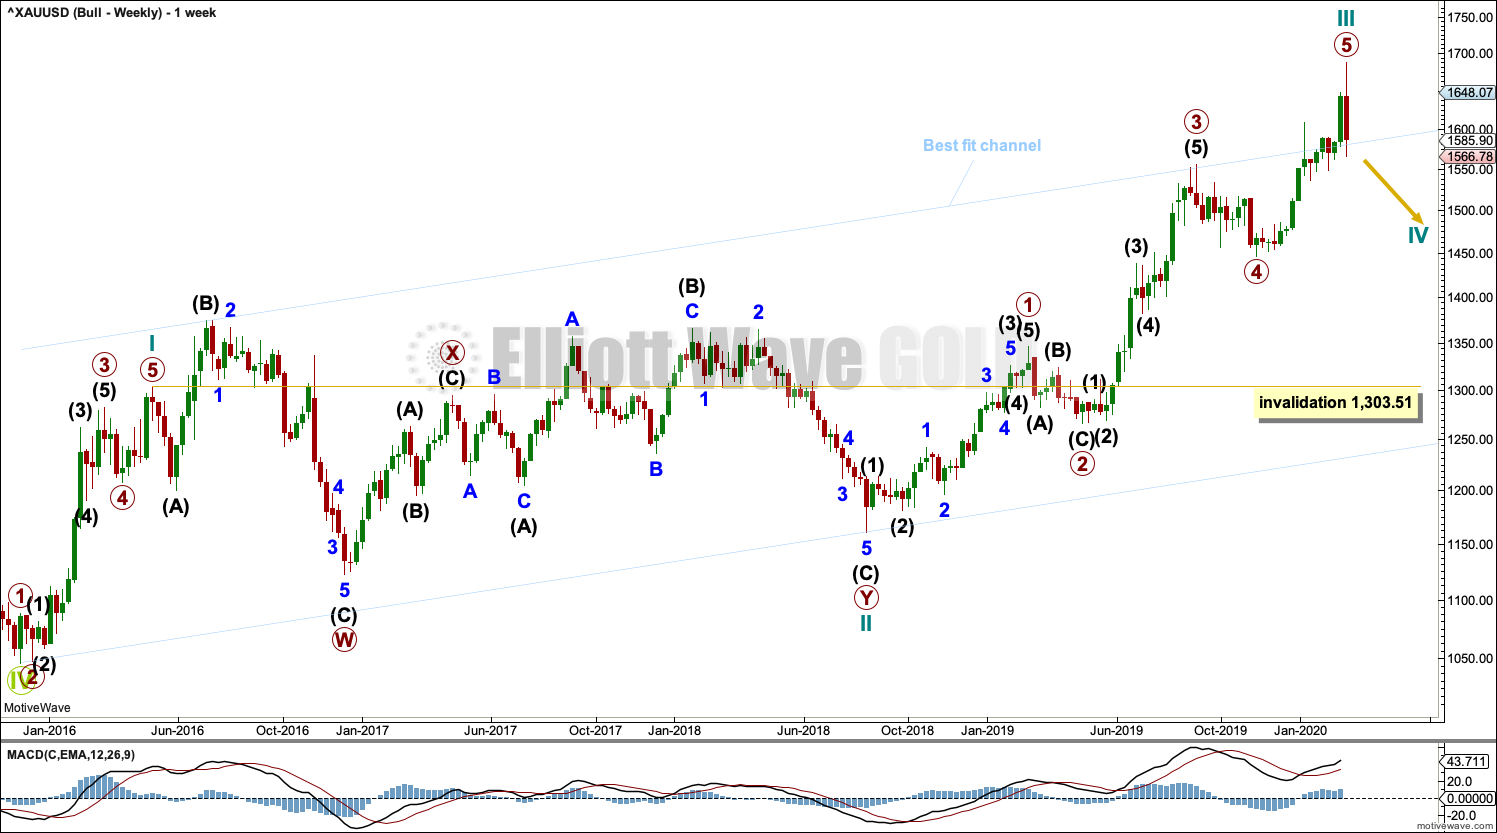
This wave count sees the the bear market complete at the last major low for Gold on 3 December 2015.
If Gold is in a new bull market, then it should begin with a five wave structure upwards on the weekly chart.
Cycle wave I fits as a five wave impulse with reasonably proportionate corrections for primary waves 2 and 4. This resolves a previous major problem with the bullish wave count.
Cycle wave II now fits as a double flat. However, a problem arises with the relabelling of this structure. Within the first flat correction labelled primary wave W, this wave count now needs to ignore what looks like an obvious triangle from July to September 2016 (this can be seen labelled as a triangle on the bear wave count above). This movement must now be labelled as a series of overlapping first and second waves.
Within the first flat correction labelled primary wave W of the double flat of cycle wave II, intermediate wave (B) is 1.69 the length of intermediate wave (A). This is longer than the common range of up to 1.38, but within an allowable guideline of up to 2. The length of intermediate wave (B) reduces the probability of this wave count.
Cycle wave III may now be complete. Cycle wave IV may have just begun, and it may not move into cycle wave I price territory below 1,303.51.
DAILY CHART
Click chart to enlarge.
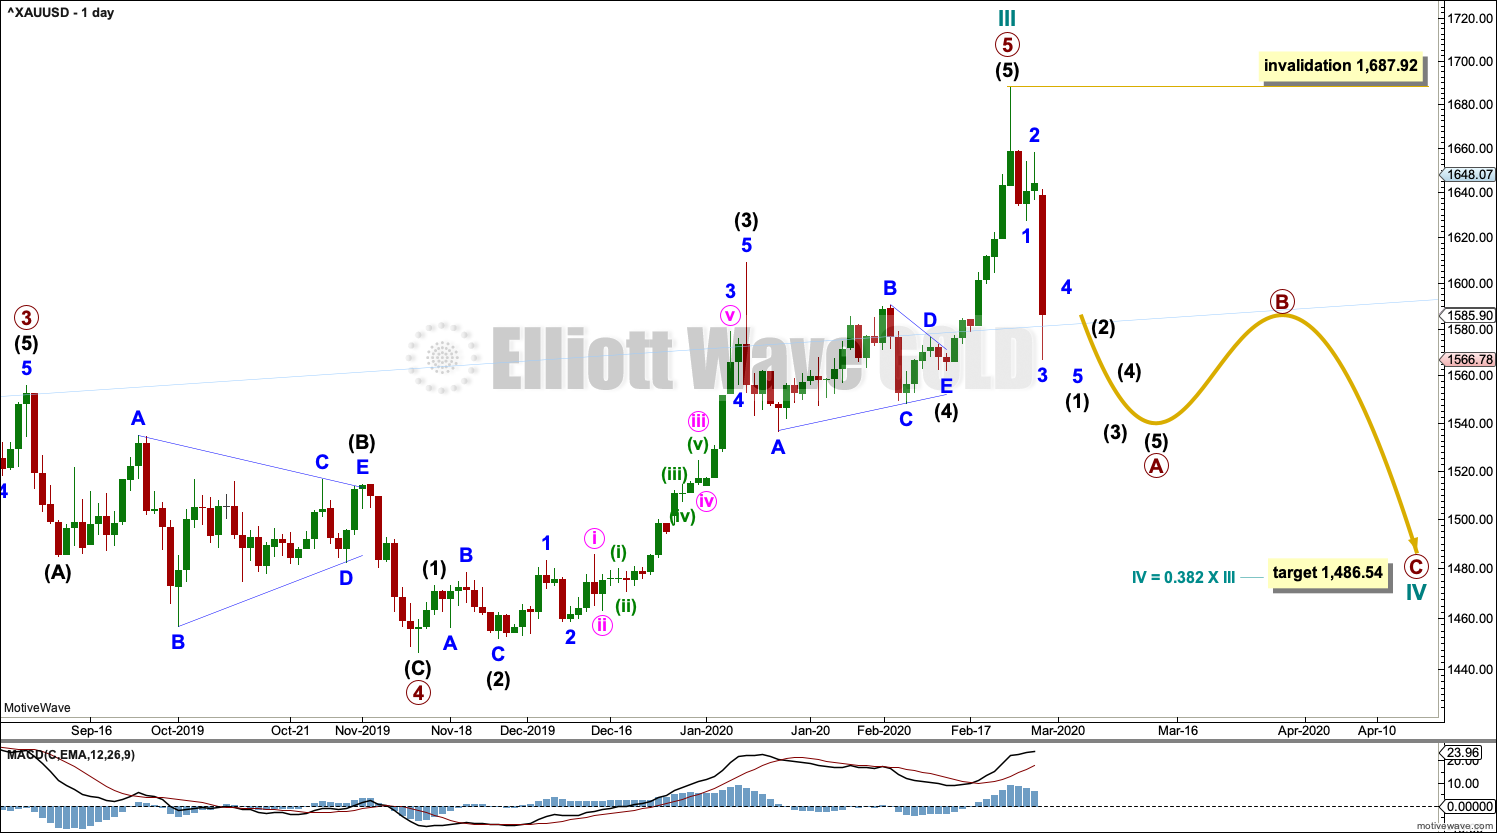
Cycle wave IV may end within the price territory of the fourth wave of one lesser degree. Primary wave 4 has its territory from 1,556.11 to 1,446.68. Within this territory is the 0.382 Fibonacci ratio of cycle wave III at 1,486.64.
Cycle wave IV would most likely subdivide as a zigzag. This is the most common Elliott wave corrective structure, and it would provide alternation with the double combination of cycle wave II.
TECHNICAL ANALYSIS
WEEKLY CHART
Click chart to enlarge. Chart courtesy of StockCharts.com.
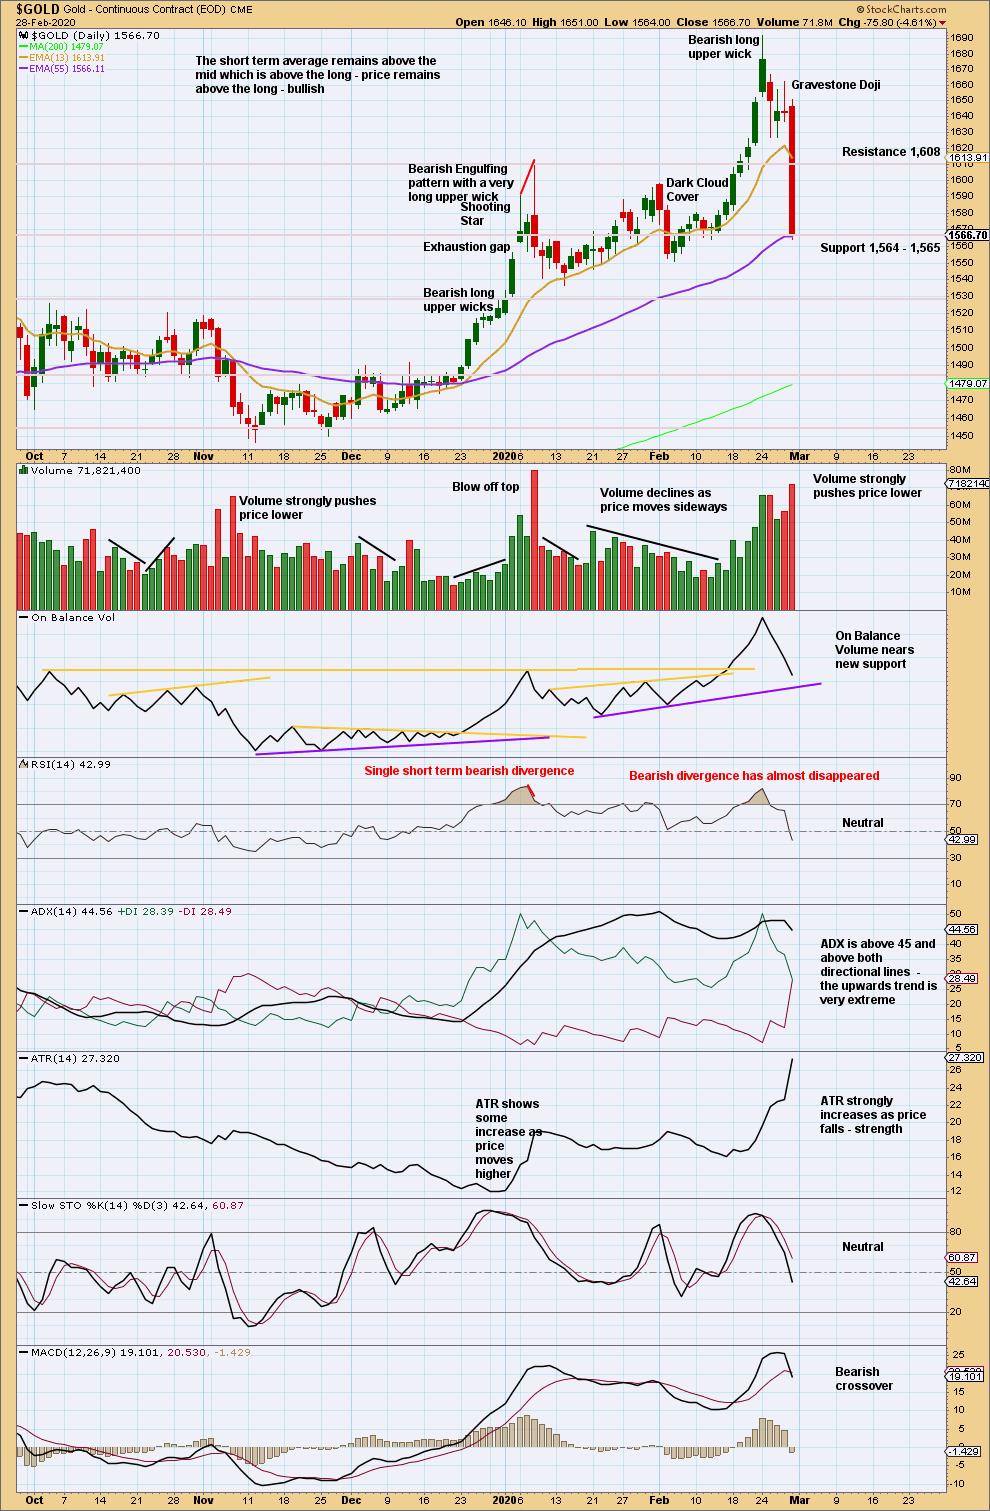
After an upwards trend reached very extreme and RSI reached overbought then exhibited bearish divergence, a very strong bearish candlestick reversal pattern should be given weight. A trend change here now looks extremely likely.
DAILY CHART
Click chart to enlarge. Chart courtesy of StockCharts.com.
An extremely strong bearish candlestick for Friday gives confidence that a sustainable high now looks likely to be in place.
Do not expect price to continue to move in a straight line. There will be bounces and consolidations along the way. If price reaches an area of support when Stochastics reaches oversold, then expect a bounce.
Bounces in a downwards trend are opportunities to join the trend.
GDX WEEKLY CHART
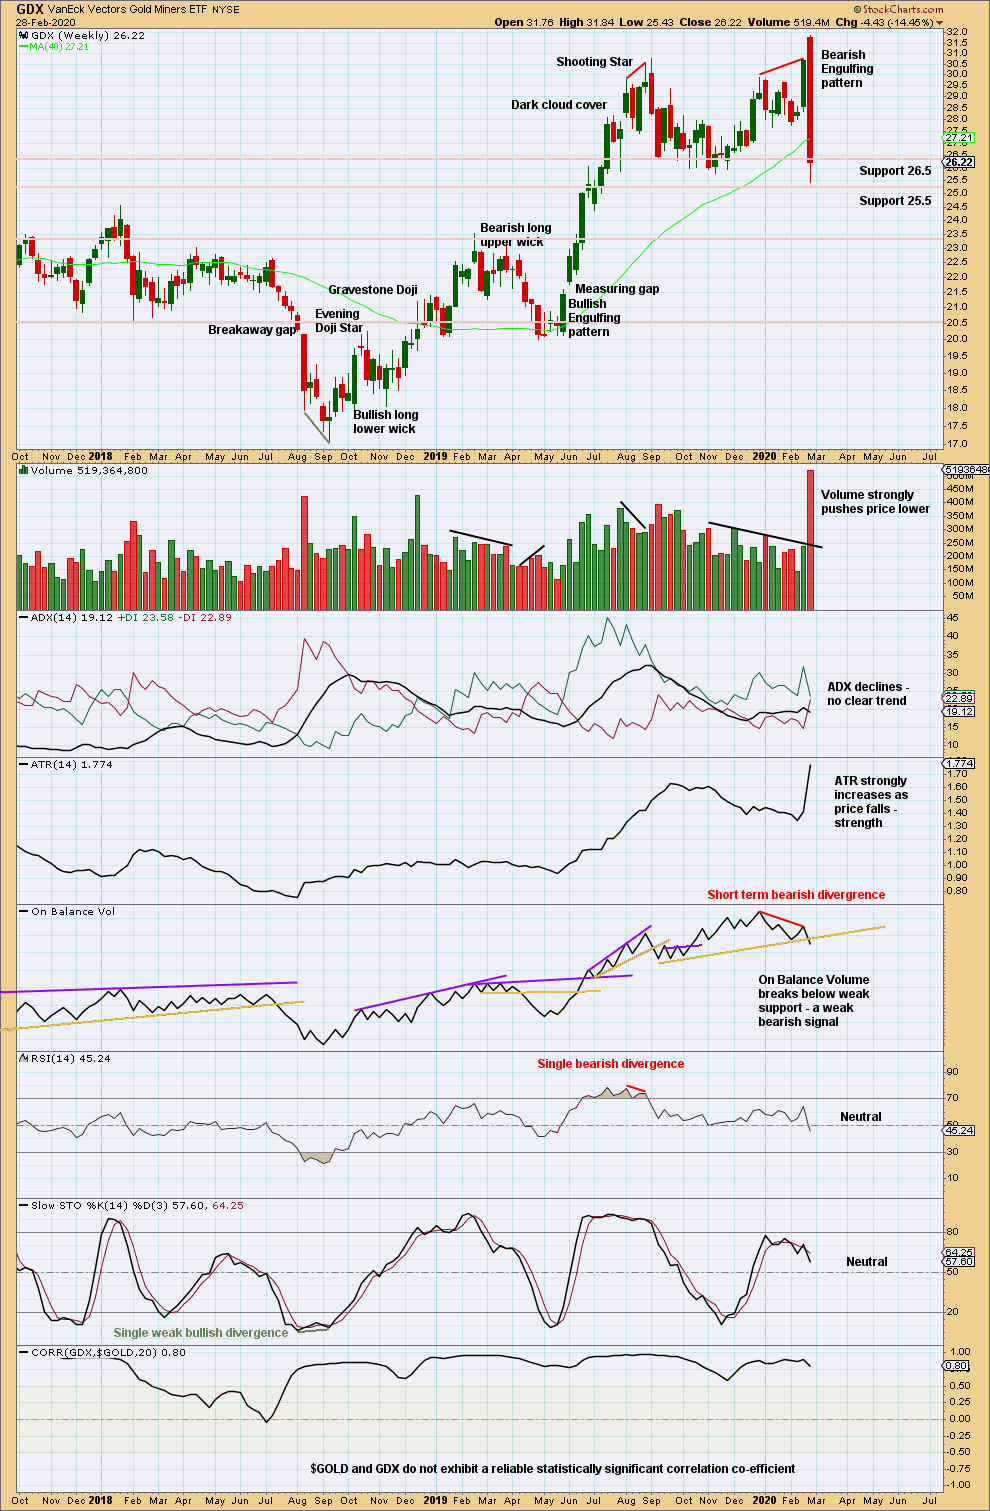
Click chart to enlarge. Chart courtesy of StockCharts.com.
GDX has had a trend change. Look for bounces and consolidations to possibly arrive about identified support areas.
GDX DAILY CHART
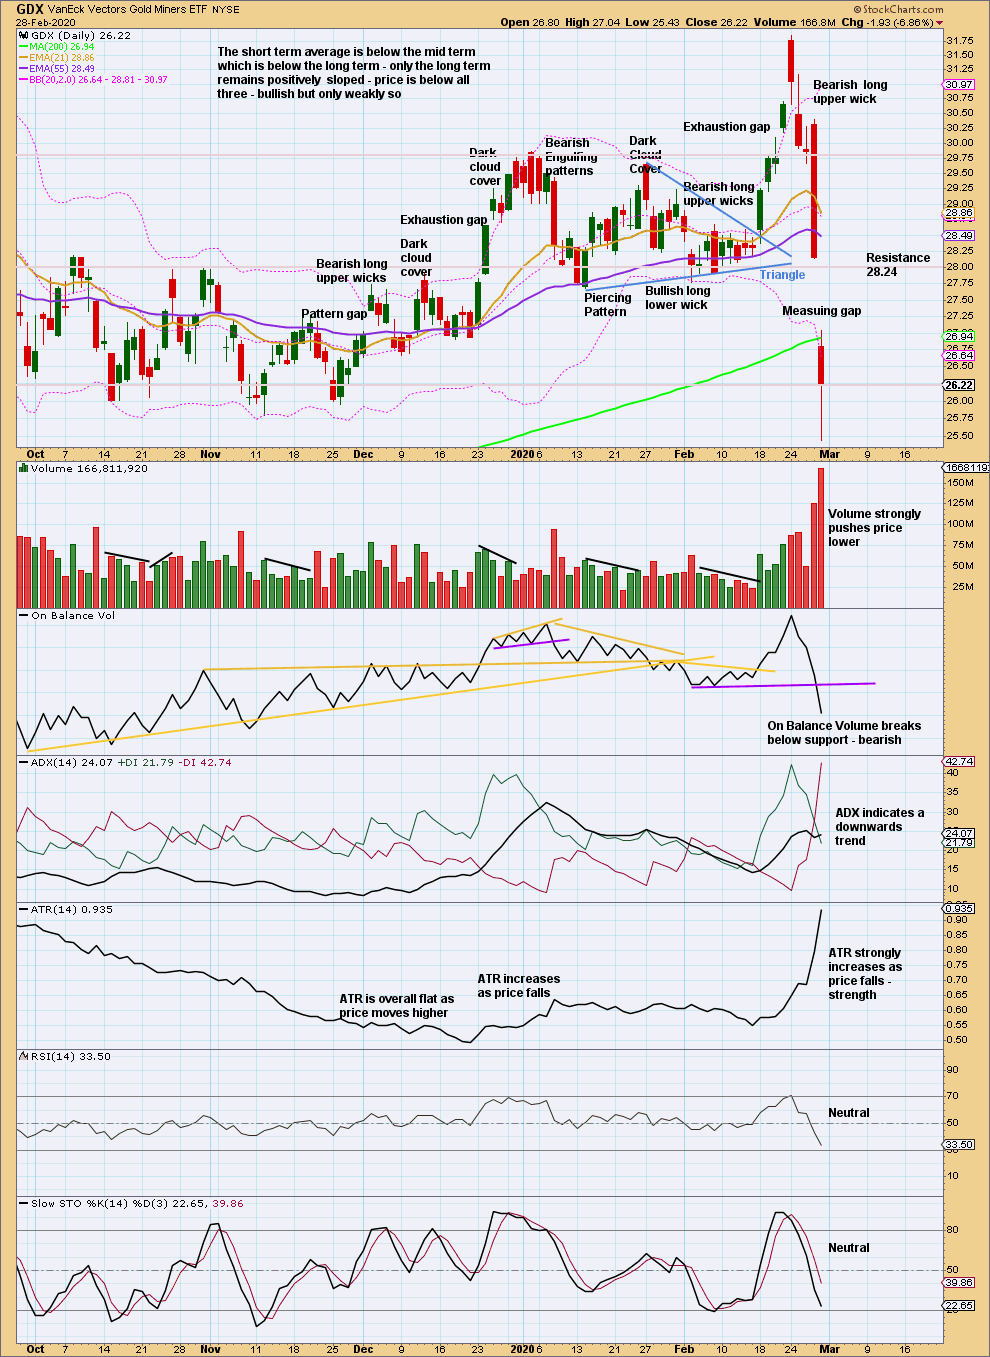
Click chart to enlarge. Chart courtesy of StockCharts.com.
A target calculated from the measuring gap is at 23.34. The gap may provide resistance at 28.14.
US OIL
Downwards movement has broken below support. Both the main and alternate Elliott wave counts are reanalysed to accept a downwards breakout. The invalidation point for the alternate Elliott wave count is now very close by.
Summary: A downwards breakout happened this week with support from volume. Next target for a multi-week interruption to the downwards trend is at 28.24.
MAIN ELLIOTT WAVE COUNT – BEARISH
MONTHLY CHART
Click chart to enlarge.
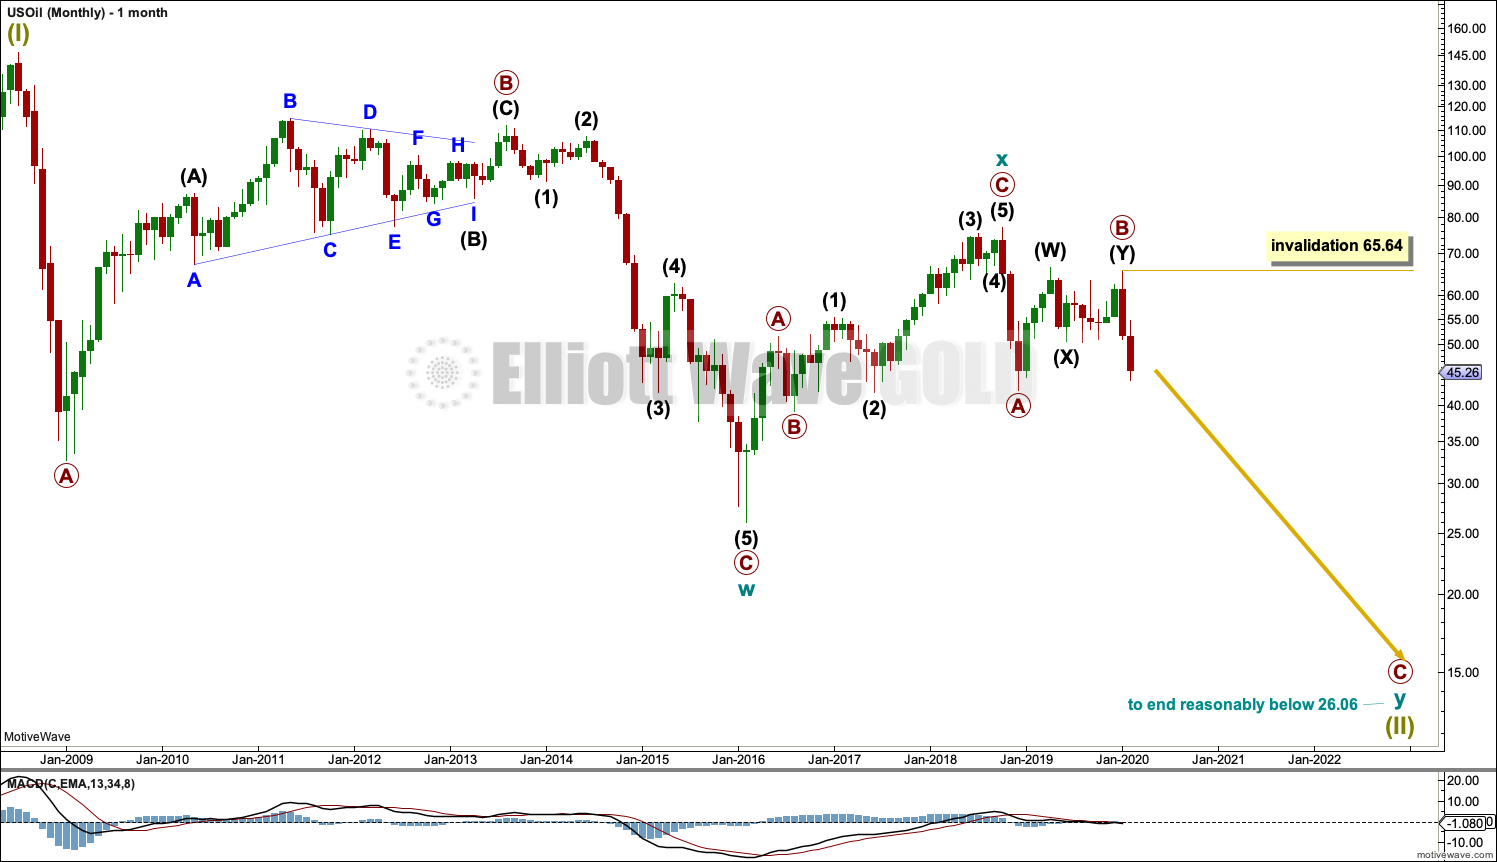
The basic Elliott wave structure is five steps forward and three steps back. This Elliott wave count expects that US Oil is still within a three steps back pattern, which began in July 2008. The Elliott wave count expects that the bear market for US Oil continues.
This Elliott wave corrective structure is a double zigzag, which is a fairly common structure. The correction is labelled Super Cycle wave (II).
The first zigzag in the double is complete and labelled cycle wave w. The double is joined by a three in the opposite direction labelled cycle wave x, which subdivides as a zigzag. The second zigzag in the double may now have begun, labelled cycle wave y.
The purpose of a second zigzag in a double zigzag is to deepen the correction when the first zigzag does not move price deep enough. To achieve this purpose cycle wave y may be expected to move reasonably below the end of cycle wave w at 26.06. When the alternate bullish Elliott wave count below is invalidated, then a target for this bearish wave count for primary wave C to complete cycle wave y and Super Cycle wave (II) will be calculated.
Cycle wave y is expected to subdivide as a zigzag, which subdivides 5-3-5.
Cycle wave w lasted 7.6 years and cycle wave x lasted 2.7 years. Cycle wave y may be expected to last possibly about a Fibonacci 5 or 8 years.
Within primary wave C, no second wave correction may move beyond the start of its first wave above 65.64.
WEEKLY CHART
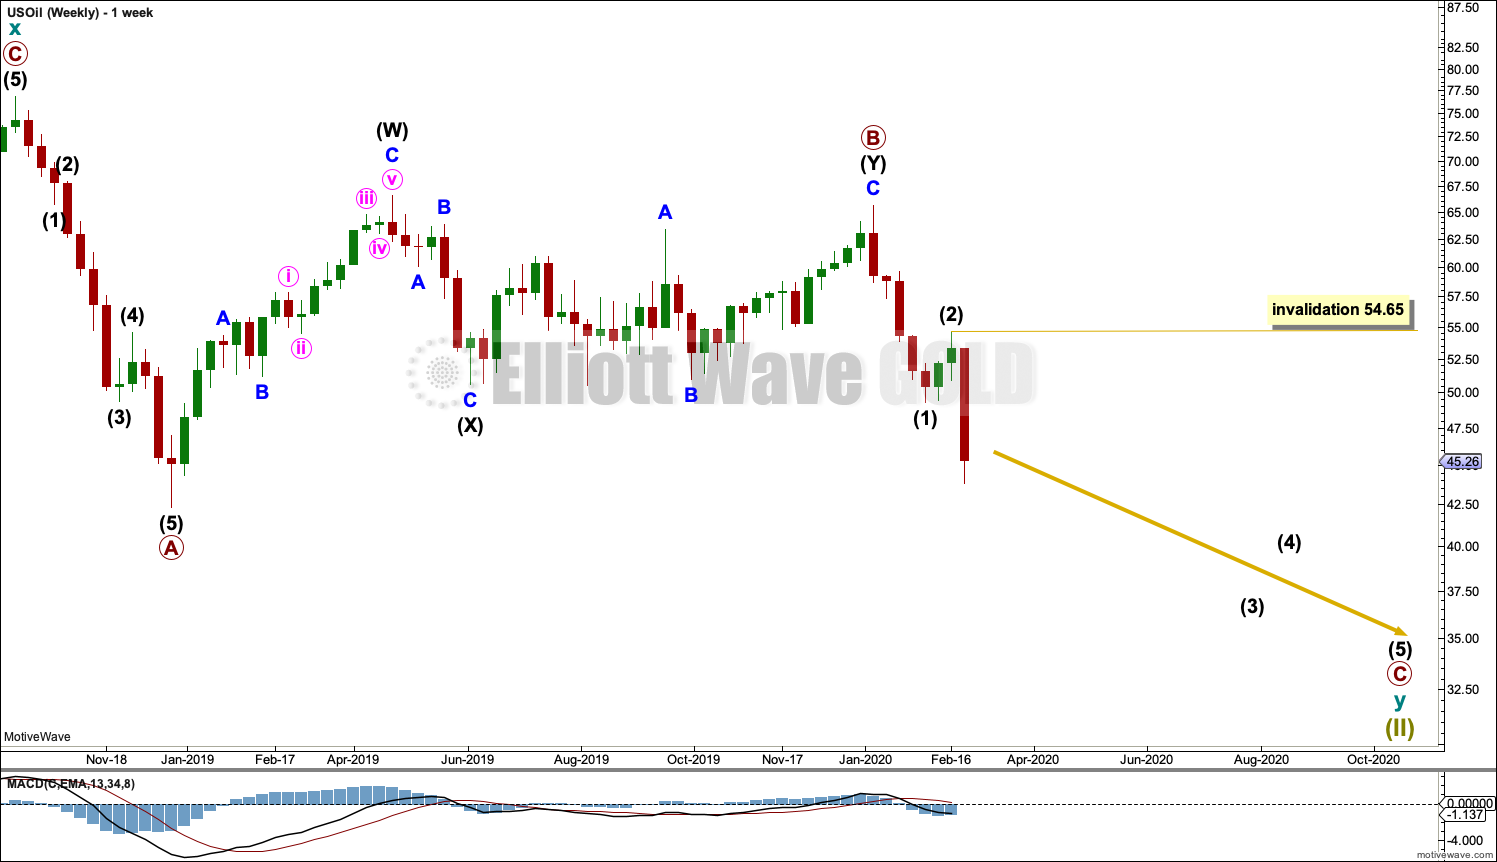
Click chart to enlarge.
This weekly chart shows all of cycle wave y so far.
Cycle wave y is expected to subdivide as a zigzag. A zigzag subdivides 5-3-5. Primary wave A must subdivide as a five wave structure if this wave count is correct.
Primary wave A may be a complete five wave impulse at the last low.
Primary wave B may be a complete double combination: zigzag – X – flat. Intermediate wave (W) fits as a zigzag. Intermediate wave (Y) may be a complete regular flat correction.
Primary wave C must subdivide as a five wave motive structure, most likely an impulse. Within primary wave C, intermediate waves (1) and (2) may be complete. Within intermediate wave (3), no second wave correction may move beyond the start of its first wave above 54.65.
DAILY CHART
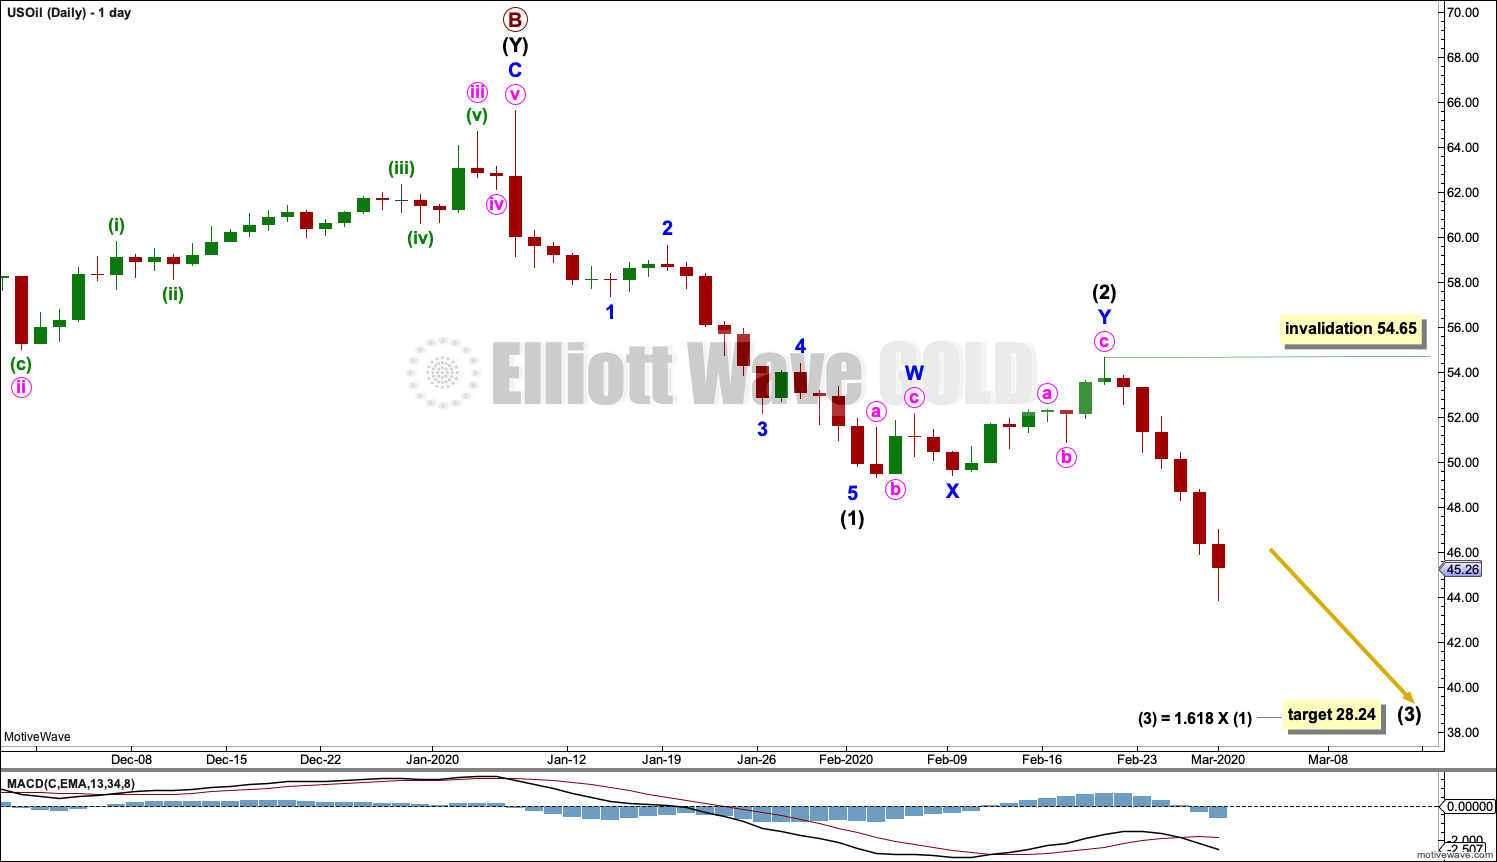
Click chart to enlarge.
Primary wave C must subdivide as a five wave motive structure, most likely an impulse. Within primary wave C, intermediate wave (1) subdivides as a complete impulse, intermediate wave (2) may be a complete double zigzag, and intermediate wave (3) may have begun.
Within intermediate wave (3), no second wave correction may move beyond the start of its first wave above 54.65.
ALTERNATE ELLIOTT WAVE COUNT
MONTHLY CHART
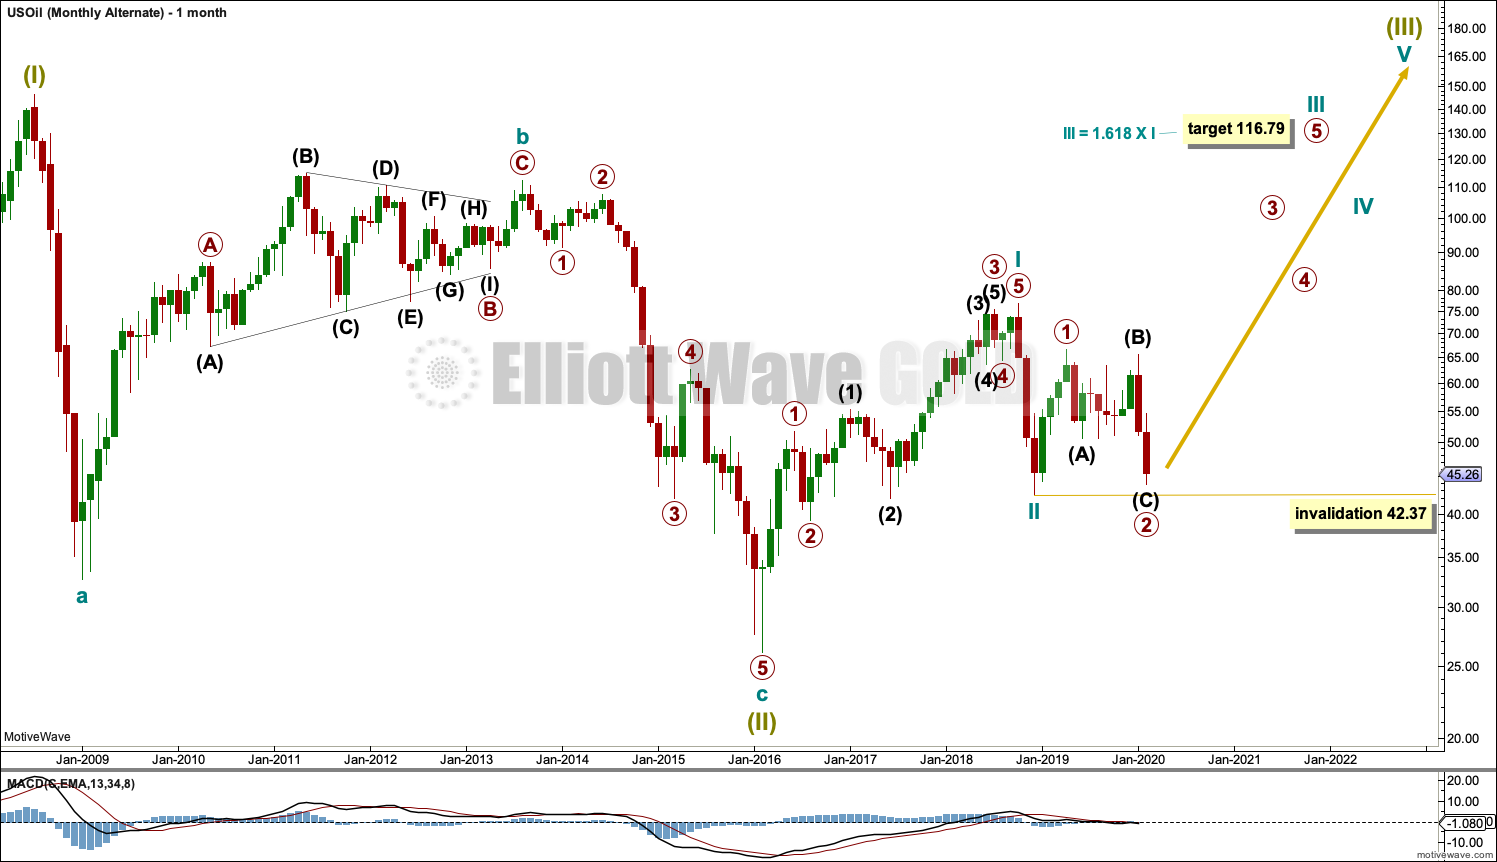
Click chart to enlarge.
It is possible that the bear market is over for Oil and a new bull market has begun.
For a bullish wave count for Oil, the upwards wave from the major low at 26.06 in February 2016 must be seen as a complete five wave impulse. This is labelled cycle wave I.
Cycle wave II may be a complete zigzag at 0.679 the depth of cycle wave I.
A target is calculated for cycle wave III to reach a common Fibonacci ratio to cycle wave I.
Within cycle wave III, primary wave 2 may not move beyond the start of primary wave 1 below 42.37.
WEEKLY CHART
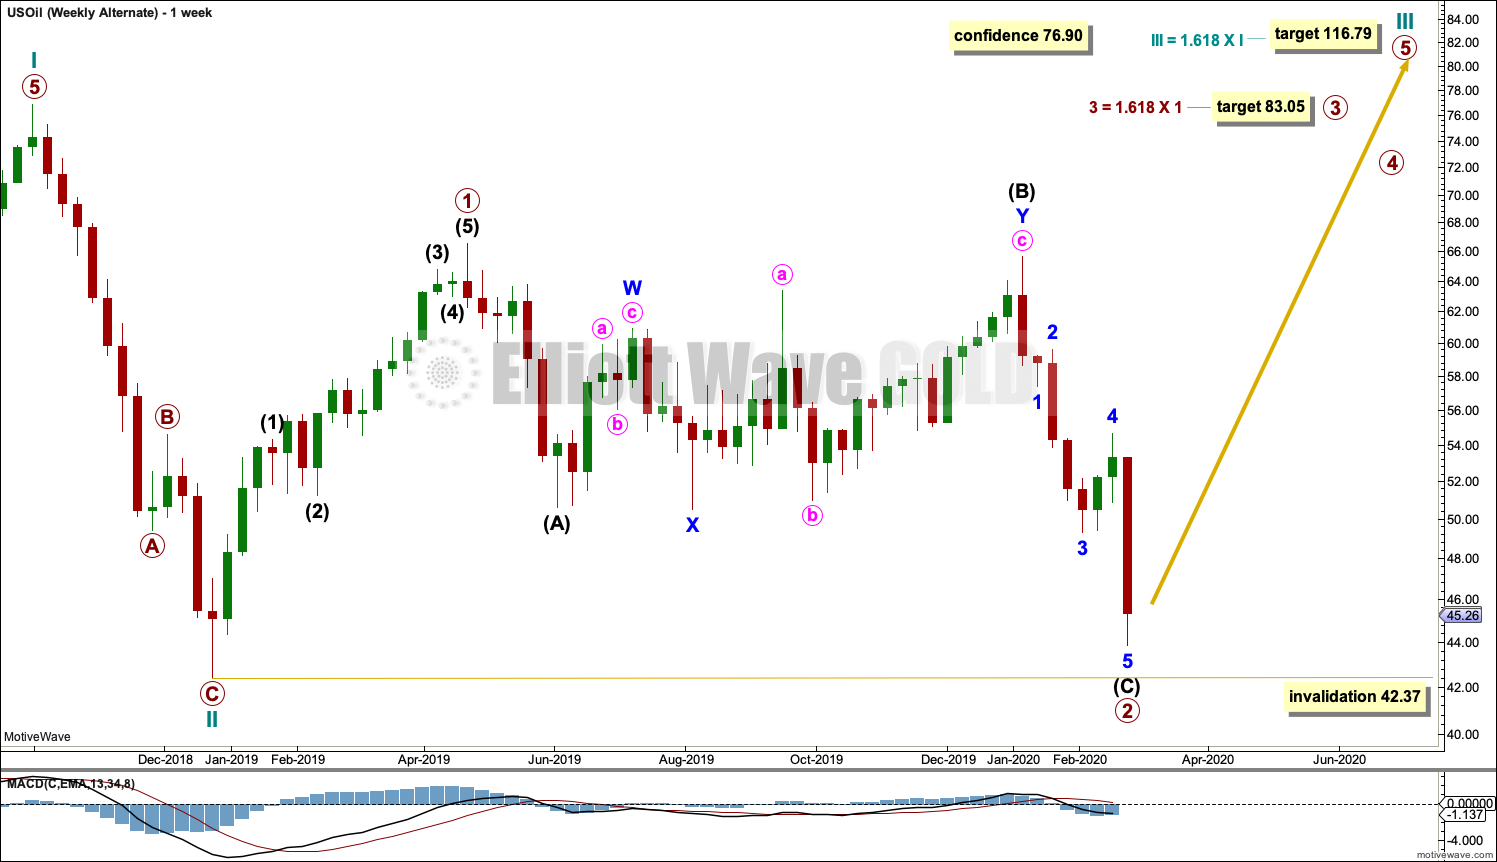
Click chart to enlarge.
Cycle wave II does look best as a three. This is the only part of this wave count that has a better look than the main wave count, which sees this downwards wave as a five.
The upwards wave of primary wave 1 within cycle wave III must be seen as a five wave structure for a bullish wave count to work. This movement at lower time frames does not subdivide well as a five; this reduces the probability of this wave count.
Cycle wave III may only subdivide as an impulse. Within cycle wave III, so far primary waves 1 and 2 may be complete. If it continues any lower, then primary wave 2 may not move beyond the start of primary wave 1 below 42.37.
A target calculated for primary wave 3 expects it to exhibit a common Fibonacci ratio to primary wave 1.
DAILY CHART
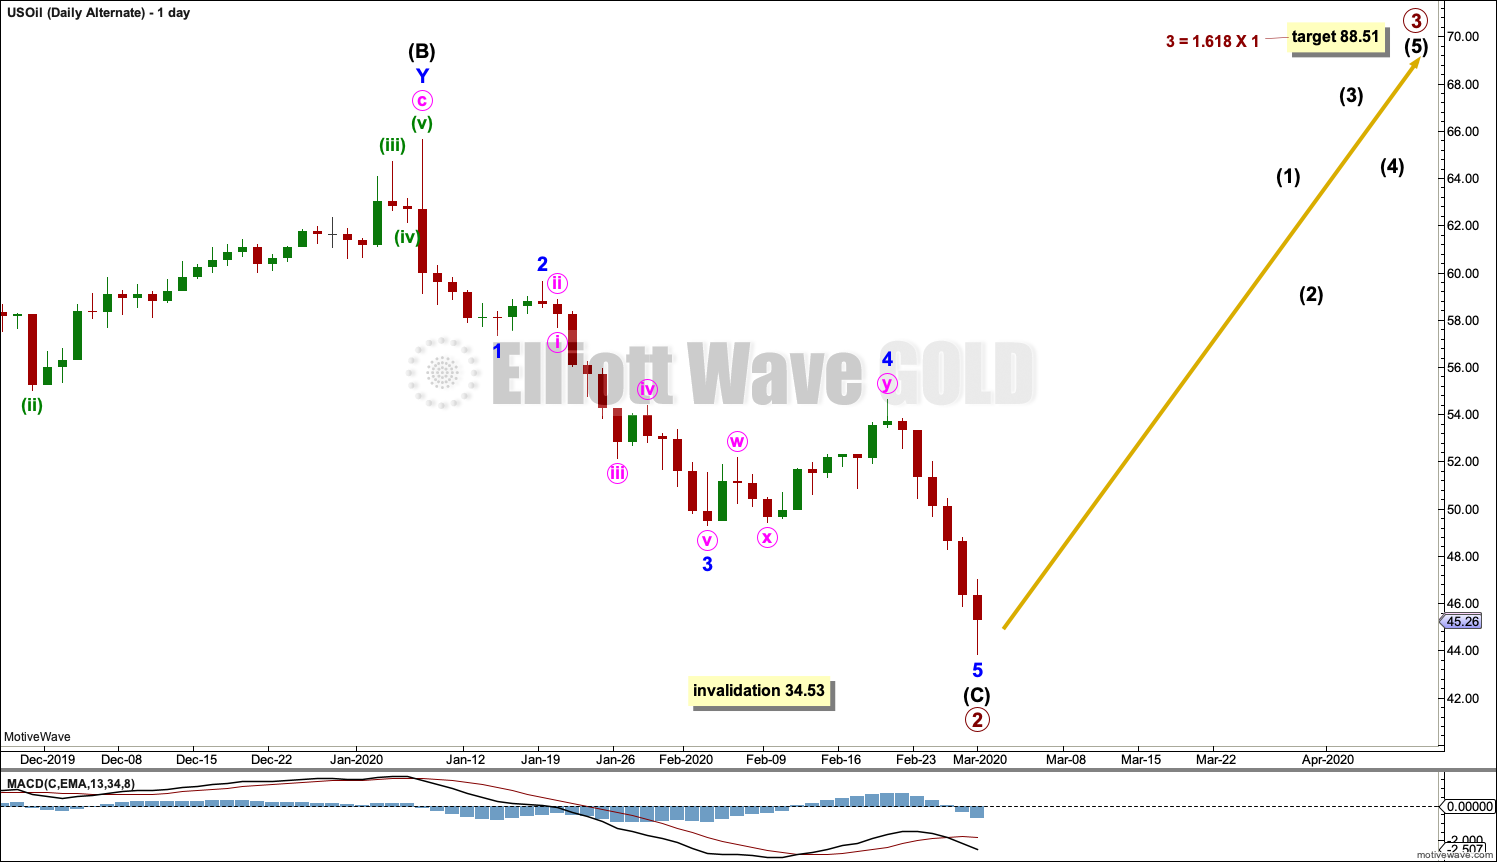
Click chart to enlarge.
Primary wave 2 may now be a complete regular flat. If it continues further, there is now very little room for it to move into. Primary wave 2 may not move beyond the start of primary wave 1 below 34.53.
Primary wave 3 may only subdivide as an impulse.
TECHNICAL ANALYSIS
MONTHLY CHART
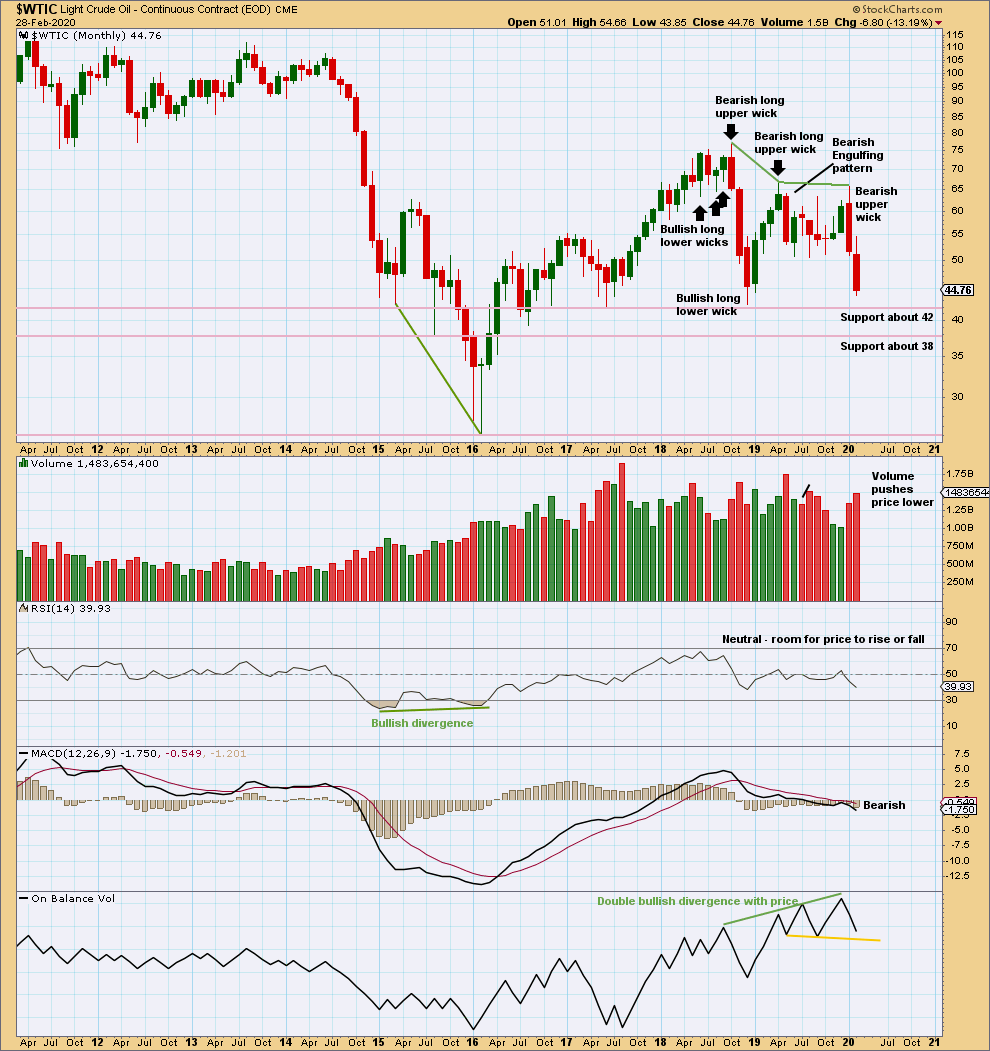
Click chart to enlarge. Chart courtesy of StockCharts.com.
Both January and February have increased range and volume for downwards movement. This supports the main Elliott wave count.
A close below support about 42 on a downwards day with support from volume would be a significant downwards breakout at this time frame.
WEEKLY CHART
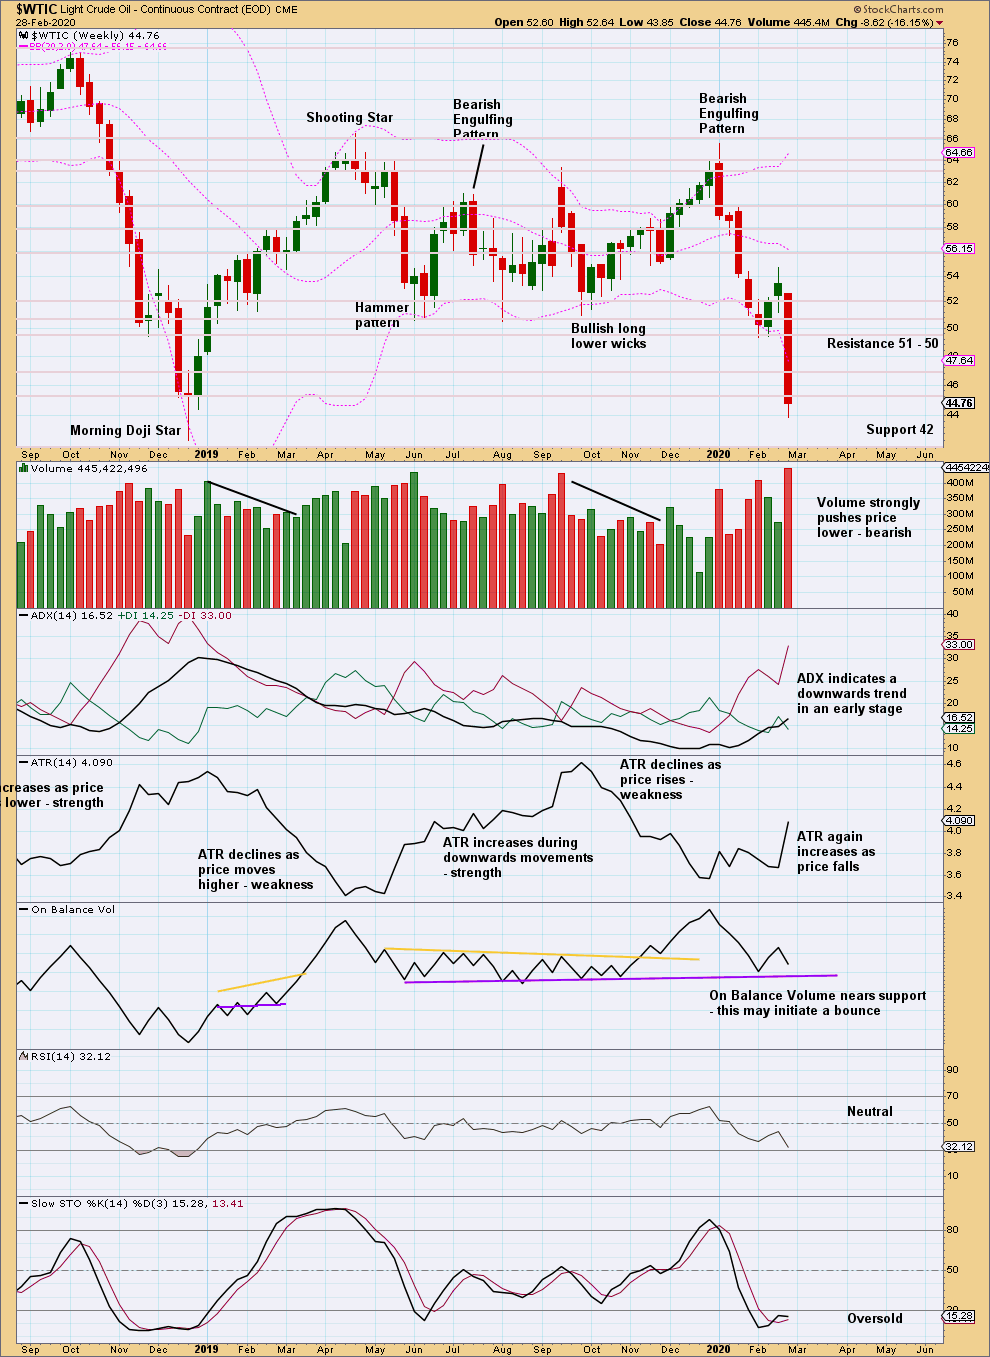
Click chart to enlarge. Chart courtesy of StockCharts.com.
This week a downwards breakout below prior support about 51 – 50 has been effected. This breakout has support from volume, so some confidence may be had in it. A target taken from the range of the prior consolidation would be about 34.37.
DAILY CHART
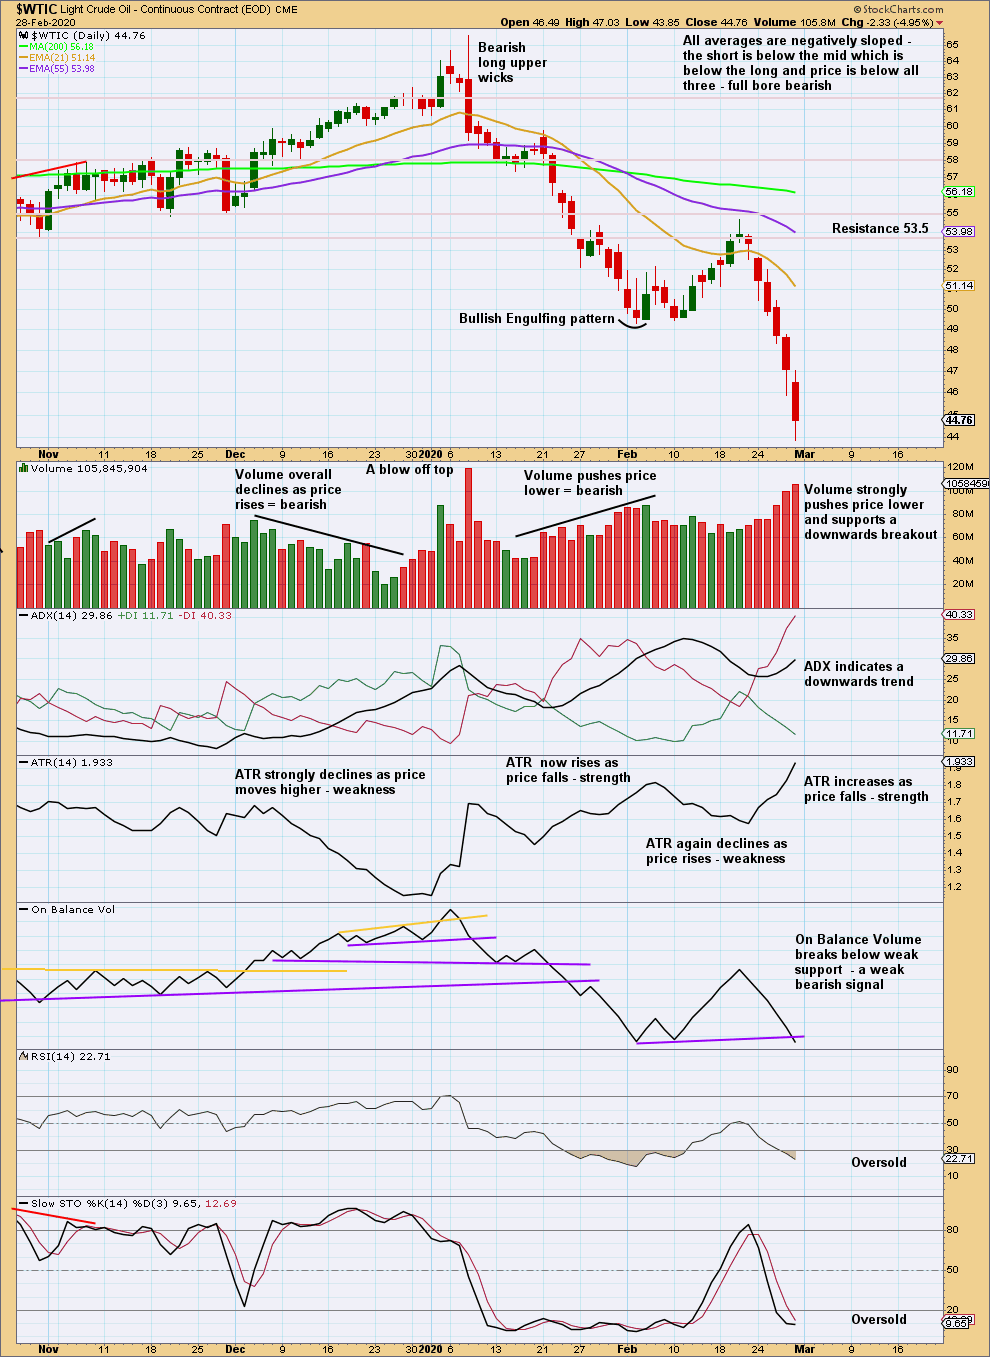
Click chart to enlarge. Chart courtesy of StockCharts.com.
A downwards trend is now in place at both daily and weekly time frames. Both volume and range support this trend.
RSI and Stochastics may remain very extreme for reasonable periods of time when this market trends.
—
Always practice good risk management as the most important aspect of trading. Always trade with stops and invest only 1-5% of equity on any one trade. Failure to manage risk is the most common mistake new traders make.
Is it possible we are in the c wave of an expanding flat for the main markets. Which should bring price down to at or just below the 2019 low
Which market are you referring to? S&P500, Gold or Oil?
Hi Lara,
I think he meant the S&P 500… Yesterday was a 90% up day which increases the odds of a bottom on the intraday low of last Friday…
If the ending diagonal is not materializing (where it needs to go under 2812), do we have an expanded flat correction since May 1st 2019 or the B wave would be too high?
Thanks very much in advance,
Mathieu
I wouldn’t see this current drop as wave C of an expanded flat for the S&P because wave B would be 2.95 X wave A. The probability of that is extremely low.
Wednesday’s session fits as an 80% up day, but not a 90% up day. And as Thursday was not another 80% up day there is not a back to back 80% up days.
So no sustainable low yet, expect after some sideways churn for price to drop again.
Thanks Lara….
The action is terrible… We might have an 1987-style crash on Monday…
The market ignore the great job report…. Everybody will want to sell on Monday with all this weekend worry.
I am now 96% cash, 4% short on Gold stocks and 2% short on Oil…. Up 18% YTD…
Hoping it will not be terrible on Monday.
Mathieu