
BTCUSD: Elliott Wave and Technical Analysis | Charts – October 13, 2020
Last analysis on September 9th, expected more downwards movement for a multi-week pullback to continue. So far price has moved higher, but has not yet made a new high.
Summary: The pullback is expected to continue lower in coming weeks. It may remain above 4,106.981. A target for support is at 7,259.
Thereafter, the upwards trend may resume with increased strength towards new all time highs.
The data used for this analysis comes from Yahoo Finance BTC-USD.
Monthly and weekly charts are on a semi-log scale. The close up daily chart is on an arithmetic scale.
MAIN ELLIOTT WAVE COUNT
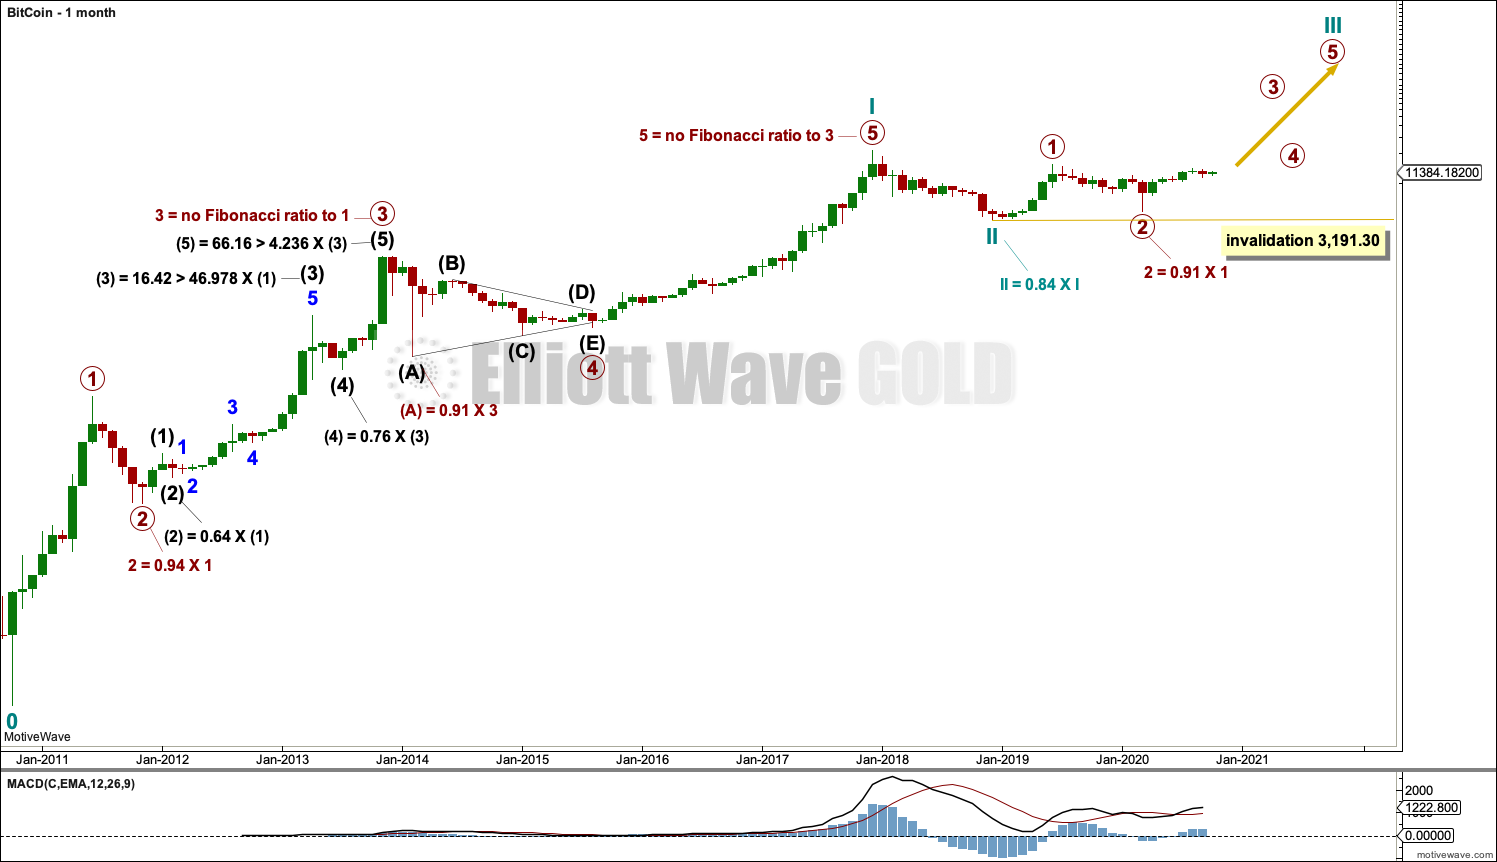
MONTHLY
Click chart to enlarge.
It is possible to see a completed five wave impulse upwards for Bitcoin.
I am unable to find many reasonable Fibonacci ratios within this wave count. It appears that Bitcoin may not exhibit Fibonacci ratios very often between its actionary waves, so this makes target calculation impossible. Classic technical analysis was used to identify a high in place on December 23, 2017.
What is very clear from this chart is that Bitcoin forms classic bubbles. It has done so now several times and may now be doing so again. So far each bubble has popped and Bitcoin has collapsed, to then thereafter form a new bubble. Each bubble is larger than the one prior; so if another Bitcoin bubble is forming, it may be expected to take price substantially above the all time high.
Bitcoin tends to behave like an extreme commodity: price moves upwards for about 2 – 4 weeks in a near vertical movement at the end of its rises. Following this vertical movement the resulting downwards movement is very deep (in percentage terms) and often very quick.
The next rise begins slowly with basing action over weeks or months, and then as the rise nears its end another vertical movement completes it. Also, there are volume spikes just before or at the end, which is another feature typical of commodity like behaviour.
This has happened now several times. The most notable instances are the rise up to the week ending 24th November, 2013, and the week ending 5th June, 2011. The following sharp drops were 94% and 93% respectively.
The last instance was the rise up to the last all time high for Bitcoin at 19,870.62 on the 17th of December 2017. The drop thereafter may now be considered as highly likely to be complete. If the drop is complete, it was only an 84% drop (labelled cycle wave II).
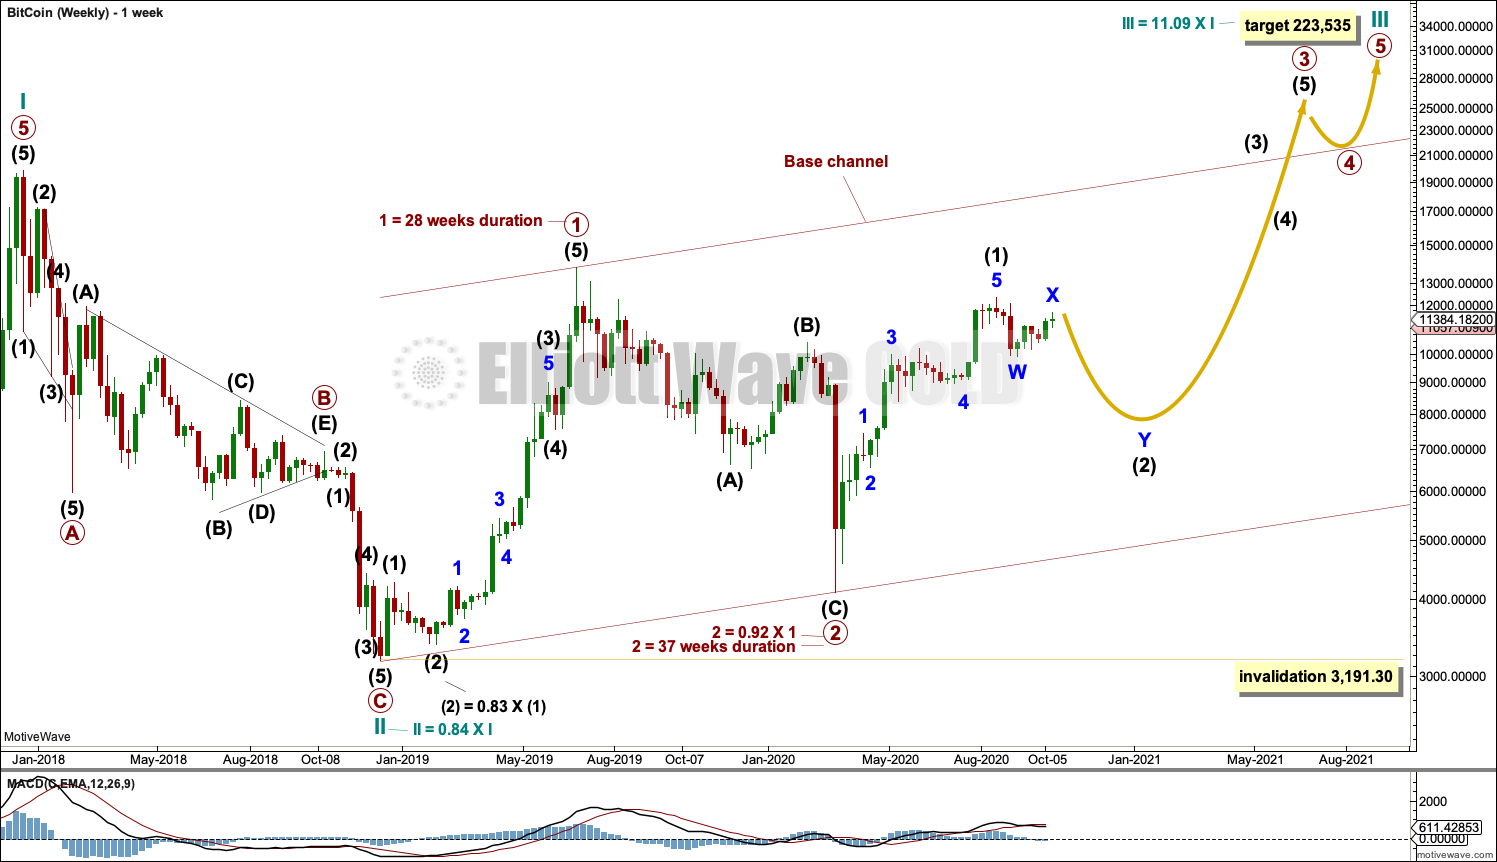
WEEKLY
Click chart to enlarge.
Cycle wave II may be a complete zigzag.
Cycle wave III must move above the end of cycle wave I at 19,870.62. It must move far enough above this point to allow room for cycle wave IV to unfold and remain above cycle wave I price territory.
Cycle wave I lasted 7.2 years and cycle wave II may have been over within just under one year. It would be reasonable to expect cycle wave III to last about 7 years, possibly a Fibonacci 8 or 13 years. At this stage, it may be now within its 22nd month.
Cycle wave III must unfold as a simple five wave impulse, and within this impulse there should be two large corrections for primary waves 2 and 4. It is possible that primary wave 2 could be complete. If it is complete, primary wave 2 would be a normal depth of primary wave 1 and still in proportion to primary wave 1 in terms of duration. Primary wave 2 looks like an obvious three wave structure.
If this wave count is correct, then a third wave up at two large degrees may have begun. Classic technical analysis will again be used to identify the next major high in place. The target calculated is provisional; if it is wrong, the target may not be high enough.
Primary wave 3 would very likely be much longer than 4.236 times the length of primary wave 1. Primary wave 3 would very likely end with a blow off top after a vertical rise of 2 to 4 weeks. Primary wave 3 must move far enough above primary wave 1 to allow room for primary wave 4 to unfold and remain above primary wave 1 price territory.
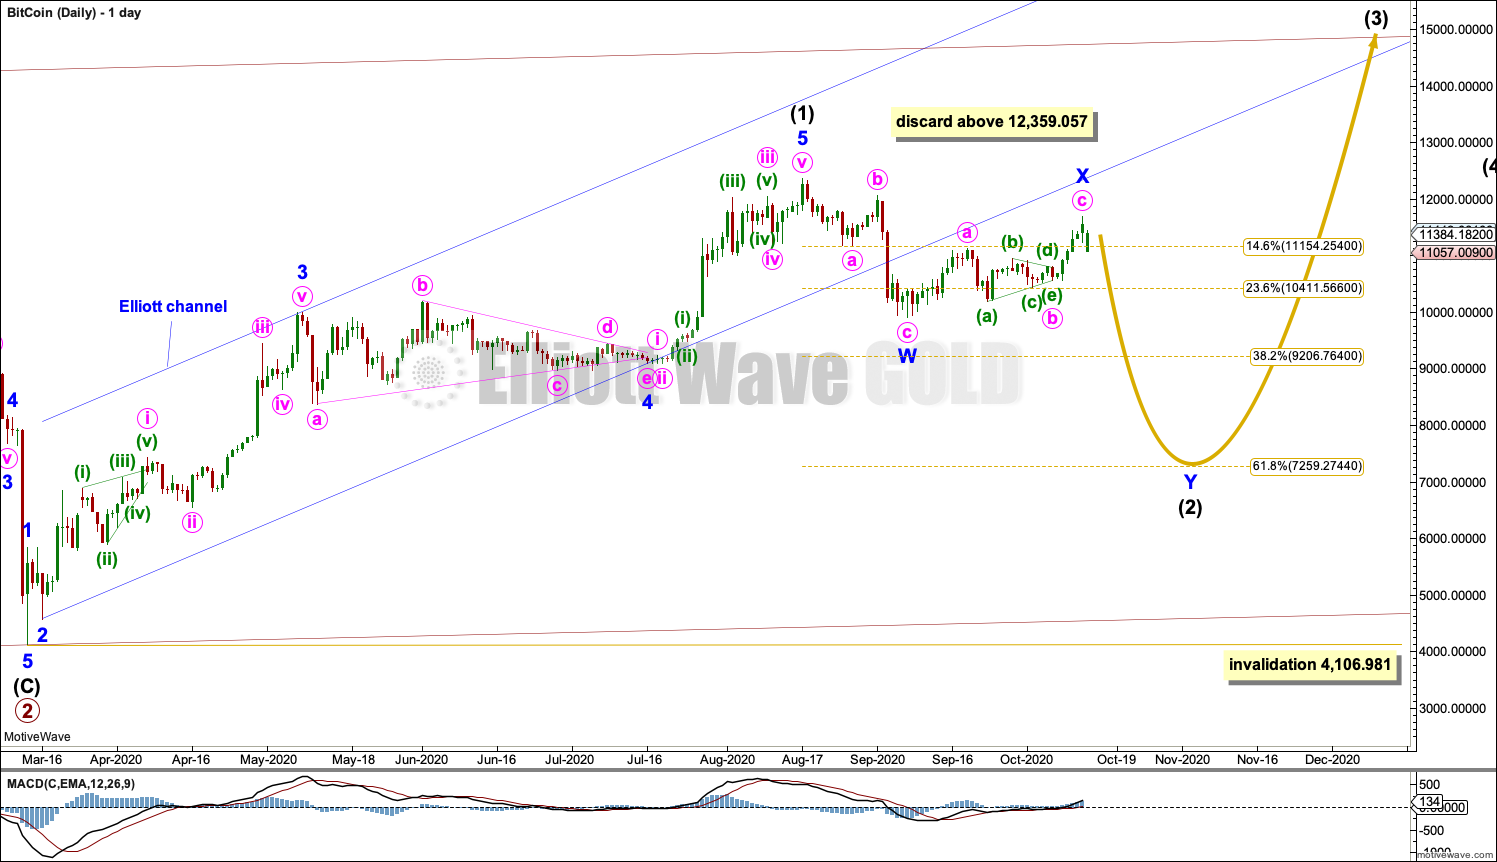
DAILY
Click chart to enlarge.
Primary wave 3 may have begun. It may only subdivide as an impulse.
It looks like there is a triangle about 2/3 of the way up within the last upwards wave to the latest high. This is labelled minor wave 4. Because minor wave 4 is much longer in duration than minor wave 2, this upwards wave has a three wave look. For this reason the alternate wave count below is considered.
If the triangle was a fourth wave, then intermediate wave (1) may be complete. Intermediate wave (2) may have begun; it may not move beyond the start of intermediate wave (1) below 4,106.981. Intermediate wave (2) may last several weeks to a few months.
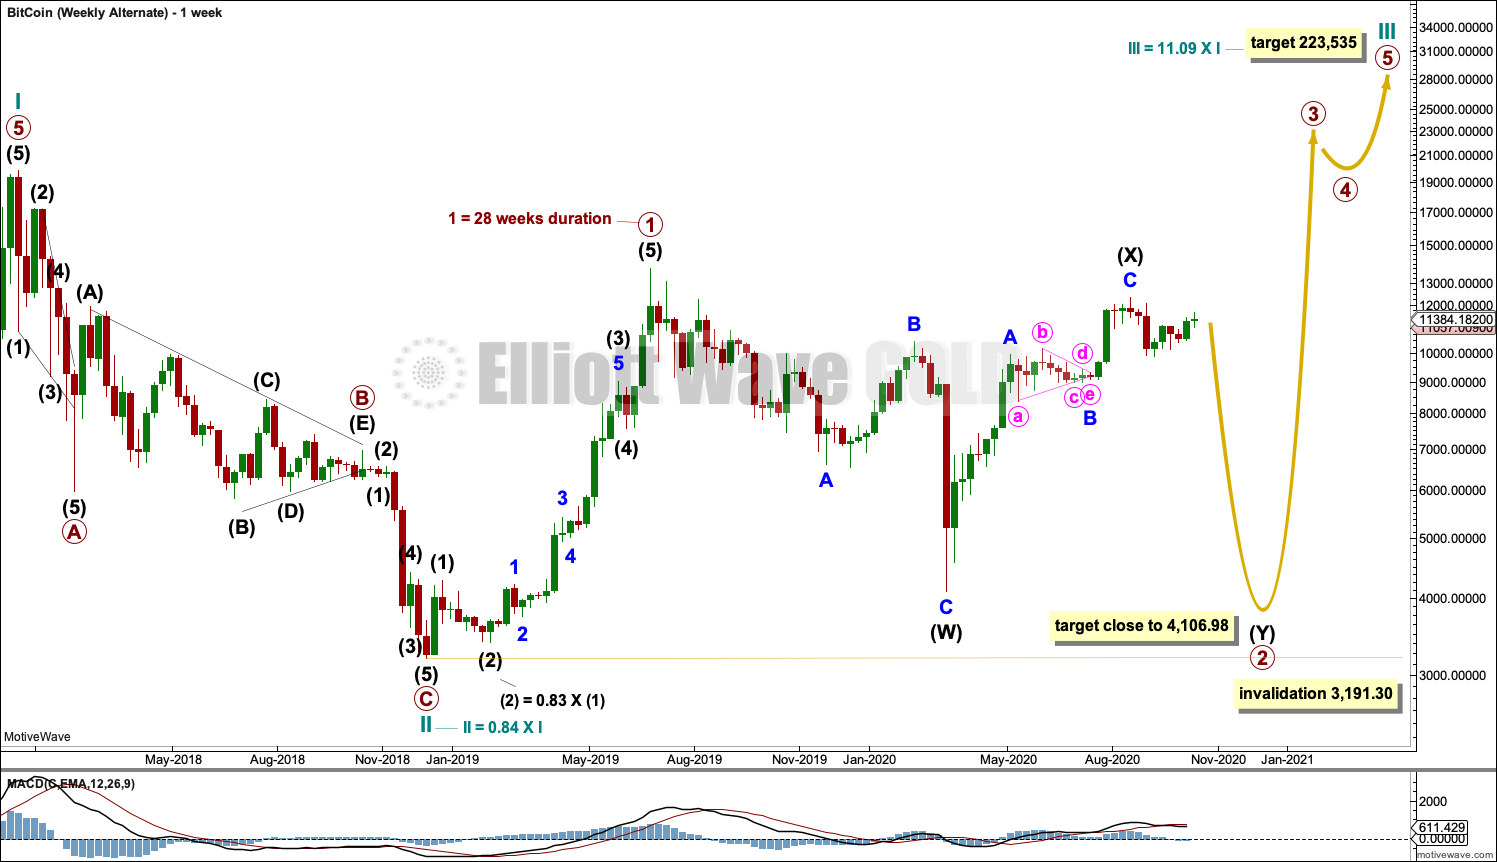
WEEKLY – ALTERNATE
Click chart to enlarge.
If the last upwards wave subdivides as a zigzag, then the triangle within it may have been a B wave. This part of this wave count has a better look.
Primary wave 2 may be continuing sideways as a double combination. The purpose of combinations is to take up time and move price sideways; X waves within combinations are normally very deep. Here, intermediate wave (X) is deep and looks normal for a combination.
Primary wave (Y) would be likely to end about the same level as primary wave (W) to achieve its purpose and give the combination a sideways look.
Primary wave 2 may not move beyond the start of primary wave 1 below 3,191.30.
So far, within the price history of Bitcoin, all primary degree second waves have subdivided as zigzags with one exception of a double zigzag in February 2012. The probability that this primary degree second wave may subdivide as a double combination is low. However, there was an intermediate degree second wave that subdivided as a double combination, ending March 28, 2016.
If primary wave 2 continues sideways as a double combination, then the first structure in the double may be complete as a zigzag labelled intermediate wave (W). The second structure for intermediate wave (Y) would most likely subdivide as a flat correction. Minor wave A within intermediate wave (Y) would most likely subdivide as a zigzag.
DAILY – ALTERNATE
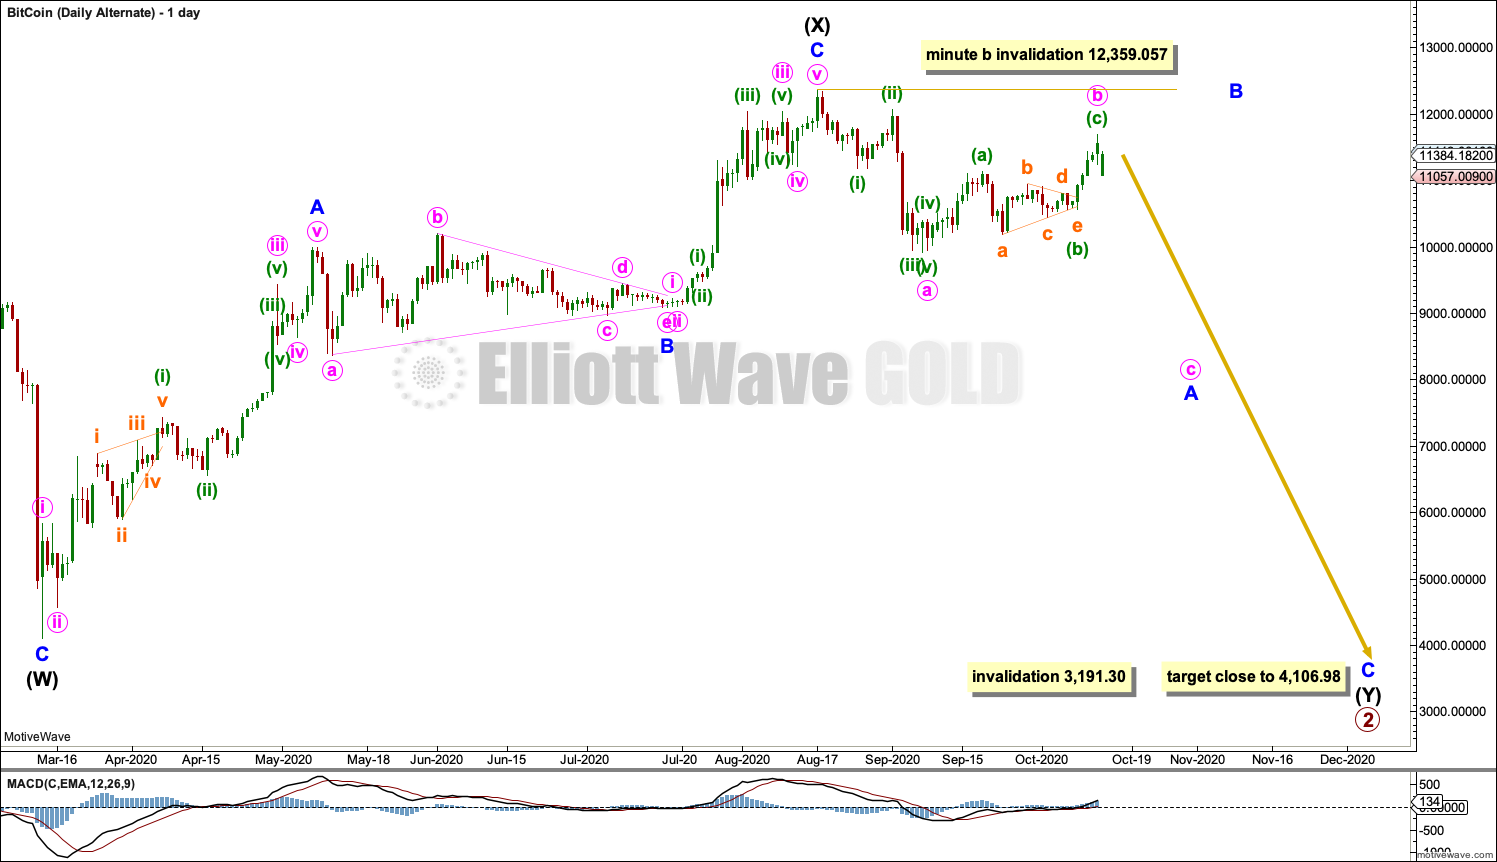
Click chart to enlarge.
If primary wave 2 is continuing sideways as a double combination, then within it intermediate wave (X) should be complete and intermediate wave (Y) should have begun.
Intermediate wave (Y) may subdivide as a triangle or a flat, with a flat being much more likely.
Minor wave A within a flat for intermediate wave (Y) should subdivide as a three, most likely a zigzag. Minute wave b within the zigzag of minor wave A may not move beyond the start of minute wave a above 12,359.057.
When minor wave A may be a complete zigzag, then minor wave B should unfold. Minor wave B must subdivide as a three, must retrace a minimum 0.9 length of minor wave A, and may make a new high above the start of minor wave A as in an expanded flat. At that stage, the upper invalidation point no longer applies.
DAILY – SECOND ALTERNATE
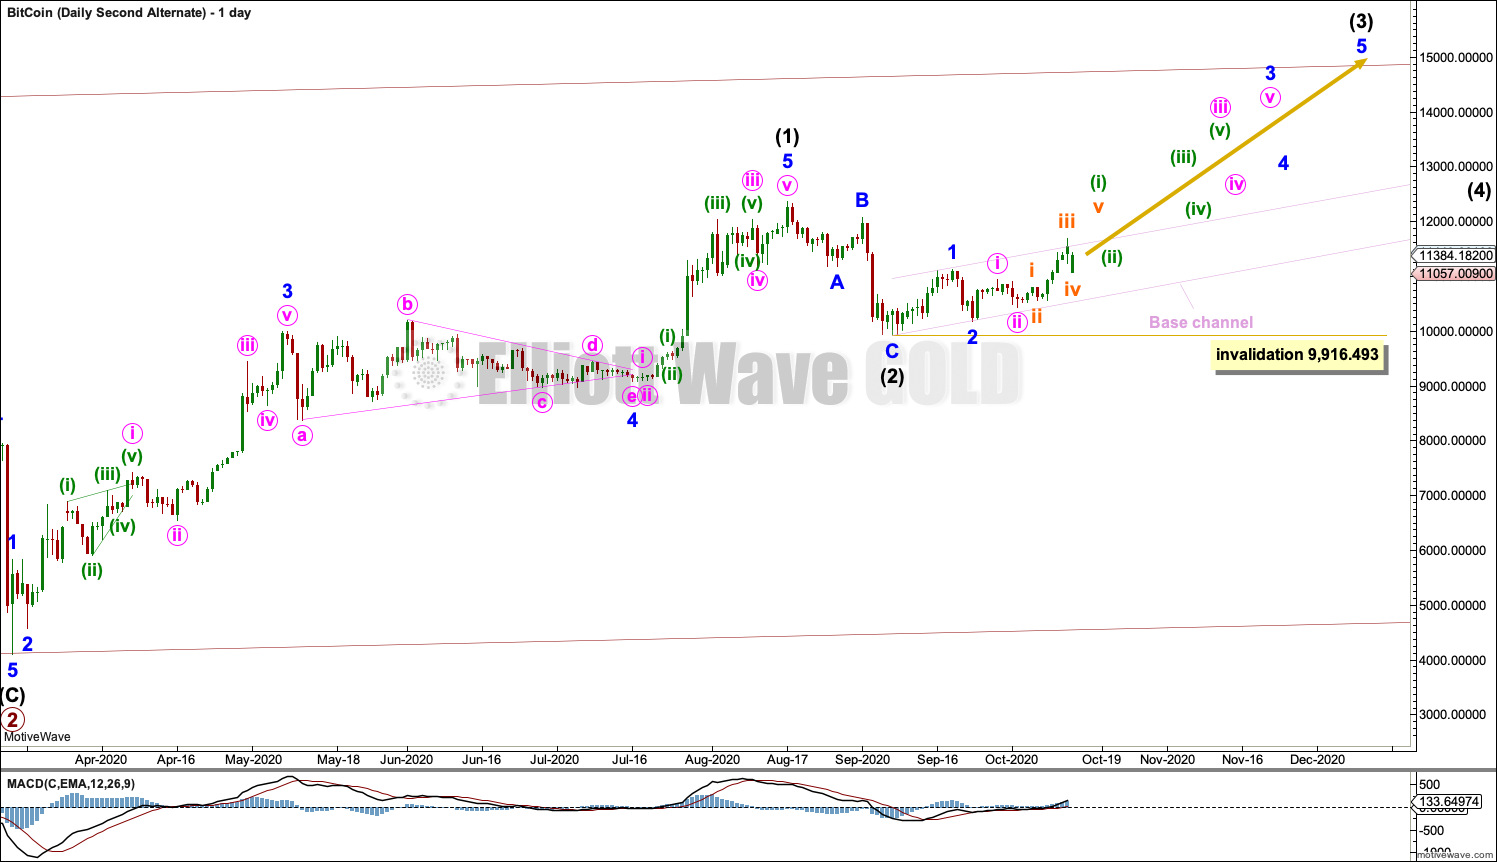
Click chart to enlarge.
This alternate is published to view how the possibility of intermediate wave (2) being complete would look like.
If intermediate wave (2) is over, then it would have lasted only 21 days to the 155 days of intermediate wave (1). While second wave corrections are more commonly longer lasting for Bitcoin, they are not always so. Cycle wave II was only 0.14 the duration of cycle wave I, although it was also very deep.
If intermediate wave (2) is over, then it would be only 0.30 of intermediate wave (1).
Looking back through the price history and a full Elliott wave count of Bitcoin, second wave corrections range in depth from 0.35 (an intermediate degree double combination, ending March 28, 2016) to 0.94 (a cycle degree zigzag, ending November 17, 2011). There are only five examples of shallow (less than 0.5) second wave corrections, and all but two are lower than intermediate degree. The conclusion is that second wave corrections at intermediate degree or higher are most commonly deeper than 0.5. This reduces the probability of this alternate wave count.
A new high above 12,359.057 would see the first two daily wave counts discarded and only this less likely alternate left.
TECHNICAL ANALYSIS
MONTHLY
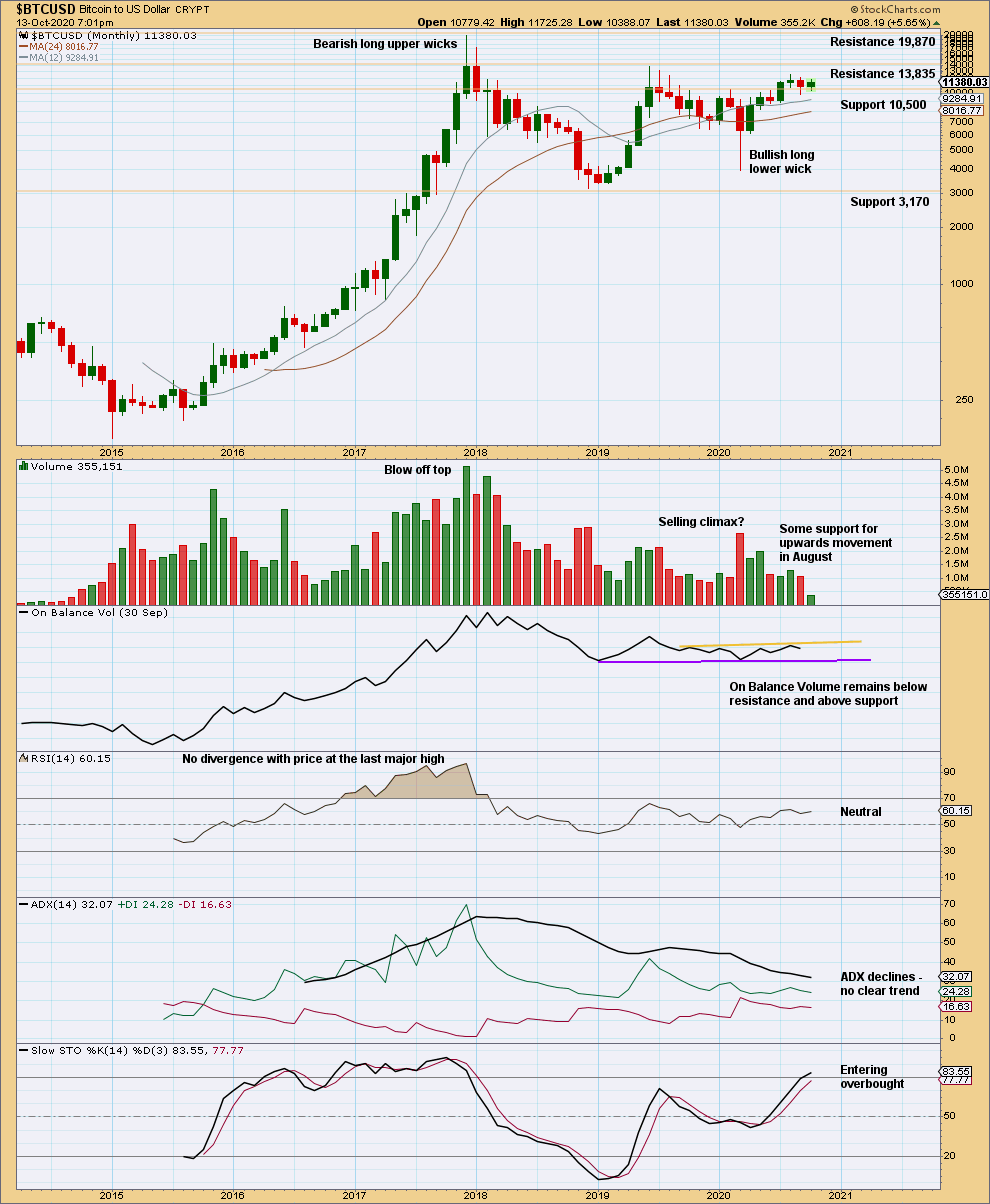
Click chart to enlarge.
Both price and On Balance Volume remain range bound.
WEEKLY
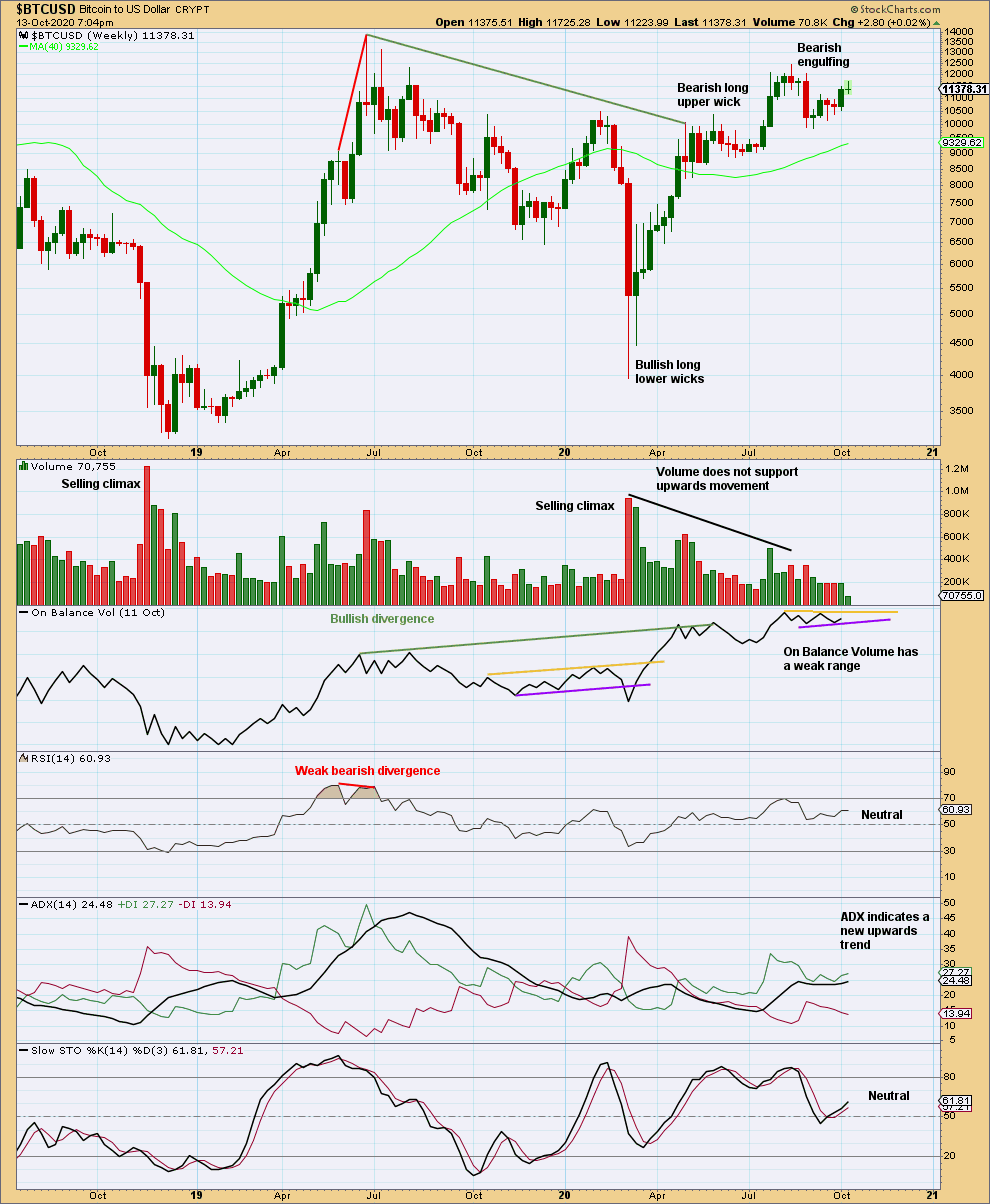
Click chart to enlarge.
The following characteristics can be noted at the end of prior major highs for Bitcoin:
The first sharp rise to the week beginning 5th June 2011: near vertical movement for several weeks, a sharp volume spike for a blow off top on the final week, and no candlestick reversal pattern on the weekly chart but an Evening Doji Star on the daily chart. The following correction was 0.94.
The next sharp rise to the week beginning 7th April 2013: near vertical movement for three weeks, a sharp volume spike on the final week that closed red and formed a Bearish Engulfing pattern on the weekly chart, a Bearish Engulfing pattern on the daily chart, ADX remained very extreme for most of the rise, and single week bearish divergence between price and RSI at the end. The following correction was 0.82.
The next sharp rise to the week beginning 24th November 2013: vertical movement for four weeks, a strong rise in volume until the last week (which saw volume fall), a Bearish Engulfing pattern on the weekly chart, an Evening Doji Star on the daily chart (the third candlestick of which had strong support from volume), ADX reached very extreme for many days, and RSI reached extreme overbought and there exhibited single bearish divergence. The following correction was 0.93.
The last sharp rise to the all time high at 19,870.62 on the 17th of December 2018: vertical movement for three weeks, a strong increase in volume up to the last week (which saw a fall in volume), a Bearish Engulfing pattern on the weekly chart that had support from volume; on the daily chart, ADX reached very extreme for a coupe of weeks or so, RSI reached overbought and there exhibited single bearish divergence, and early downwards movement from the high had support from volume. The following correction was 0.84.
Some conclusions may be drawn about how to identify a major high in Bitcoin:
– Look for vertical movement on the weekly chart for at least two weeks, and possibly up to several (although when it is more than three the movement may be interspaced with a small pause).
– Look for either a sharp volume spike for a blow off top, or a strong increase in volume then followed by a single week of lighter volume at the possible high.
– A bearish candlestick reversal pattern has been seen so far at every major high for Bitcoin, so an absence of any candlestick reversal pattern at a potential high should be viewed very suspiciously.
– ADX is of no use as it may remain very extreme for long periods of time.
– RSI may also remain very extreme for long periods of time and may not exhibit any divergence, but it may add a little confidence in the high if it does exhibit bearish divergence in conjunction with other indicators being bearish.
The last vertical rise to June 2019 now exhibits enough of the points looked for to have some confidence that Bitcoin may have found an interim top: vertical movement for three weeks, a volume spike on the last week, and a very bearish long upper wick on the candlestick at the high, although this is not a candlestick reversal pattern.
With price now continuing higher, it looks like the high of June 2019 may be breached. Prior to a breach, resistance in this area should be strong and may force a pullback.
DAILY
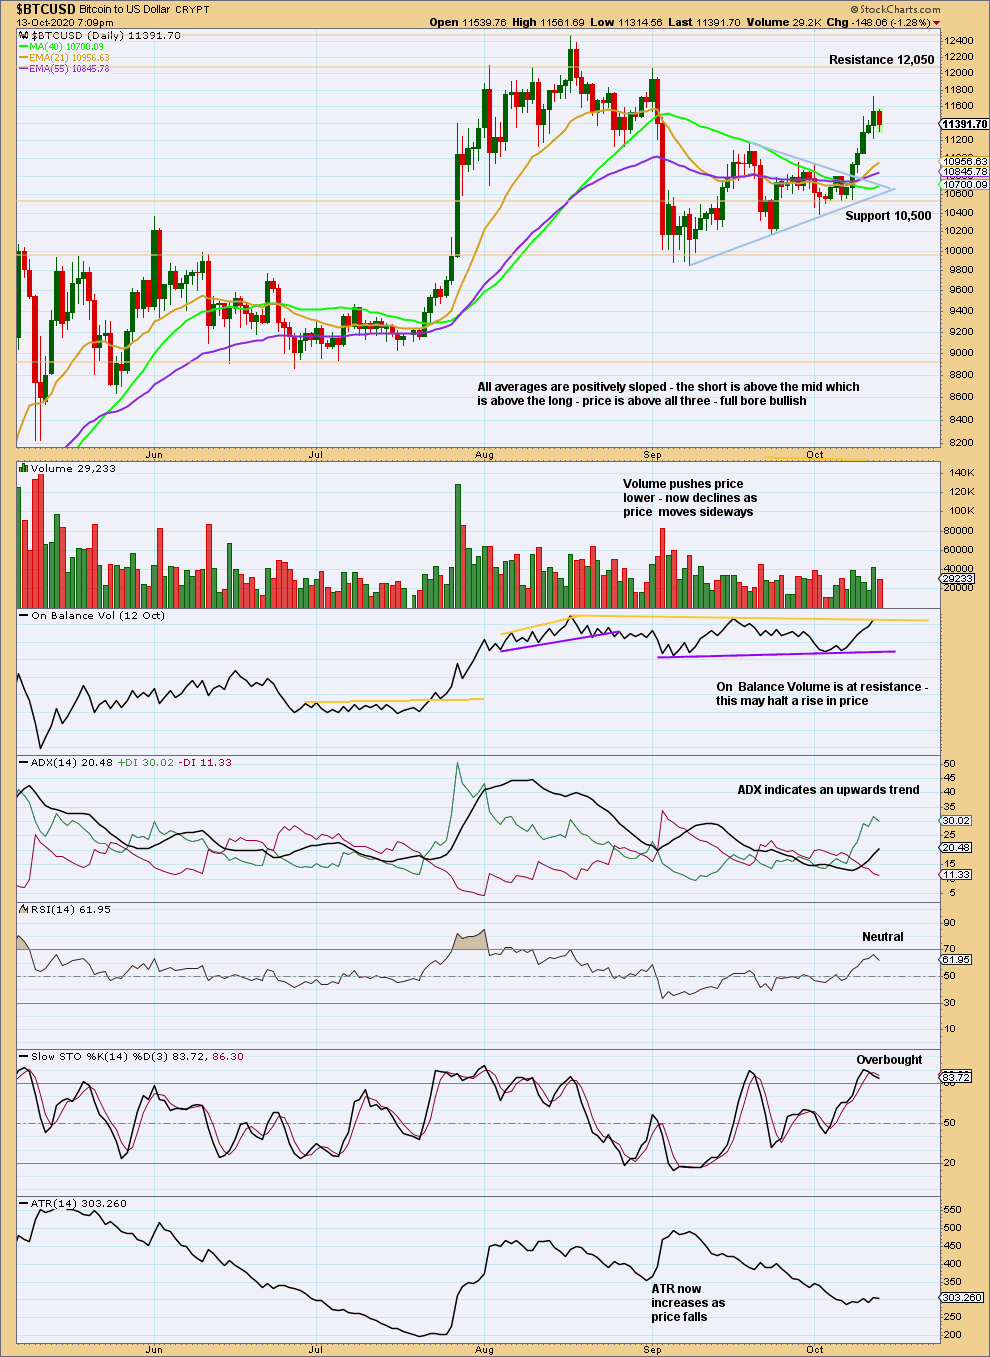
Click chart to enlarge.
The following can be noted when looking back at Bitcoin’s behaviour at major lows:
The 94% fall in price from June to November 2011 was characterised by:
– Three clearly separate instances of RSI reaching oversold on the daily chart, separated by bounces.
– ADX did not remain very extreme for very long at all on the daily chart.
– On Balance Volume exhibited weak single bullish divergence at the low.
The 93% fall in price from November 2013 to February 2014 was characterised by:
– RSI reached oversold and remained deeply oversold for three weeks; at the low, there was only single weak bullish divergence with price.
– ADX remained very extreme for the last seven sessions to the low.
– At the low, On Balance Volume did not exhibit bullish divergence with price. It remained bearish and then exhibited further bearishness after the low as it continued to decline as price began to rise.
The 84% fall in price from December 2017 to December 2018 was characterised by:
– RSI reached deeply oversold and then exhibited double divergence with price.
– ADX reached very extreme 20 sessions prior to the low.
– At the low, On Balance Volume exhibits no bullish divergence with price; it turned with price.
At this last low now on March 13th 2020, the following can be noted:
– There is no Bullish candlestick reversal pattern.
– An instance of single day bullish divergence between price and On Balance Volume.
– An instance of single day bullish divergence between price and RSI after RSI reached reasonably oversold.
– ADX had not reached extreme.
With a new swing high above 10,457.627, some confidence that the low of March 13, 2020 is sustainable may be had.
An upwards trend is indicated, which is not yet extreme. However, price is within a strong cluster of resistance and support, and On Balance Volume is at resistance.
A target calculated from the triangle is at 12,099.
Published @ 04:42 p.m. EST.
—
Careful risk management protects your trading account(s).
Follow my two Golden Rules:
1. Always trade with stops.
2. Risk only 1-5% of equity on any one trade.
—
New updates to this analysis are in bold.