
BTCUSD: Elliott Wave and Technical Analysis | Charts – November 12, 2020
In last analysis on October 13th, the main Elliott wave count expected a pullback to continue. This was discarded above 12,359.057 in favour of a bullish alternate wave count, which expected price to keep going up.
Summary: Overall, the upwards trend may continue towards new all time highs. There may be strong resistance along the way up at the all time high at 19,870, where a pullback may be initiated.
For the short term, Bitcoin looks vulnerable to a pullback. If a bearish candlestick pattern develops on the daily chart, then this signal should be taken seriously. Refer to the daily technical analysis chart for support lines.
The data used for this analysis comes from Yahoo Finance BTC-USD.
Monthly and weekly charts are on a semi-log scale. The close up daily chart is on an arithmetic scale.
MAIN ELLIOTT WAVE COUNT
MONTHLY
Click chart to enlarge.
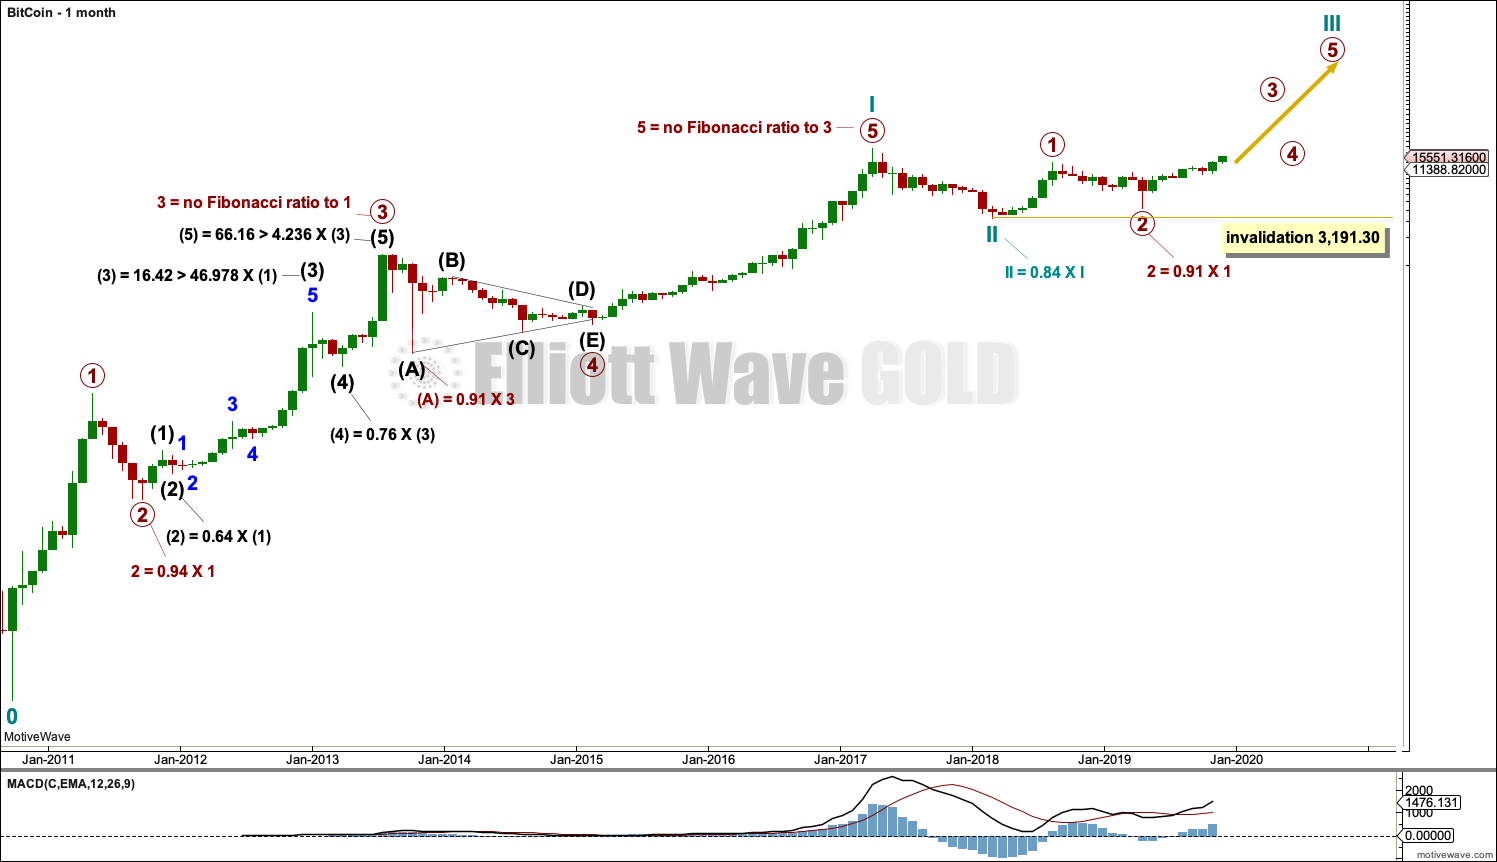
It is possible to see a completed five wave impulse upwards for Bitcoin.
I am unable to find many reasonable Fibonacci ratios within this wave count. It appears that Bitcoin may not exhibit Fibonacci ratios very often between its actionary waves, so this makes target calculation impossible. Classic technical analysis was used to identify a high in place on December 23, 2017.
What is very clear from this chart is that Bitcoin forms classic bubbles. It has done so now several times and may now be doing so again. So far each bubble has popped and Bitcoin has collapsed, to then thereafter form a new bubble. Each bubble is larger than the one prior; so if another Bitcoin bubble is forming, it may be expected to take price substantially above the all time high.
Bitcoin tends to behave like an extreme commodity: price moves upwards for about 2 – 4 weeks in a near vertical movement at the end of its rises. Following this vertical movement the resulting downwards movement is very deep (in percentage terms) and often very quick.
The next rise begins slowly with basing action over weeks or months, and then as the rise nears its end another vertical movement completes it. Also, there are volume spikes just before or at the end, which is another feature typical of commodity like behaviour.
This has happened now several times. The most notable instances are the rise up to the week ending 24th November, 2013, and the week ending 5th June, 2011. The following sharp drops were 94% and 93% respectively.
The last instance was the rise up to the last all time high for Bitcoin at 19,870.62 on the 17th of December 2017. The drop thereafter may now be considered as highly likely to be complete. If the drop is complete, it was an 84% drop (labelled cycle wave II).
WEEKLY
Click chart to enlarge.
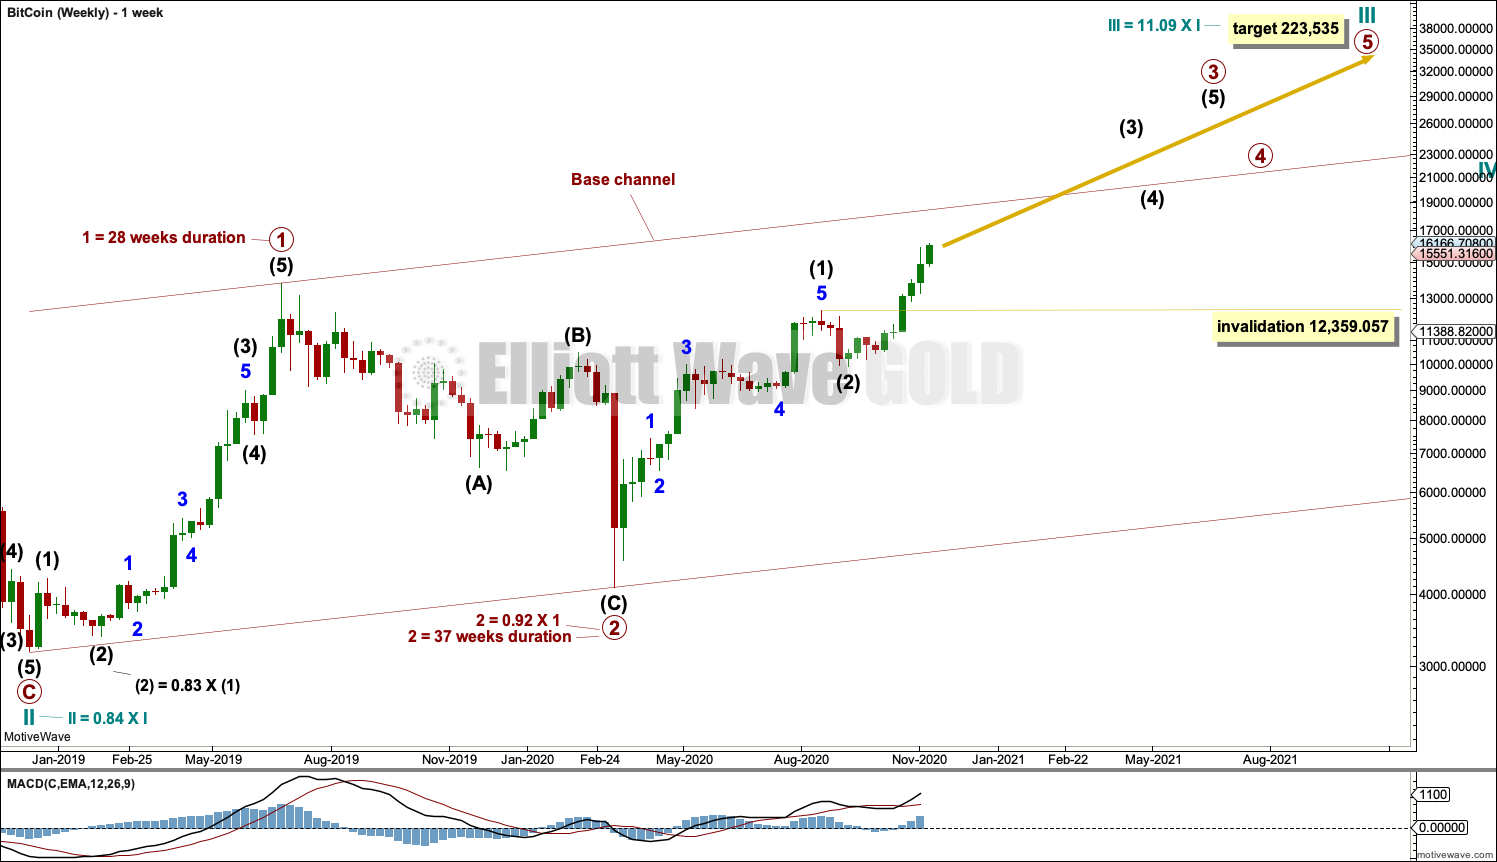
Cycle wave II may be a complete zigzag.
Cycle wave III must move above the end of cycle wave I at 19,870.62. It must move far enough above this point to allow room for cycle wave IV to unfold and remain above cycle wave I price territory.
Cycle wave I lasted 7.2 years and cycle wave II may have been over within just under one year. It would be reasonable to expect cycle wave III to last about 7 years, or possibly a Fibonacci 8 or 13 years. At this stage, it may be now within its 23rd month.
Cycle wave III must unfold as a simple five wave impulse, and within this impulse there should be two large corrections for primary waves 2 and 4. It is possible that primary wave 2 could be complete and the main wave count now views it as so. If it is complete, primary wave 2 would be a normal depth of primary wave 1 and still in proportion to primary wave 1 in terms of duration. Primary wave 2 looks like an obvious three wave structure.
If this wave count is correct, then a third wave up at two large degrees may be underway and may develop further strength. Classic technical analysis will again be used to identify the next major high in place. The target calculated is provisional; if it is wrong, the target may not be high enough. All of my calculated targets in the run up to the all time high in December 2017 were too low by a wide margin.
Primary wave 3 would very likely be much longer than 4.236 times the length of primary wave 1. Primary wave 3 would very likely end with a blow off top after a vertical rise of 2 to 4 weeks. Primary wave 3 must move far enough above primary wave 1 to allow room for primary wave 4 to unfold and remain above primary wave 1 price territory.
DAILY
Click chart to enlarge.
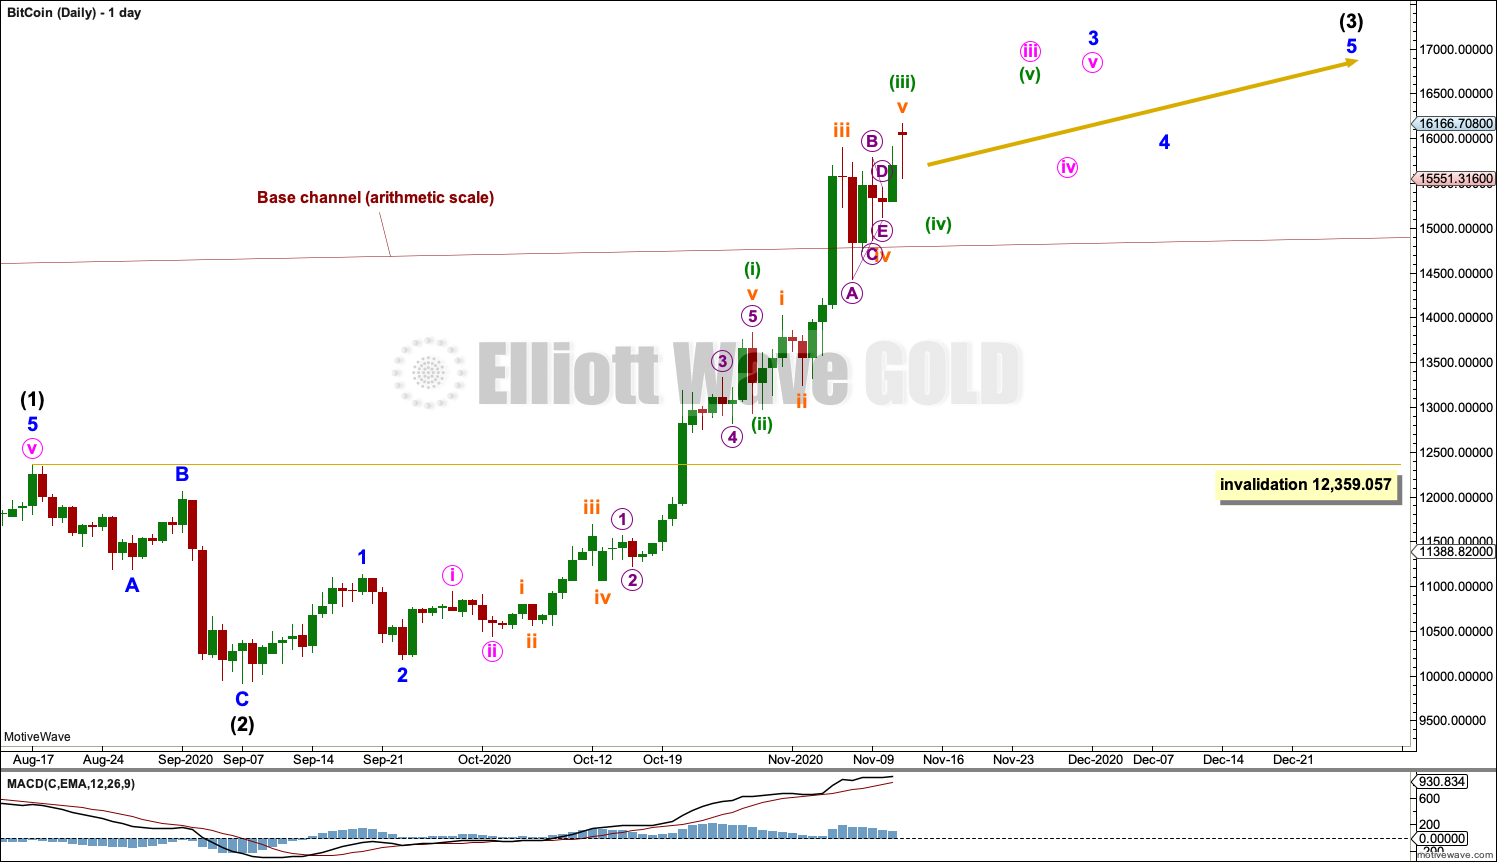
The main daily chart wave count focusses on the middle of primary wave 3.
The end of intermediate wave (1), which may be seen on the weekly chart, is on the 17th of August 2020. Intermediate wave (2) may be a relatively brief and shallow zigzag at only 0.30 the depth of intermediate wave (1).
Intermediate wave (3) may only subdivide as an impulse.
Bitcoin typically exhibits blow off tops along the way up (it may form several) and each may be followed by a brief and shallow correction as a third wave nears its end. Any one of minuette wave (v), minute wave v or minor wave 5 may form blow off tops. Each corresponding fourth wave may not move into its first wave price territory.
Intermediate wave (4) may not move into intermediate wave (1) price territory below 12,359.057.
WEEKLY – ALTERNATE
Click chart to enlarge.
This wave count is published in the spirit of always considering multiple possibilities.
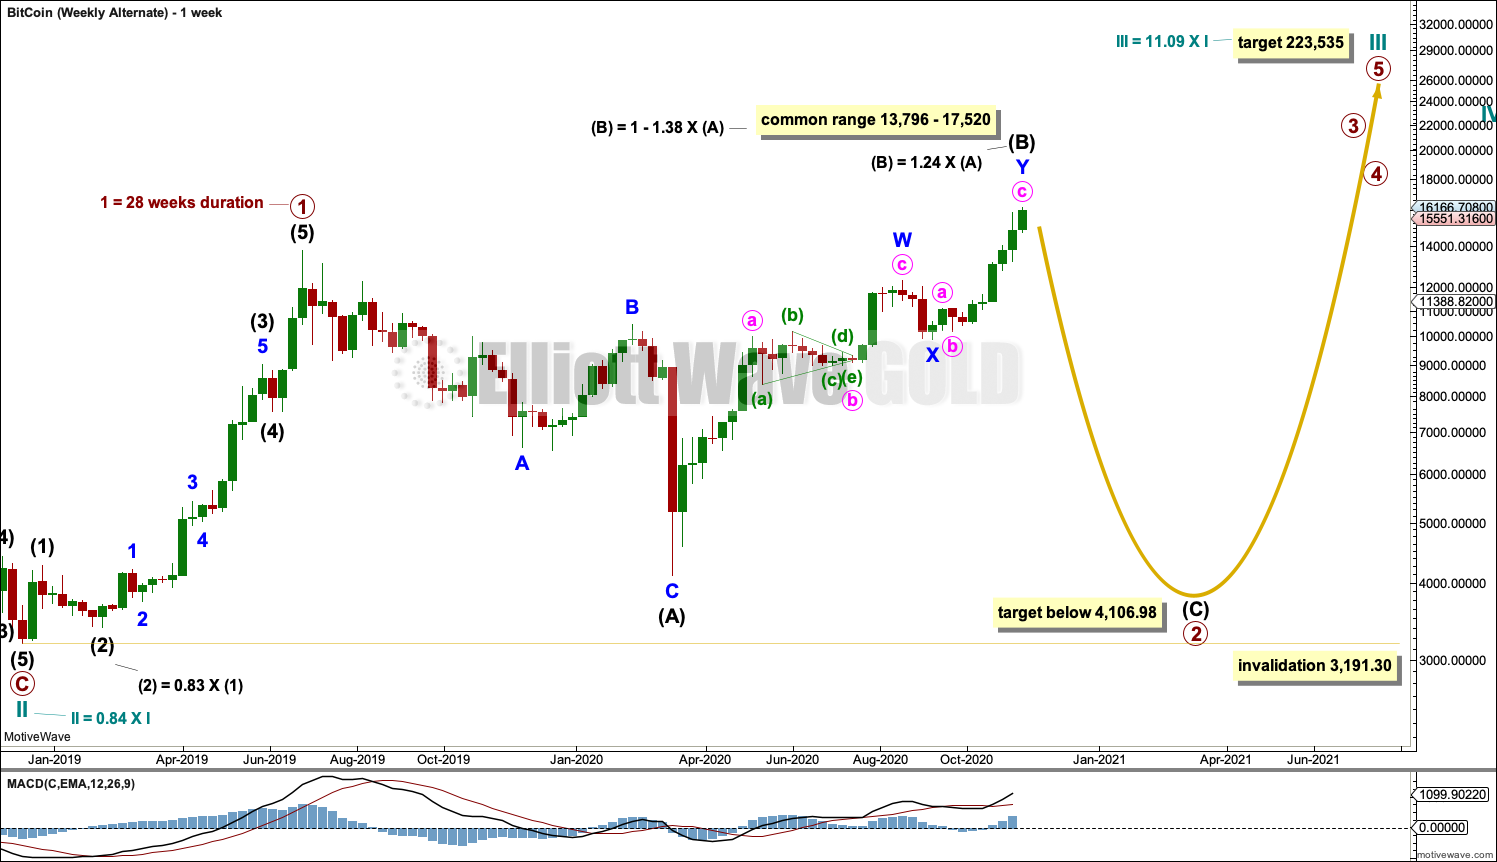
It is possible that primary wave 2 may not be over and may continue further as an expanded flat.
B waves within expanded flats are a 1.05 length or longer than the corresponding A wave. In this case, intermediate wave (B) may now be a 1.24 length to intermediate wave (A). Intermediate wave (B) may still continue higher and this wave count would remain valid; the expanded flat may remain within normal guidelines. The price range is provided on the chart.
Intermediate wave (C) of an expanded flat would be extremely likely to move at least slightly below the end of intermediate wave (A) at 4,106.98 to avoid a truncation and a very rare running flat.
Primary wave 2 may not move beyond the start of primary wave 1 below 3,191.30.
This wave count has a very good fit in terms of Elliott wave structure. Intermediate wave (B) fits very well as a double zigzag, which may be complete or may extend a little higher. However, this alternate wave count does not have support from classic technical analysis, so it has a very low probability. It should only be seriously considered if price invalidates the main wave count and provides confidence in this alternate.
DAILY – ALTERNATE
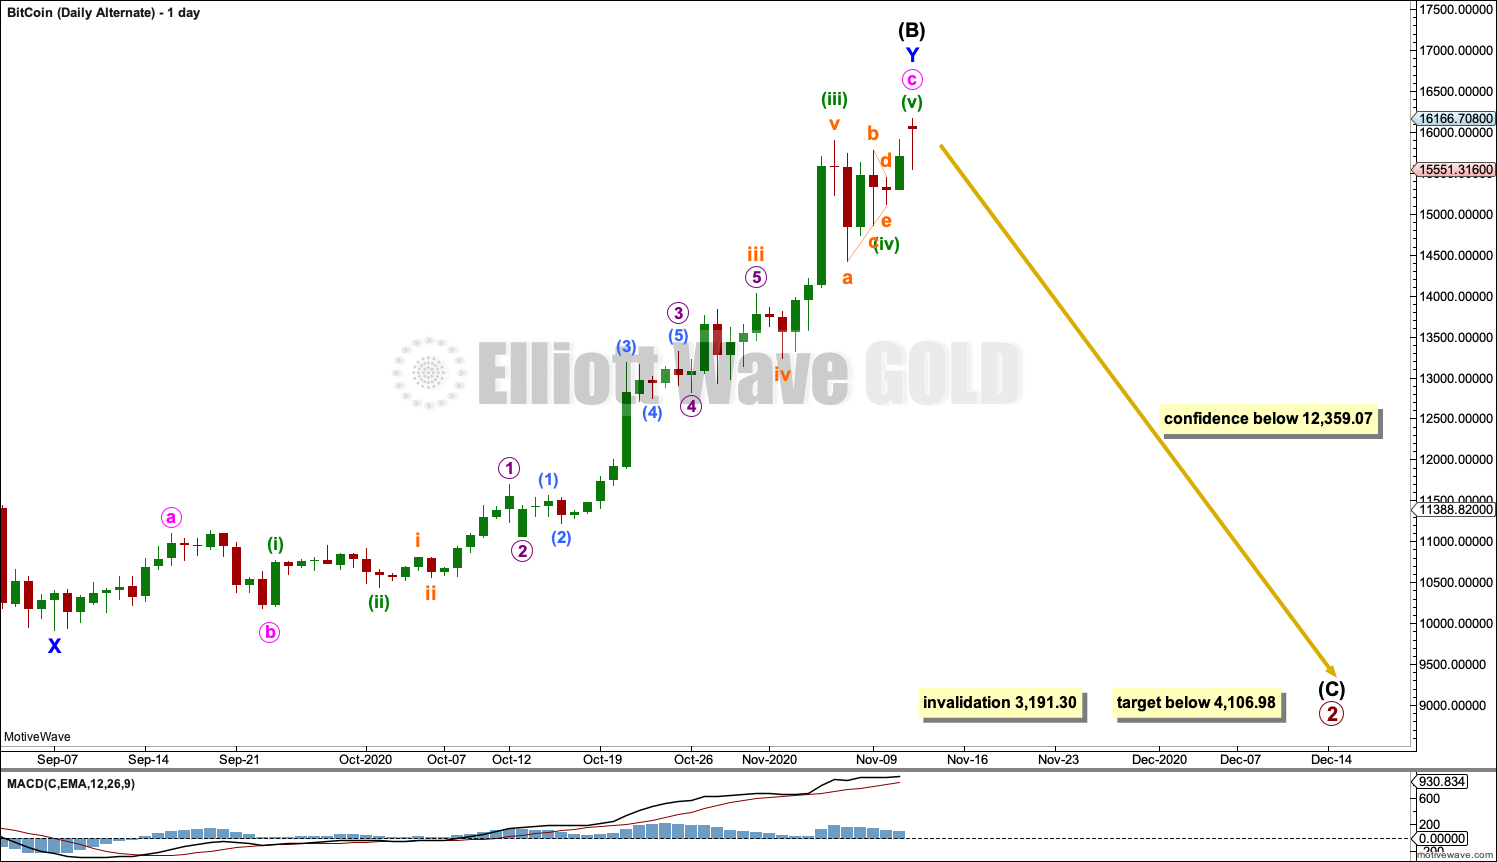
Click chart to enlarge.
The daily chart focusses on the possible zigzag of minor wave Y within the double zigzag of intermediate wave (B). It is possible that minor wave Y may be complete, but it is also possible that it may yet extend higher. Classic technical analysis (provided below) should be used to identify a high in place.
TECHNICAL ANALYSIS
MONTHLY

Click chart to enlarge.
Price has broken above resistance, which was about 13,835, and may now offer support.
However, On Balance Volume has not confirmed the breakout; it remains below resistance and is not making corresponding highs. This may offer a very small support to the alternate Elliott wave count.
On balance this chart is bullish and supports the main Elliott wave count. The breakout above 13,835 is particularly bullish. Look for next strong resistance at the all time high at 19,870.
There is an upwards trend. Stochastics is overbought, but this may remain so for an extended period of time while price moves a considerable distance when this market trends.
WEEKLY
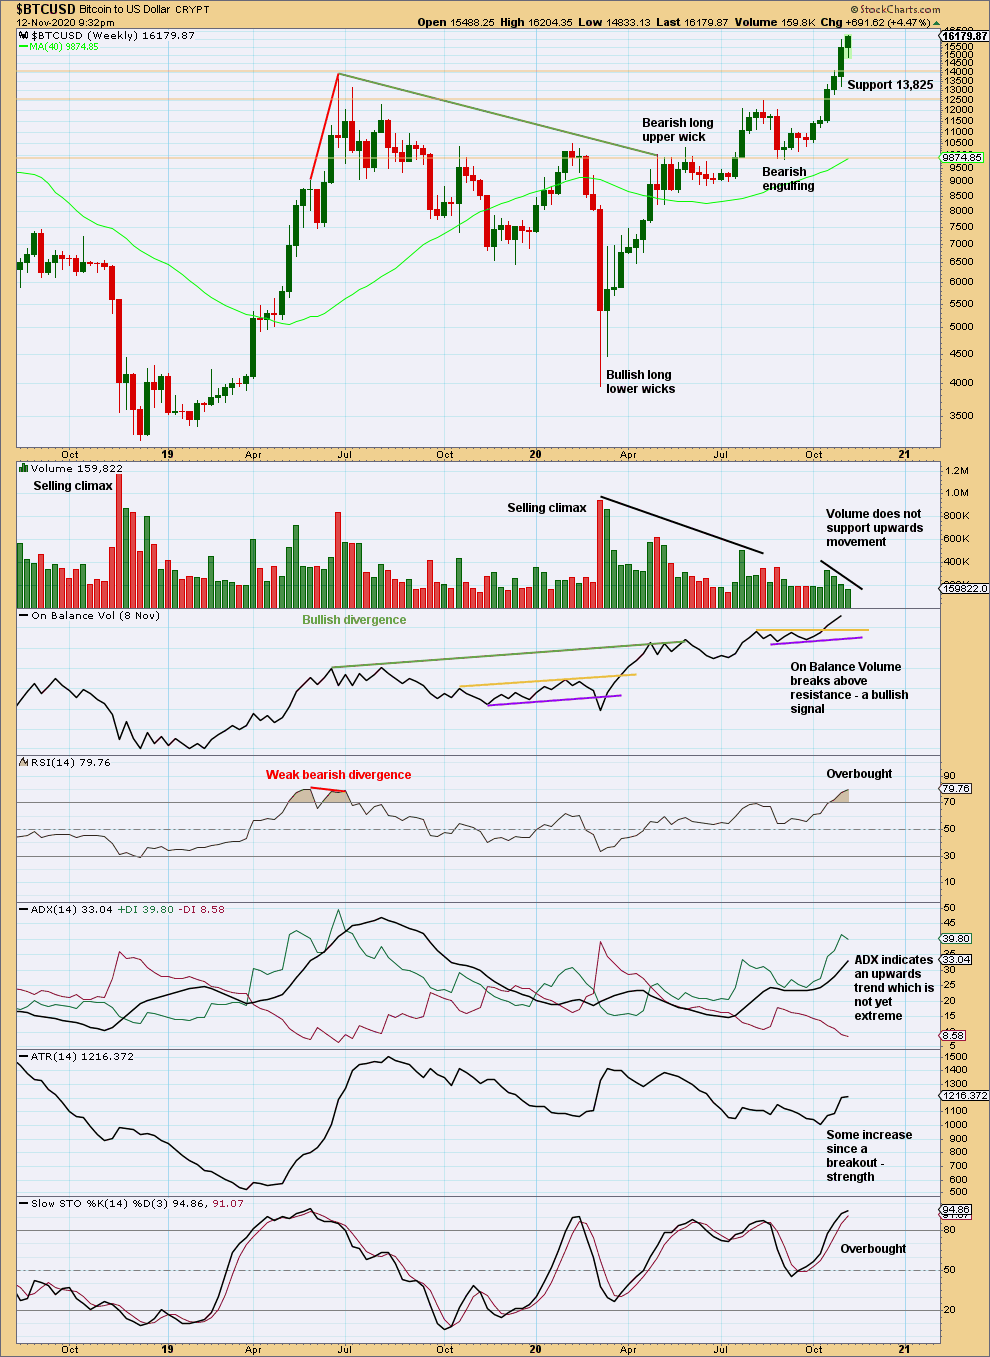
Click chart to enlarge.
The following characteristics can be noted at the end of prior major highs for Bitcoin:
The first sharp rise to the week beginning 5th June 2011: near vertical movement for several weeks, a sharp volume spike for a blow off top on the final week, and no candlestick reversal pattern on the weekly chart but an Evening Doji Star on the daily chart. The following correction was 0.94.
The next sharp rise to the week beginning 7th April 2013: near vertical movement for three weeks, a sharp volume spike on the final week that closed red and formed a Bearish Engulfing pattern on the weekly chart, a Bearish Engulfing pattern on the daily chart, ADX remained very extreme for most of the rise, and single week bearish divergence between price and RSI at the end. The following correction was 0.82.
The next sharp rise to the week beginning 24th November 2013: vertical movement for four weeks, a strong rise in volume until the last week (which saw volume fall), a Bearish Engulfing pattern on the weekly chart, an Evening Doji Star on the daily chart (the third candlestick of which had strong support from volume), ADX reached very extreme for many days, and RSI reached extreme overbought and there exhibited single bearish divergence. The following correction was 0.93.
The last sharp rise to the all time high at 19,870.62 on the 17th of December 2018: vertical movement for three weeks, a strong increase in volume up to the last week (which saw a fall in volume), a Bearish Engulfing pattern on the weekly chart that had support from volume; on the daily chart, ADX reached very extreme for a coupe of weeks or so, RSI reached overbought and there exhibited single bearish divergence, and early downwards movement from the high had support from volume. The following correction was 0.84.
Some conclusions may be drawn about how to identify a major high in Bitcoin:
– Look for vertical movement on the weekly chart for at least two weeks, and possibly up to several (although when it is more than three the movement may be interspaced with a small pause).
– Look for either a sharp volume spike for a blow off top, or a strong increase in volume then followed by a single week of lighter volume at the possible high.
– A bearish candlestick reversal pattern has been seen so far at every major high for Bitcoin, so an absence of any candlestick reversal pattern at a potential high should be viewed very suspiciously.
– ADX is of no use as it may remain very extreme for long periods of time.
– RSI may also remain very extreme for long periods of time and may not exhibit any divergence, but it may add a little confidence in the high if it does exhibit bearish divergence in conjunction with other indicators being bearish.
The last vertical rise to June 2019 now exhibits enough of the points looked for to have some confidence that Bitcoin may have found an interim top: vertical movement for three weeks, a volume spike on the last week, and a very bearish long upper wick on the candlestick at the high, although this is not a candlestick reversal pattern.
With price now continuing higher, it looks like the high of June 2019 may be breached. Prior to a breach, resistance in this area should be strong and may force a pullback.
For the short term, the upwards breakout above 13,825 three weeks ago does not have support from volume at the weekly chart level. This may offer a very little support to the alternate Elliott wave count. However, this chart is bullish and in the early stages of its bullish trends Bitcoin does not always exhibit support from volume. A recent example of this is in March and April of this year.
DAILY
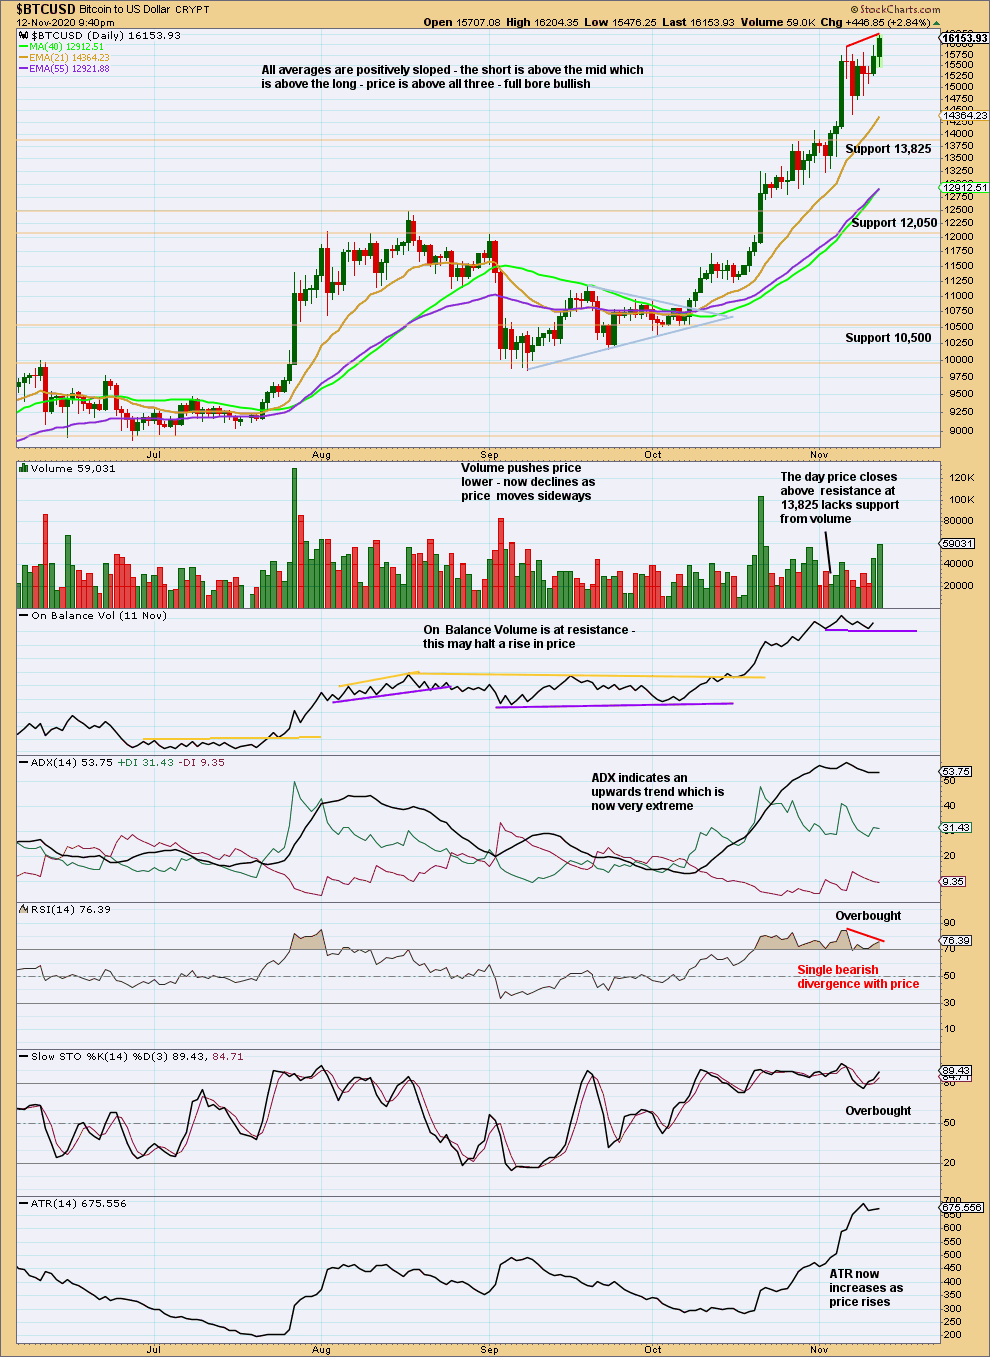
Click chart to enlarge.
The following can be noted when looking back at Bitcoin’s behaviour at major lows:
The 94% fall in price from June to November 2011 was characterised by:
– Three clearly separate instances of RSI reaching oversold on the daily chart, separated by bounces.
– ADX did not remain very extreme for very long at all on the daily chart.
– On Balance Volume exhibited weak single bullish divergence at the low.
The 93% fall in price from November 2013 to February 2014 was characterised by:
– RSI reached oversold and remained deeply oversold for three weeks; at the low, there was only single weak bullish divergence with price.
– ADX remained very extreme for the last seven sessions to the low.
– At the low, On Balance Volume did not exhibit bullish divergence with price. It remained bearish and then exhibited further bearishness after the low as it continued to decline as price began to rise.
The 84% fall in price from December 2017 to December 2018 was characterised by:
– RSI reached deeply oversold and then exhibited double divergence with price.
– ADX reached very extreme 20 sessions prior to the low.
– At the low, On Balance Volume exhibits no bullish divergence with price; it turned with price.
At this last low now on March 13th 2020, the following can be noted:
– There is no Bullish candlestick reversal pattern.
– An instance of single day bullish divergence between price and On Balance Volume.
– An instance of single day bullish divergence between price and RSI after RSI reached reasonably oversold.
– ADX had not reached extreme.
With a new swing high above 10,457.627, some confidence that the low of March 13, 2020 is sustainable may be had.
The target calculated from the triangle was at 12,099, which has been passed.
A small pennant pattern may have just formed and price has broken out above it. A target calculated from the flag pole is at 18,409.
At this time, Bitcoin looks like it may be vulnerable to a pullback: ADX is very extreme, and RSI is overbought and exhibiting bearish divergence with price. If a bearish candlestick pattern forms on the daily chart, then look for a pullback. Use support lines as guides to how low a pullback may go.
Published @ 09:02 p.m. EST.
—
Careful risk management protects your trading account(s).
Follow my two Golden Rules:
1. Always trade with stops.
2. Risk only 1-5% of equity on any one trade.
—
New updates to this analysis are in bold.