
BTCUSD: Elliott Wave and Technical Analysis | Charts – December 17, 2020
The main Elliott wave count in last analysis, on 12th November, expected more upwards movement and a further increase in strength. This is exactly what is happening.
Today’s analysis focusses on how to identify when a larger pullback or consolidation may arrive.
Summary: Overall, the upwards trend may continue. A provisional short-term target is at 44,872.
Expect support now for any deeper pullbacks at 19,870.
Another blow off top may be forming. Look for a vertical rise of 2-4 weeks. This current week may be only the first. Thereafter, look for bearish candlestick reversal patterns on the weekly and / or daily charts, and possibly bearish divergence between price and RSI.
The data used for this analysis comes from Yahoo Finance BTC-USD.
Monthly and weekly charts are on a semi-log scale. The close up daily chart is on an arithmetic scale.
MAIN ELLIOTT WAVE COUNT
MONTHLY
Click chart to enlarge.
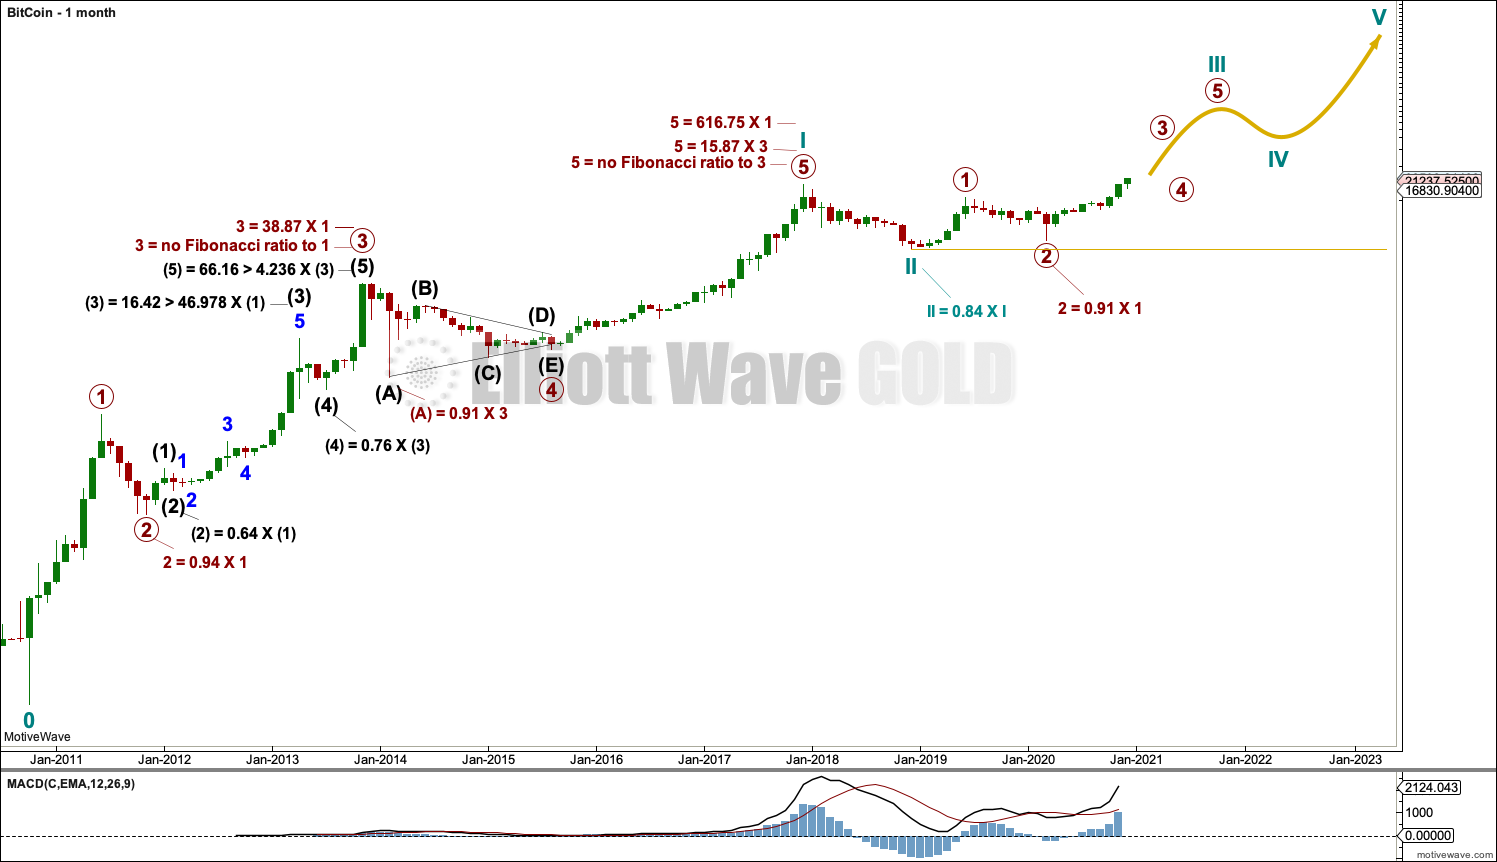
It is possible to see a completed five wave impulse upwards for Bitcoin to the high in December 2017. This has been followed by a deep three wave structure downwards to the low in December 2018.
I am unable to find many reasonable Fibonacci ratios within this wave count. It appears that Bitcoin may not exhibit Fibonacci ratios very often between its actionary waves, so this makes target calculation impossible. Classic technical analysis was used to identify a high in place on December 23, 2017.
What is very clear from this chart is that Bitcoin forms classic bubbles. It has done so now several times and is now doing so again. So far each bubble has popped and Bitcoin has collapsed, to then thereafter form a new bubble. Each bubble is larger than the one prior; so if another Bitcoin bubble is forming, it may be expected to take price substantially above the all time high.
Bitcoin tends to behave like an extreme commodity: price moves upwards for about 2 – 4 weeks in a near vertical movement at the end of its rises. Following this vertical movement the resulting downwards movement is very deep (in percentage terms) and often very quick.
The next rise begins slowly with basing action over weeks or months, and then as the rise nears its end another vertical movement completes it. Also, there are volume spikes just before or at the end, which is another feature typical of commodity like behaviour.
This has happened now several times. The most notable instances are the rise up to the week ending 24th November, 2013, and the week ending 5th June, 2011. The following sharp drops were 94% and 93% respectively.
The last instance was the rise up to the last all time high for Bitcoin at 19,870.62 on the 17th of December 2017. The drop thereafter may now be considered as highly likely to be complete. If the drop is complete, it was an 84% drop (labelled cycle wave II).
WEEKLY
Click chart to enlarge.
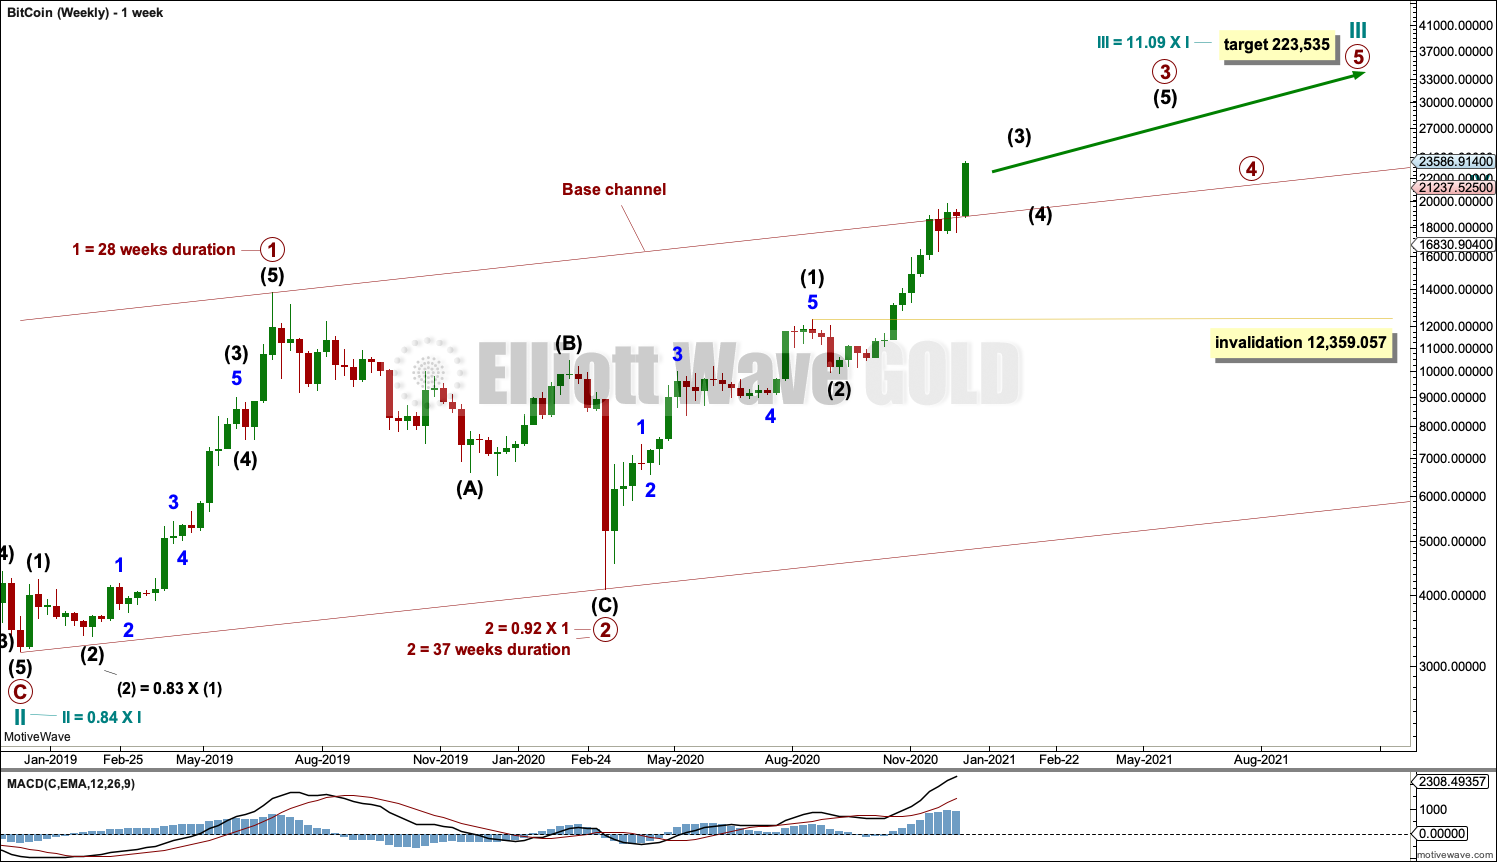
Cycle wave II may be a complete zigzag.
Cycle wave III has now moved above the end of cycle wave I at 19,870.62. It must move far enough above this point to allow room for cycle wave IV to unfold and remain above cycle wave I price territory.
Cycle wave I lasted 7.2 years and cycle wave II may have been over within just under one year. It would be reasonable to expect cycle wave III to last about 7 years, or possibly a Fibonacci 8 or 13 years. At this stage, it may be now within its 24th month.
Cycle wave III must unfold as a simple five wave impulse, and within this impulse there should be two large corrections for primary waves 2 and 4. Primary wave 2 is complete. Primary wave 3 is underway.
If this wave count is correct, then a third wave up at two large degrees may be underway and may develop further strength. Classic technical analysis will again be used to identify the next major high in place. The target calculated is provisional; if it is wrong, the target may not be high enough. All of my calculated targets in the run up to the all time high in December 2017 were too low by a wide margin.
Primary wave 3 would very likely be much longer than 4.236 times the length of primary wave 1. Primary wave 3 would very likely end with a blow off top after a vertical rise of 2 to 4 weeks. Primary wave 3 must move far enough above primary wave 1 to allow room for primary wave 4 to unfold and remain above primary wave 1 price territory.
Primary wave 3 may only subdivide as an impulse. Within primary wave 3: Intermediate waves (1) and (2) are complete, and intermediate wave (3) is underway.
DAILY
Click chart to enlarge.
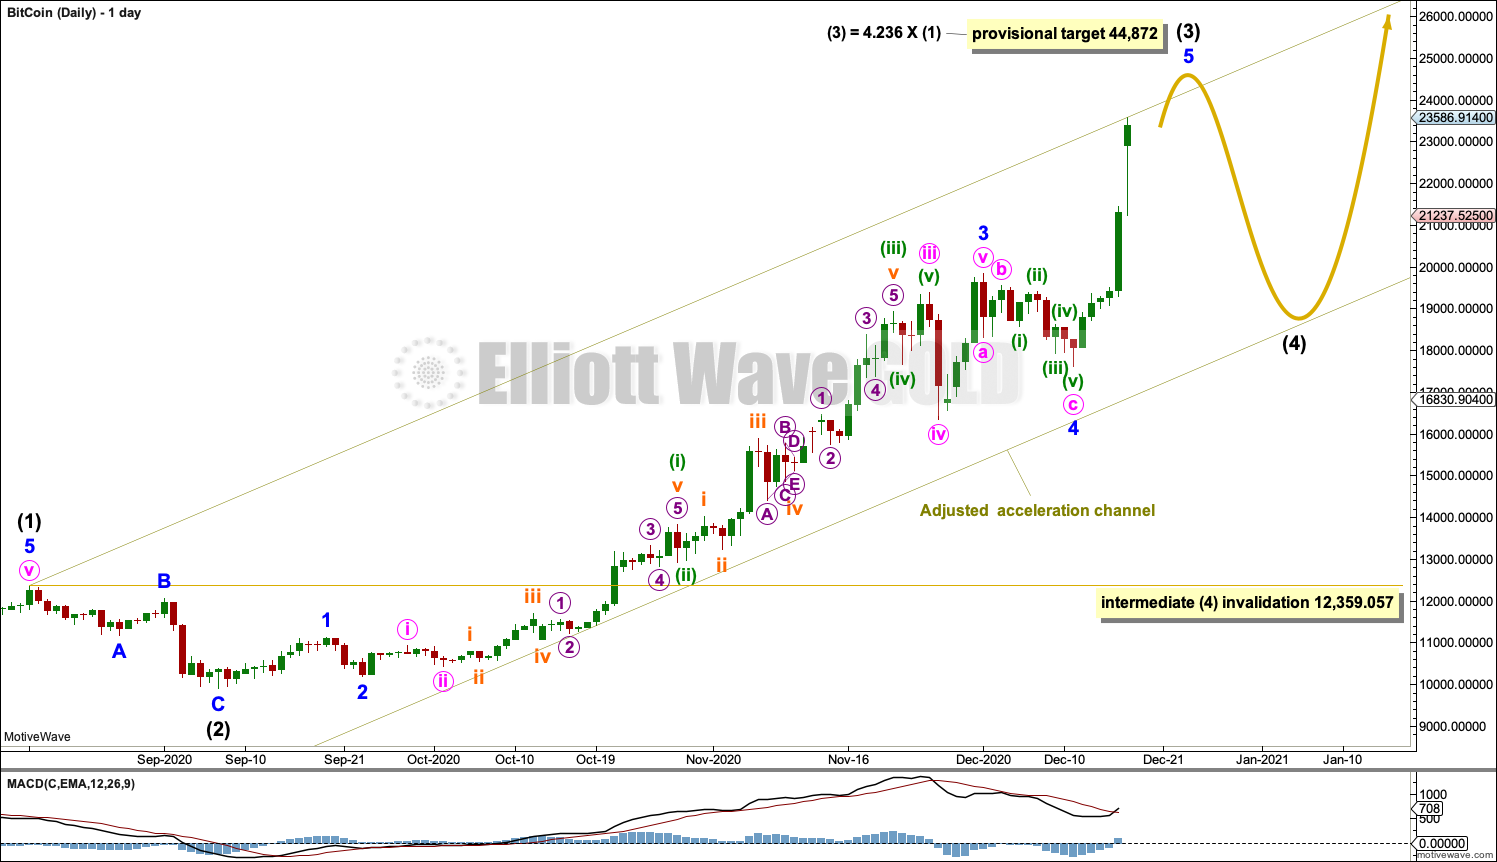
The main daily chart wave count focusses on the middle of primary wave 3.
Intermediate wave (3) may only subdivide as an impulse.
Bitcoin typically exhibits swift and strong fifth waves, particularly fifth waves to end third wave impulses one degree higher. This behaviour is typical for commodities, and of all the markets I analyse Bitcoin is the most extreme in this tendency. The strength in upwards movement of the last two days fits expectations for behaviour from this wave count; minor wave 5 to end intermediate wave (3) may be particularly strong.
A provisional target is calculated for intermediate wave (3) to end. If this target is wrong, then it may not be high enough. Target calculation for this particular market is more miss than hit; it is extremely difficult. Classic technical analysis will be relied upon heavily to identify when intermediate wave (3) may be over and intermediate wave (4) may have begun.
Intermediate wave (2) was a relatively shallow 0.30 depth to intermediate wave (1). Intermediate wave (2) at 21 days was only 13% the duration of intermediate wave (1). Intermediate wave (2) subdivided as a single zigzag.
Intermediate wave (4) may exhibit alternation as a sideways combination, flat or triangle. These types of corrections tend to be shallow. The price history of Bitcoin shows fourth waves have a wide variety in depth, from as shallow as 0.15 to as deep as 0.84. Intermediate wave (4) may more likely be shallow. Support lines should be used to identify where it may end.
Draw an acceleration channel to contain all upwards movement. Draw the first trend line from the end of intermediate wave (1) to the last high, then pull a parallel copy lower to contain all movement. The lower edge may provide support for intermediate wave (4) if it is deep. Keep redrawing the channel as price moves higher.
Intermediate wave (4) may not move into intermediate wave (1) price territory below 12,359.057.
WEEKLY – ALTERNATE
Click chart to enlarge.
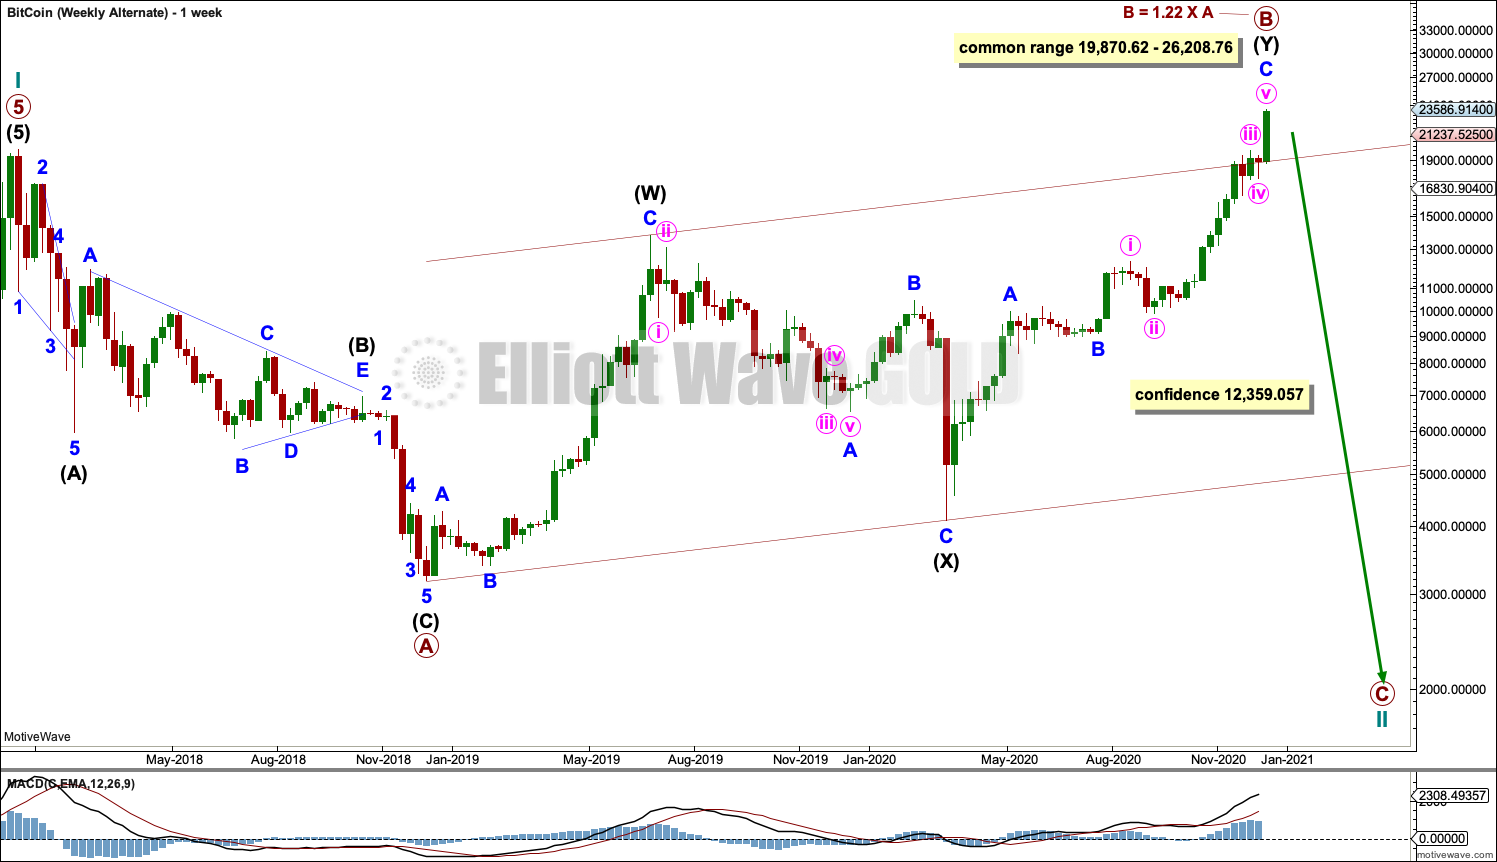
This wave count is published in the spirit of always considering multiple possibilities.
It is possible that cycle wave II may not be over and may continue further as an expanded flat.
B waves within expanded flats are a 1.05 length or longer than the corresponding A wave. In this case, primary wave B may now be a 1.22 length to primary wave A. Primary wave B may still continue higher and this wave count would remain valid; the expanded flat may remain within normal guidelines. The common range of B waves within flats is from 1 to 1.38 the length of their corresponding A wave (the price range is provided on the chart).
Primary wave C of an expanded flat would be extremely likely to move at least slightly below the end of primary wave A at 3,191.3035 to avoid a truncation and a very rare running flat.
Cycle wave II may not move beyond the start of cycle wave I below 0.01.
This alternate wave count does not have support from classic technical analysis, so it has a very low probability. It should only be seriously considered if price invalidates the main wave count and provides confidence in this alternate.
DAILY – ALTERNATE
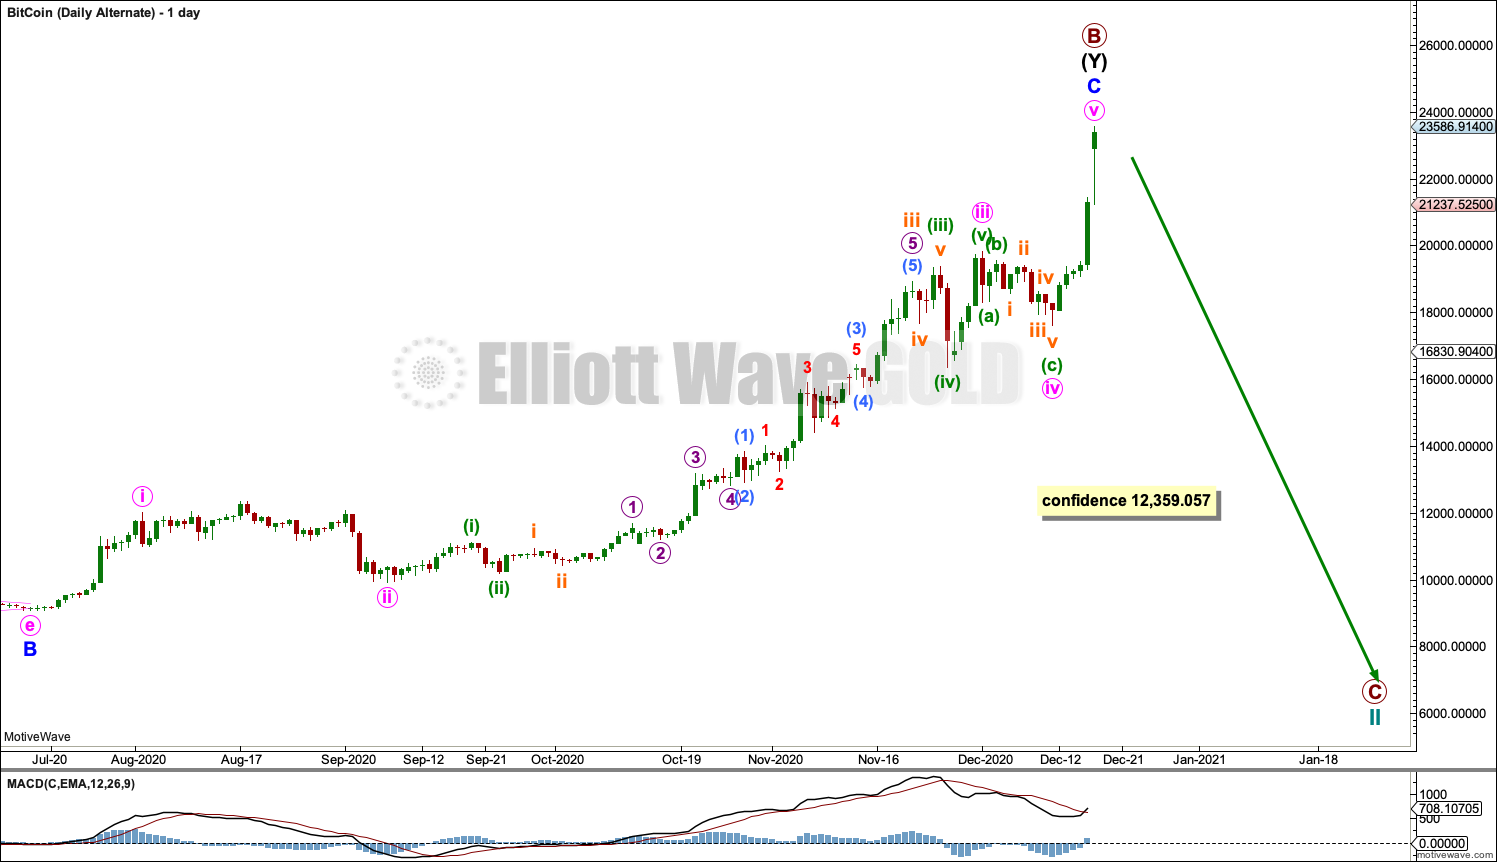
Click chart to enlarge.
The daily chart focusses on the possible zigzag of intermediate wave (Y) within the double zigzag of primary wave B. It is possible that intermediate wave (Y) may be complete, but it is also possible that it may yet extend higher. Classic technical analysis (provided below) should be used to identify a high in place.
TECHNICAL ANALYSIS
MONTHLY
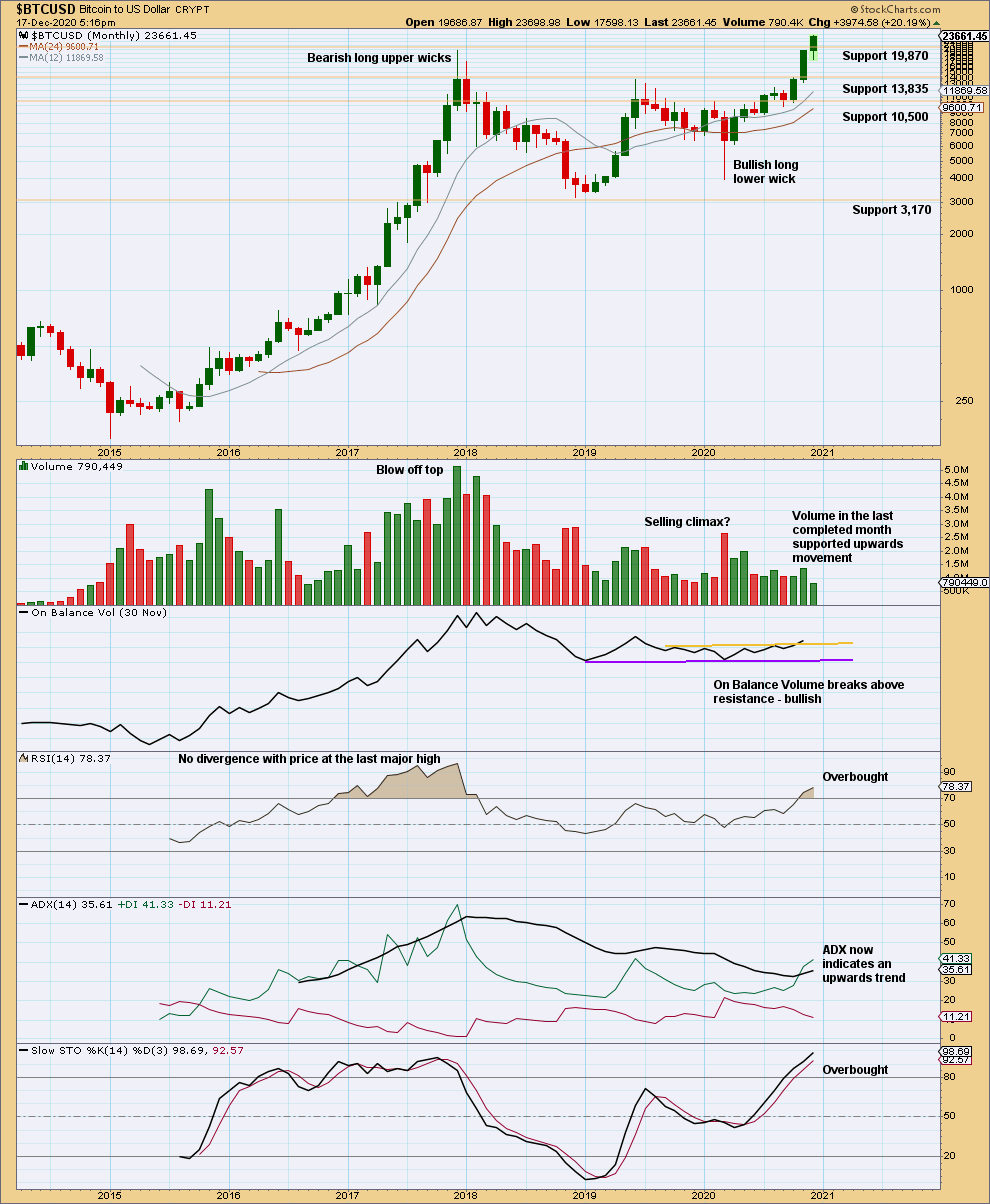
Click chart to enlarge.
Price has broken above final resistance at 19,870 with support from volume. ADX indicates an upwards trend that is not extreme.
When this market trends, then Stochastsics, RSI and ADX may all remain extreme for a few months at the monthly chart level while price moves a considerable distance. Highs are best identified at the daily and weekly chart level. This current trend may continue for a few more months and price may travel a considerable distance before a trend change.
WEEKLY
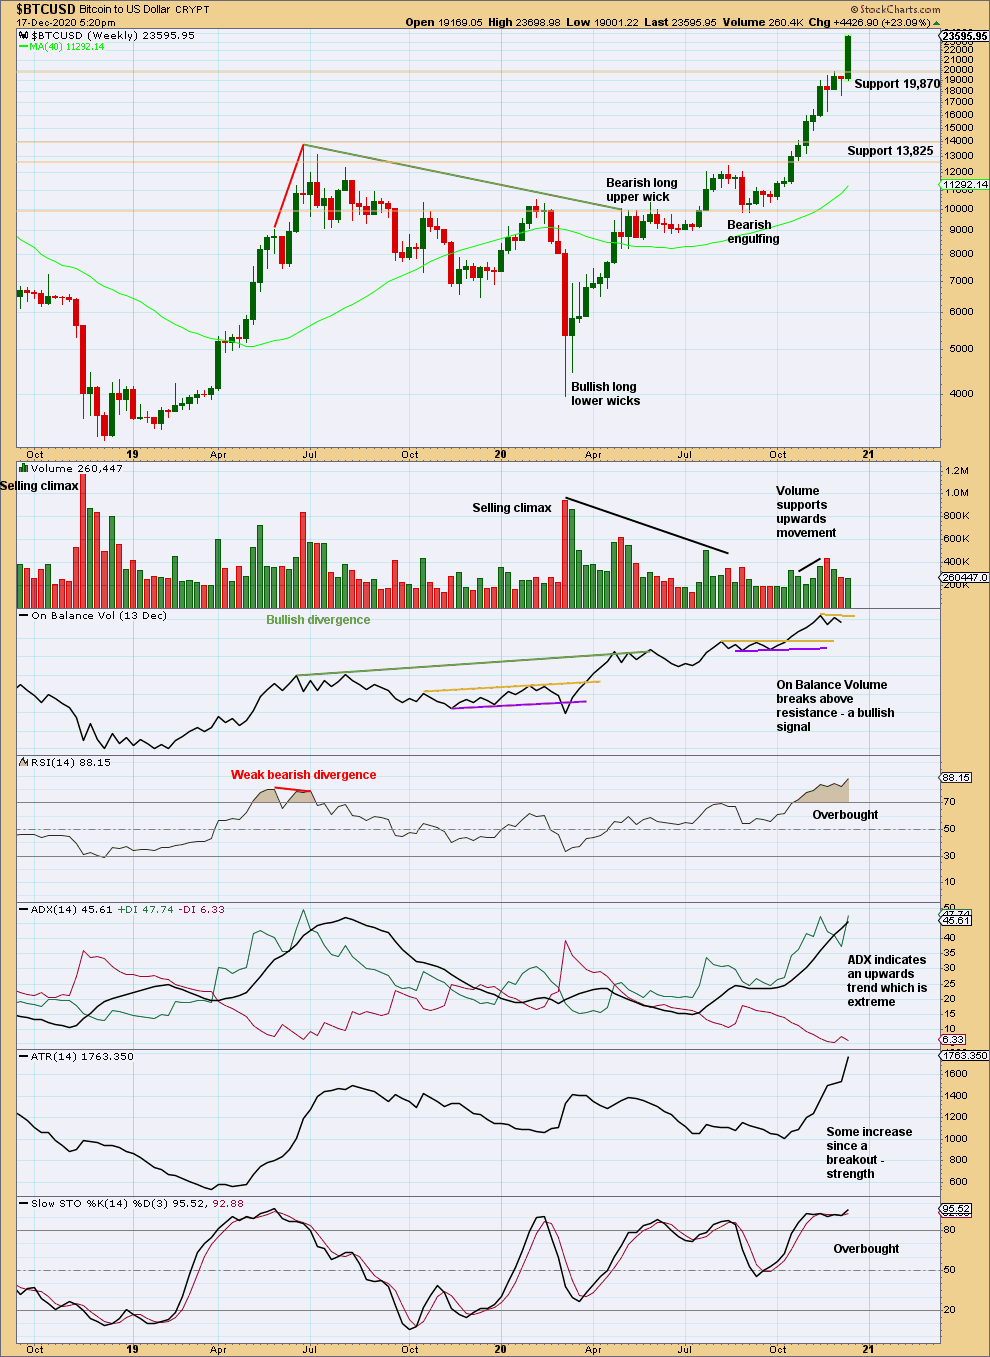
Click chart to enlarge.
The following characteristics can be noted at the end of prior major highs for Bitcoin:
The first sharp rise to the week beginning 5th June 2011: near vertical movement for several weeks, a sharp volume spike for a blow off top on the final week, and no candlestick reversal pattern on the weekly chart but an Evening Doji Star on the daily chart. The following correction was 0.94.
The next sharp rise to the week beginning 7th April 2013: near vertical movement for three weeks, a sharp volume spike on the final week that closed red and formed a Bearish Engulfing pattern on the weekly chart, a Bearish Engulfing pattern on the daily chart, ADX remained very extreme for most of the rise, and single week bearish divergence between price and RSI at the end. The following correction was 0.82.
The next sharp rise to the week beginning 24th November 2013: vertical movement for four weeks, a strong rise in volume until the last week (which saw volume fall), a Bearish Engulfing pattern on the weekly chart, an Evening Doji Star on the daily chart (the third candlestick of which had strong support from volume), ADX reached very extreme for many days, and RSI reached extreme overbought and there exhibited single bearish divergence. The following correction was 0.93.
The next sharp rise to the all time high at 19,870.62 on the 17th of December 2018: vertical movement for three weeks, a strong increase in volume up to the last week (which saw a fall in volume), a Bearish Engulfing pattern on the weekly chart that had support from volume; on the daily chart, ADX reached very extreme for a coupe of weeks or so, RSI reached overbought and there exhibited single bearish divergence, and early downwards movement from the high had support from volume. The following correction was 0.84.
In the last sharp rise to the week beginning June 24, 2019: Vertical movement for three weeks with the third weekly candlestick closing as a red doji and exhibiting a strong increase in volume; on the weekly chart ADX reached extreme, and RSI reached extreme and exhibited single bearish divergence; there was no candlestick reversal pattern on the weekly chart, but there was a large Bearish Engulfing pattern with support from volume on the daily chart; and, on the daily chart ADX was not extreme at the high, RSI was deeply overbought and exhibited no divergence, and there was a strong volume spike at the high.
Some conclusions may be drawn about how to identify a major high in Bitcoin:
– Look for vertical movement on the weekly chart for at least two weeks, and possibly up to several (although when it is more than three the movement may be interspaced with a small pause).
– Look for either a sharp volume spike for a blow off top, or a strong increase in volume then followed by a single week of lighter volume at the possible high.
– A bearish candlestick reversal pattern has been seen so far at every major high for Bitcoin, so an absence of any candlestick reversal pattern at a potential high should be viewed very suspiciously.
– ADX is of no use as it may remain very extreme for long periods of time.
– RSI may also remain very extreme for long periods of time and may not exhibit any divergence, but it may add a little confidence in the high if it does exhibit bearish divergence in conjunction with other indicators being bearish.
Currently, RSI is overbought but exhibits no divergence with price. There is a strong upwards trend but so far with only one week of near vertical movement. The next few weeks should be watched closely for signs of another interim high.
DAILY
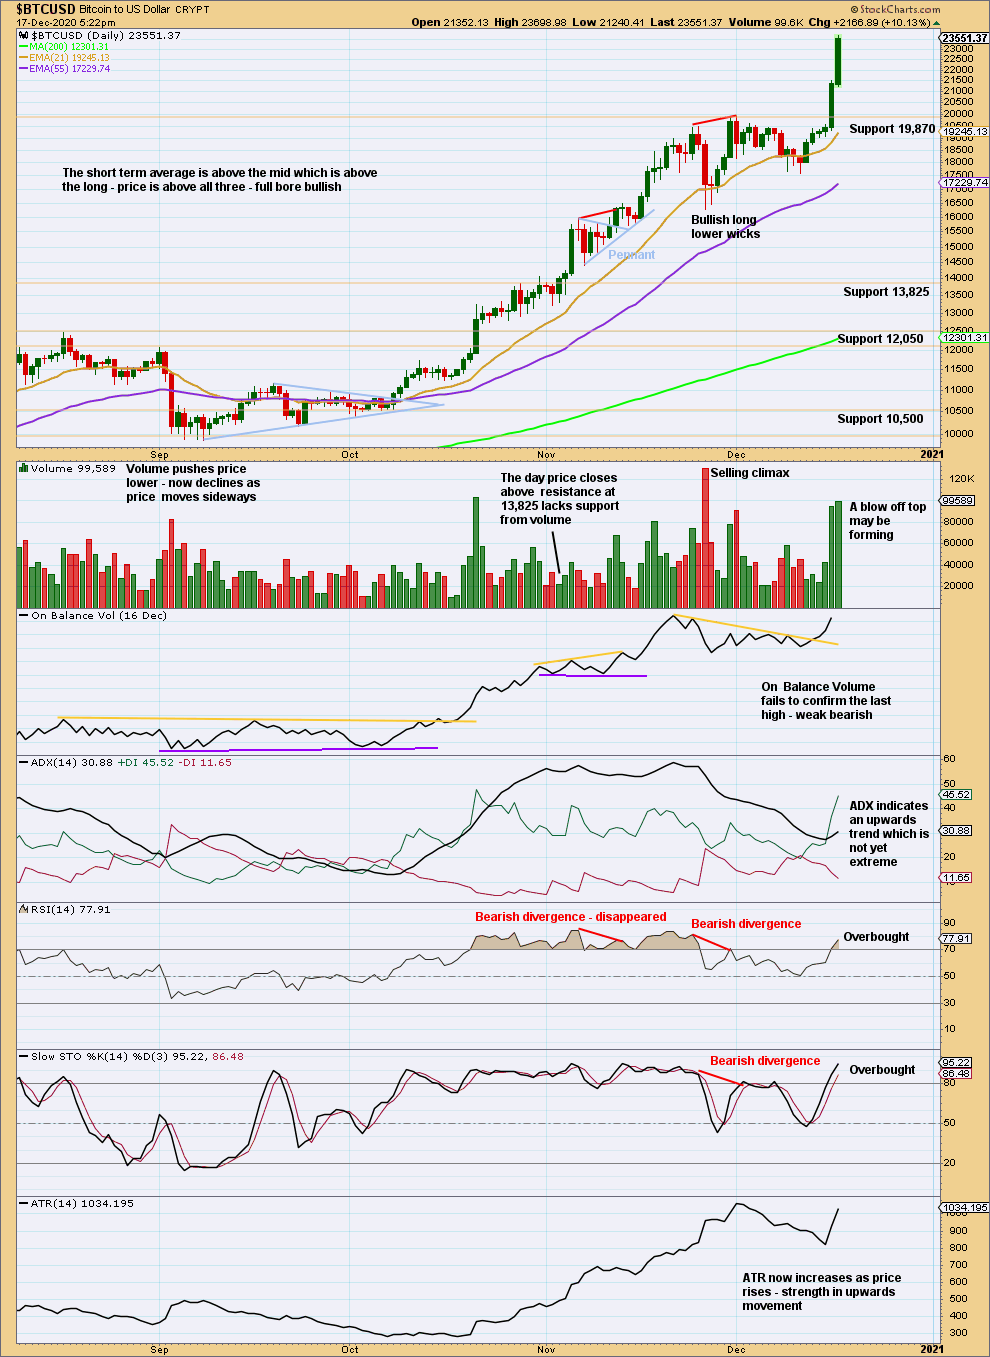
Click chart to enlarge.
The following can be noted when looking back at Bitcoin’s behaviour at major lows:
The 94% fall in price from June to November 2011 was characterised by:
– Three clearly separate instances of RSI reaching oversold on the daily chart, separated by bounces.
– ADX did not remain very extreme for very long at all on the daily chart.
– On Balance Volume exhibited weak single bullish divergence at the low.
The 93% fall in price from November 2013 to February 2014 was characterised by:
– RSI reached oversold and remained deeply oversold for three weeks; at the low, there was only single weak bullish divergence with price.
– ADX remained very extreme for the last seven sessions to the low.
– At the low, On Balance Volume did not exhibit bullish divergence with price. It remained bearish and then exhibited further bearishness after the low as it continued to decline as price began to rise.
The 84% fall in price from December 2017 to December 2018 was characterised by:
– RSI reached deeply oversold and then exhibited double divergence with price.
– ADX reached very extreme 20 sessions prior to the low.
– At the low, On Balance Volume exhibits no bullish divergence with price; it turned with price.
The 92% fall in price from June 2019 to March 2020 was characterised by:
– There was no Bullish candlestick reversal pattern.
– An instance of single day bullish divergence between price and On Balance Volume.
– An instance of single day bullish divergence between price and RSI after RSI reached reasonably oversold.
– ADX had not reached extreme.
Currently, Bitcoin is in a strong upwards trend. It may be forming another blow off top. This may then be relieved by either a small pause with a little sideways movement, or it may see a 180° reversal and another deep pullback. If the daily and weekly charts both exhibit signs of a reversal, then a deeper pullback may be expected. Strong support at 19,870 may be expected now.
Published @ 03:49 p.m. EST.
—
Careful risk management protects your trading account(s).
Follow my two Golden Rules:
1. Always trade with stops.
2. Risk only 1-5% of equity on any one trade.
—
New updates to this analysis are in bold.