
BTCUSD: Elliott Wave and Technical Analysis | Charts – January 18, 2021
The main Elliott wave count in last analysis, on December 17, 2020, expected more upwards movement to a provisional target at 44,872. Bitcoin reached 41,964.96 on January 8, 2021, which was 2,907 short of the target.
Summary: A short-term pullback may end about 29,711 to 28,269. Thereafter, a strong upwards trend may resume. If this expectation is wrong, then the pullback may have already been over on January 11, 2021.
Final support for any deeper pullbacks may be at 19,870.
The data used for this analysis comes from Yahoo Finance BTC-USD.
Monthly and weekly charts are on a semi-log scale. The close up daily chart is on an arithmetic scale.
For notes on identifying highs and lows for Bitcoin, see this article here.
MAIN ELLIOTT WAVE COUNT
MONTHLY
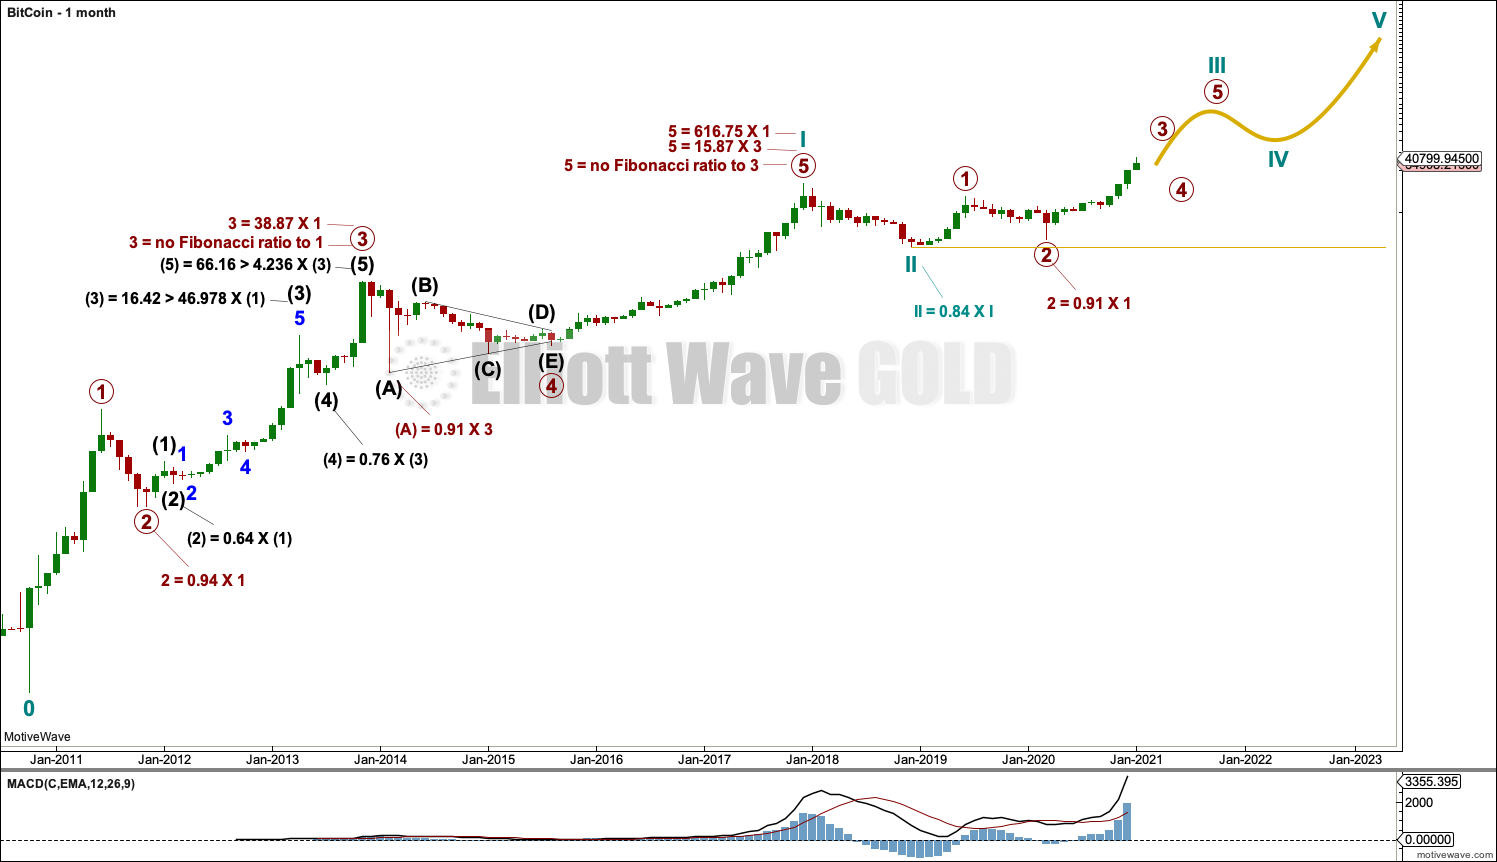
Click chart to enlarge.
It is possible to see a completed five wave impulse upwards for Bitcoin to the high in December 2017. This has been followed by a deep three wave structure downwards to the low in December 2018.
I am unable to find many reasonable Fibonacci ratios within this wave count. It appears that Bitcoin may not exhibit Fibonacci ratios very often between its actionary waves, so this makes target calculation impossible. Classic technical analysis was used to identify a high in place on December 23, 2017.
What is very clear from this chart is that Bitcoin forms classic bubbles. It has done so now several times and is now doing so again. So far each bubble has popped and Bitcoin has collapsed, to then thereafter form a new bubble. Each bubble is larger than the one prior; so if another Bitcoin bubble is forming, it may be expected to take price substantially above the all time high.
Bitcoin tends to behave like an extreme commodity: price moves upwards for about 2 – 4 weeks in a near vertical movement at the end of its rises. Following this vertical movement the resulting downwards movement is very deep (in percentage terms) and often very quick.
The next rise begins slowly with basing action over weeks or months, and then as the rise nears its end another vertical movement completes it. Also, there are volume spikes just before or at the end, which is another feature typical of commodity like behaviour.
This has happened now several times. The most notable instances are the rise up to the week ending 24th November, 2013, and the week ending 5th June, 2011. The following sharp drops were 94% and 93% respectively.
The last instance was the rise up to the last all time high for Bitcoin at 19,870.62 on the 17th of December 2017. The drop thereafter may now be considered as highly likely to be complete. If the drop is complete, it was an 84% drop (labelled cycle wave II).
WEEKLY
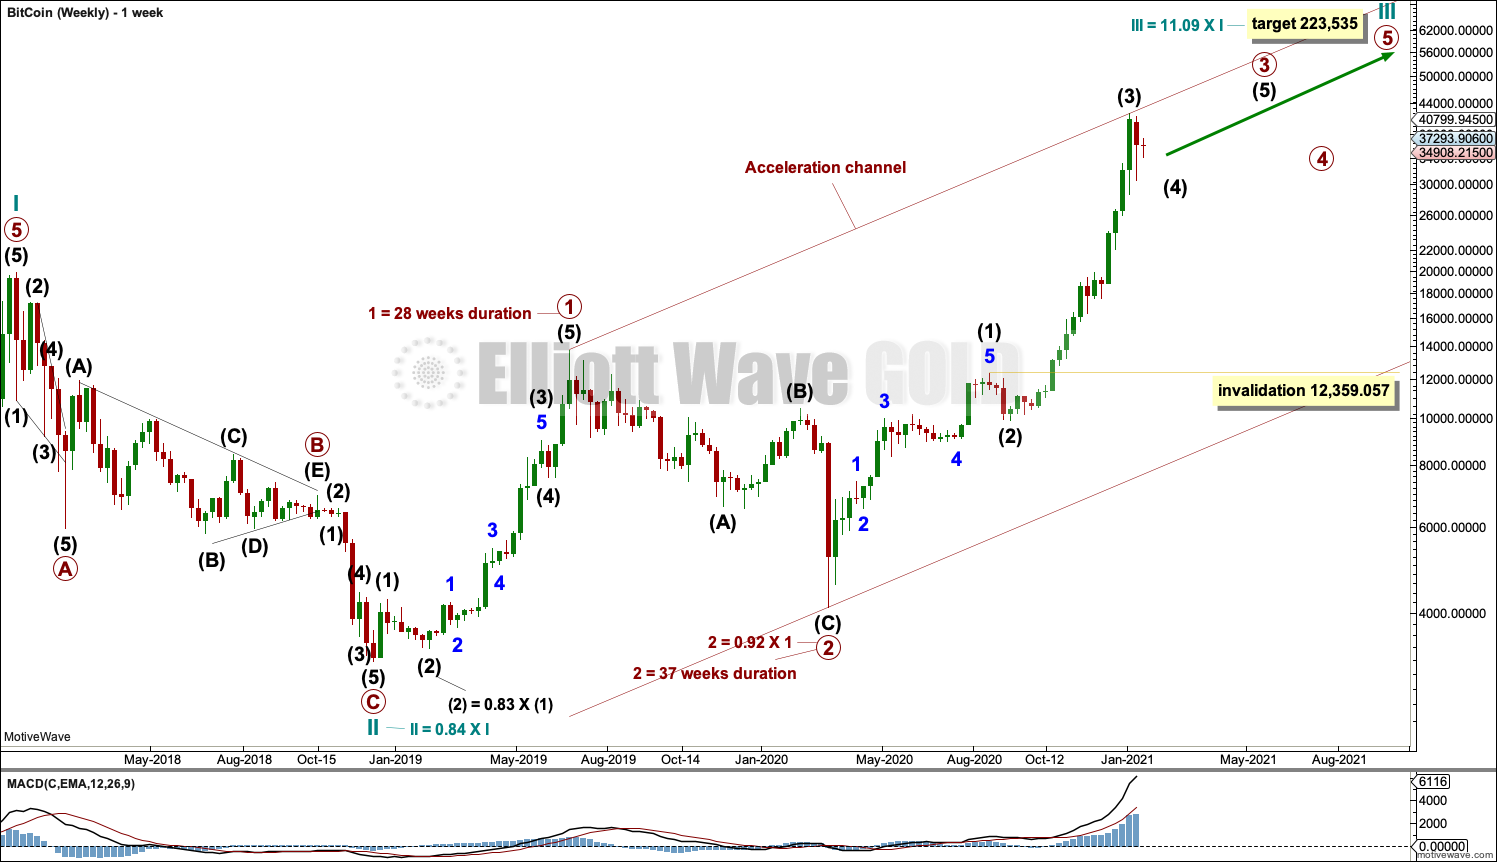
Click chart to enlarge.
Cycle wave II may be a complete zigzag.
Cycle wave III has now moved above the end of cycle wave I at 19,870.62. It must move far enough above this point to allow room for cycle wave IV to unfold and remain above cycle wave I price territory.
Cycle wave I lasted 7.2 years and cycle wave II may have been over within just under one year. It would be reasonable to expect cycle wave III to last about 7 years, or possibly a Fibonacci 8 or 13 years. At this stage, it may be now within its 25th month.
Cycle wave III must unfold as a simple five wave impulse, and within this impulse there should be two large corrections for primary waves 2 and 4. Primary wave 2 is complete. Primary wave 3 is underway.
The provisional target for intermediate wave (3) to end was 44,872 where intermediate wave (3) would reach 4.236 the length of intermediate wave (1). If intermediate wave (3) is over at the last high as labelled, then it would be 2,925.54 short of 4.236 the length of intermediate wave (1).
Primary wave 3 would very likely be much longer than 4.236 times the length of primary wave 1. Primary wave 3 would very likely end with a blow off top after a vertical rise of 2 to 4 weeks. Primary wave 3 must move far enough above primary wave 1 to allow room for primary wave 4 to unfold and remain above primary wave 1 price territory.
Primary wave 3 may only subdivide as an impulse. Within primary wave 3: Intermediate waves (1) through to (3) may now be complete, and intermediate wave (4) may be underway.
DAILY

Click chart to enlarge.
Intermediate wave (3) may be a complete impulse.
Bitcoin typically exhibits swift and strong fifth waves, particularly fifth waves to end third wave impulses one degree higher. This behaviour is typical for commodities, and of all the markets I analyse Bitcoin is the most extreme in this tendency. Minute wave v to end minor wave 5 to end intermediate wave (3) follows this tendency and has a typical look for Bitcoin.
Intermediate wave (2) was a relatively shallow 0.30 depth to intermediate wave (1). Intermediate wave (2) at 21 days was only 13% the duration of intermediate wave (1). Intermediate wave (2) subdivided as a single zigzag.
Intermediate wave (4) may exhibit alternation as a sideways combination, flat or triangle. These types of corrections tend to be shallow. The price history of Bitcoin shows fourth waves have a wide variety in depth, from as shallow as 0.15 to as deep as 0.84. Intermediate wave (4) may more likely be shallow. A target is calculated for intermediate wave (4).
If this analysis is wrong in the short term, then it would be in expecting intermediate wave (4) to continue a little lower and last a little longer. It is possible that intermediate wave (4) was over at the low of the 11th of January, although it would be rather brief.
Draw a best fit channel to contain all of intermediate waves (2) and (3). Draw the first trend line from the end of intermediate wave (1) to the end of intermediate wave (3), then pull a parallel copy lower to contain all movement. The lower edge may provide support for intermediate wave (4) if it is deep.
Intermediate wave (4) may not move into intermediate wave (1) price territory below 12,359.057.
WEEKLY – ALTERNATE
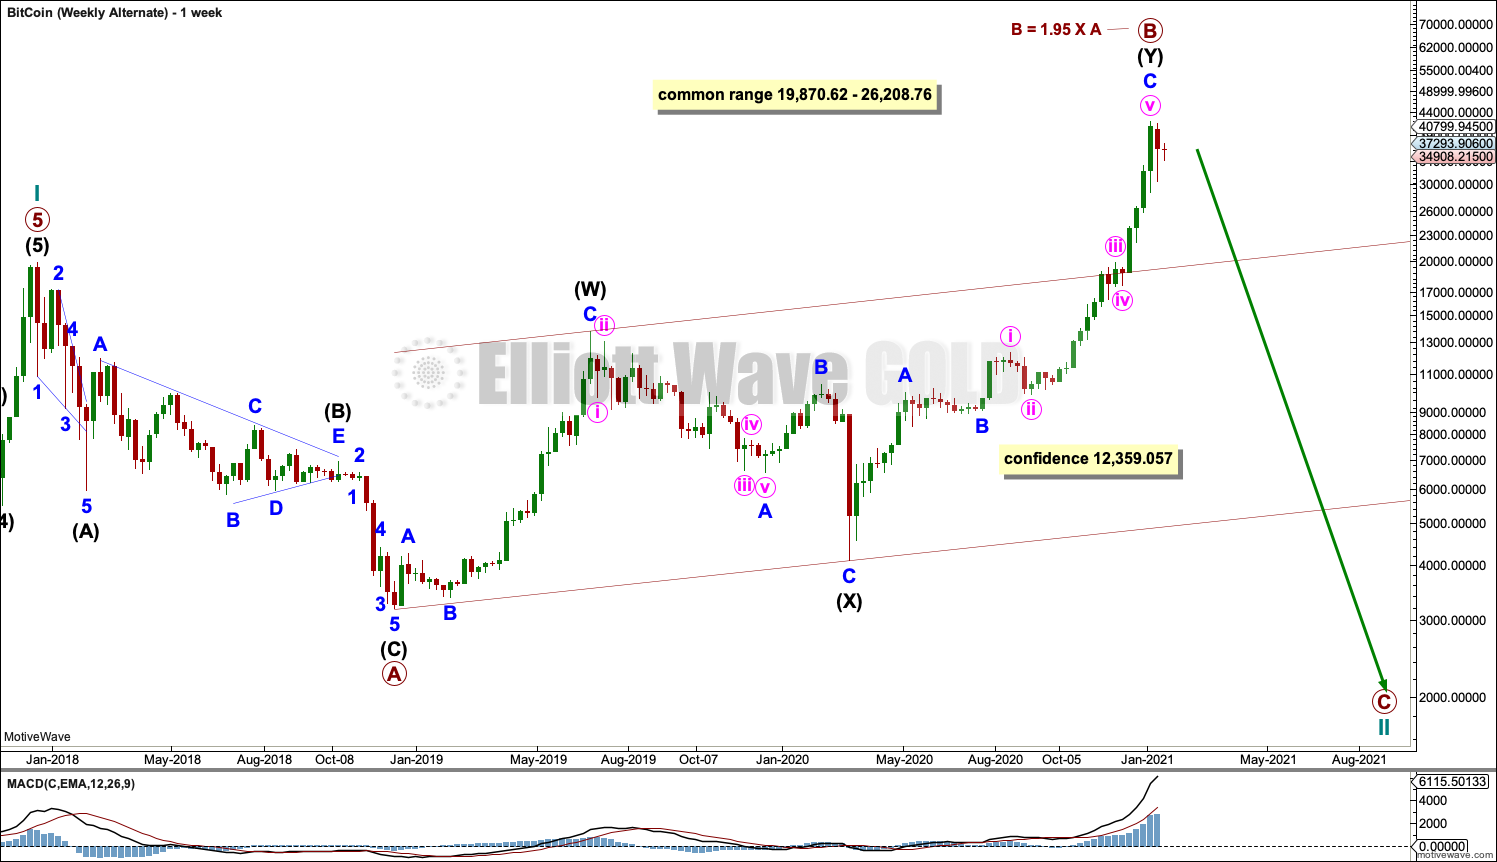
Click chart to enlarge.
This wave count is published for the last time in this analysis. The probability is now too low for it to be considered.
B waves within expanded flats are a 1.05 length or longer than the corresponding A wave. In this case, primary wave B may now be a 1.95 length to primary wave A. The common range of B waves within flats is from 1 to 1.38 the length of their corresponding A wave. While there is no rule stating a limit for B waves within flats, there is a guideline which allows for B waves up to 2 times the length of A waves. Beyond this point the wave count should be discarded based upon an exceptionally low probability.
This alternate wave count does not have support from classic technical analysis, so it has a very low probability. For this reason, in conjunction with the length of primary wave B in relation to primary wave A, this wave count will no longer be published.
TECHNICAL ANALYSIS
MONTHLY
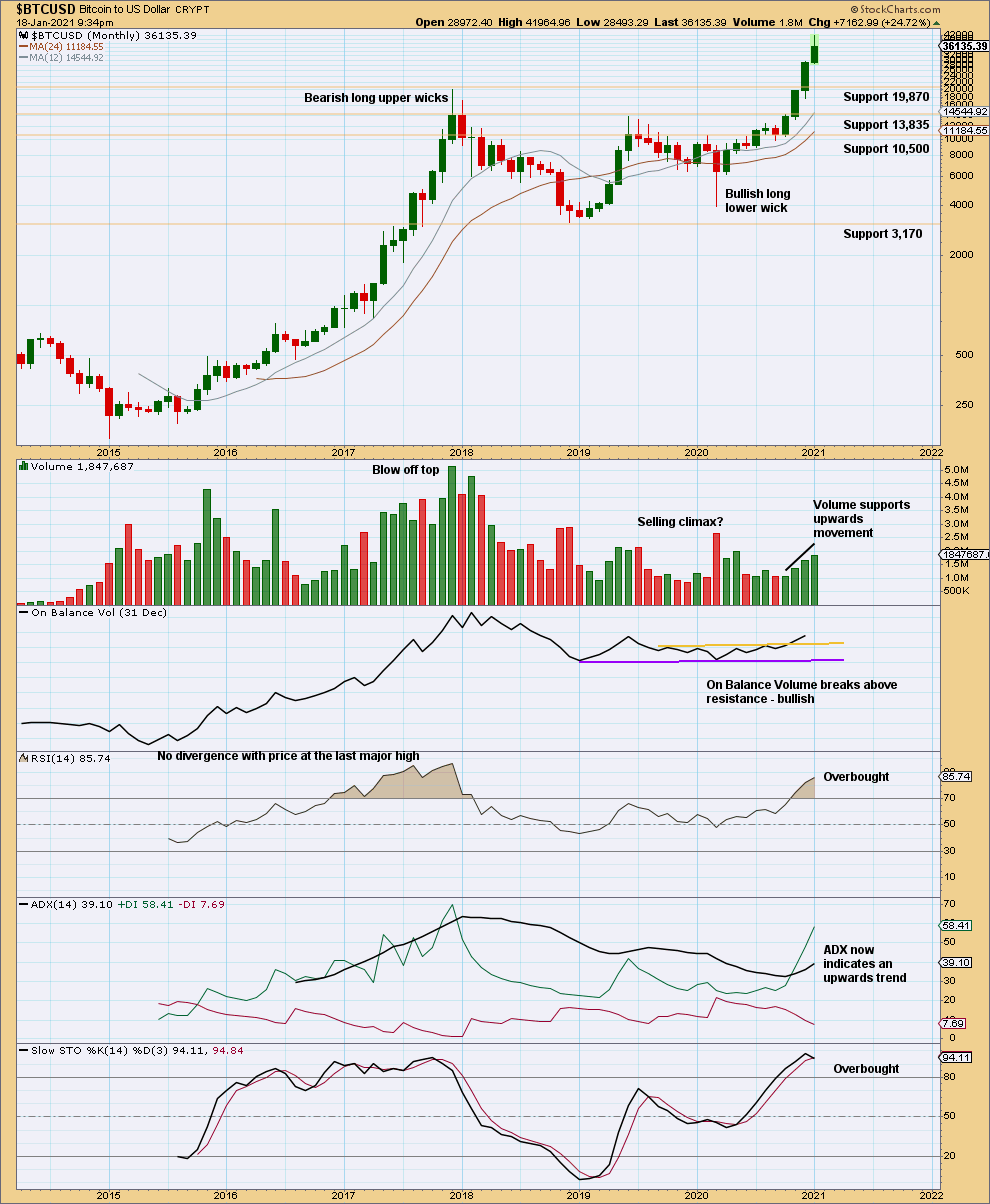
Click chart to enlarge.
Price has broken above resistance at 19,870 with support from volume. ADX indicates an upwards trend that is not extreme.
When this market trends, then Stochastsics, RSI and ADX may all remain extreme for a few months at the monthly chart level while price moves a considerable distance. Highs are best identified at the daily and weekly chart level. This current trend may continue for a few more months and price may travel a considerable distance before a trend change.
WEEKLY
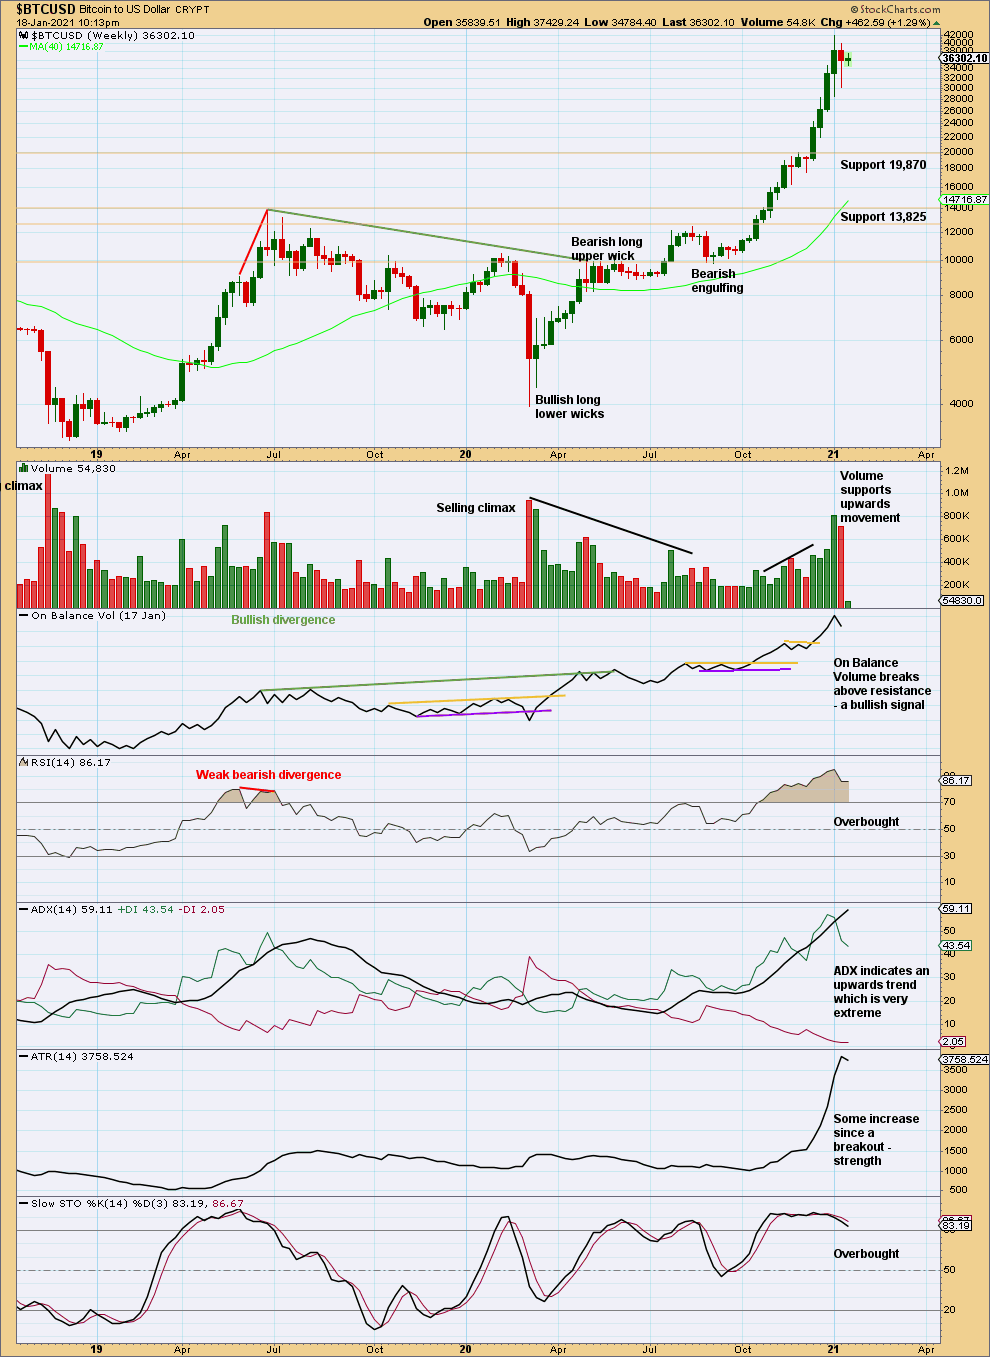
Click chart to enlarge.
Bitcoin has just seen a vertical rise lasting four weeks up to the last high. There is no bearish candlestick pattern on the weekly chart. ADX and RSI remain very extreme, but this can persist for a while longer.
DAILY
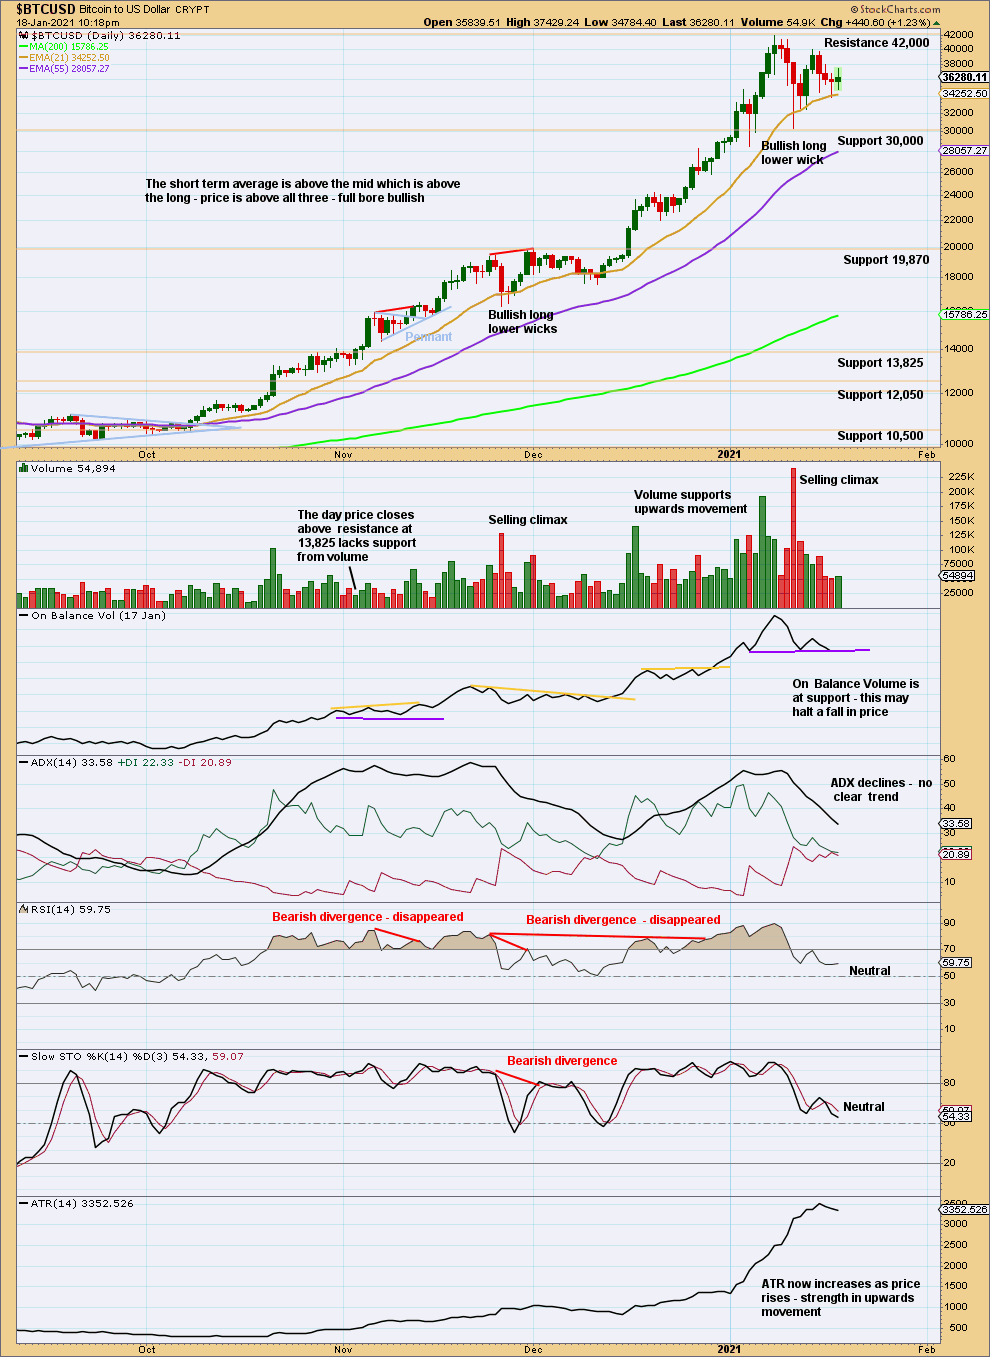
Click chart to enlarge.
After the vertical rise of four weeks, a pause may continue with a consolidation or pullback. Support is identified on the chart. Support at 19,870 may be expected to be particularly strong if price gets that low.
It is noted that the last two times RSI reached overbought and there exhibited bearish divergence with price, that this was not followed by any significant consolidation or pullback and divergence simply disappeared as price continued higher. RSI is not currently proving useful in identifying highs in this market.
Look for a breakout of the consolidation zone with support about 30,000 and resistance about 42,000.
Published @ 07:58 p.m. EST.
—
Careful risk management protects your trading account(s).
Follow my two Golden Rules:
1. Always trade with stops.
2. Risk only 1-5% of equity on any one trade.
—
New updates to this analysis are in bold.