
BTCUSD: Elliott Wave and Technical Analysis | Charts – January 29, 2021
Last Bitcoin analysis, on 18th January, expected a pullback to continue and end within a target zone from 29,711 to 28,269. The pullback did continue and reached 28,953.37, right in the target zone.
Summary: More upwards movement is now expected to complete a third wave at primary degree.
Final support for any deeper pullbacks may be at 19,870.
The data used for this analysis comes from Yahoo Finance BTC-USD.
Monthly and weekly charts are on a semi-log scale. The close up daily chart is on an arithmetic scale.
For notes on identifying highs and lows for Bitcoin, see this article here.
MAIN ELLIOTT WAVE COUNT
MONTHLY
Click chart to enlarge.
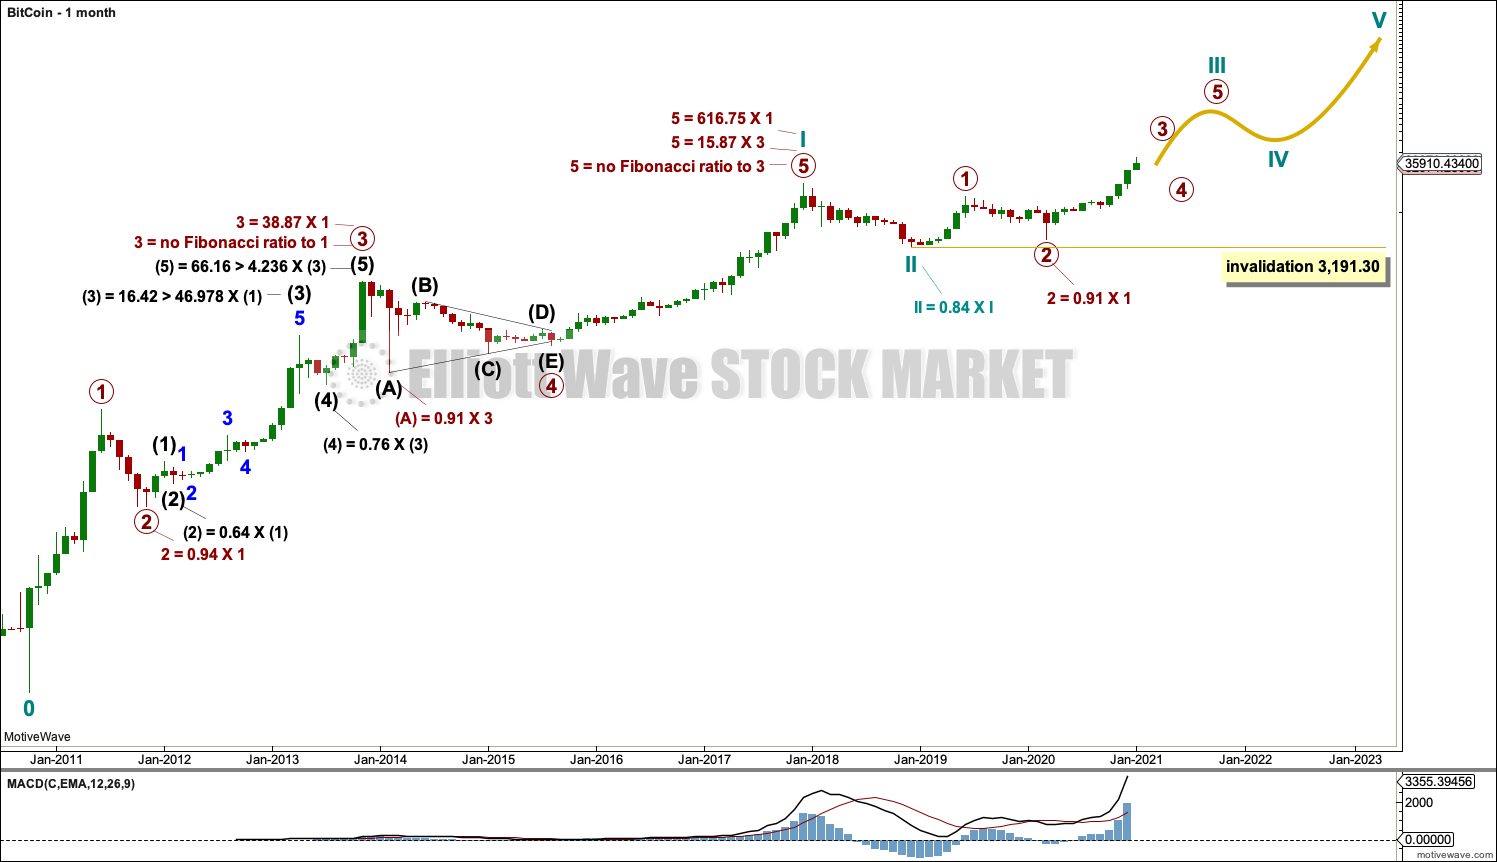
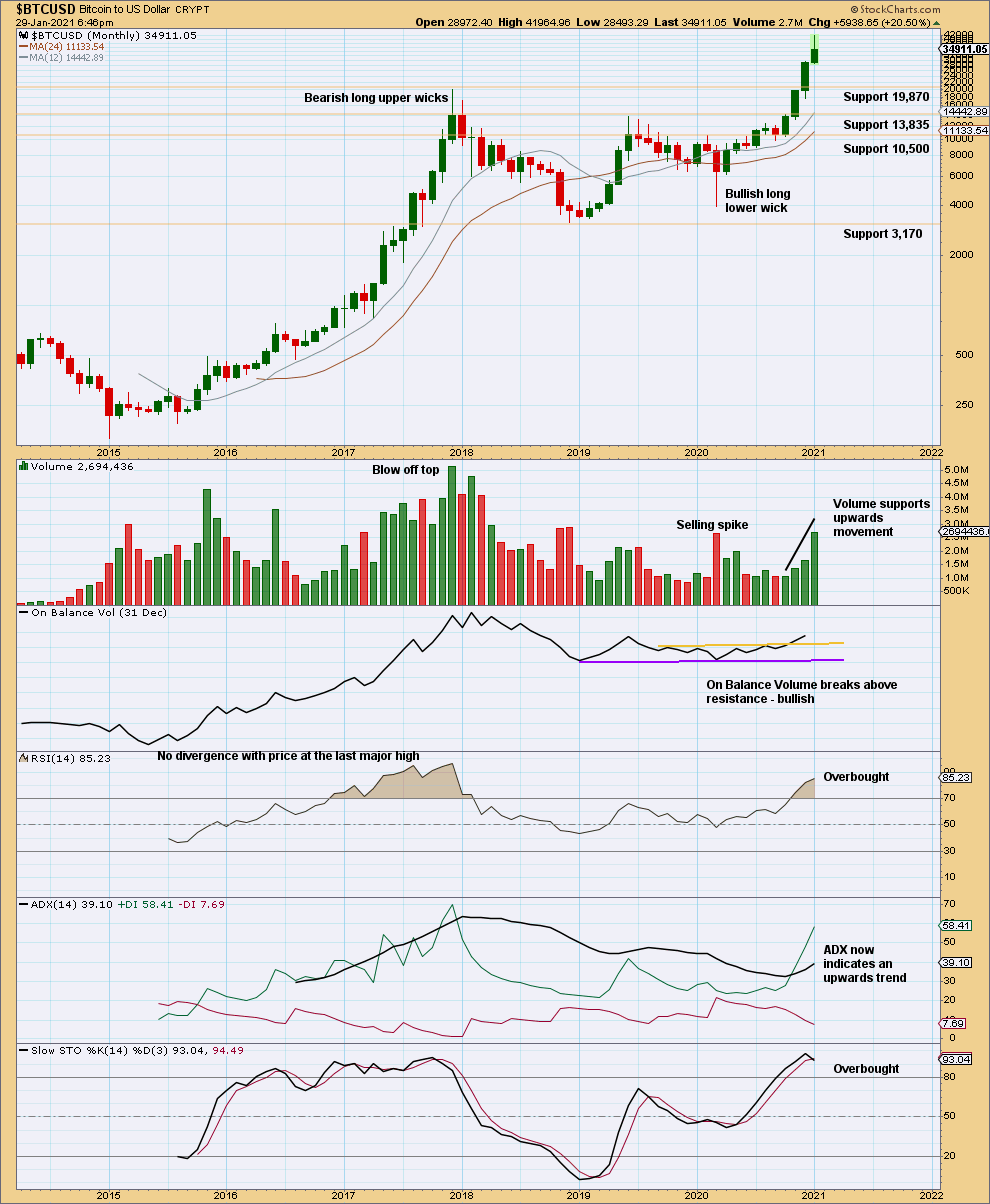
It is possible to see a completed five wave impulse upwards for Bitcoin to the high in December 2017. This has been followed by a deep three wave structure downwards to the low in December 2018.
I am unable to find many reasonable Fibonacci ratios within this wave count. It appears that Bitcoin may not exhibit Fibonacci ratios very often between its actionary waves, so this makes target calculation impossible. Classic technical analysis was used to identify a high in place on December 23, 2017.
What is very clear from this chart is that Bitcoin forms classic bubbles. It has done so now several times and is now doing so again. So far each bubble has popped and Bitcoin has collapsed, to then thereafter form a new bubble. Each bubble is larger than the one prior; so if another Bitcoin bubble is forming, it may be expected to take price substantially above the all time high.
Bitcoin tends to behave like an extreme commodity: price moves upwards for about 2 – 4 weeks in a near vertical movement at the end of its rises. Following this vertical movement the resulting downwards movement is very deep (in percentage terms) and often very quick.
The next rise begins slowly with basing action over weeks or months, and then as the rise nears its end another vertical movement completes it. Also, there are volume spikes just before or at the end, which is another feature typical of commodity like behaviour.
This has happened now several times. The most notable instances are the rise up to the week ending 24th November, 2013, and the week ending 5th June, 2011. The following sharp drops were 94% and 93% respectively.
The last instance was the rise up to the last all time high for Bitcoin at 19,870.62 on the 17th of December 2017. The drop thereafter may now be considered as highly likely to be complete. If the drop is complete, it was an 84% drop (labelled cycle wave II).
WEEKLY
Click chart to enlarge.
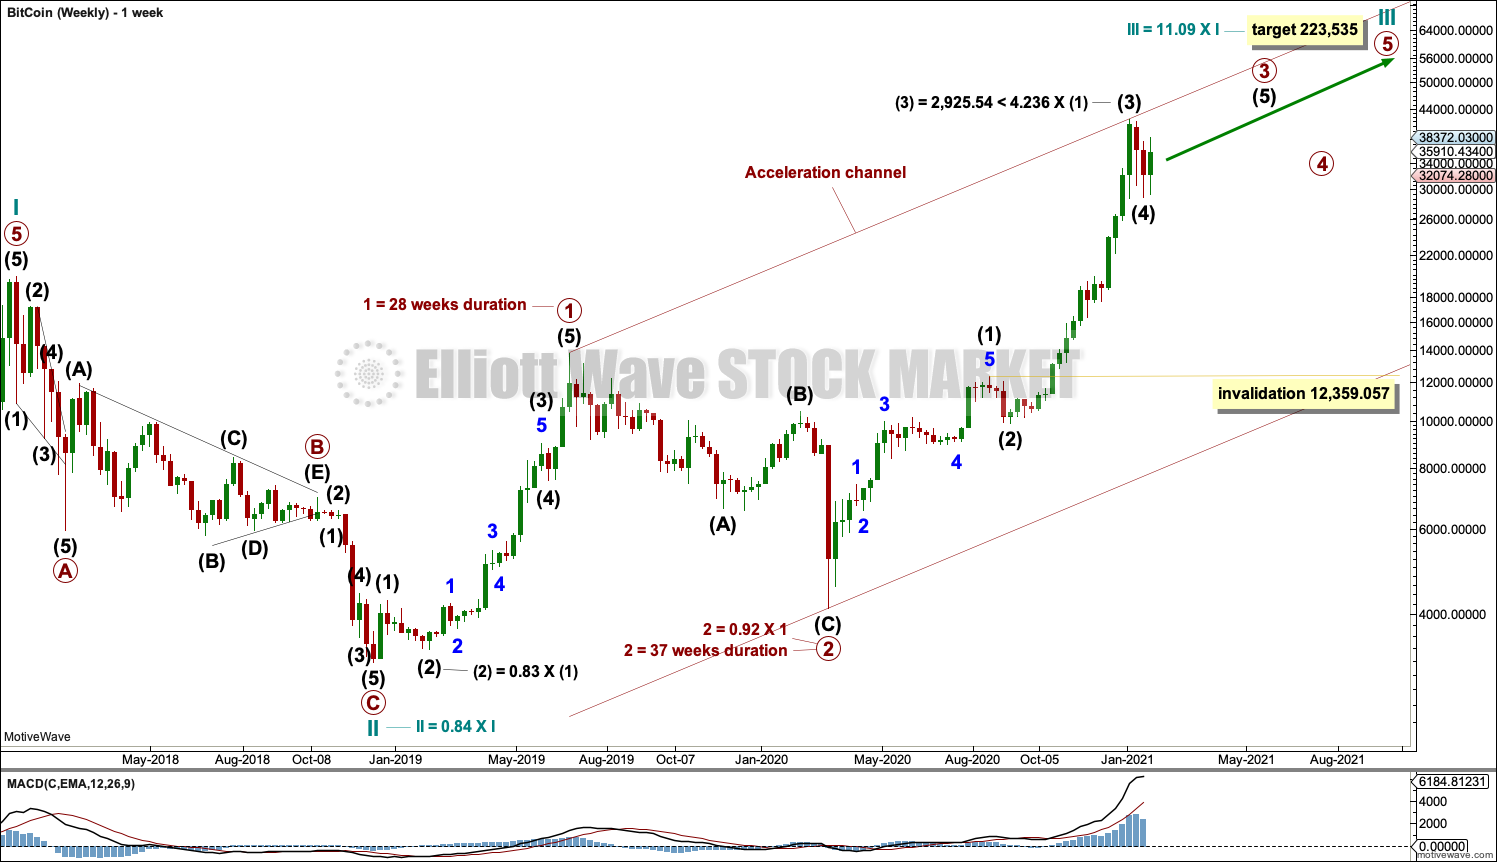
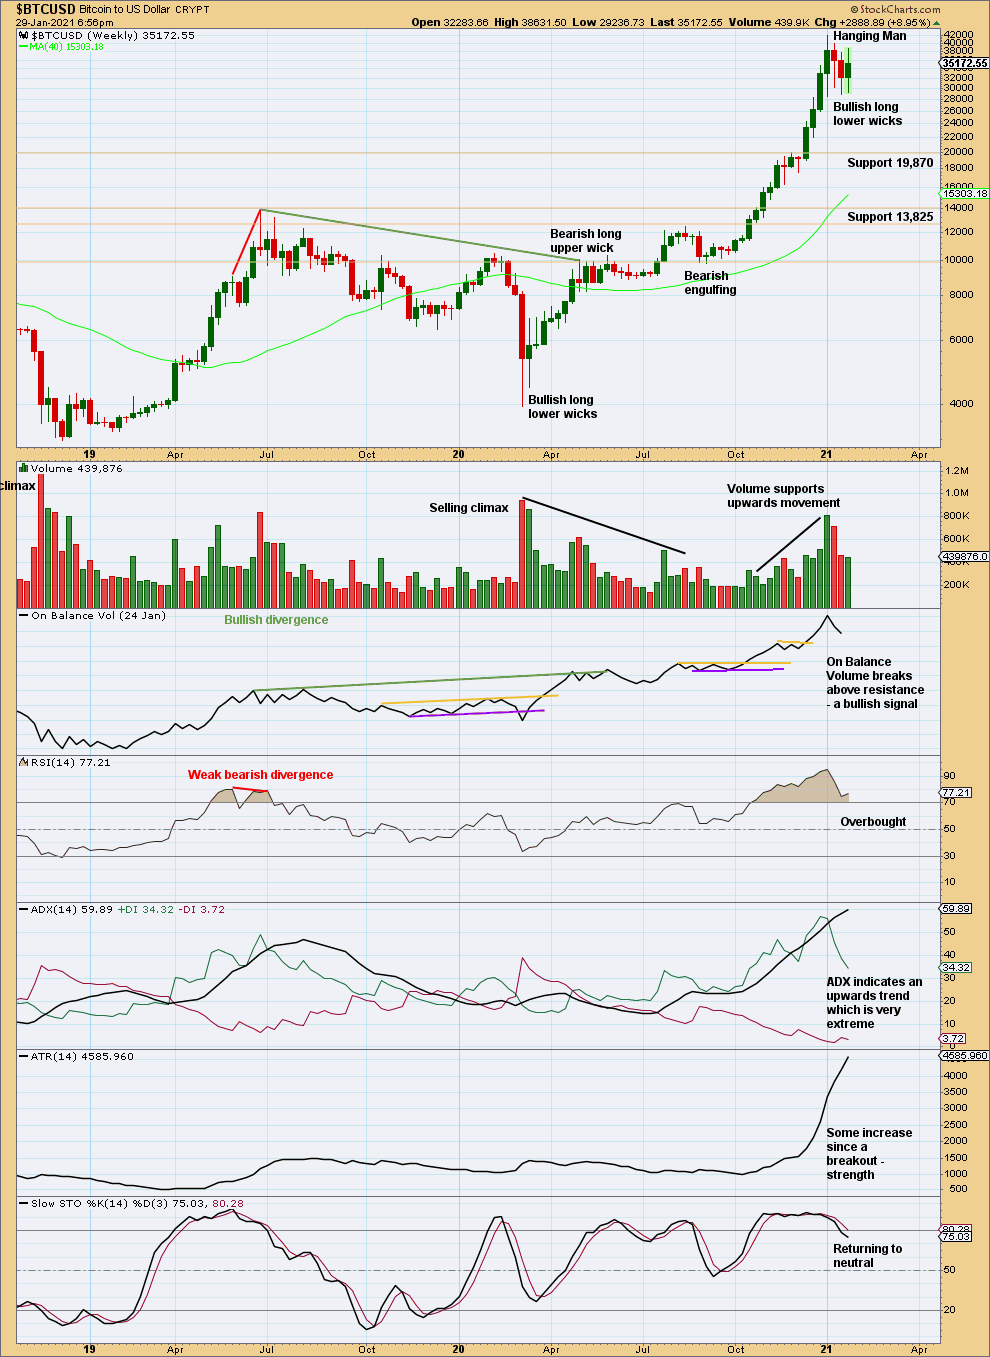
Cycle wave II may be a complete zigzag.
Cycle wave III has now moved above the end of cycle wave I at 19,870.62. It must move far enough above this point to allow room for cycle wave IV to unfold and remain above cycle wave I price territory.
Cycle wave I lasted 7.2 years and cycle wave II may have been over within just under one year. It would be reasonable to expect cycle wave III to last about 7 years, or possibly a Fibonacci 8 or 13 years. At this stage, it may be now within its 25th month.
Cycle wave III must unfold as a simple five wave impulse, and within this impulse there should be two large corrections for primary waves 2 and 4. Primary wave 2 is complete. Primary wave 3 is underway.
Primary wave 3 would very likely end with a blow off top after a vertical rise of 2 to 4 weeks. Primary wave 3 must move far enough above primary wave 1 to allow room for primary wave 4 to unfold and remain above primary wave 1 price territory.
Primary wave 3 may only subdivide as an impulse. Intermediate waves (1) through to (4) within primary wave 3 may now be complete.
Bitcoin behaves like an extreme commodity. It exhibits very strong and swift fifth waves, particularly fifth waves to end third wave impulses one degree higher. Intermediate wave (5) to end primary wave 3 may exhibit a strong increase in upwards momentum and have good support from volume.
DAILY
Click chart to enlarge.
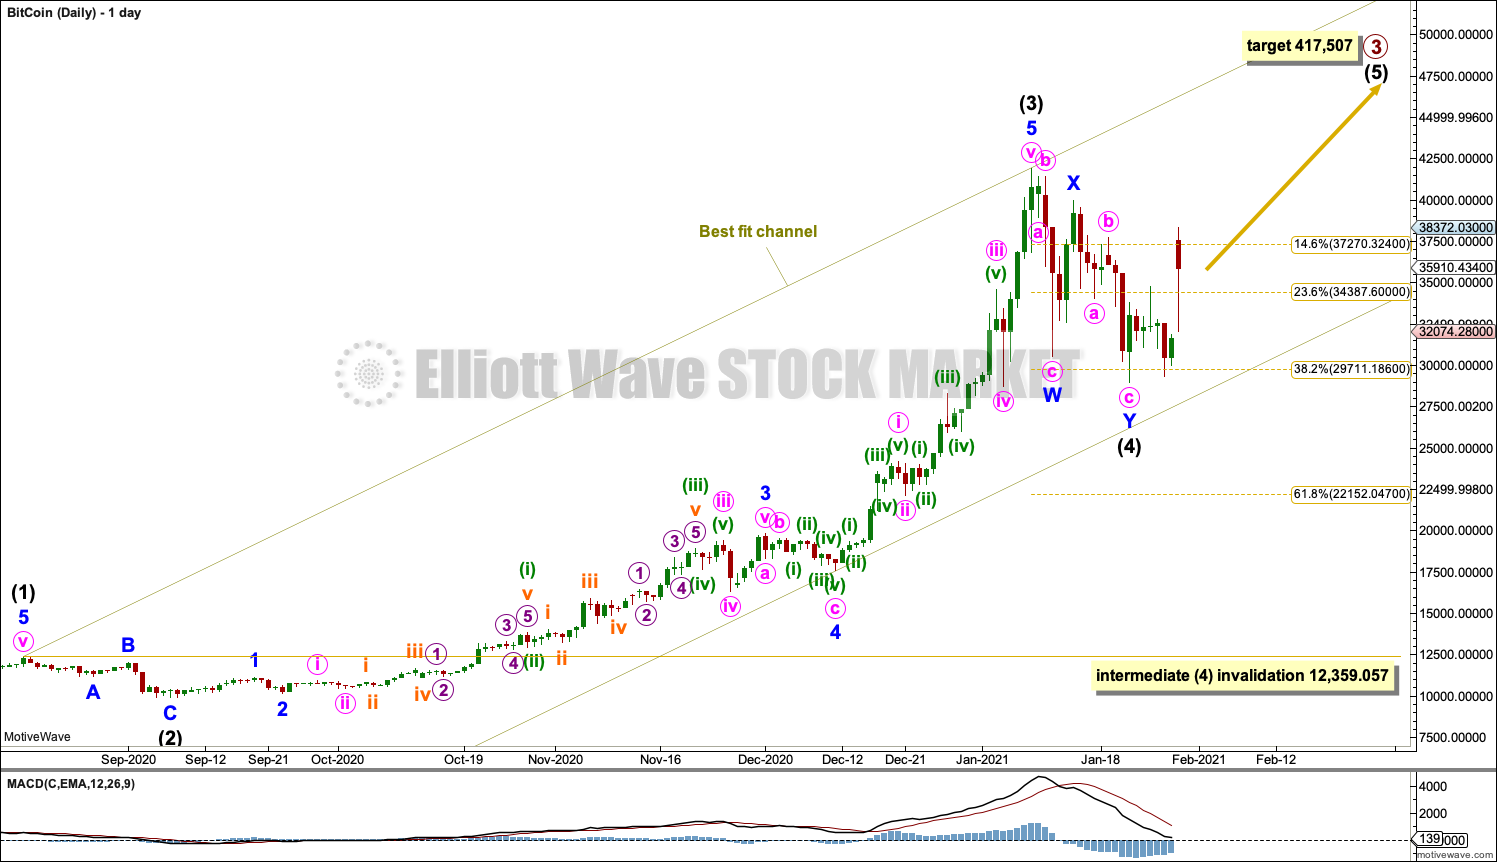
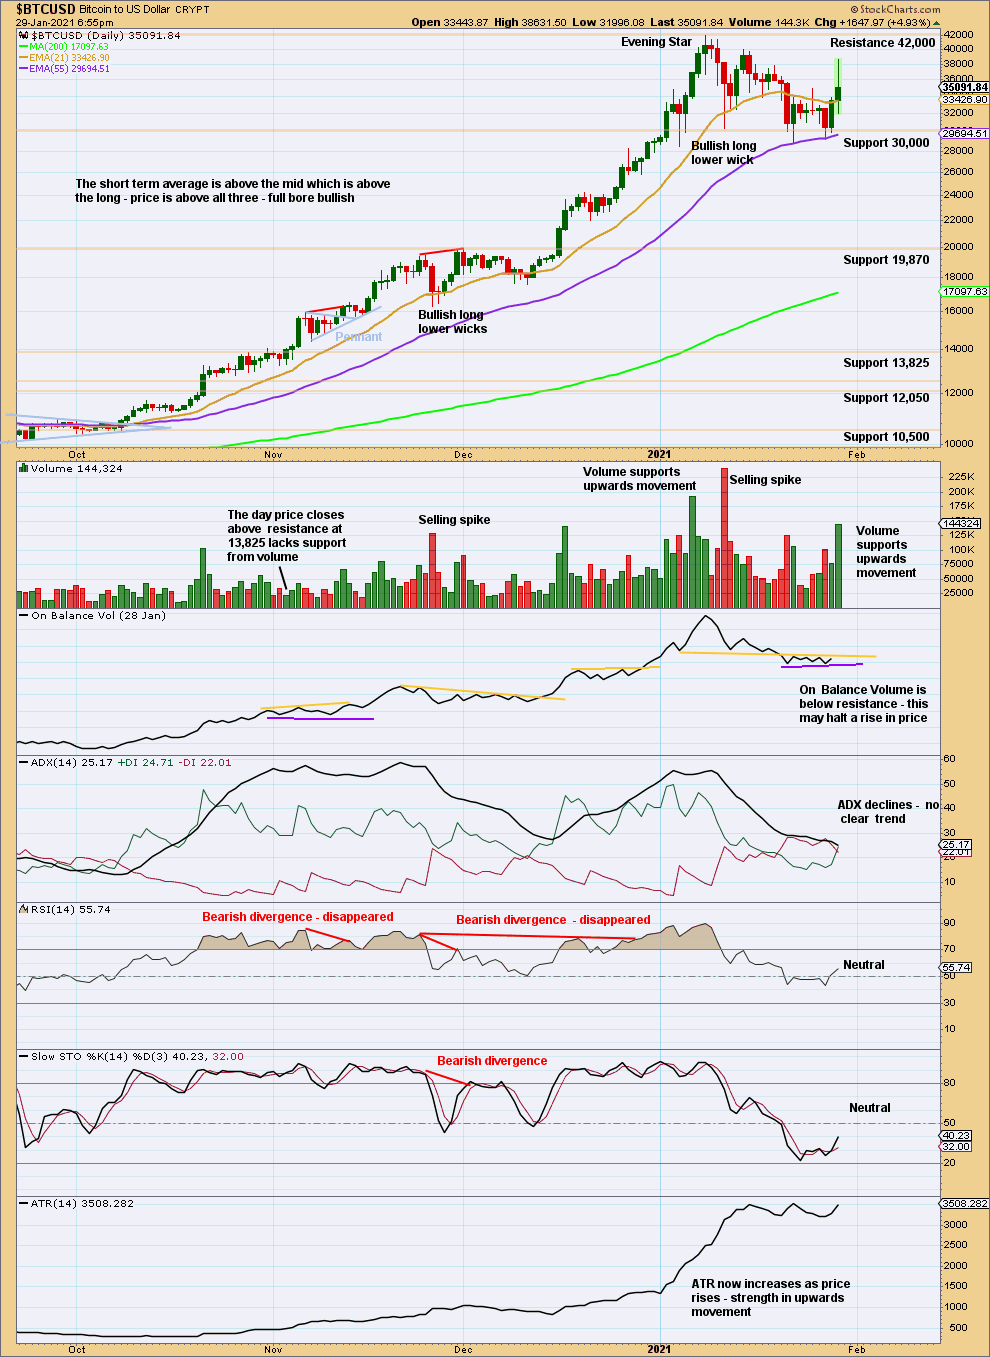
Bitcoin typically exhibits swift and strong fifth waves, particularly fifth waves to end third wave impulses one degree higher. This behaviour is typical for commodities, and of all the markets I analyse Bitcoin is the most extreme in this tendency. Minute wave v to end minor wave 5 to end intermediate wave (3) follows this tendency and has a typical look for Bitcoin.
Intermediate wave (2) was a relatively shallow 0.30 depth to intermediate wave (1). Intermediate wave (2) at 21 days was only 13% the duration of intermediate wave (1). Intermediate wave (2) subdivided as a single zigzag.
Intermediate wave (4) may now be a complete double zigzag.
There is a little alternation between intermediate waves (2) and (4); intermediate wave (2) may be a single zigzag, whereas intermediate wave (4) may be a double zigzag. Both are shallow; intermediate wave (2) was 0.3 of intermediate wave (1), whereas intermediate wave (4) may be complete at only 0.41 of intermediate wave (3).
Draw a best fit channel to contain all of intermediate waves (2) and (3). Draw the first trend line from the end of intermediate wave (1) to the end of intermediate wave (3), then pull a parallel copy lower to contain all movement. The lower edge may provide support for intermediate wave (4) if it continues lower.
Intermediate wave (4) may not move into intermediate wave (1) price territory below 12,359.057.
Primary wave 3 within cycle wave I (seen on the monthly chart) was 38.87 times the length of primary wave 1. If primary wave 3 within cycle wave III is the same multiplier of primary wave 1, then a target would be at 417,507.
WEEKLY – ALTERNATE
Click chart to enlarge.
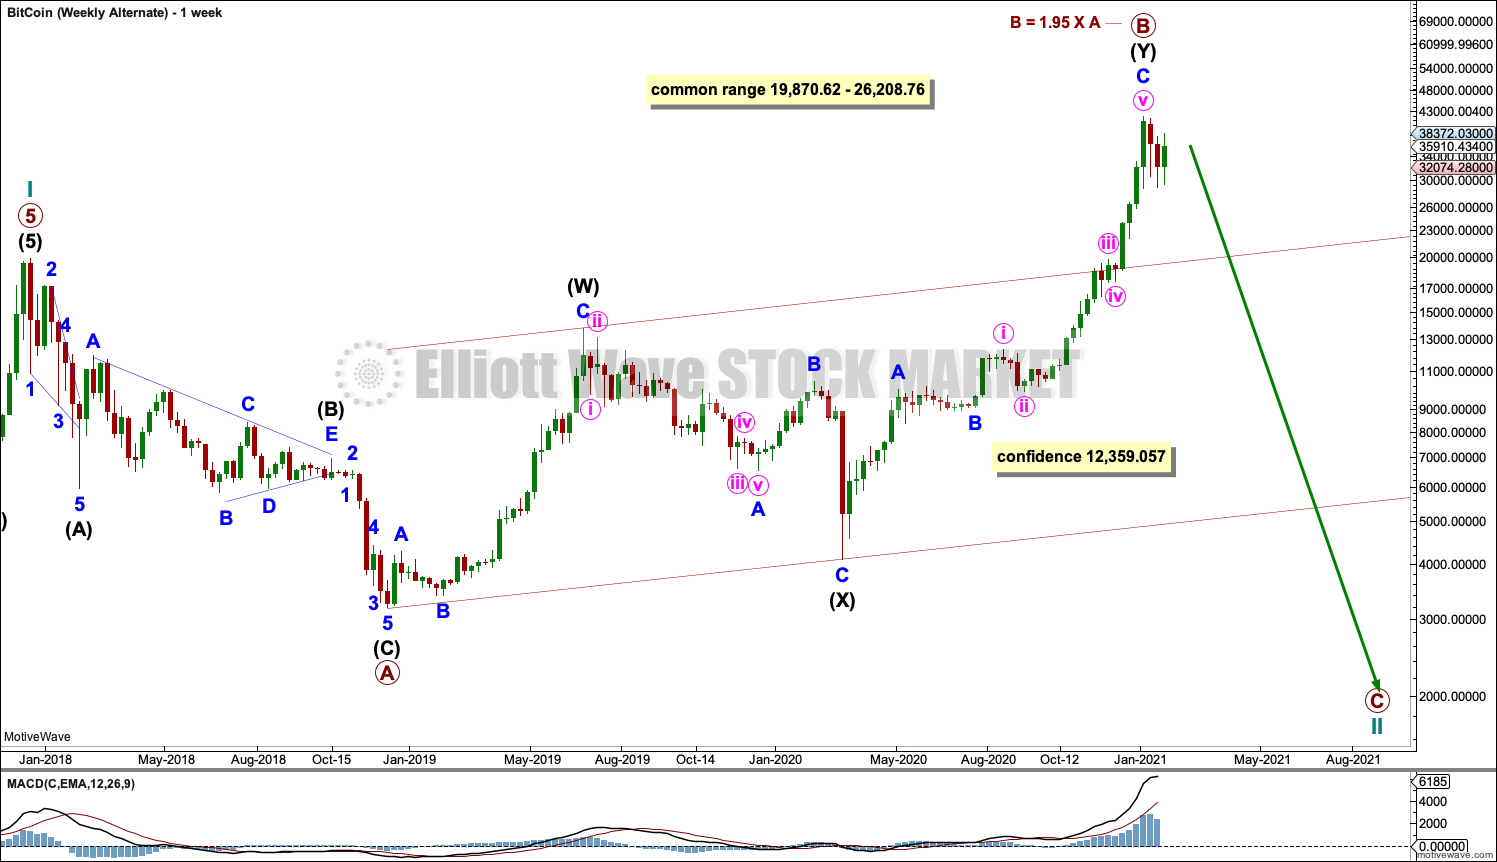
After reviewing the complete price history and full Elliott wave count of Bitcoin, this alternate wave count will still be published.
A full Elliott wave count of the price history of Bitcoin up to the 2017 high at the daily chart level shows seven flat corrections, four of which were expanded flats. Within those expanded flats, the length of their B waves ranged from 1.25 to 2.64. The mean length of B waves was 1.82 times the length of corresponding A waves. This alternate wave count remains valid and is possible.
This alternate wave count does not have support from classic technical analysis, so it has a low probability.
TECHNICAL ANALYSIS
MONTHLY
Click chart to enlarge.
Price has broken above resistance at 19,870 with support from volume. ADX indicates an upwards trend that is not extreme.
When this market trends, then Stochastsics, RSI and ADX may all remain extreme for a few months at the monthly chart level while price moves a considerable distance. Highs are best identified at the daily and weekly chart level. This current trend may continue for a few more months and price may travel a considerable distance before a trend change.
WEEKLY
Click chart to enlarge.
After a vertical rise of four weeks, a small pullback has not lasted long enough to relieve extreme conditions. However, for Bitcoin extreme conditions can persist for reasonable periods of time while price moves a considerable distance. With weak bearish candlestick patterns on both the weekly or daily charts at the last high, it looks like the high may be exceeded in the short term.
The Hanging Man candlestick pattern appears one candlestick after the high, not at the high. It lacked support from downwards volume. This is not a strong bearish reversal pattern.
DAILY
Click chart to enlarge.
After the vertical rise of four weeks, a consolidation has brought ADX down from very extreme and RSI is well within neutral territory. There is again room for the larger upwards trend to continue.
Support about 30,000 has held.
It is noted that the last two times RSI reached overbought and there exhibited bearish divergence with price, that this was not followed by any significant consolidation or pullback and divergence simply disappeared as price continued higher. RSI is not currently proving useful in identifying highs in this market.
Look for a breakout of the consolidation zone with support about 30,000 and resistance about 42,000.
*Edit: in response to your comment below Roland, I’m aware the target for primary 3 is higher than the target for cycle III. I’m taking a different approach to Bitcoin targets (because my usual approach did not work in 2017, all my targets were exceeded by a lot) and trying different multiples between first and third waves. This is what those calculations come up with, obviously both targets cannot be correct. My targets are highly provisional. If price approaches the cycle III target then the EW structure may see the target for primary 3 discarded, but if price passes the cycle III target and neither primary 3 nor cycle III are complete, then the target for primary 3 would be used. I hope this makes sense? I know it’s unusual and maybe confusing, but this is a highly unusual market.
Published @ 07:15 p.m. EST.
—
Careful risk management protects your trading account(s).
Follow my two Golden Rules:
1. Always trade with stops.
2. Risk only 1-5% of equity on any one trade.
—
New updates to this analysis are in bold.