by Lara | Feb 11, 2020 | Gold |
GOLD: Elliott Wave and Technical Analysis | Charts – February 11, 2020 Price remains range bound, although the main Elliott wave count did expect downwards movement for the last session, which is what happened. Summary: A new low below 1,536.52 would indicate a...
by Lara | Feb 10, 2020 | Gold |
GOLD: Elliott Wave and Technical Analysis | Charts – February 10, 2020 Upwards movement has continued further. Price remains below the short-term invalidation point. ATR and volume strongly support the main Elliott wave count. Summary: A new low below 1,536.52...
by Lara | Feb 9, 2020 | Silver
SILVER: Elliott Wave and Technical Analysis | Charts – February 7, 2020 An inside week of mostly downwards movement remains above the short-term Elliott wave invalidation point and within a channel. Summary: The target for upwards movement to end is still at...
by Lara | Feb 8, 2020 | Gold, Lara's Weekly, S&P500, US Oil |
Lara’s Weekly: Elliott Wave and Technical Analysis of S&P500 and Gold and US Oil | Charts – February 7, 2020 S&P 500 Downwards movement unfolded as expected for Friday. At the end of the week, all of volume, breadth and volatility are used to...
by Lara | Feb 8, 2020 | Gold |
GOLD: Elliott Wave and Technical Analysis | Charts – February 7, 2020 A very little more upwards movement to a short-term target about 1,574 was expected. Upwards movement has reached 1,572.29, just 1.37 short of the target. Summary: A new low below 1,536.52...
by Lara | Feb 8, 2020 | US Oil
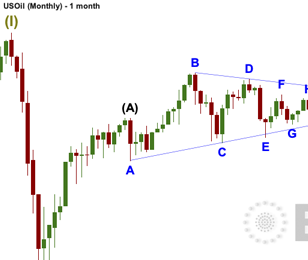
US OIL: Elliott Wave and Technical Analysis | Charts – February 7, 2020 The target for downwards movement to end was at 48.81. Price continued lower this week to reach 49.32, just 0.51 short of the target. Summary: Both the bullish and bearish Elliott wave...
by Lara | Feb 7, 2020 | Natural Gas, Public Analysis |
Natural Gas: Elliott Wave and Technical Analysis | Charts – February 6, 2020 Last analysis of Natural Gas, April 2017, expected more upwards movement overall to complete a cycle degree B wave. The target was at 4.731. Upwards movement reached 4.903 (November...
by Lara | Feb 6, 2020 | Gold |
GOLD: Elliott Wave and Technical Analysis | Charts – February 6, 2020 Both main and alternate Elliott wave counts expected a little more upwards movement for the last session, which is what has happened. Summary: A new low below 1,536.52 would indicate a high...
by Lara | Feb 5, 2020 | Gold
GOLD: Elliott Wave and Technical Analysis | Charts – February 5, 2020 Downwards movement continued as the main Elliott wave count now expects. Summary: A new low below 1,536.52 would indicate a high was in place on the 8th of January and a downwards trend has...
