by Lara | Jan 22, 2021 | US Oil, US Oil Historical
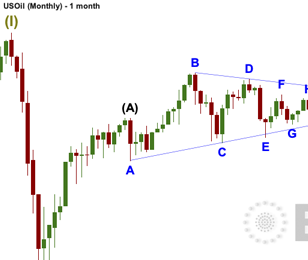
US OIL: Elliott Wave and Technical Analysis | Charts – January 22, 2021 Downwards movement for the week has found support exactly at the lower edge of the channel on the daily chart. Price remains above the invalidation point. The Elliott wave counts remain the...

by Lara | Jan 15, 2021 | Gold, Lara's Weekly, S&P500, US Oil
Lara’s Weekly: Elliott Wave and Technical Analysis of S&P500 and Gold and US Oil | Charts – January 15, 2021 S&P 500 Price remains within a channel on the daily chart and above the short-term invalidation point. Summary: The wave count expects the...

by Lara | Jan 15, 2021 | US Oil, US Oil Historical
US OIL: Elliott Wave and Technical Analysis | Charts – January 15, 2021 Again, more upwards movement has unfolded as expected. Price remains within the channel on the daily chart. Summary: Classic analysis suggests a high may be in place for the short to mid...

by Lara | Jan 8, 2021 | Gold, Lara's Weekly, S&P500, US Oil
Lara’s Weekly: Elliott Wave and Technical Analysis of S&P500 and Gold and US Oil | Charts – January 8, 2021 S&P 500 New all time highs to end the week were expected from the main Elliott wave count. For the very short term, a little pullback to...

by Lara | Jan 8, 2021 | US Oil, US Oil Historical
US OIL: Elliott Wave and Technical Analysis | Charts – January 8, 2021 The upwards trend was expected to continue. Price continues to move higher towards the Elliott wave target. Summary: An upwards trend may continue. A short-term classic analysis target from a...

by Lara | Jan 1, 2021 | Gold, Lara's Weekly, S&P500, US Oil
Lara’s Weekly: Elliott Wave and Technical Analysis of S&P500 and Gold and US Oil | Charts – December 31, 2020 S&P 500 The year ends with new all time highs from both price and the AD line. This is exactly in line with the larger picture from the...

by Lara | Dec 31, 2020 | US Oil, US Oil Historical
US OIL: Elliott Wave and Technical Analysis | Charts – December 31, 2020 An inside week sees price move sideways with declining volume. A pennant pattern may have formed. The flag pole is used to calculate a target. Summary: An upwards trend may continue. A new...

by Lara | Dec 25, 2020 | Gold, Lara's Weekly, S&P500, US Oil
Lara’s Weekly: Elliott Wave and Technical Analysis of S&P500 and Gold and US Oil | Charts – December 24, 2020 S&P 500 Today’s session was quiet (markets closed early, at 1 p.m.) and leaves this analysis unchanged. Price continues to move...

by Lara | Dec 24, 2020 | US Oil, US Oil Historical
US OIL: Elliott Wave and Technical Analysis | Charts – December 24, 2020 Sideways and slightly lower movement this week with a bearish candlestick pattern sees three short-term Elliott wave counts considered. Summary: An upwards trend may continue. A new...


