

S&P 500
For the very short term, a consolidation or bounce was expected. A bounce for Friday overall fits this expectation. Price remained below the invalidation point.
Summary: A pullback or consolidation here for primary wave 4 may now last about a couple of weeks or so and may end either about 2,894 or the lower edge of the maroon Elliott channel on the daily chart.
For the short term, some downwards movement may begin next week to 2,894. Overall, primary wave 4 may move sideways in a range bound movement.
The final target remains the same at 3,045. Alternate monthly wave counts allow for a target as high as 4,119.
The biggest picture, Grand Super Cycle analysis, is here.
Monthly charts were last published here, with video here. There are two further alternate monthly charts here. Video is here.
ELLIOTT WAVE COUNTS
The two Elliott wave counts below will be labelled First and Second rather than main and alternate as they may be about of even probability. When the current impulse of primary wave 5 (second wave count) or cycle wave V (first wave count) may be complete, then these two wave counts will diverge on the severity of the expected following bear market. To see an illustration of this future divergence monthly charts should be viewed.
FIRST WAVE COUNT
WEEKLY CHART
Click chart to enlarge.
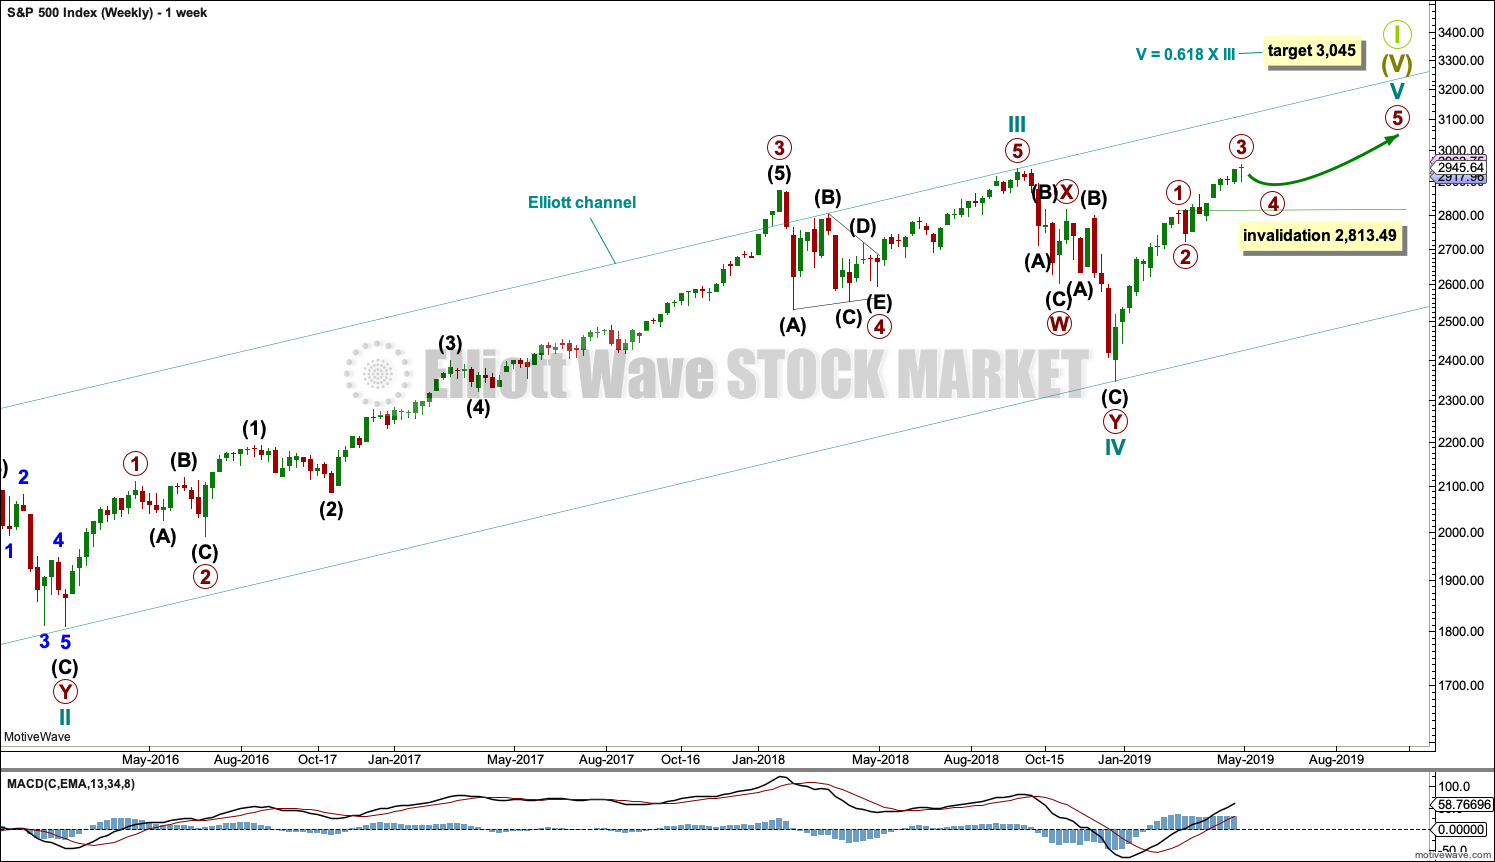
This weekly chart shows all of cycle waves III, IV and V so far.
This wave count expects that when cycle wave V completes Super Cycle wave (V) and Grand Super Cycle wave I, that a huge bear market to potentially last decades may begin. It should move substantially below 666.79.
Cycle wave II fits as a time consuming double combination: flat – X – zigzag. Combinations tend to be more time consuming corrective structures than zigzags. Cycle wave IV has completed as a multiple zigzag that should be expected to be more brief than cycle wave II.
Cycle wave IV may have ended at the lower edge of the Elliott channel.
Within cycle wave V, primary waves 1 through to 3 may now be complete. Primary wave 4 may not move into primary wave 1 price territory below 2,813.49.
Although both cycle waves II and IV are labelled W-X-Y, they are different corrective structures. There are two broad groups of Elliott wave corrective structures: the zigzag family, which are sharp corrections, and all the rest, which are sideways corrections. Multiple zigzags belong to the zigzag family and combinations belong to the sideways family. There is perfect alternation between the possible double zigzag of cycle wave IV and the combination of cycle wave II.
Although there is gross disproportion between the duration of cycle waves II and IV, the size of cycle wave IV in terms of price makes these two corrections look like they should be labelled at the same degree. Proportion is a function of either or both of price and time.
Draw the Elliott channel about Super Cycle wave (V) with the first trend line from the end of cycle wave I (at 2,079.46 on the week beginning 30th November 2014) to the high of cycle wave III, then place a parallel copy on the low of cycle wave II. Cycle wave V may find resistance about the upper edge.
It is possible that cycle wave V may end in October 2019. If it does not end there, or if the AD line makes new all time highs during or after June 2019, then the expectation for cycle wave V to end would be pushed out to March 2020 as the next possibility. Thereafter, the next possibility may be October 2020. March and October are considered as likely months for a bull market to end as in the past they have been popular. That does not mean though that this bull market may not end during any other month.
DAILY CHART
Click chart to enlarge.
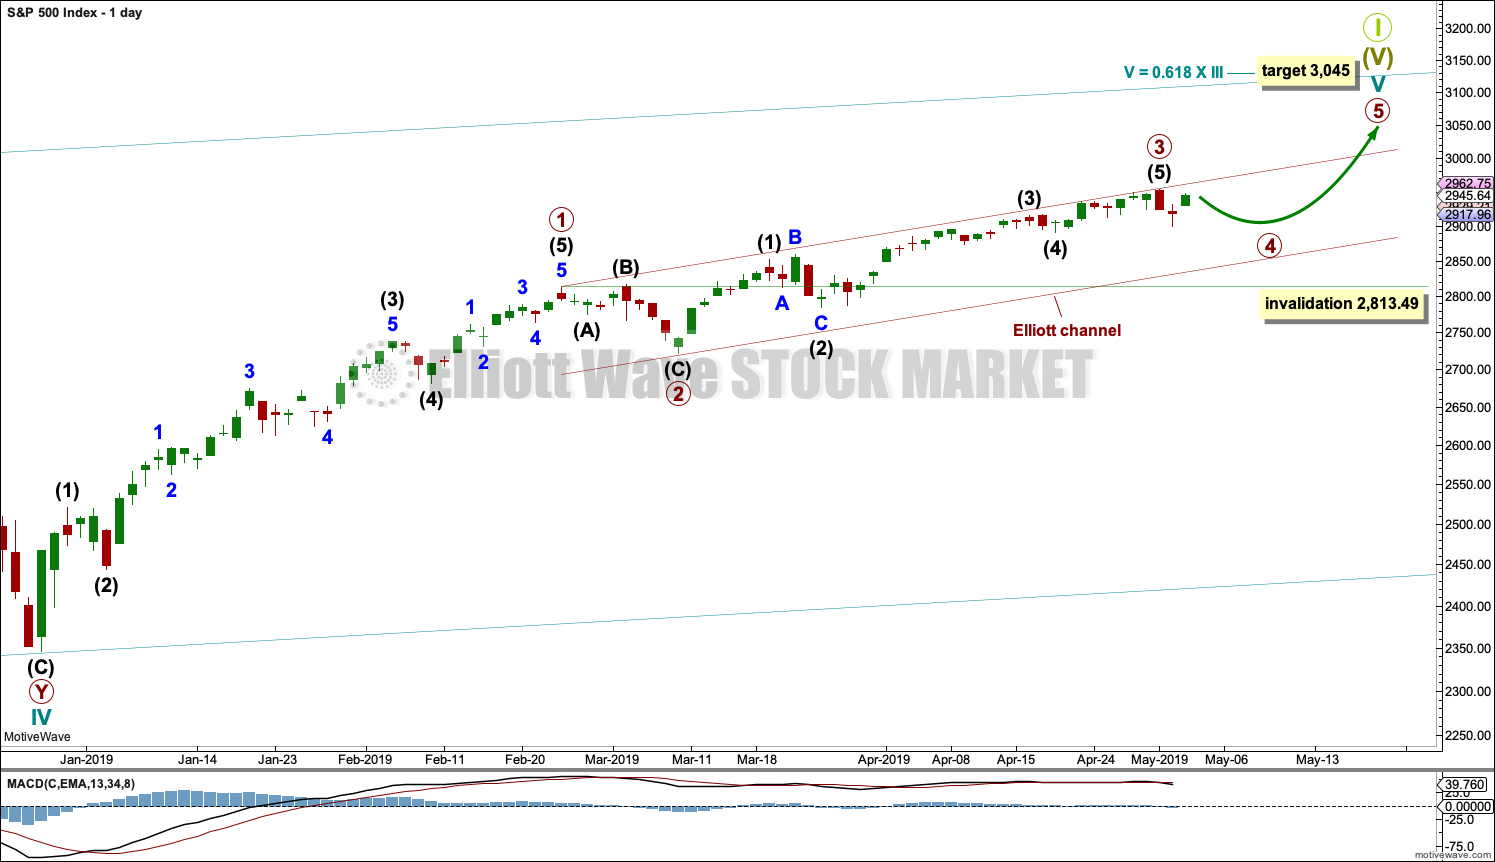
The daily chart will focus on the structure of cycle wave V.
Cycle wave V must subdivide as a five wave motive structure, either an impulse or an ending diagonal. An impulse is much more common and that will be how it is labelled. A diagonal would be considered if overlapping suggests it.
Primary wave 1 may have been a long extension, a smaller fractal of cycle wave I on the monthly chart.
Primary wave 2 may have been a very brief and shallow expanded flat correction, lasting just short of two weeks.
Primary wave 3 may be complete. It exhibits no Fibonacci ratio to primary wave 1 and is shorter than primary wave 1. This limits primary wave 5 to no longer than equality in length with primary wave 3 at 231.86 points.
Primary wave 4 may be expected to exhibit alternation with primary wave 2. Primary wave 4 may most likely unfold as a single or multiple zigzag, but it may also unfold as a triangle or combination. The least likely structure would be a flat.
A channel is drawn using Elliott’s first technique about the impulse of cycle wave V. Draw the first trend line from the ends of primary waves 1 to 3, then place a parallel copy on the end of primary wave 2. If it is long lasting enough, primary wave 4 may find support about the lower edge of this channel.
Primary wave 4 may not move into primary wave 1 price territory below 2,813.49.
SECOND WAVE COUNT
WEEKLY CHART
Click chart to enlarge.
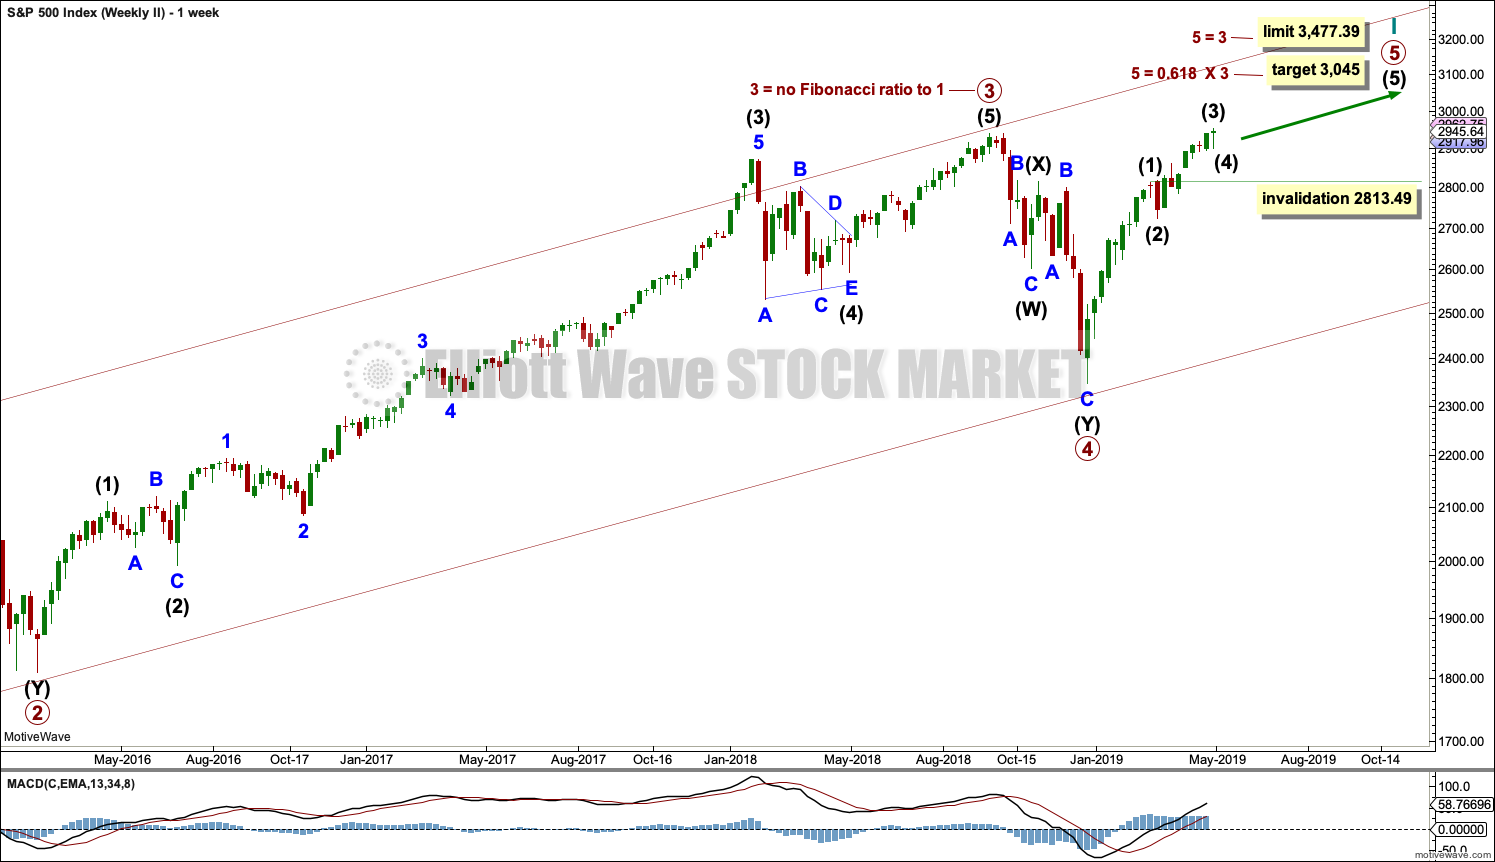
This weekly chart is identical to the first weekly chart, with the sole difference being the degree of labelling.
When cycle wave I is complete, then cycle wave II should meet the technical definition of a bear market as it should retrace more than 20% of cycle wave I, but it may end about either the 0.382 or 0.618 Fibonacci Ratios of cycle wave I. Cycle wave II may end close to the low of primary wave 2 within cycle wave I, which is at 1,810.10.
Thereafter, a new bull market for cycle wave III may begin. It should have support from volume and fundamentals.
The end of Grand Super Cycle wave I may be about 10 years or so away.
TECHNICAL ANALYSIS
WEEKLY CHART
Click chart to enlarge. Chart courtesy of StockCharts.com.
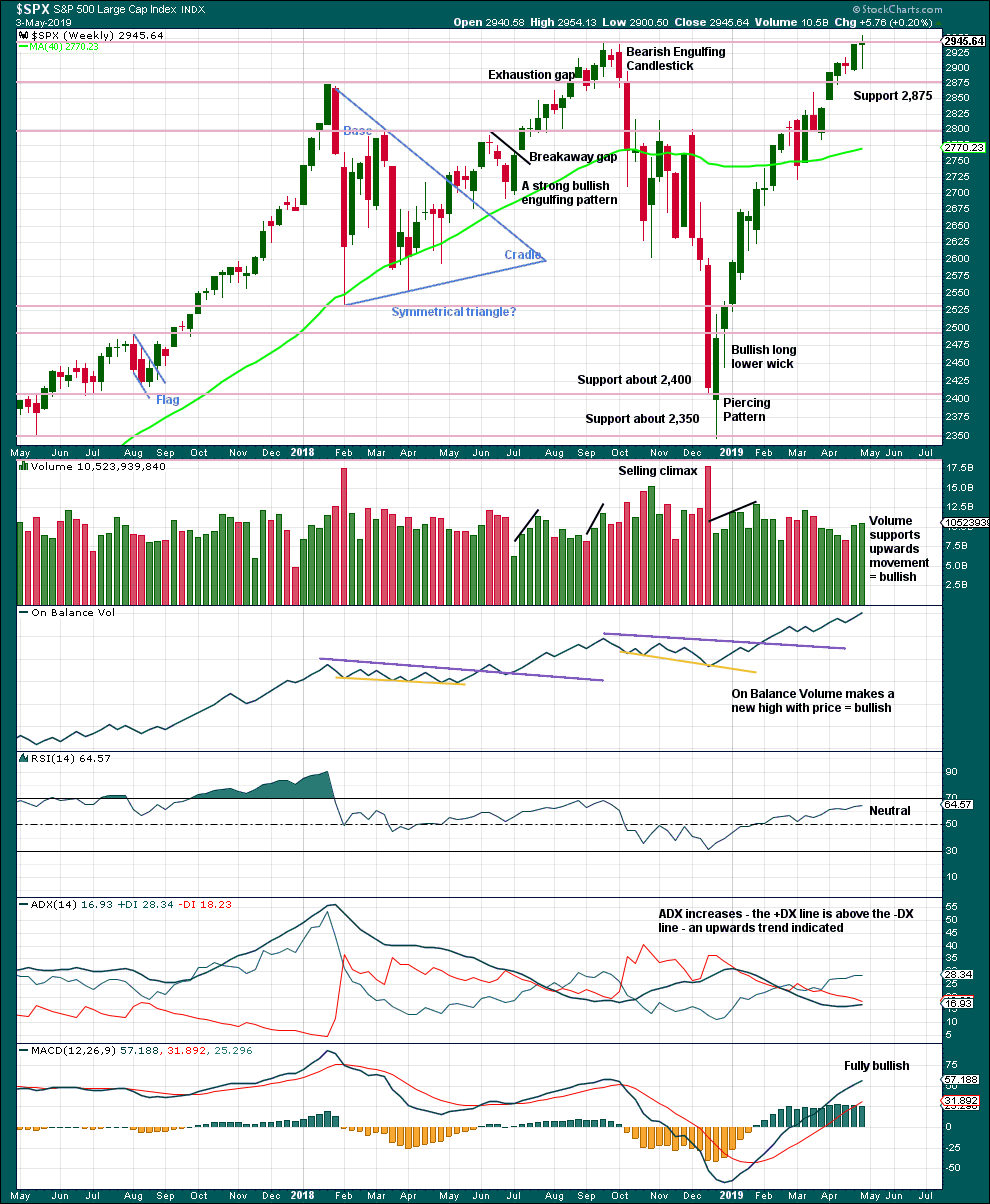
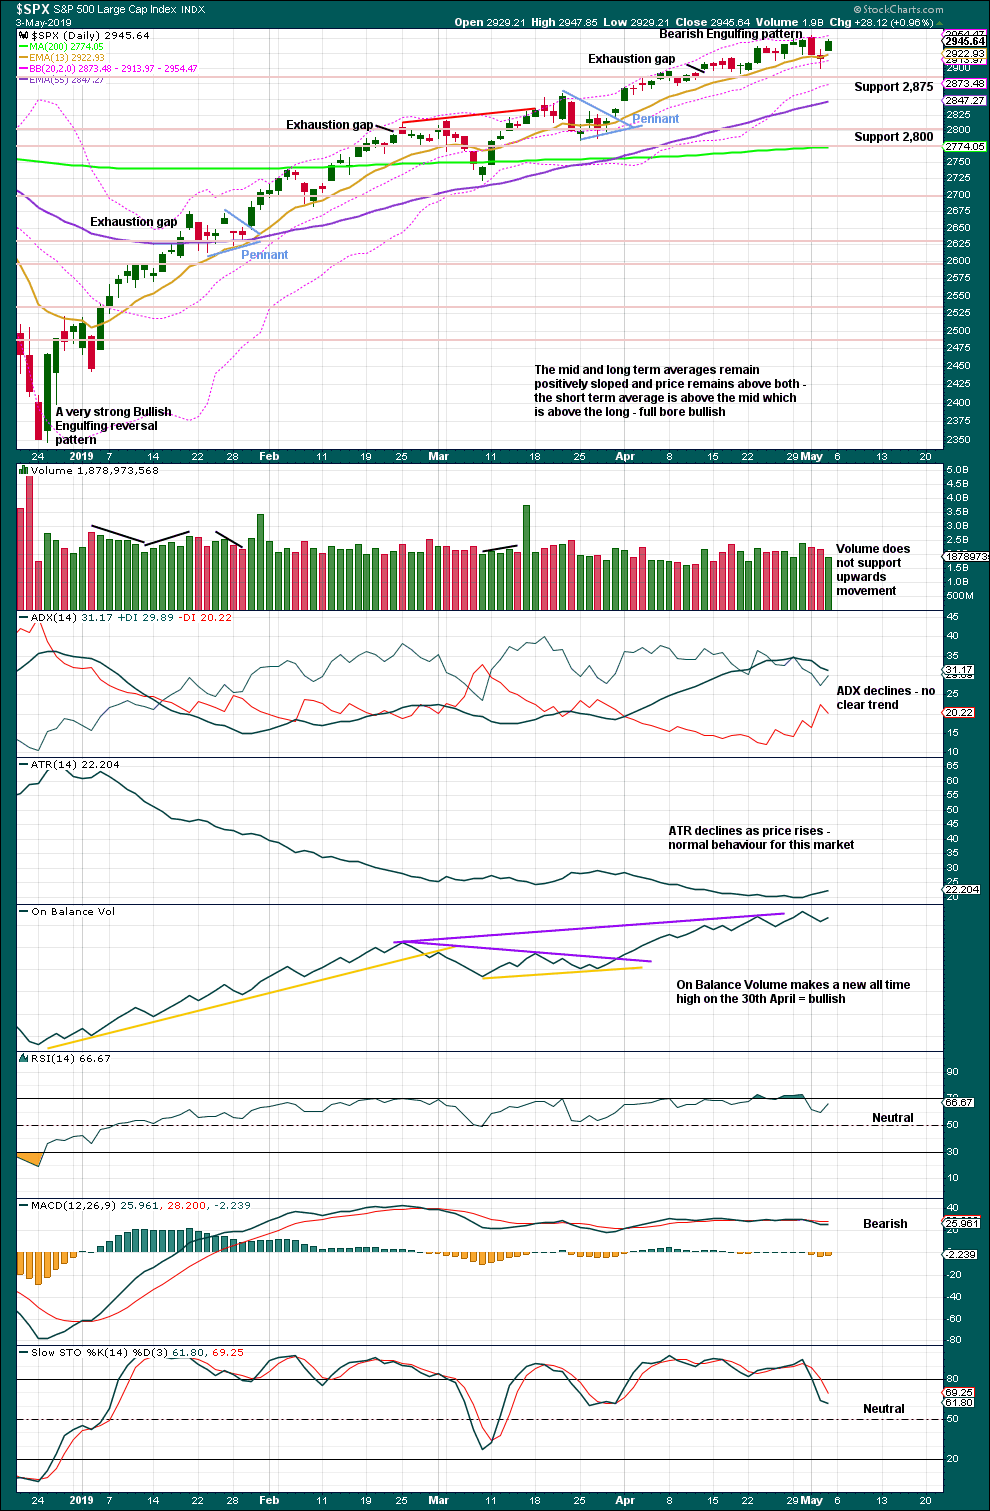
The Doji this week may represent a short pause within the upwards trend, or it may yet form part of a reversal pattern. Doji on their own are not reversal signals.
This chart remains fully bullish.
DAILY CHART
Click chart to enlarge. Chart courtesy of StockCharts.com.
The December 2018 low is expected to remain intact. The two 90% upwards days on 26th December 2018 and 6th January 2019 indicate this upwards trend has internal strength.
The Bearish Engulfing candlestick engulfs the two prior daily candlesticks. Coming after upwards movement, which has reached extreme, it should be given weight. This is a fairly strong bearish reversal signal.
There is support close by at 2,875.
Friday’s upwards day has weak volume. This may fit as a B wave.
BREADTH – AD LINE
WEEKLY CHART

Click chart to enlarge. Chart courtesy of StockCharts.com. So that colour blind members are included, bearish signals
will be noted with blue and bullish signals with yellow.
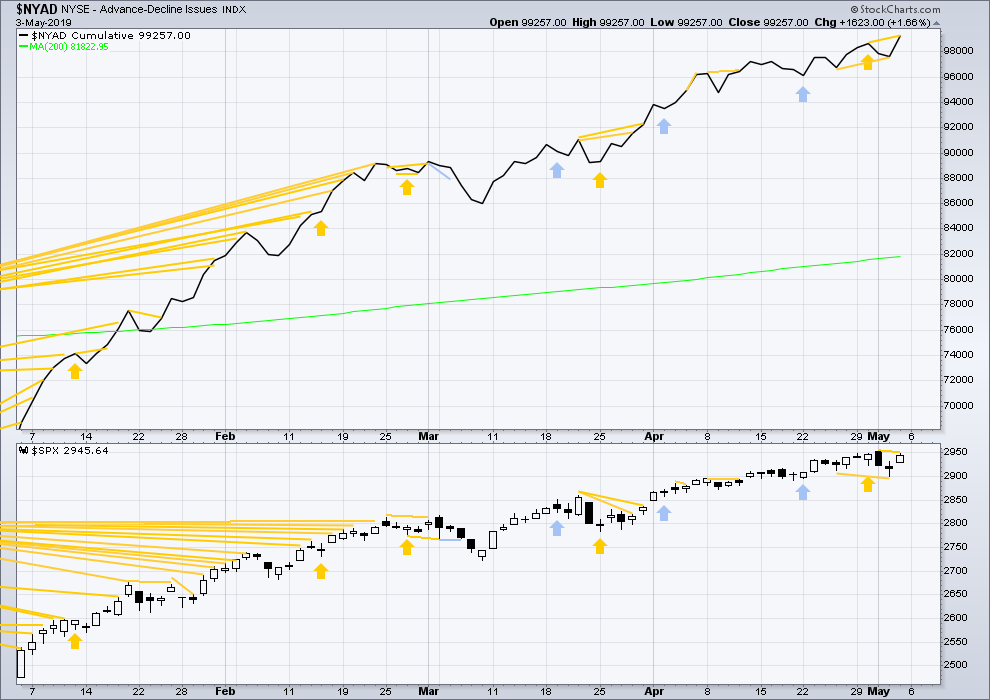
Every single bear market from the Great Depression and onwards has been preceded by a minimum of 4 months divergence between price and the AD line. With the AD line making a new all time high again this week, the end of this bull market and the start of a new bear market must be a minimum of 4 months away, which is the beginning of September 2019 at this time.
Mid-term bullish divergence has been followed by a new all time high from price and may now be resolved. There is no mid nor long-term divergence. Both price and the AD line make new all time highs.
While large caps have made a new all time high this week, mid and small caps did not and remain below their prior all time highs. This rally is led by large caps, which is typical of an ageing bull market.
DAILY CHART
Click chart to enlarge. Chart courtesy of StockCharts.com. So that colour blind members are included, bearish signals
will be noted with blue and bullish signals with yellow.
Breadth should be read as a leading indicator.
Both price and the AD line moved higher on Friday, but the AD line made a new short-term high while price did not. This divergence is bullish for the short term and does not support the Elliott wave count. It suggests price may make another new all time high early next week.
VOLATILITY – INVERTED VIX CHART
WEEKLY CHART
Click chart to enlarge. Chart courtesy of StockCharts.com. So that colour blind members are included, bearish signals
will be noted with blue and bullish signals with yellow.
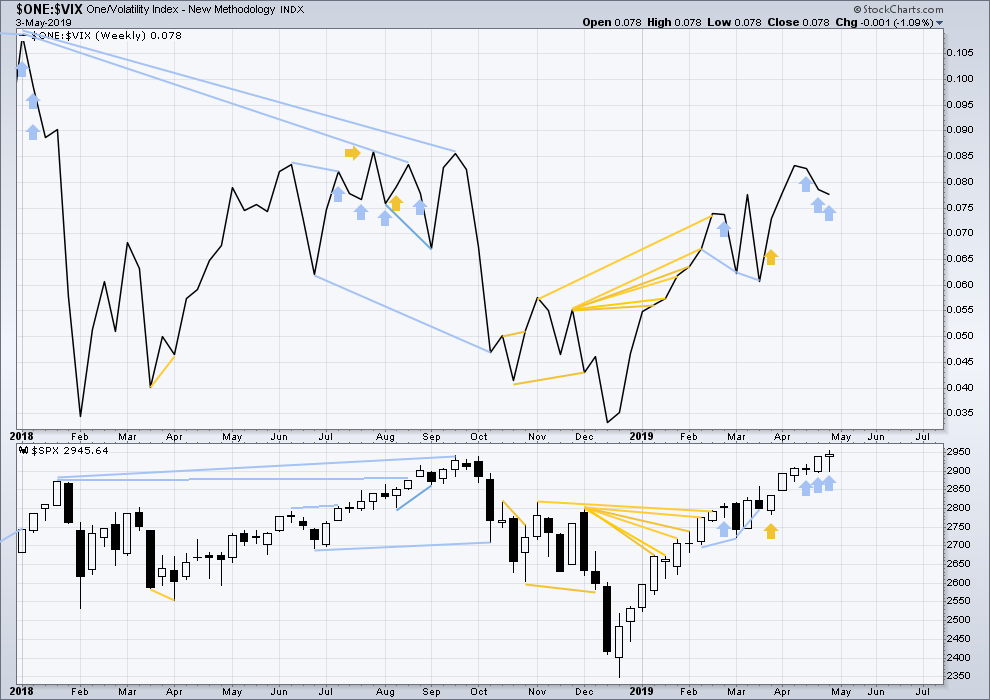
For now three weeks in a row price has moved higher and inverted VIX has moved lower. This divergence is bearish for the short to mid term and may be warning of an approaching primary (or intermediate) degree correction.
It is noted that this has occurred before at the end of the strong rise in price up to the high on the 26th of January 2018. The three weeks up to that high saw price clearly move higher and inverted VIX clearly move lower. This divergence persisted for three weeks in that instance, and so may persist for a very few weeks again now before price turns.
DAILY CHART
Click chart to enlarge. Chart courtesy of StockCharts.com. So that colour blind members are included, bearish signals
will be noted with blue and bullish signals with yellow.
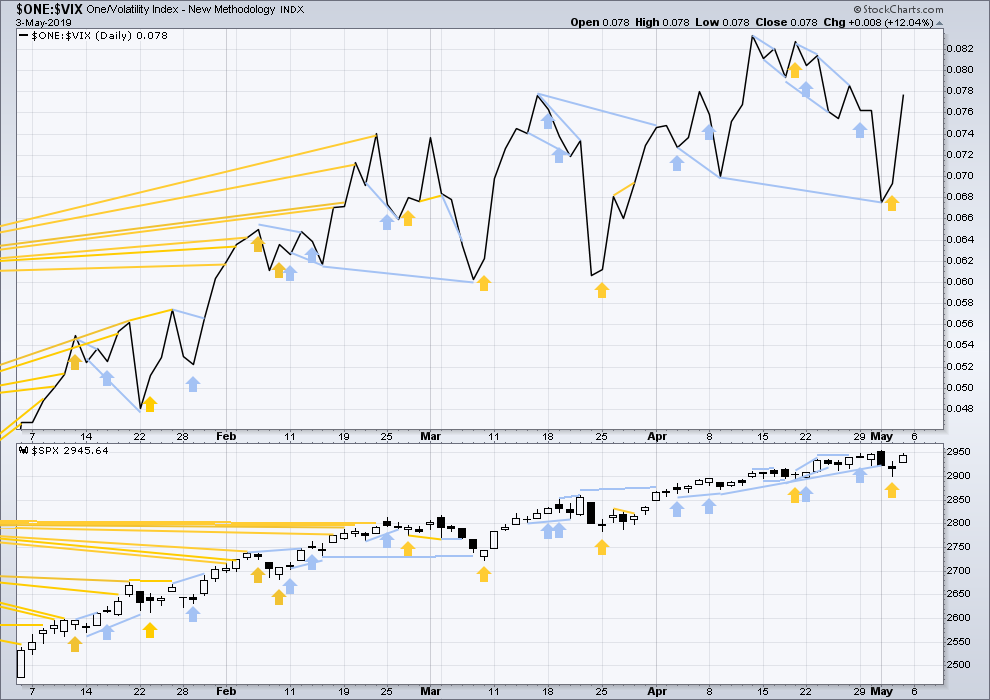
Short-term bullish divergence noted on Thursday has been followed by an upwards day for Friday. This divergence may now be resolved.
On Friday both inverted VIX and price have moved higher, but neither have made new short-term highs. There is no short-term divergence.
DOW THEORY
Dow Theory confirmed a bear market in December 2018. This does not necessarily mean a bear market at Grand Super Cycle degree though; Dow Theory makes no comment on Elliott wave counts. On the 25th of August 2015 Dow Theory also confirmed a bear market. The Elliott wave count sees that as part of cycle wave II. After Dow Theory confirmation of a bear market in August 2015, price went on to make new all time highs and the bull market continued.
DJIA: 23,344.52 – a close on the 19th of December at 23,284.97 confirms a bear market.
DJT: 9,806.79 – price has closed below this point on the 13th of December.
S&P500: 2,532.69 – a close on the 19th of December at 2,506.96 provides support to a bear market conclusion.
Nasdaq: 6,630.67 – a close on the 19th of December at 6,618.86 provides support to a bear market conclusion.
With all the indices moving now higher, Dow Theory would confirm a bull market if the following highs are made:
DJIA: 26,951.81
DJT: 11,623.58
S&P500: 2,940.91 – a new all time high has been made on the 29th of April 2019.
Nasdaq: 8,133.30 – a new high has been made on 24th of April 2019.
GOLD
A strong bounce at the end of the week creates a candlestick pattern on the daily chart that has support from volume. The short-term expectation is adjusted, but the mid and long-term Elliott wave targets remain the same as does the channel on the daily chart.
Summary: For the short term, look for a bounce to possibly end about 1,289. Use the channels on the daily chart to show where price may find resistance. Thereafter, expect the downwards trend to resume.
The mid-term Elliott wave target is at 1,220. The classic analysis target is at 1,217. Risk is just above the upper edge of the base channel on the daily chart.
Look out now for a possible strong increase in downwards momentum tomorrow or next week.
Three long-term targets are now calculated for cycle wave c to end. Confidence in a new downwards trend may be had with a new low below 1,160.75.
Grand SuperCycle analysis is here.
Last monthly charts are here. Video is here.
MAIN ELLIOTT WAVE COUNT
WEEKLY CHART – TRIANGLE
Click chart to enlarge.
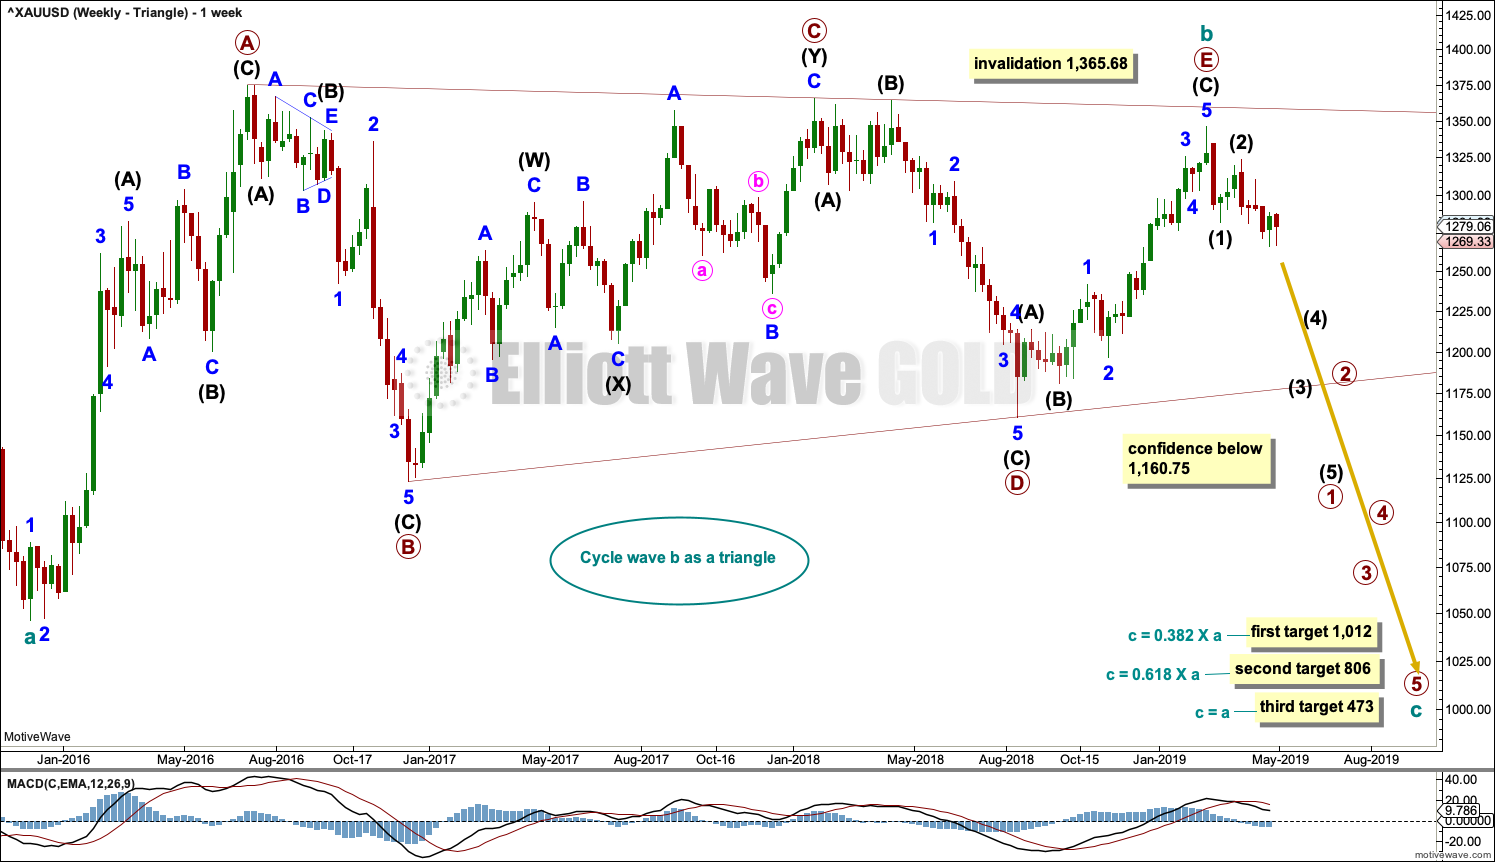
This is the preferred wave count.
Cycle wave b may be a complete regular contracting triangle. If it continues further, then primary wave E may not move beyond the end of primary wave C above 1,365.68.
Four of the five sub-waves of a triangle must be zigzags, with only one sub-wave allowed to be a multiple zigzag. Wave C is the most common sub-wave to subdivide as a multiple, and this is how primary wave C for this example fits best.
There are no problems in terms of subdivisions or rare structures for this wave count. It has an excellent fit and so far a typical look.
This wave count would expect a cycle degree trend change has occurred. Cycle wave c would most likely make new lows below the end of cycle wave a at 1,046.27 to avoid a truncation.
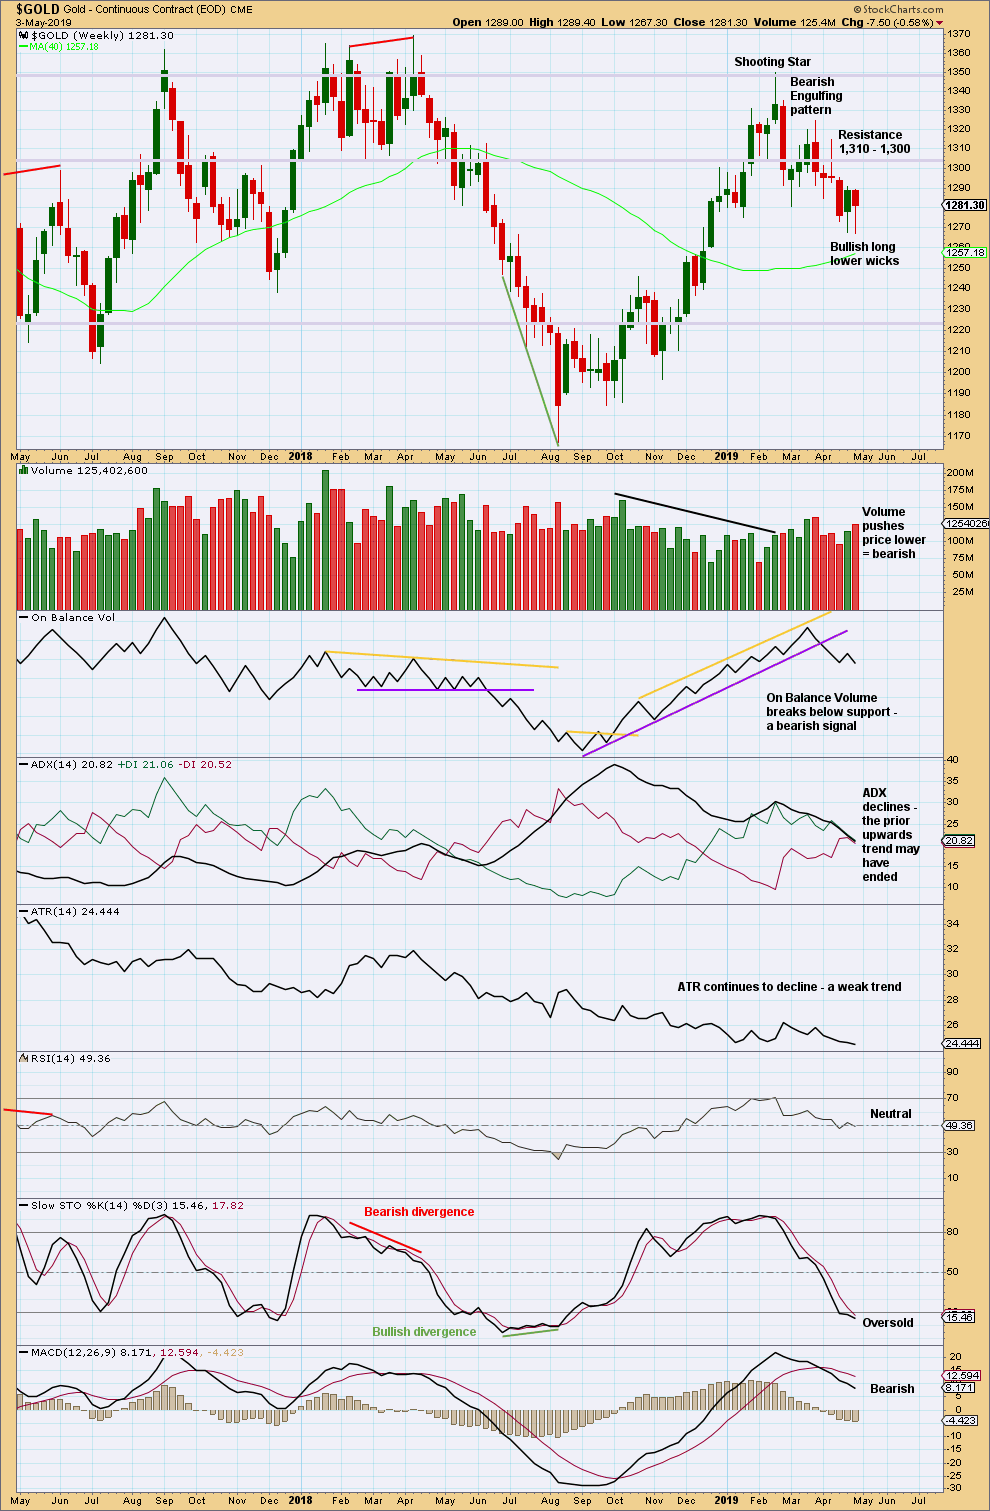
Primary wave E has exhibited reasonable weakness as it came to an end. Triangles often end with declining ATR, weak momentum and weak volume.
If this weekly wave count is correct, then cycle wave c downwards should develop strength, ATR should show some increase, and MACD should exhibit an increase in downwards momentum.
Three targets are calculated for cycle wave c. Cycle wave a lasted 4.25 years. Cycle wave b may be over in 3.17 years. Cycle wave c may last a minimum of 2 years and possibly up to 5 years.
DAILY CHART – TRIANGLE
Click chart to enlarge.
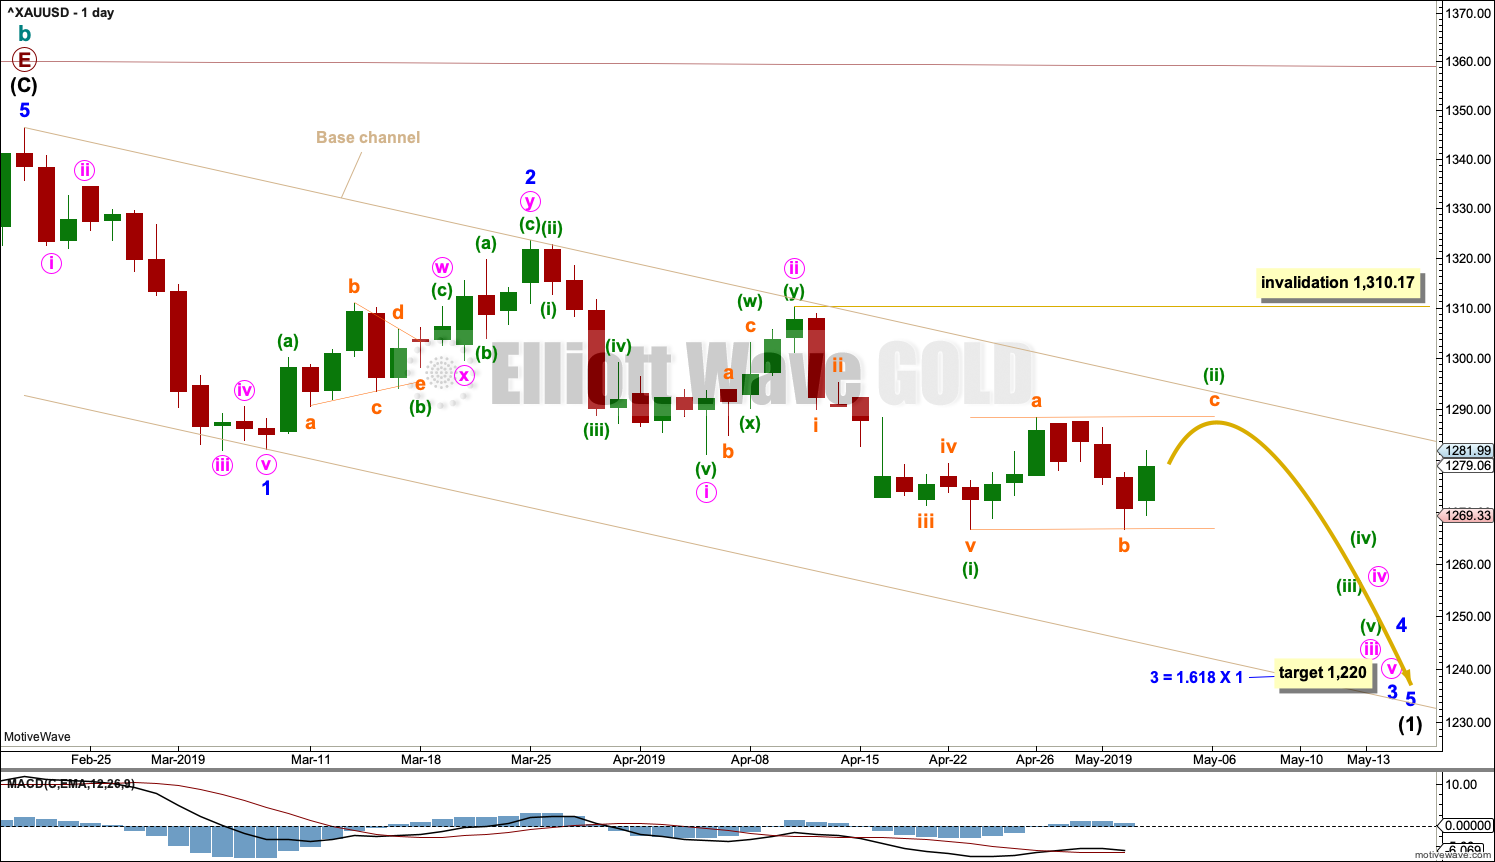
Cycle wave c must subdivide as a five wave structure, either an impulse or an ending diagonal. An impulse is much more common and that shall be how it is labelled unless overlapping suggests a diagonal should be considered.
A new trend at cycle degree should begin with a five wave structure on the daily chart, which will be labelled minor wave 1.
A base channel is drawn about minor waves 1 and 2. There will be bounces and consolidations on the way down. The last bounce has found resistance at the upper edge of the base channel. Towards its middle or end the power of a third wave may be able to break below support at the lower edge of the base channel. The upper edge of the base channel may be used to calculate a trailing stop for short positions.
Minor wave 3 may only subdivide as an impulse. Within the impulse, minute waves i and ii may now be complete . Minute wave iii may only subdivide as an impulse. Within minute wave iii, minuette wave (i) may be complete. Minuette wave (ii) may be continuing sideways as a regular flat correction. Draw a small channel about minuette wave (ii). Look for resistance about the upper edge. If price moves above that trend line, then look for next resistance about the upper edge of the taupe base channel.
This wave count now expects there may soon be a completed series of three overlapping first and second waves. This expects an increase in downwards momentum as the middle of a third wave unfolds.
It is possible that minute wave iii and / or minor wave 3 may end with a selling climax; either or both may exhibit a swift and strong fifth wave to end the impulse. This behaviour is typical of commodities, and this tendency is especially prevalent for third wave impulses.
WEEKLY CHART – DOUBLE ZIGZAG
Click chart to enlarge.
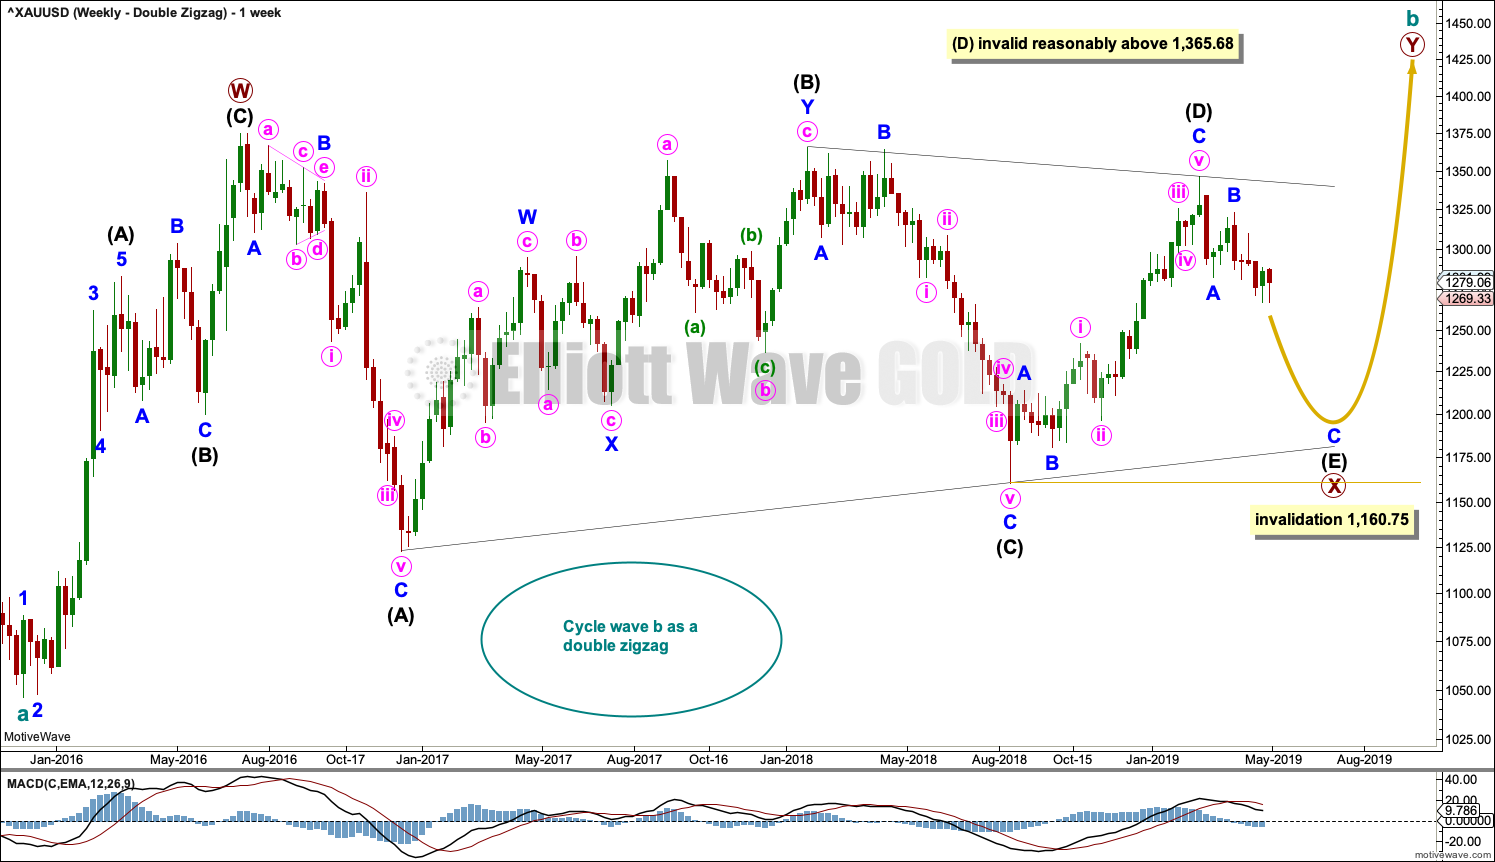
It is possible that cycle wave b may be an incomplete double zigzag or a double combination.
The first zigzag in the double is labelled primary wave W. This has a good fit.
The double may be joined by a corrective structure in the opposite direction, a triangle labelled primary wave X. The triangle would be about four fifths complete.
Within multiples, X waves are almost always zigzags and rarely triangles. Within the possible triangle of primary wave X, it is intermediate wave (B) that is a multiple; this is acceptable, but note this is not the most common triangle sub-wave to subdivide as a multiple. These two points reduce the probability of this wave count.
Intermediate wave (D) may be complete. The (B)-(D) trend line is almost perfectly adhered to with the smallest overshoot within intermediate wave (C). This is acceptable.
Intermediate wave (E) should continue to exhibit weakness: ATR should continue to show a steady decline, and MACD may begin to hover about zero.
Intermediate wave (E) may not move beyond the end of intermediate wave (C) below 1,160.75.
This wave count may now expect downwards movement for several weeks.
Primary wave Y would most likely be a zigzag because primary wave X would be shallow; double zigzags normally have relatively shallow X waves.
Primary wave Y may also be a flat correction if cycle wave b is a double combination, but combinations normally have deep X waves. This would be less likely.
This wave count has good proportions and no problems in terms of subdivisions.
Intermediate wave (E) should subdivide as a zigzag labelled minor waves A-B-C. Zigzags subdivide 5-3-5, exactly the same the start of an impulse.
The preferred wave count labels downwards movement minor waves 1-2-3, and this wave count labels downwards movement minor waves A-B-C. At the daily and hourly chart levels, the subdivisions for both wave counts are seen in the same way.
ALTERNATE ELLIOTT WAVE COUNT
WEEKLY CHART
Click chart to enlarge.
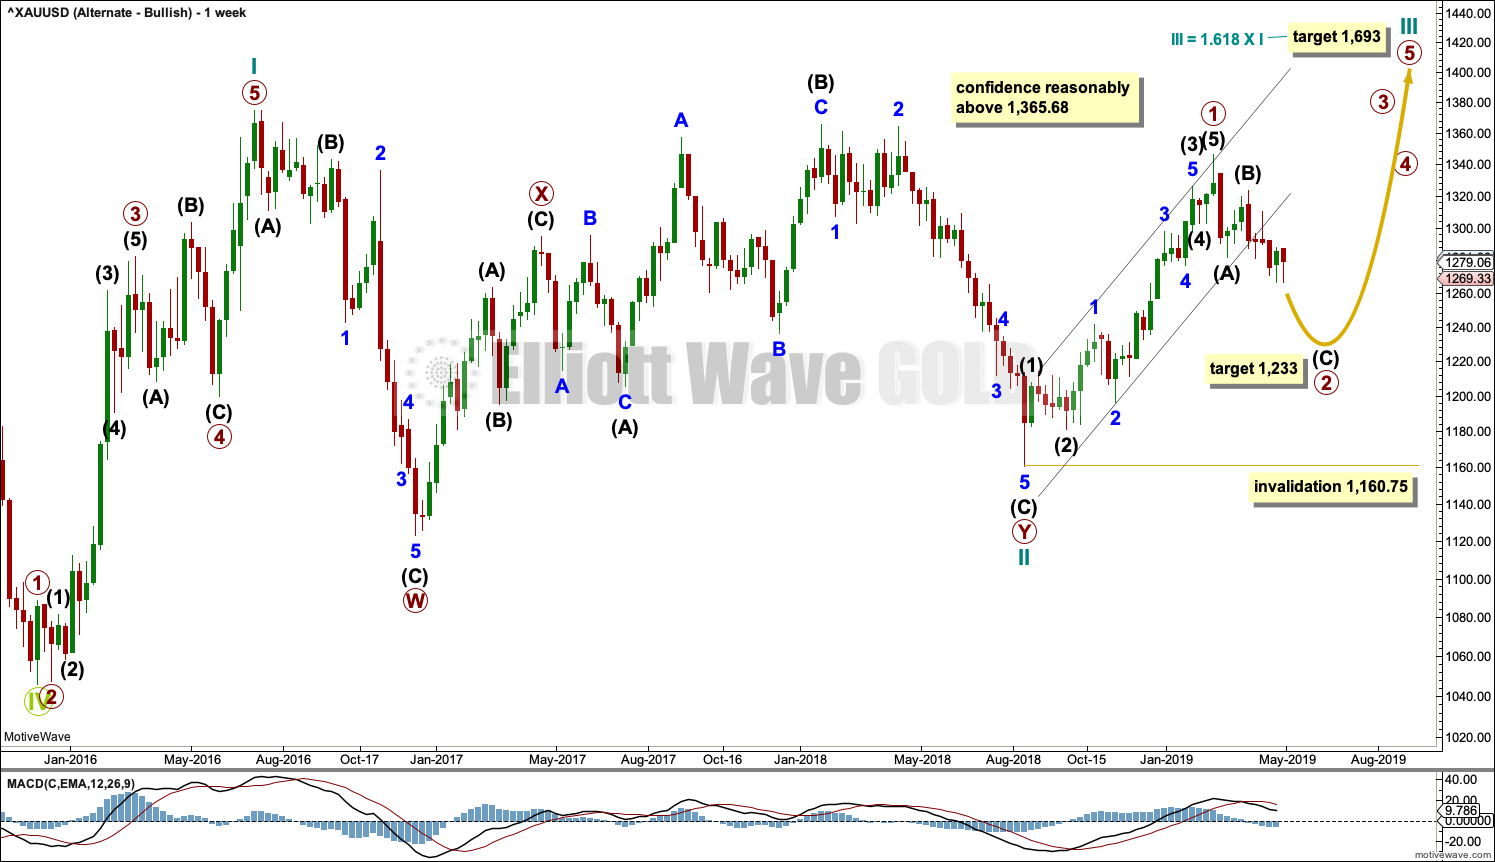
If Gold is in a new bull market, then it should begin with a five wave structure upwards on the weekly chart. However, the biggest problem with this wave count is the structure labelled cycle wave I because this wave count must see it as a five wave structure, but it looks more like a three wave structure.
Commodities often exhibit swift strong fifth waves that force the fourth wave corrections coming just prior to be more brief and shallow than their counterpart second waves. It is unusual for a commodity to exhibit a quick second wave and a more time consuming fourth wave, and this is how cycle wave I is labelled. The probability of this wave count is low due to this problem.
Cycle wave II subdivides well as a double combination: zigzag – X – expanded flat.
Cycle wave III may have begun. Within cycle wave III, primary wave 1 may now be complete. The target for primary wave 2 is the 0.618 Fibonacci ratio of primary wave 1. Primary wave 2 may not move beyond the start of primary wave 1 below 1,160.75.
A black channel is drawn about primary wave 1. Primary wave 2 may breach the lower edge of this channel.
Cycle wave III so far for this wave count would have been underway now for 37 weeks. It should be beginning to exhibit some support from volume, increase in upwards momentum and increasing ATR. However, ATR continues to decline and is very low, and momentum is weak in comparison to cycle wave I. This wave count lacks support from classic technical analysis.
TECHNICAL ANALYSIS
WEEKLY CHART
Click chart to enlarge. Chart courtesy of StockCharts.com.
Two long lower wicks now suggest a bounce here may continue, but volume suggests it may be shallow and short lived.
DAILY CHART
Click chart to enlarge. Chart courtesy of StockCharts.com.
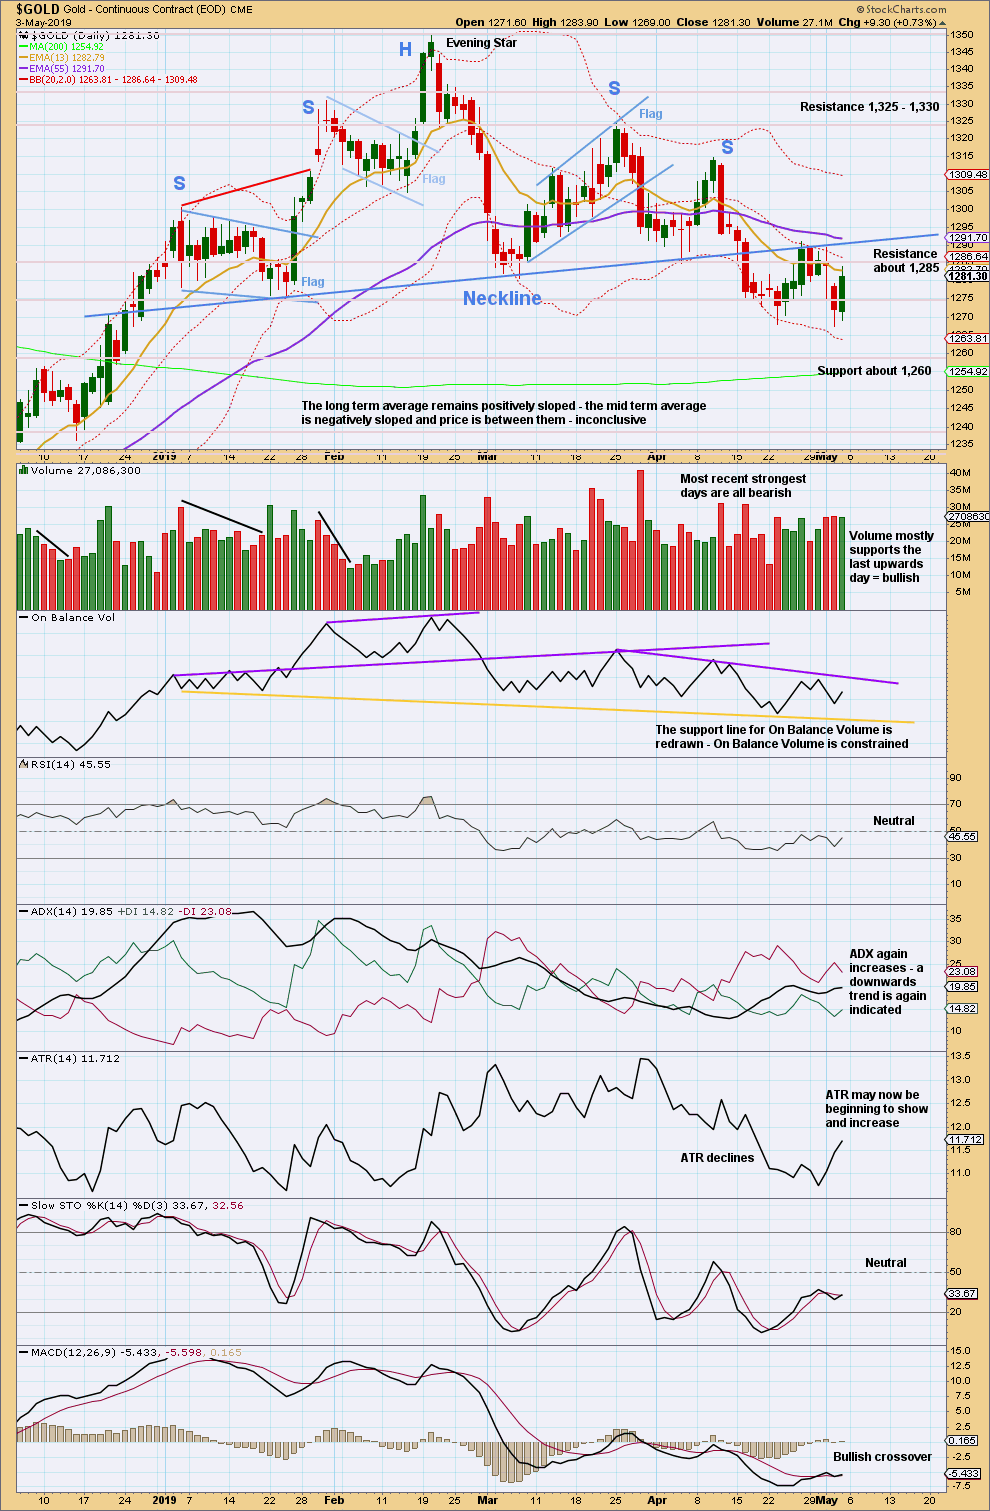
From August 2018 Gold moved higher with a series of higher highs and higher lows. This series remained intact until the 1st of March 2019 when a lower low was made. At that stage, it was possible that Gold had seen a trend change.
There is now a new series of three lower swing highs and two lower swing lows. This supports the idea that there has been a trend change and Gold is in a new downwards trend. ADX agrees.
A complex Head and Shoulders pattern is identified. The neck line has been breached. A target is at 1,217.
Overall, the short-term volume profile is bearish, but reasonably strong volume for Friday and a Bullish Engulfing candlestick pattern suggest a bounce here may be incomplete. Look for resistance first about 1,285, and above that again at the neck line of the Head and Shoulders pattern.
GDX WEEKLY CHART
Click chart to enlarge. Chart courtesy of StockCharts.com.
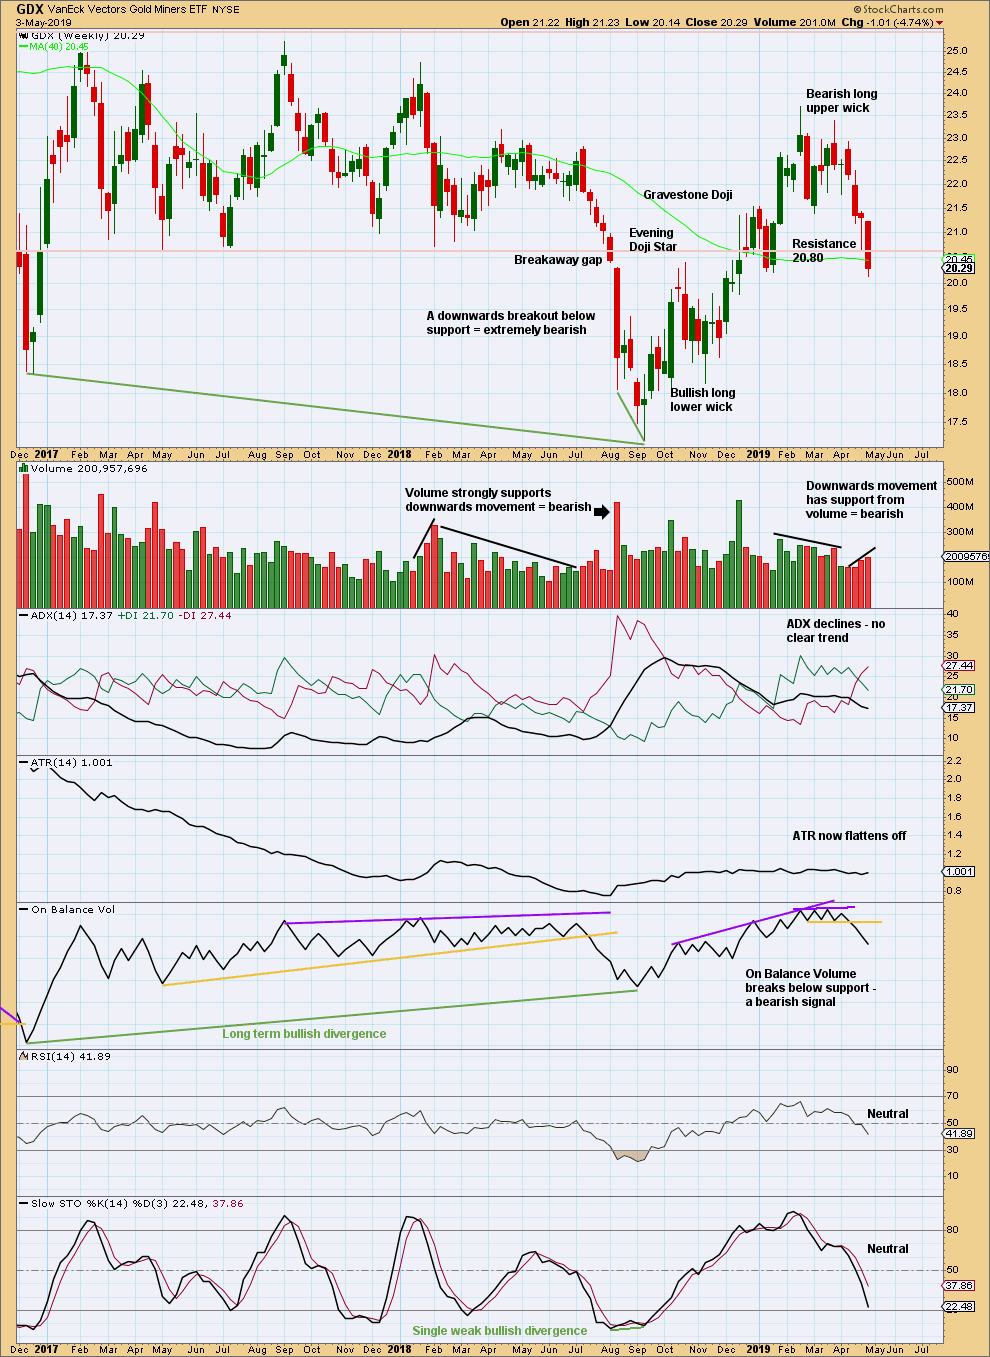
There is now a series of two lower highs and lower lows at the weekly chart level. GDX may have seen a trend change to downwards, but ADX does not yet agree. The bearish signal from On Balance Volume supports this view.
Price has closed below 20.80. With volume pushing price lower, expect downwards movement to continue.
GDX DAILY CHART
Click chart to enlarge. Chart courtesy of StockCharts.com.
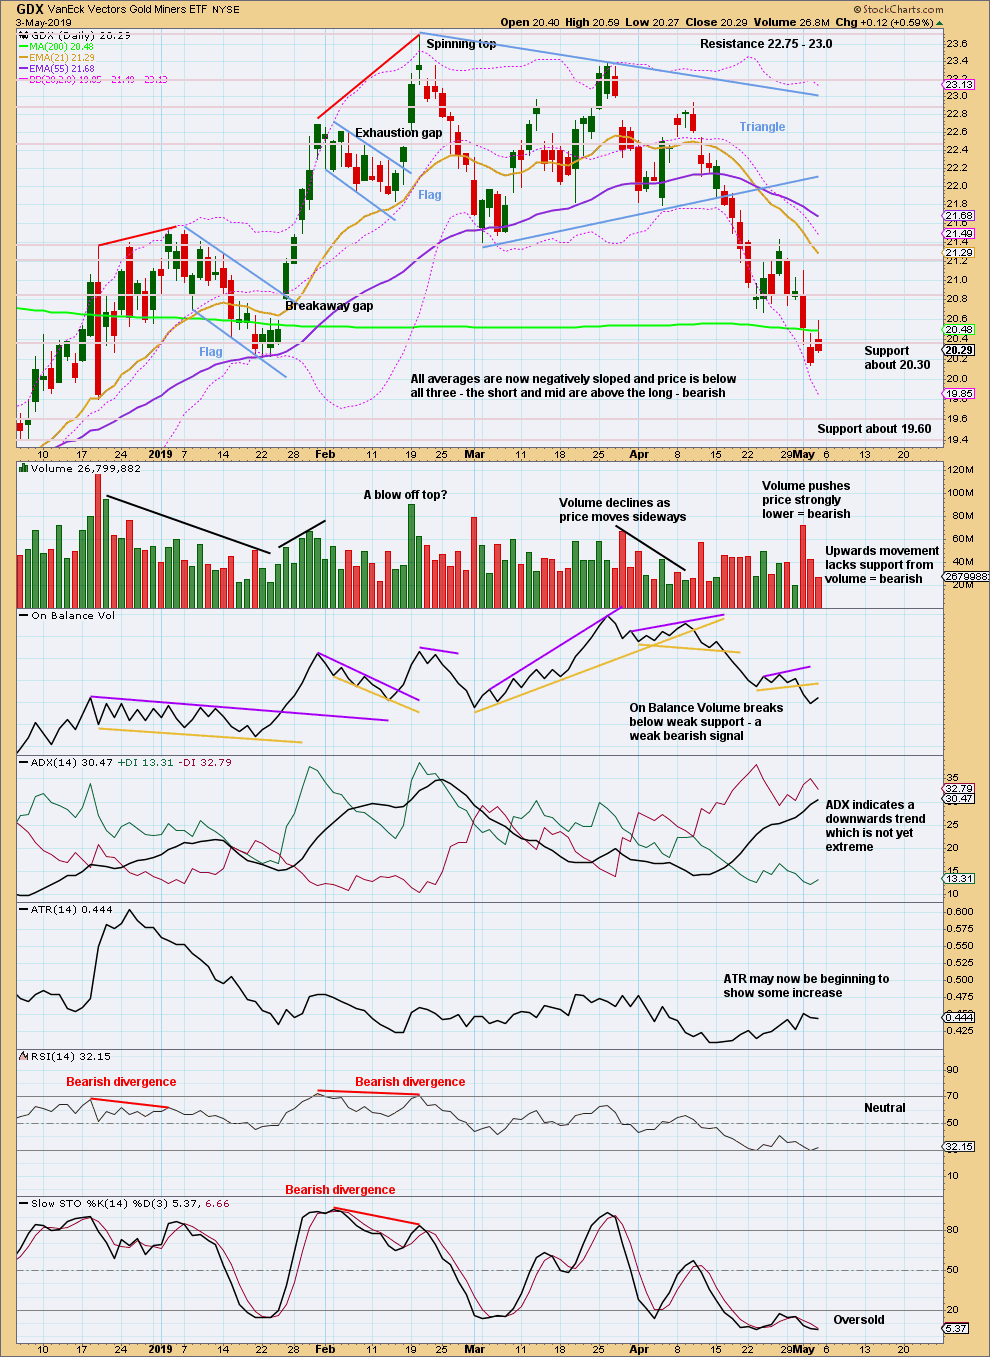
A target calculated from the triangle width is now at 19.58.
US OIL
Downwards movement has unfolded for the week as expected.
Summary: The next wave down may have begun. The final target is now calculated at 10.72.
Further confidence that a high is in place may be had if price makes a new low below 58.20.
MAIN ELLIOTT WAVE COUNT
MONTHLY CHART
Click chart to enlarge.
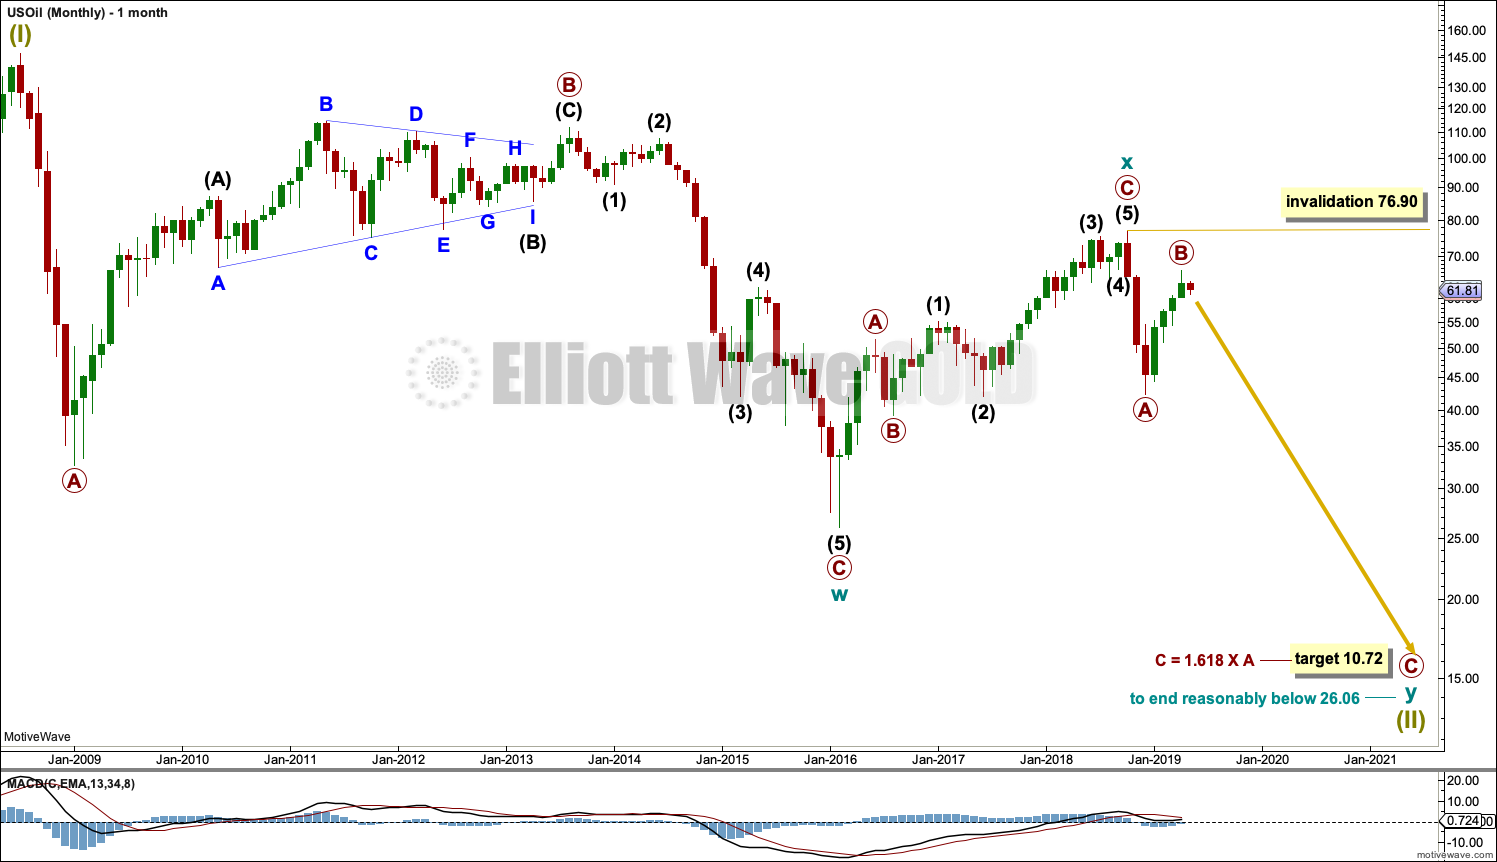
Classic technical analysis favours a bearish wave count for Oil at this time.
The large fall in price from the high in June 2008 to February 2016 is seen as a complete three wave structure. This large zigzag may have been only the first zigzag in a deeper double zigzag.
Upwards movement from February 2016 to October 2018 will not fit readily as a five wave structure but will fit very well as a three. With a three wave structure upwards, this indicates the bear market may not be over.
The first zigzag down is labelled cycle wave w. The double is joined by a now complete three in the opposite direction, a zigzag labelled cycle wave x.
The purpose of a second zigzag in a double is to deepen the correction when the first zigzag does not move price deep enough. Cycle wave y would be expected to move reasonably below the end of cycle wave w to deepen the correction. Were cycle wave y to reach equality with cycle wave w that takes Oil into negative price territory, which is not possible. Cycle wave y would reach 0.618 the length of cycle wave w at $2.33.
A better target calculation would be using the Fibonacci ratios between primary waves A and C within cycle wave y.
Within the zigzag of cycle wave y, primary wave A may have been over at the last low and now primary wave B may be complete. Were primary wave C to reach only equality in length with primary wave A, then cycle wave y would not move beyond the end of cycle wave w. The next Fibonacci ratio in the sequence is used to calculate a target for primary wave C.
If it continues higher, then primary wave B may not move beyond the start of primary wave A above 76.90.
WEEKLY CHART
Click chart to enlarge.
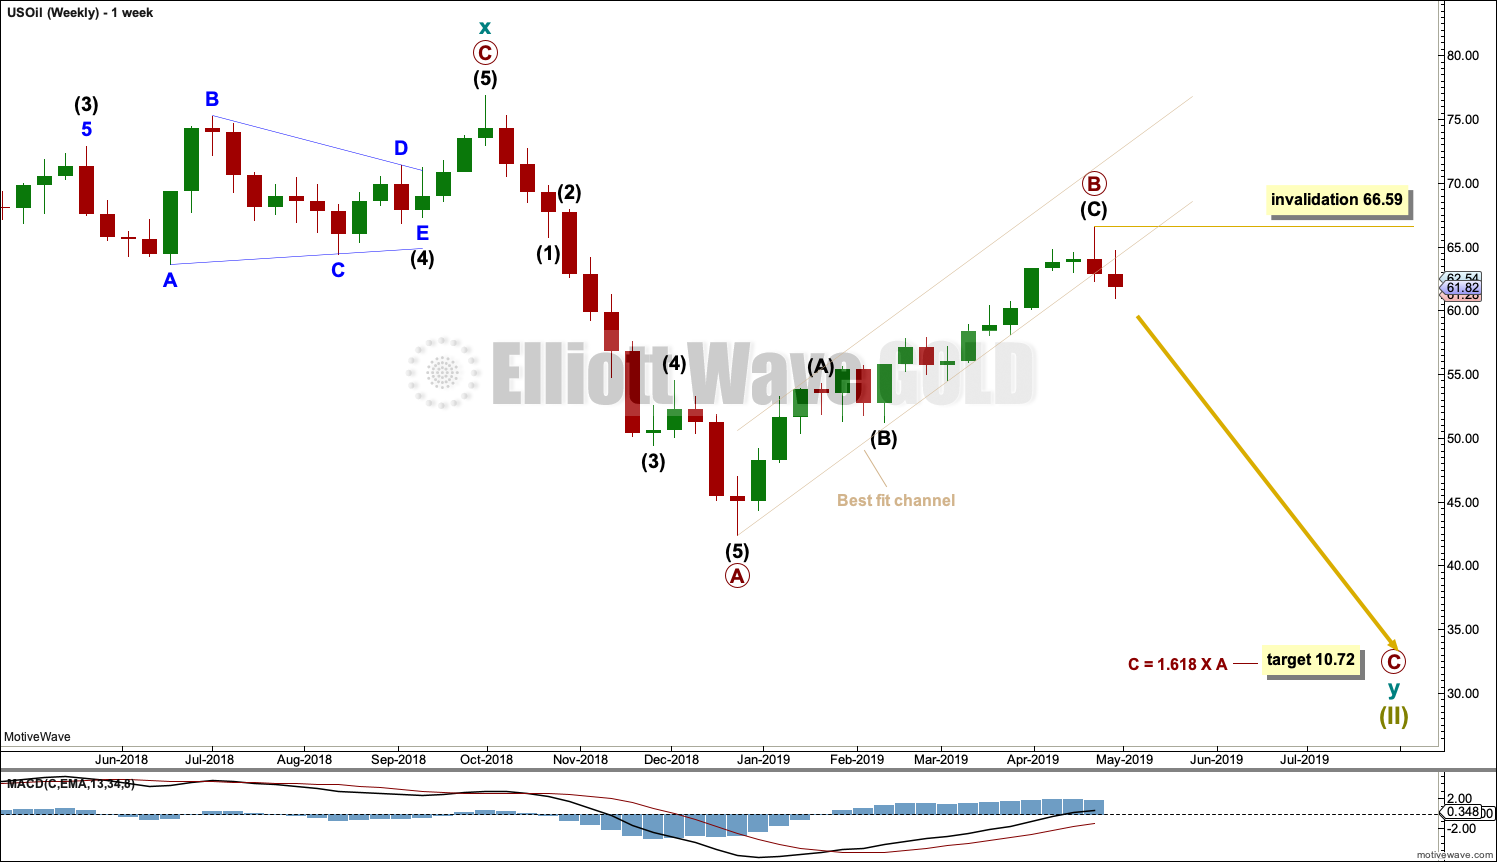
This weekly chart is focussed on the start of cycle wave y.
Cycle wave y is expected to subdivide as a zigzag. A zigzag subdivides 5-3-5. Primary wave A must subdivide as a five wave structure if this wave count is correct.
Primary wave A may be a complete five wave impulse at the last low.
Primary wave B may now be a complete single zigzag at the last high.
Primary wave C may have just begun. Primary wave C must subdivide as a five wave structure.
Within primary wave C, no second wave correction may move beyond its start above 66.59.
DAILY CHART
Click chart to enlarge.
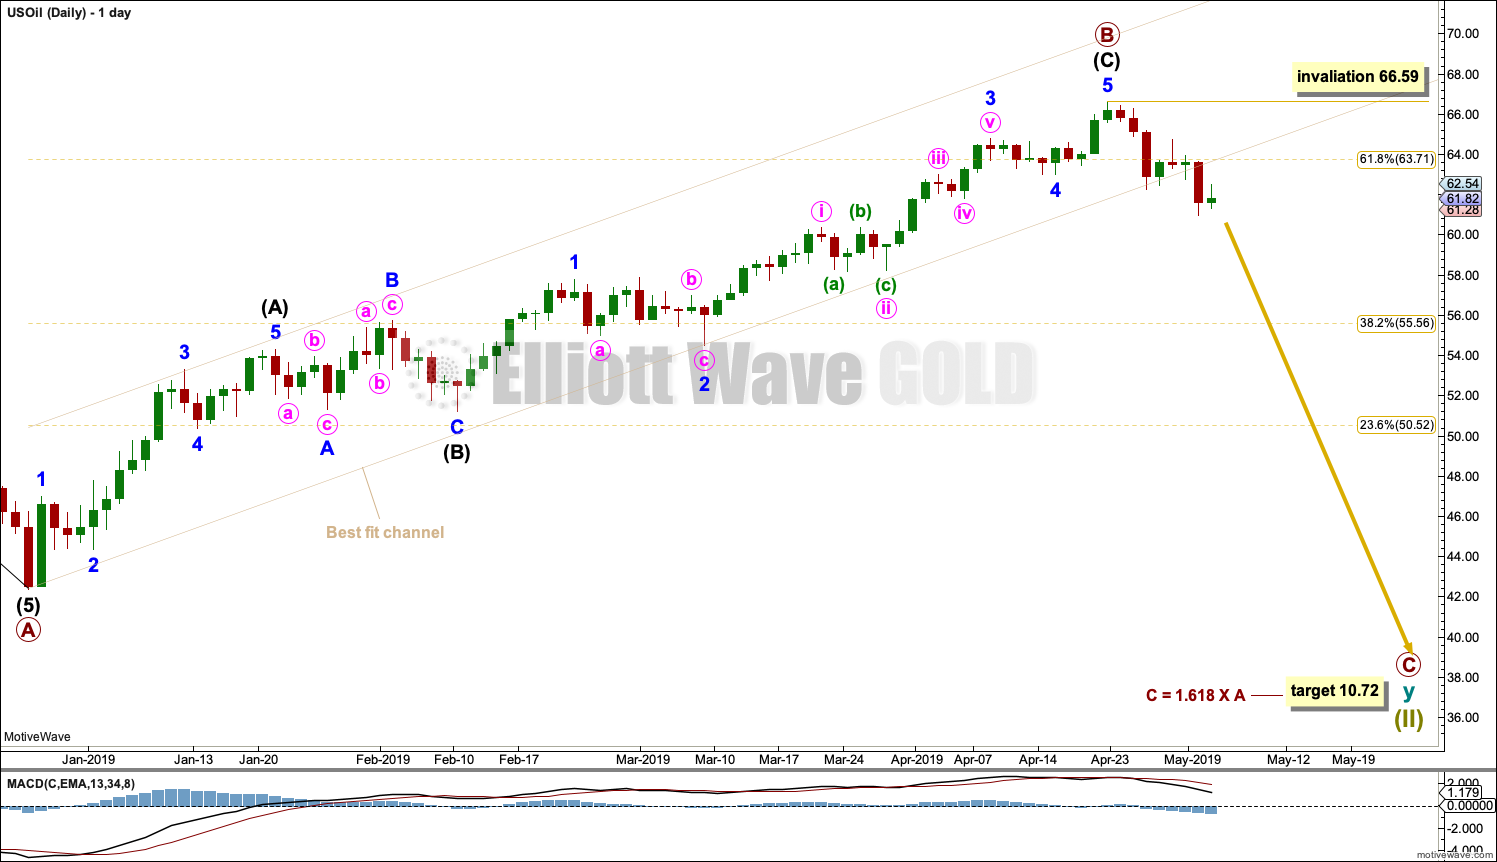
Primary wave B is now labelled as a complete single zigzag.
Note that monthly and weekly charts are on a semi-log scale, but this daily chart is on an arithmetic scale. This makes a slight difference to trend channels. Use this channel on a daily chart on an arithmetic scale.
The channel is drawn conservatively to contain all of the bounce of primary wave B. There is now one full daily candlestick below and not touching the lower edge of this channel, although it is a green daily candlestick. However, the strong red candlestick for Thursday’s session looks like a strong breach of the channel. This adds confidence now to the labelling of primary wave B as complete.
Within primary wave C, no second wave correction may move beyond its start above 66.59.
Primary wave C may last at least a year, and possibly longer. It may be extended in time; the subdivisions of intermediate waves (2) and (4) may show up at the weekly time frame.
TECHNICAL ANALYSIS
MONTHLY CHART
Click chart to enlarge. Chart courtesy of StockCharts.com.
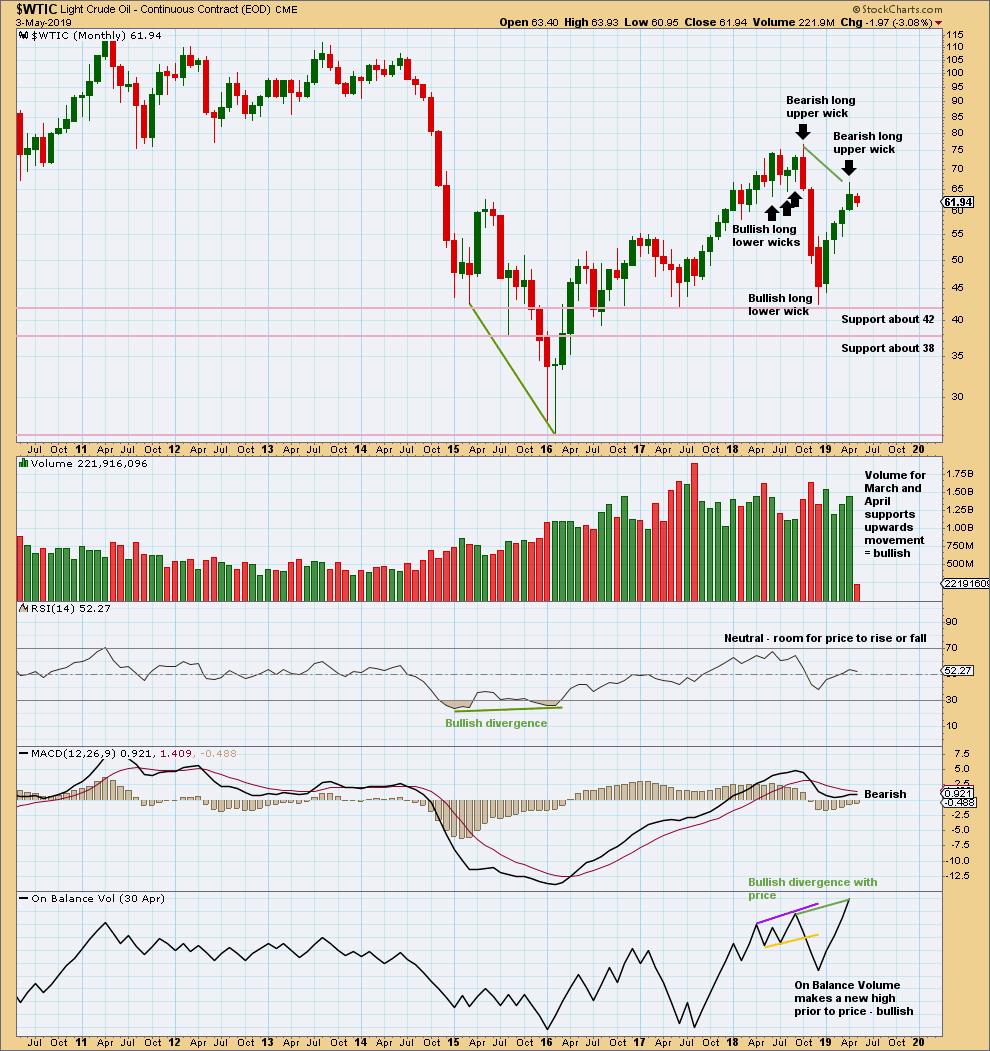
Volume and On Balance Volume are bullish. This suggests the bounce may not be over, and this does not support the Elliott wave count.
The long upper wick on April’s monthly candlestick is bearish. This bearish signal is weaker than the bullish volume profile.
WEEKLY CHART
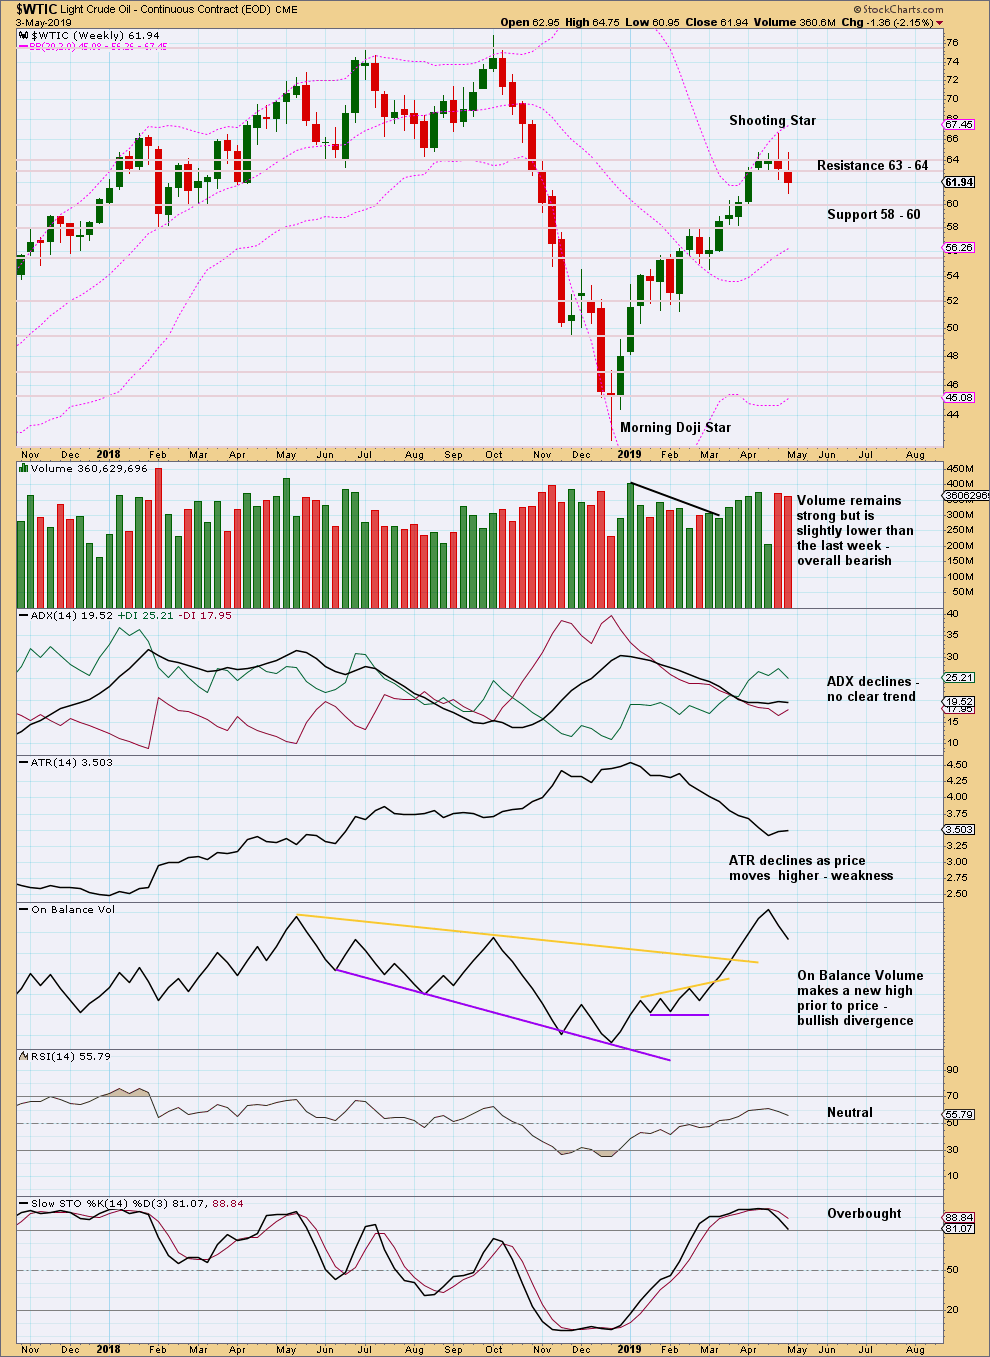
Click chart to enlarge. Chart courtesy of StockCharts.com.
A Shooting Star candlestick pattern is a bearish reversal pattern when it comes at the end of an upwards movement.
DAILY CHART
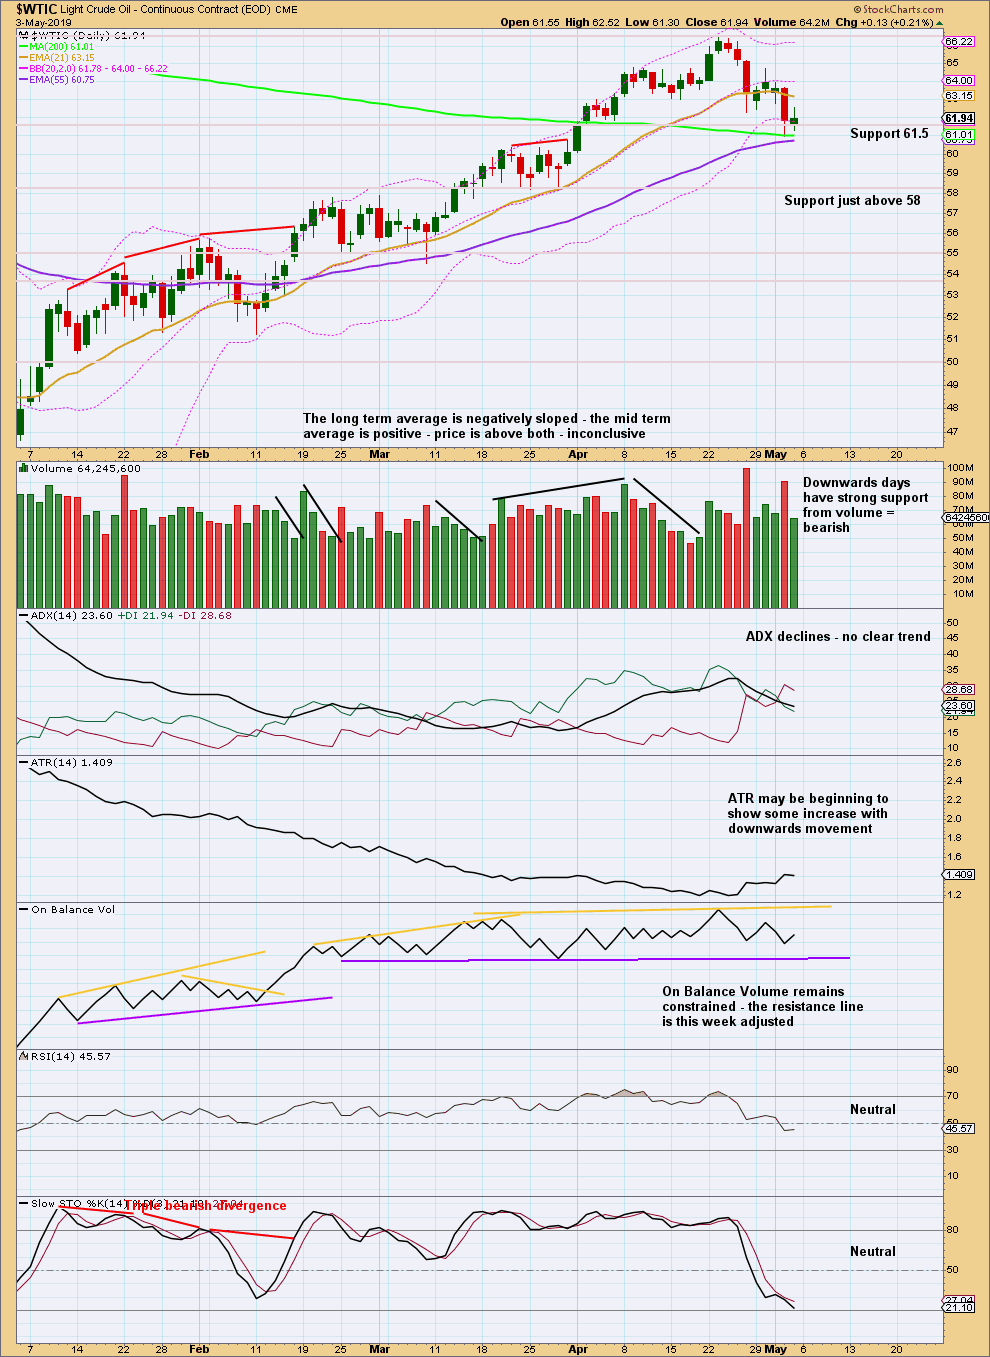
Click chart to enlarge. Chart courtesy of StockCharts.com.
Since the 24th of December 2018 there has been a series of higher highs and higher lows, the basic definition of an upwards trend. Assume this will continue until proven it has ended. A lower low below the low of the 28th of March 2019 at 58.20 would provide evidence the bounce is over.
The short-term volume profile remains fairly strongly bearish and supports the Elliott wave count.
—
Always practice good risk management as the most important aspect of trading. Always trade with stops and invest only 1-5% of equity on any one trade. Failure to manage risk is the most common mistake new traders make.
Now isnt oil making the cutest triangle ?
Beautiful.
I think DUST needs to move a little lower. Up trend still safe, below 19.26 risk goes up. Trend broke on 1 hour time frame I’ll wait until trend corrects or breaks down on higher time frame.
A few gold thoughts:
1) I’m absolutely not ruling out that gold is following the double zigzag scenario and will turn around to the upside in the 1220 to 1200 area (for a Y wave). I think there is a bounce likely at 1200 anyway, but it will be the quality of that bounce that determines if we are going up to new highs over 1350.
2) Everyone pounding their fists that the gold COT report is bullish are completely missing it. Every time there is a decent bounce, the open interest almost always has been contracting – this is BEARISH! Also, when analyzing longs vs. shorts, commercials vs. speculators, etc., what I think the talking heads are saying is the COTs “look” bullish (or bearish depending on their positioning). However, gold could fall $200 an ounce, and then the COT reports might look REALLY bullish, but that’s after another $200 move down. I personally believe trading the COT report is a fools game and is much worse than simply following technical price action, etc. What you want to see if you’re bullish is that as price is going up, open interest is expanding with price.
3) The mining stocks are absolutely screaming that gold and silver are going lower. Those stocks are so weak – I believe there will be fire sale prices of underground gold and silver when these stocks go to zero (bankrupt). It’s the underground market that is driving the above ground price, not vice-versa. There is a wave of defaults coming – get ready to be a buyer when that happens!!!
My 2 cents. But since I’m a trader by nature, I’m willing to evolve my thinking!
I’m not ruling out the double zigzag scenario either, which is why I’m publishing it each day. To remind us constantly it’s a viable alternative scenario.
If this downwards movement doesn’t start to pick up ATR and momentum in the next few weeks, if it continues to look weak, that would support the double ZZ weekly count.
Regarding COT, as far as I can tell its the change in position that is important. When large speculators begin to diverge from price then its time to look for an end to the trend. But also, as far as I can tell, price can continue to some time before a turn so this information is not particularly helpful in any accurate timing. It’s a warning.
Hi Lara, On the SPX, do you have any concerns with the depth of this pullback in wave 4?
None whatsoever. So far there is only a very small overshoot of the lower edge of the Elliott channel. Price has closed within the channel today.
You mentioned the last few days that primary 4 could be a double zigzag or be in the first wave of a triangle. Initially you were talking about a very short duration for primary 4, perhaps two weeks. A triangle would be more time consuming and In the larger picture would it make more sense for primary 4 to be a triangle in terms of the duration thereby putting us a little further out on the end of cycle wave V?
Thanks for your insights
Rich
It could be either / or at this stage actually.
A double zigzag could be over at today’s low. That would see primary 4 exhibit perfect alternation with primary 2, and the zigzag family of corrections do tend to be quicker than flats. It would see primary 2 lasting 9 sessions and primary 4 lasting 6 sessions, good proportion.
Or the double zigzag could be just wave A of a longer lasting triangle. This would still see P2 and P4 exhibit perfect alternation. P4 could remain within the channel, and P4 may be longer lasting than P2. Triangles (and combinations) are the longest lasting corrections.
Hi All,
There was recent discussion on the use of leveraged ETFs when playing the gold trends. What ETFs do you use (if any) to play the Oil trend? I tried using GUSH to play wave B from ~50, but it didn’t make the moves I expected it to recover from it’s drop in December – it was sort of range bound for 3 months. I’m wondering the same would happen with DRIP with oil on the way down.
I use UCO or sco. volume I look at, need high volume to get in an out. I recommend back testing your system before losing money like I did.
Cheers, I’ll add those to my list.
I use DWT. 3x leverage SHORT crude oil…but again, but careful to trim profits and re-load.
For gold, it looks like we have a textbook expanded flat ABC correction taking shape (and almost complete) for the latest in a series of overlapping 1-2s. We are hitting the upper edge of the channel. We are also about to tag the 50 DMA from the underside. It also looks like one more retest of that large H&S neckline and moving up against a more general area of resistance in 1290-1300 area.
If this area holds, then I’d be inclined to really press short positions as the 3-4s play out (e.g. steep declines followed by brief, shallow rallies).
Personally, I’m of the belief gold is headed to 1,000 area by August (if primary count plays out).
It looks like this little bounce ended a few hours ago, falling just a little short of the upper edge of my base channel, and with the smallest overshoot of the little channel that contains the little correction.
It’s not an expanded flat though, they require wave B to be 1.05 or longer in relation to wave A. It’s a regular flat, they have wave B which is from 0.9 to 1.05 X wave A. In this instance wave B is 0.99 X wave A. Regular flats usually fit neatly into their trend channels and wave C is usually about = wave A.
Hi Lara! Yeah, I was expecting gold to push a little higher than it ultimately did today. It would be welcome to have a $25 down day tomorrow to kick off a third wave, but I’m also mentally prepared if there’s one more move up 😉
Lara,
This is getting a bit deep for a triangle. We just clipped the .382 retracement from march 8th wave 2 low. It looks like a nice sharp for a 4th wave that could finish Friday. 2837 needs to hold, which it should. 2837 is approximate 50% retracement.
Any thoughts?
I’ll assume you’re referring to the S&P500 (given numbers).
I now have primary 4 as an incomplete double zigzag. This would offer perfect alternation with the flat of primary 2.
I’m now looking for P4 to end if price touches the lower edge of the maroon Elliott channel. Use that, on a semi-log scale, on the daily chart.
It could of course also be a triangle, and this could be only wave A. One of the five sub-waves of a triangle usually subdivides as a double zigzag. While that is most commonly wave C, it may be any triangle sub-wave.
A triangle would still give perfect alternation with primary wave 2, and it would give very nice proportion. It would remain contained within the channel.
Hi Lara,
(S&P 500)
I am replying (and continuing the conversation) about your comment:
“I’m really interested in the implications for the economy over the next decade or so from that alternate.”
I look at the professionals on CNBC and most of them are still trying to find a top and do not believe this rally. This is like 1995 again where the S&P 500 took off and never came back… The Nasdaq bubble occurred afterwards until 2000. Gold and Oil had bear markets during that period. The Fed was dovish in 1995 after it was hawkish in 1994. All this action that we are seeing today almost matches the conditions we had in 1994-95. There is a massive a wall of worry in the stock market and we had a significant pullback in 2018… Even if we are doing all time highs currently, nobody is celebrating it.
I think the economy is affected by the massive advances in technology which is a huge deflationary force… This paradigm is causing a massive delay in the inevitable crash.
Companies in the cloud space are doing all time highs: CRM, HUBS, ADBE, TEAM, NOW, AYX, MSFT, VMW, OKTA, COUP, DATA, MDB, SPLK, TWLO, WDAY… All of these will probably go into a massive bubble in the next decade.
An example of technology advancement, DIS (Disney), a big mega cap, made a massive break out on strong volume from a very constrictive 3 year range… This is very significant… And this break out was because of a change in technology for this company… They will be adopting the internet to stream of their content on their own. Companies around the world will be changing their business models to adopt the cloud, data analytics and AI.
Currently, I give the $VIX lower weight because it is near the long term lows and it crashed on Friday… When the $VIX is between 10-15 (all time low range), it has a lot of noise… I am giving a lot more weight on the AD line and the QQQ:SPX ratio… The QQQ:SPX is measuring how strong the technology and healthcare sectors compared to the S&P 500 as they have driven this bull market since 2003. QQQ was not affected as much as the S&P 500 during the 2008 crash.
Overall, I continue to be much more supportive of your alternate monthly count…
All the best to you,
Mathieu
$RUT (small caps) outperforms the other US indices on a really bad morning… The markets are very resilient… This is all good news for the S&P 500… The only thing I can say is that it is very bullish.
Thanks for your comments Mathieu.
I agree, the outlook may possibly be much more bullish than most analysts or commentators are considering.
From an EW perspective, the new all time high last week has invalidated a wave count which saw a bear market having just begun. There must be a few interesting gyrations going on with figuring out new wave counts for a few people.
Thanks Lara…
I know that you don’t read the news…. Out of the blue, just like that, Trump stirred the trade talks and the markets sold off on a dime, fulfilling the expanded flat…
The rise of the AD line is pretty incredible currently… A lot of professionals missed this enormous rise since Christmas Eve…. And they are still negative. This continues to be the most hated bull market ever.
Mathieu
Usually I don’t listen to Warren Buffet because he says basically the same thing every year….
But he peaked my curiosity when he said: “I think stocks are ridiculously cheap if you believe … that 3% on the 30-year bonds makes sense,”
I do read the news, but it’s almost exclusively focused on NZ local news. I do tend to avoid news about anything to do with the US political scene so I don’t know what they’re up to mostly.
A contrarian view point may say that a most hated bull market may well be a very good opportunity.
agreed
Not a professional but I missed this rally from Christmas but in reality I didn’t. I didn’t add anymore just waited and took a bunch out once the 2800 level was reached. This bull is old and grey 🙂 I didn’t like how this larger degree wave finished at Christmas so I’ve left the option open this is a larger degree 4th wave.
Lara,
Add John Oliver to your tv watching list. His 30 minute show should be all you need to understand the craziness going on across the pond 🙂
Oh yeah, John Oliver is hilarious! I do see bits of stuff from him from time to time.
Also, Jonathan Pie. Love him too.