

S&P 500
Price closed back within the channel and remains above the invalidation point.
Summary: The upwards trend may now resume.
The final target remains the same at 3,045. A new limit for this fifth wave to end is now at 3,057.25.
The biggest picture, Grand Super Cycle analysis, is here.
Monthly charts were last published here, with video here. There are two further alternate monthly charts here. Video is here.
ELLIOTT WAVE COUNTS
The two Elliott wave counts below will be labelled First and Second rather than main and alternate as they may be about of even probability. When the fifth wave currently unfolding on weekly charts may be complete, then these two wave counts will diverge on the severity of the expected following bear market. To see an illustration of this future divergence monthly charts should be viewed.
FIRST WAVE COUNT
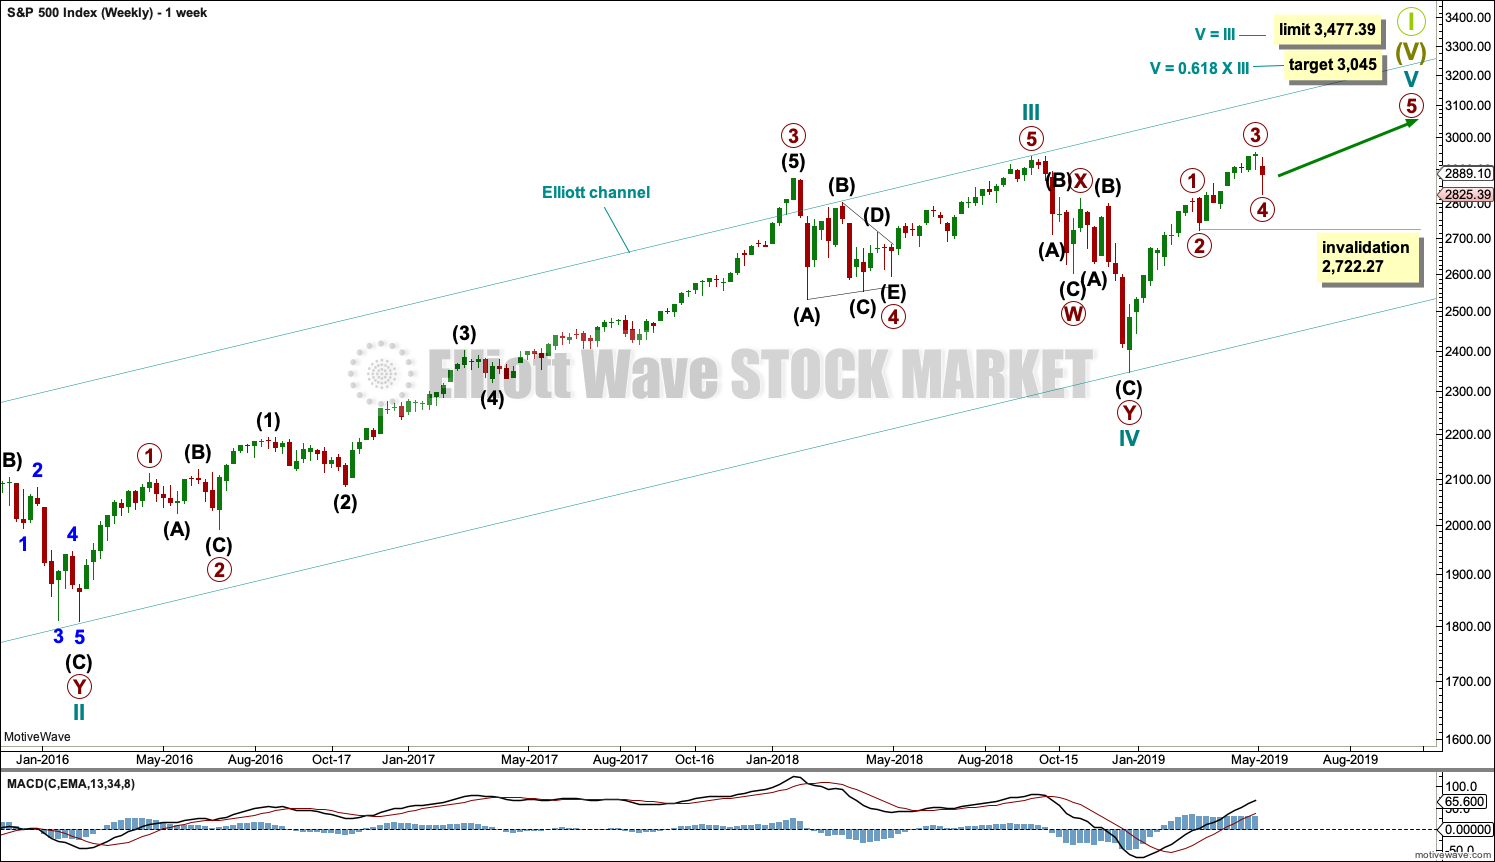
WEEKLY CHART
Click chart to enlarge.
The basic Elliott wave structure consists of a five wave structure up followed by a three wave structure down (for a bull market). This wave count sees the bull market beginning in March 2009 as an incomplete five wave impulse and now within the last fifth wave, which is labelled cycle wave V. This impulse is best viewed on monthly charts. The weekly chart focusses on the end of it.
Elliott wave is fractal. This fifth wave labelled cycle wave V may end a larger fifth wave labelled Super Cycle wave (V), which may end a larger first wave labelled Grand Super Cycle wave I.
The teal Elliott channel is drawn using Elliott’s first technique about the impulse of Super Cycle wave (V). Draw the first trend line from the end of cycle wave I (off to the left of the chart, the weekly candlestick beginning 30th November 2014) to the end of cycle wave III, then place a parallel copy on the end of cycle wave II. This channel perfectly shows where cycle wave IV ended at support. The strongest portion of cycle wave III, the end of primary wave 3, overshoots the upper edge of the channel. This is a typical look for a third wave and suggests the channel is drawn correctly and the way the impulse is counted is correct.
Within Super Cycle wave (V), cycle wave III is shorter than cycle wave I. A core Elliott wave rule states that a third wave may never be the shortest. For this rule to be met in this instance, cycle wave V may not be longer in length than cycle wave III. This limit is at 3,477.39. This limit may still apply if the degree of labelling within cycle wave V is changed all down one degree.
A final target is calculated at cycle degree for the impulse to end.
The structure of cycle wave V is focussed on at the daily chart level below.
Note that at the end of this week the invalidation point on weekly charts is moved down to the start of primary wave 3 to allow for the alternate idea published below on a daily chart.
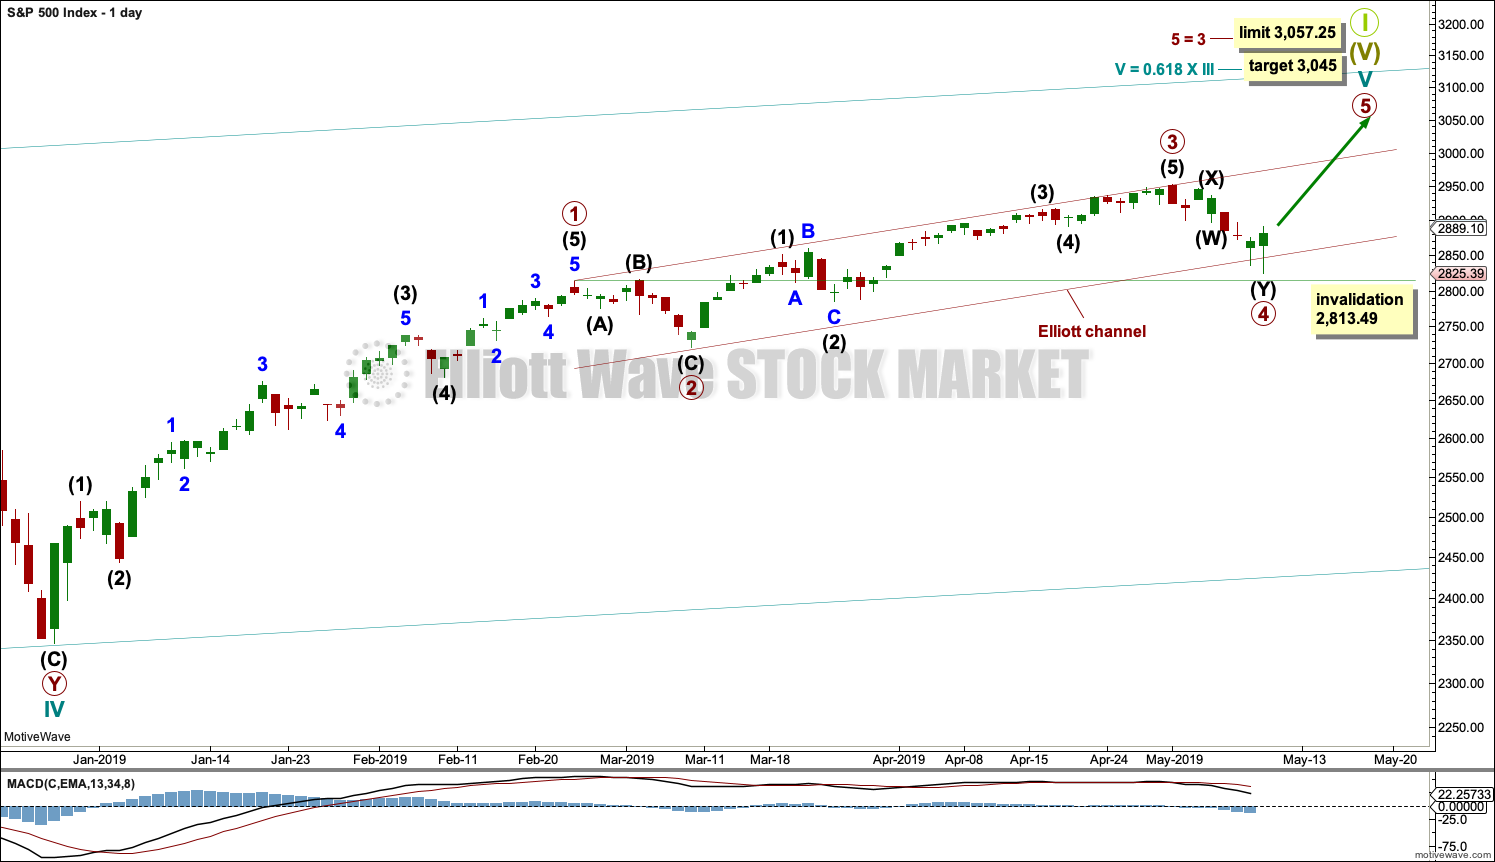
DAILY CHART
Click chart to enlarge.
Cycle wave V so far looks to be unfolding as an impulse, which is the most common structure for a fifth wave. The only other possible structure is an ending diagonal. A diagonal would be considered only if overlapping suggests it.
Within the impulse, primary waves 1, 2, 3 and 4 may be complete. The final wave of primary wave 5 may now continue higher.
Use Elliott’s technique to draw a channel about this impulse. Draw the first trend line from the ends of primary waves 1 to 3, then place a parallel copy on the end of primary wave 2. Primary wave 4 may have ended with a small overshoot of the channel. Primary wave 5 may now find resistance at the upper edge.
Primary wave 2 unfolded as a flat correction. Primary wave 4 may have exhibited alternation in structure with primary wave 2 as a double zigzag.
If it continues any lower, then primary wave 4 may not move into primary wave 1 price territory below 2,813.49.
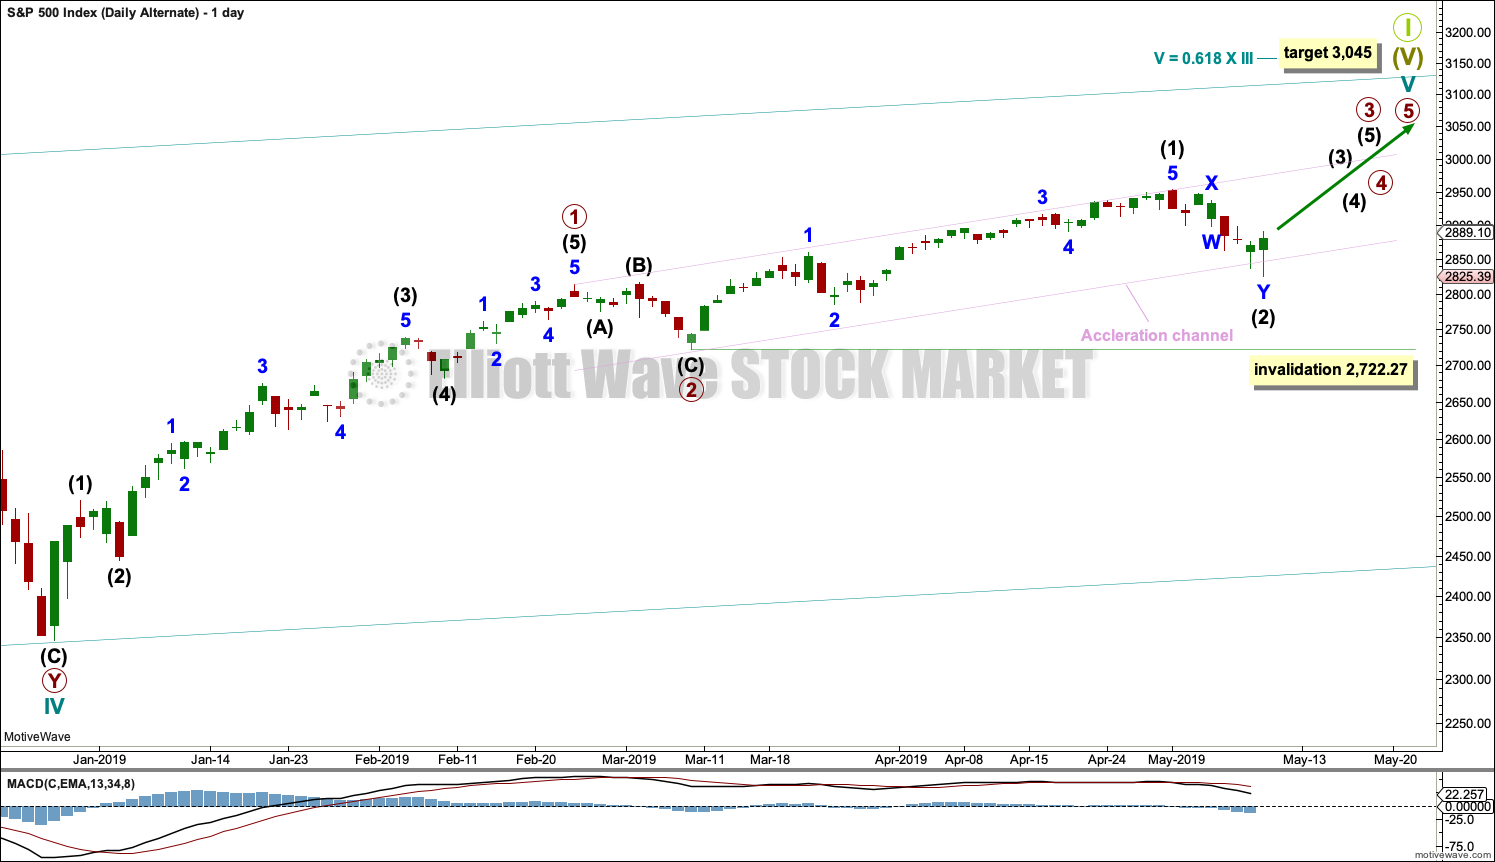
ALTERNATE DAILY CHART
Click chart to enlarge.
If the first daily chart is invalidated by a new low below 2,813.49, then this alternate wave count would be used.
Within the five wave impulse of cycle wave V, it is possible that only primary waves 1 and 2 may be complete. Primary wave 3 may be extending.
Primary wave 3 may only subdivide as a five wave impulse. Within primary wave 3, intermediate waves (1) and now possibly (2) may be complete. If intermediate wave (2) continues lower, it may not move beyond the start of intermediate wave (1) below 2,722.27.
This alternate wave count is the same as the first daily chart with the exception of the degree of labelling within primary wave 3. This wave count moves it all down one degree.
SECOND WAVE COUNT
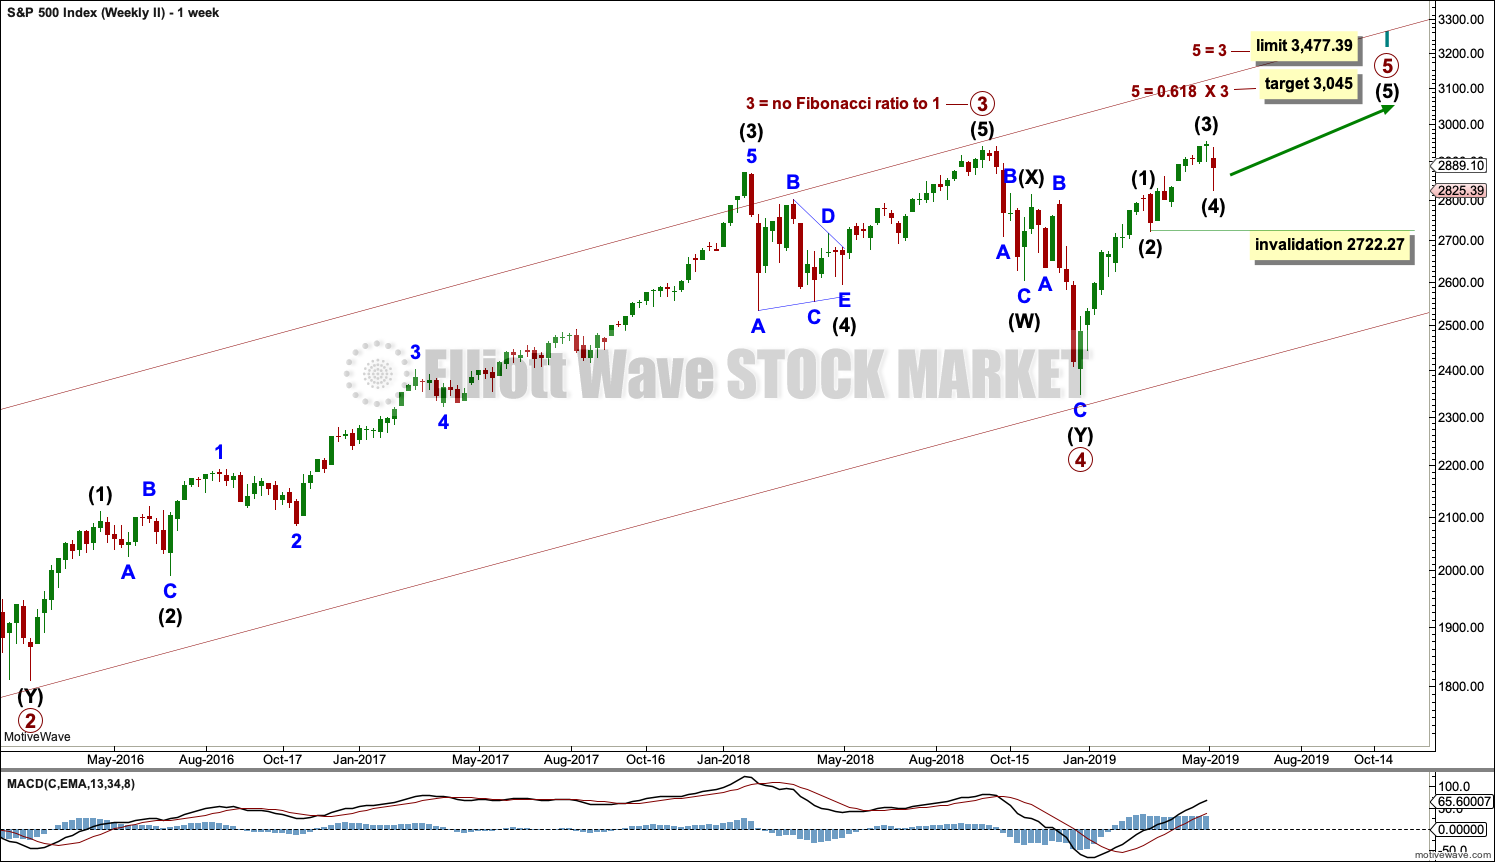
WEEKLY CHART
Click chart to enlarge.
This weekly chart is identical to the first weekly chart, with the sole exception being the degree of labelling.
This weekly chart moves the degree of labelling for the impulse beginning in March 2009 all down one degree. This difference is best viewed on monthly charts.
The impulse is still viewed as nearing an end; a fifth wave is still seen as needing to complete higher. This wave count labels it primary wave 5.
TECHNICAL ANALYSIS
WEEKLY CHART
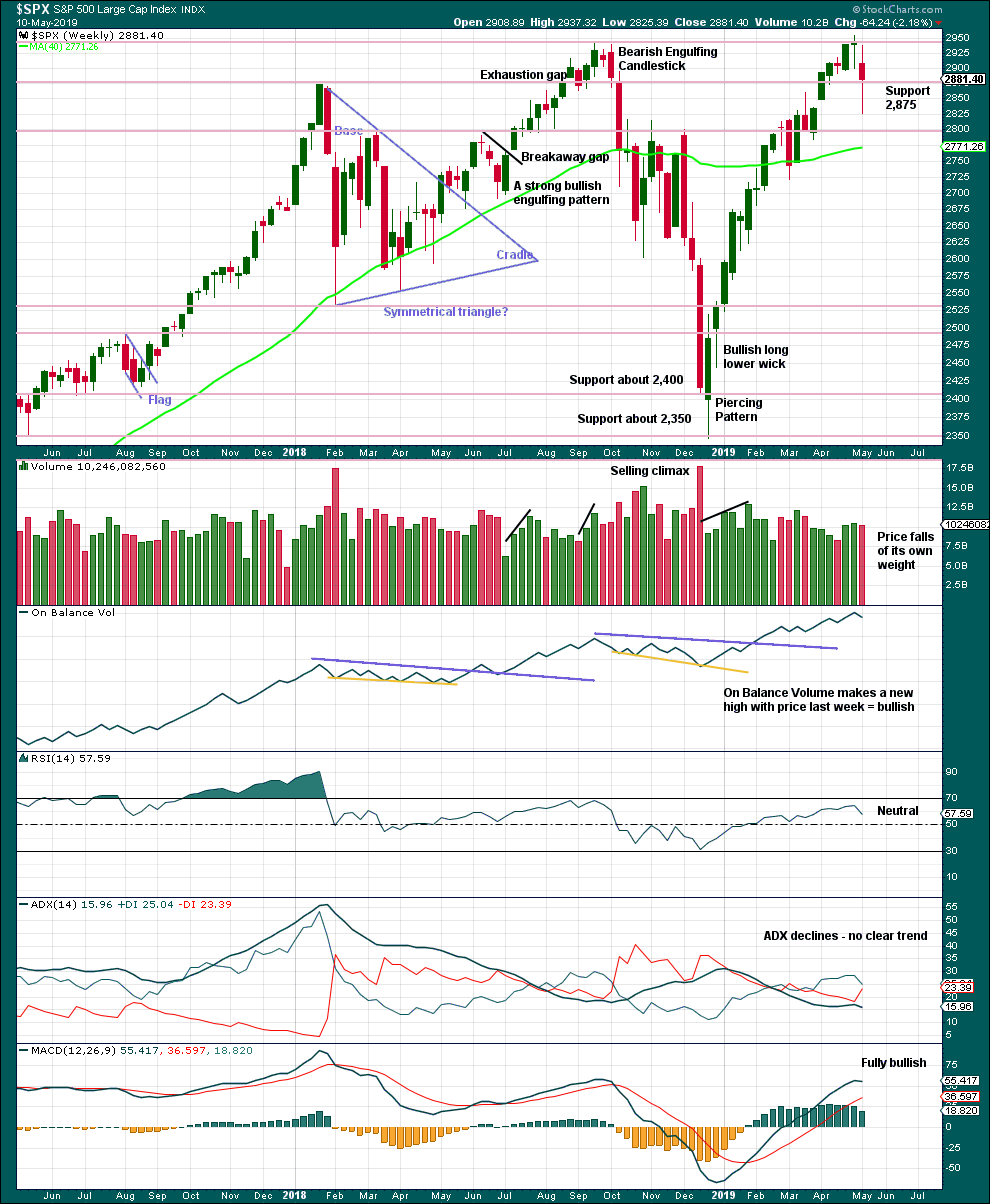
Click chart to enlarge. Chart courtesy of StockCharts.com.
The longer lower wick this week is bullish, but the reasonable length of the upper wick reduces the bullishness here.
DAILY CHART
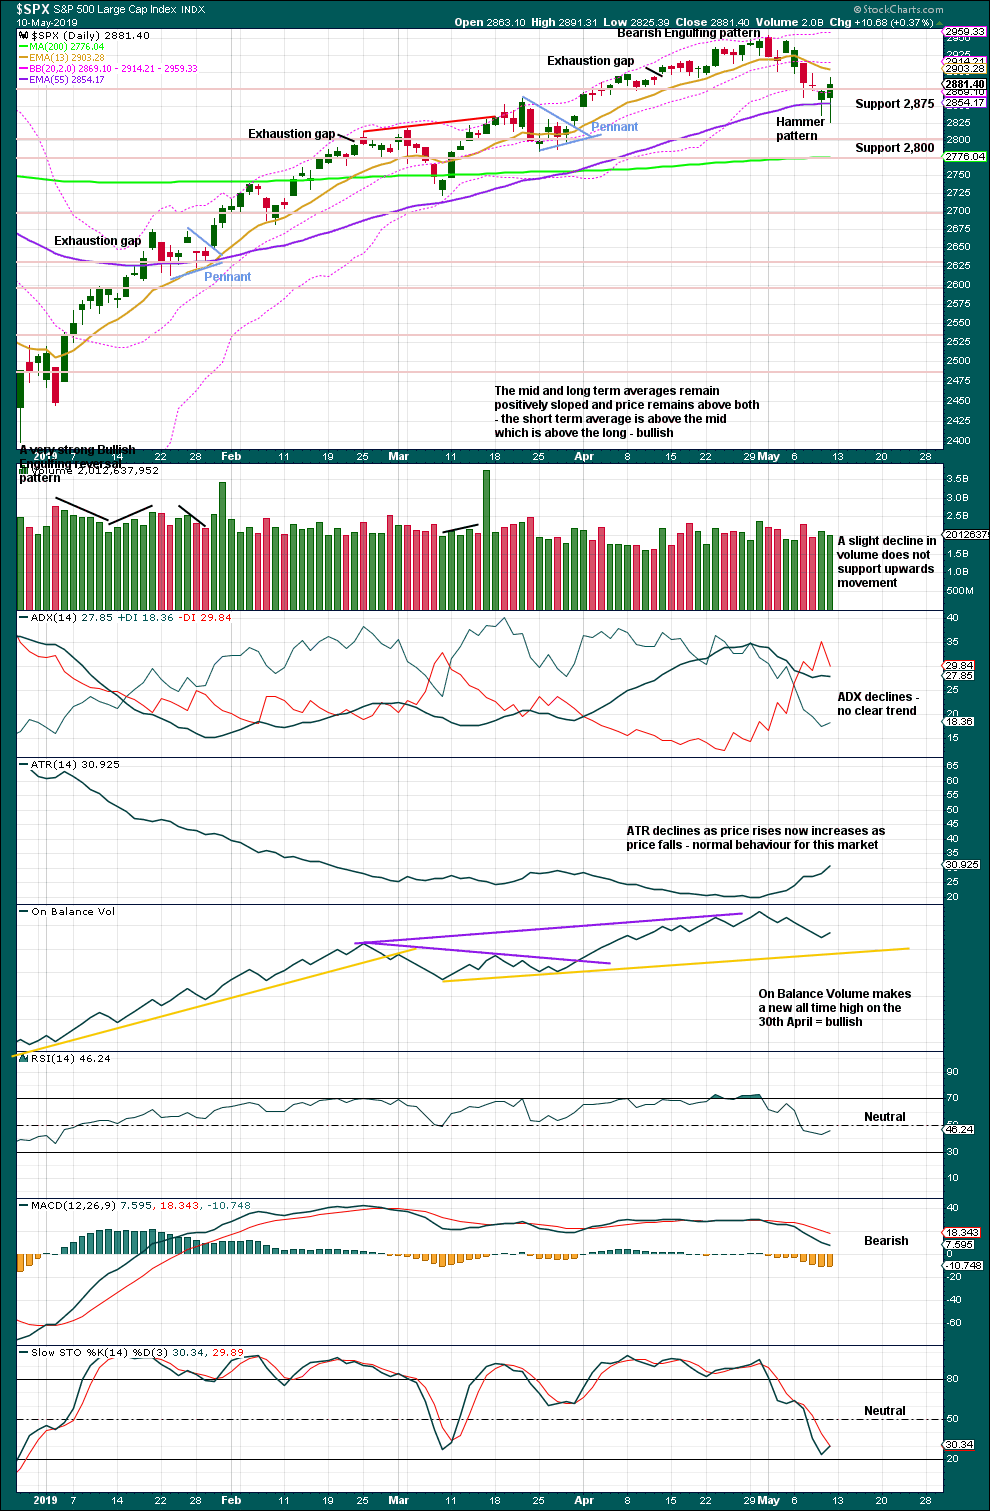
Click chart to enlarge. Chart courtesy of StockCharts.com.
A Hammer candlestick coming after a short fall in price is a bullish reversal pattern. Now two long lower wicks on the last two daily candlesticks look more bullish.
BREADTH – AD LINE
WEEKLY CHART
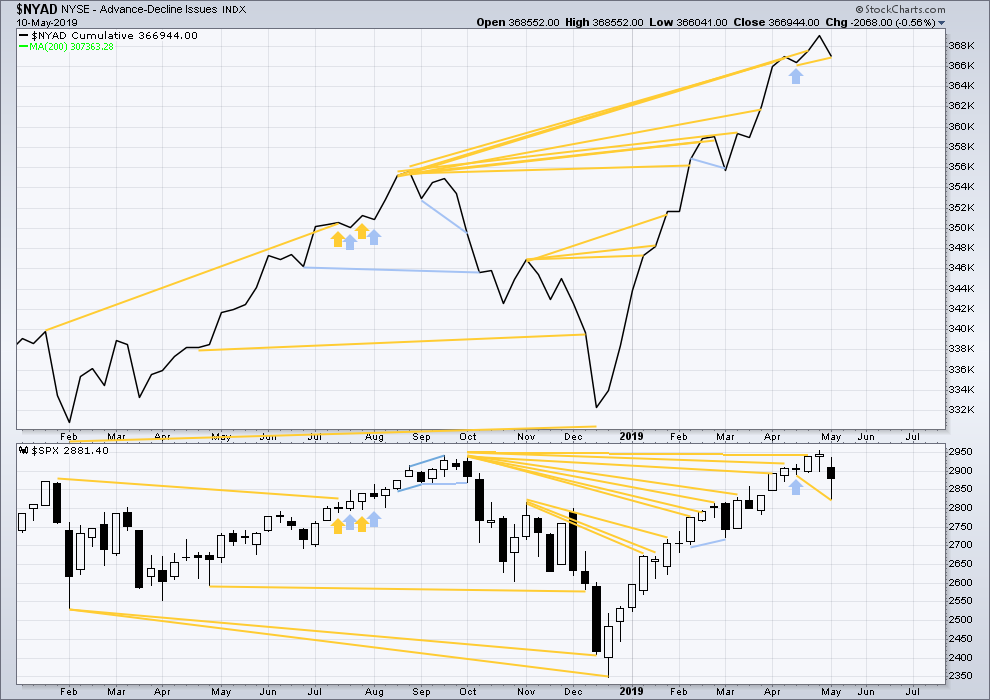
Click chart to enlarge. Chart courtesy of StockCharts.com. So that colour blind members are included, bearish signals
will be noted with blue and bullish signals with yellow.
Every single bear market from the Great Depression and onwards has been preceded by a minimum of 4 months divergence between price and the AD line. With the AD line making a new all time high again last week, the end of this bull market and the start of a new bear market must be a minimum of 4 months away, which is the beginning of September 2019 at this time.
This week price has made a new low below the low three weeks prior, but the AD line has not. Downwards movement in price this week has not come with a corresponding decline in market breadth. This divergence is bullish for the short term.
This week all of large, mid and small caps have moved lower. None have made new swing lows below the low of the 25th of March. There is no divergence.
DAILY CHART
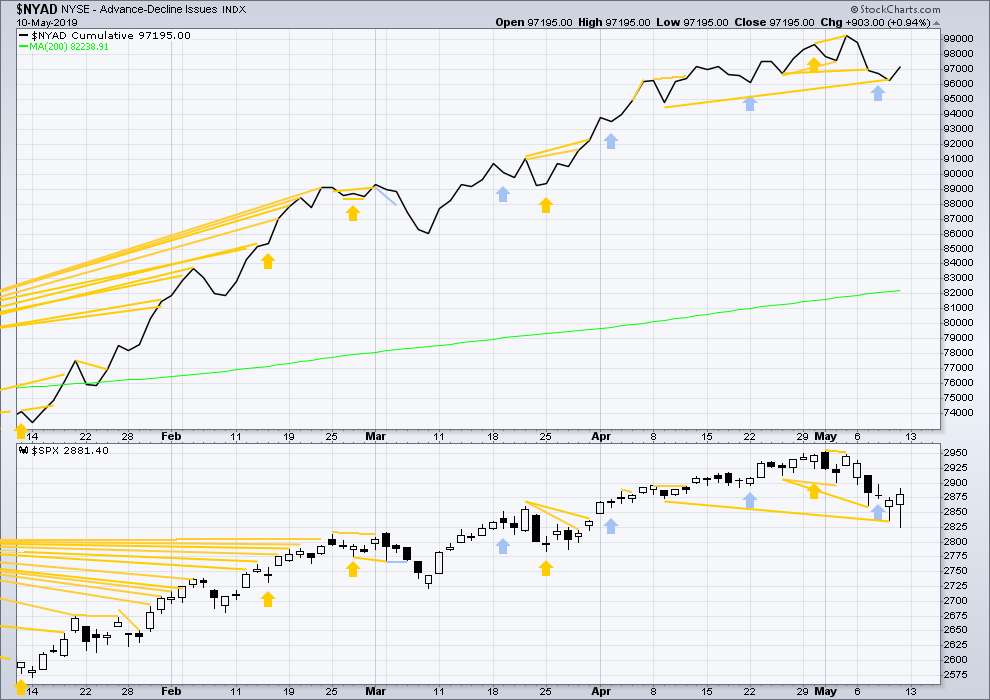
Click chart to enlarge. Chart courtesy of StockCharts.com. So that colour blind members are included, bearish signals
will be noted with blue and bullish signals with yellow.
Breadth should be read as a leading indicator.
Bullish mid-term divergence remains. On Friday price completed an outside day, which closed green. Upwards movement within the session has support from rising market breadth.
VOLATILITY – INVERTED VIX CHART
WEEKLY CHART
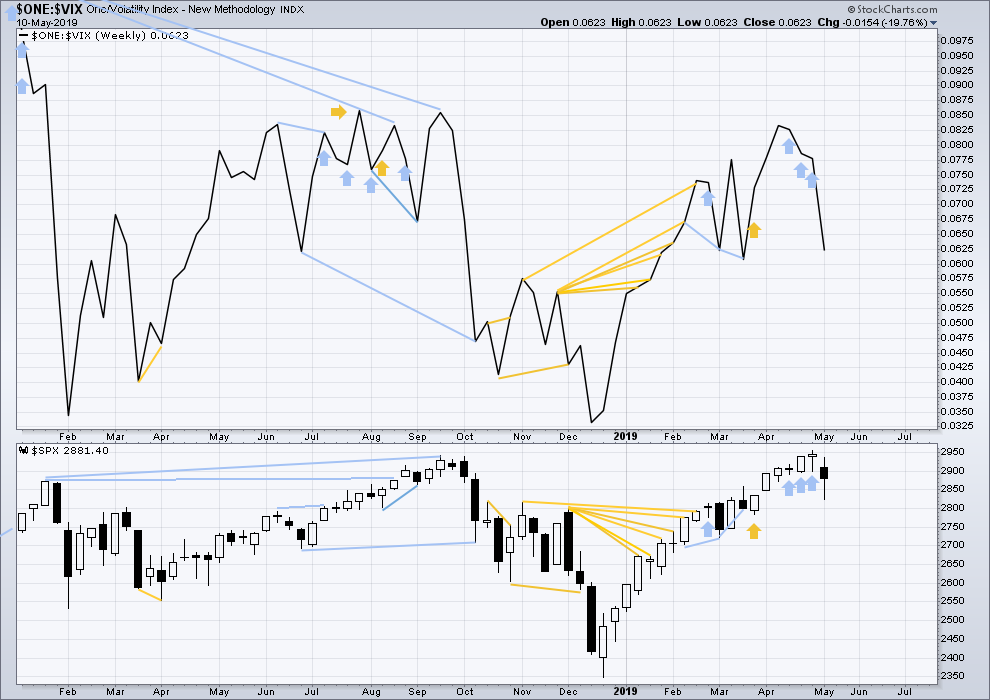
Click chart to enlarge. Chart courtesy of StockCharts.com. So that colour blind members are included, bearish signals
will be noted with blue and bullish signals with yellow.
Three weeks in a row of weekly bearish divergence has now been followed by a reasonable downwards week. It may be resolved here, or it may yet be an indication of further downwards movement in price.
This week both price and inverted VIX have moved lower. Inverted VIX is not moving any faster than price. There is no short-term divergence.
DAILY CHART
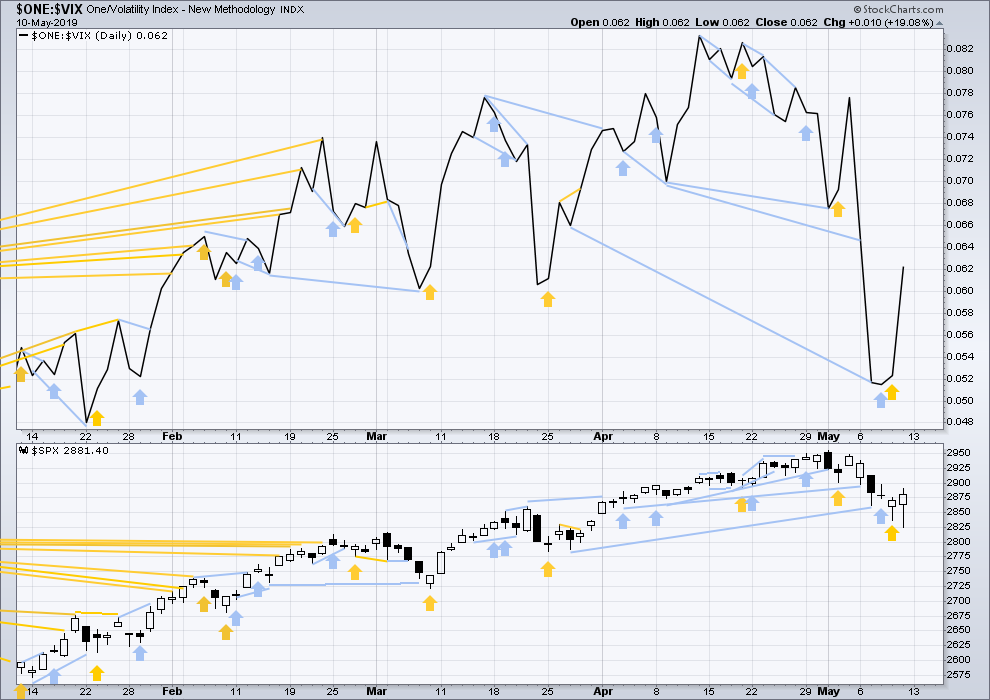
Click chart to enlarge. Chart courtesy of StockCharts.com. So that colour blind members are included, bearish signals
will be noted with blue and bullish signals with yellow.
Bullish divergence noted in last analysis has now been followed by an outside day, which has closed green. It may now be resolved.
Friday’s outside day closed green and comes with a strong increase in inverted VIX. A strong decline in VIX on Friday is bullish.
DOW THEORY
Dow Theory confirmed a bear market in December 2018. This does not necessarily mean a bear market at Grand Super Cycle degree though; Dow Theory makes no comment on Elliott wave counts. On the 25th of August 2015 Dow Theory also confirmed a bear market. The Elliott wave count sees that as part of cycle wave II. After Dow Theory confirmation of a bear market in August 2015, price went on to make new all time highs and the bull market continued.
DJIA: 23,344.52 – a close on the 19th of December at 23,284.97 confirms a bear market.
DJT: 9,806.79 – price has closed below this point on the 13th of December.
S&P500: 2,532.69 – a close on the 19th of December at 2,506.96 provides support to a bear market conclusion.
Nasdaq: 6,630.67 – a close on the 19th of December at 6,618.86 provides support to a bear market conclusion.
With all the indices moving now higher, Dow Theory would confirm a bull market if the following highs are made:
DJIA: 26,951.81
DJT: 11,623.58
S&P500: 2,940.91 – a new all time high has been made on the 29th of April 2019.
Nasdaq: 8,133.30 – a new high has been made on 24th of April 2019.
GOLD
A small range upwards week remains within the channel and below the invalidation point. The Elliott wave counts remain the same, and all expect the same direction next week.
Summary: Expect the downwards trend to resume. Look out now for a possible strong increase in downwards momentum.
The mid-term Elliott wave target is at 1,220. The classic analysis target is at 1,217. Risk is just above the upper edge of the base channel on the daily chart.
Three long-term targets are now calculated for cycle wave c to end. Confidence in a new downwards trend may be had with a new low below 1,160.75.
Grand SuperCycle analysis is here.
Last monthly charts are here. Video is here.
MAIN ELLIOTT WAVE COUNT
WEEKLY CHART – TRIANGLE
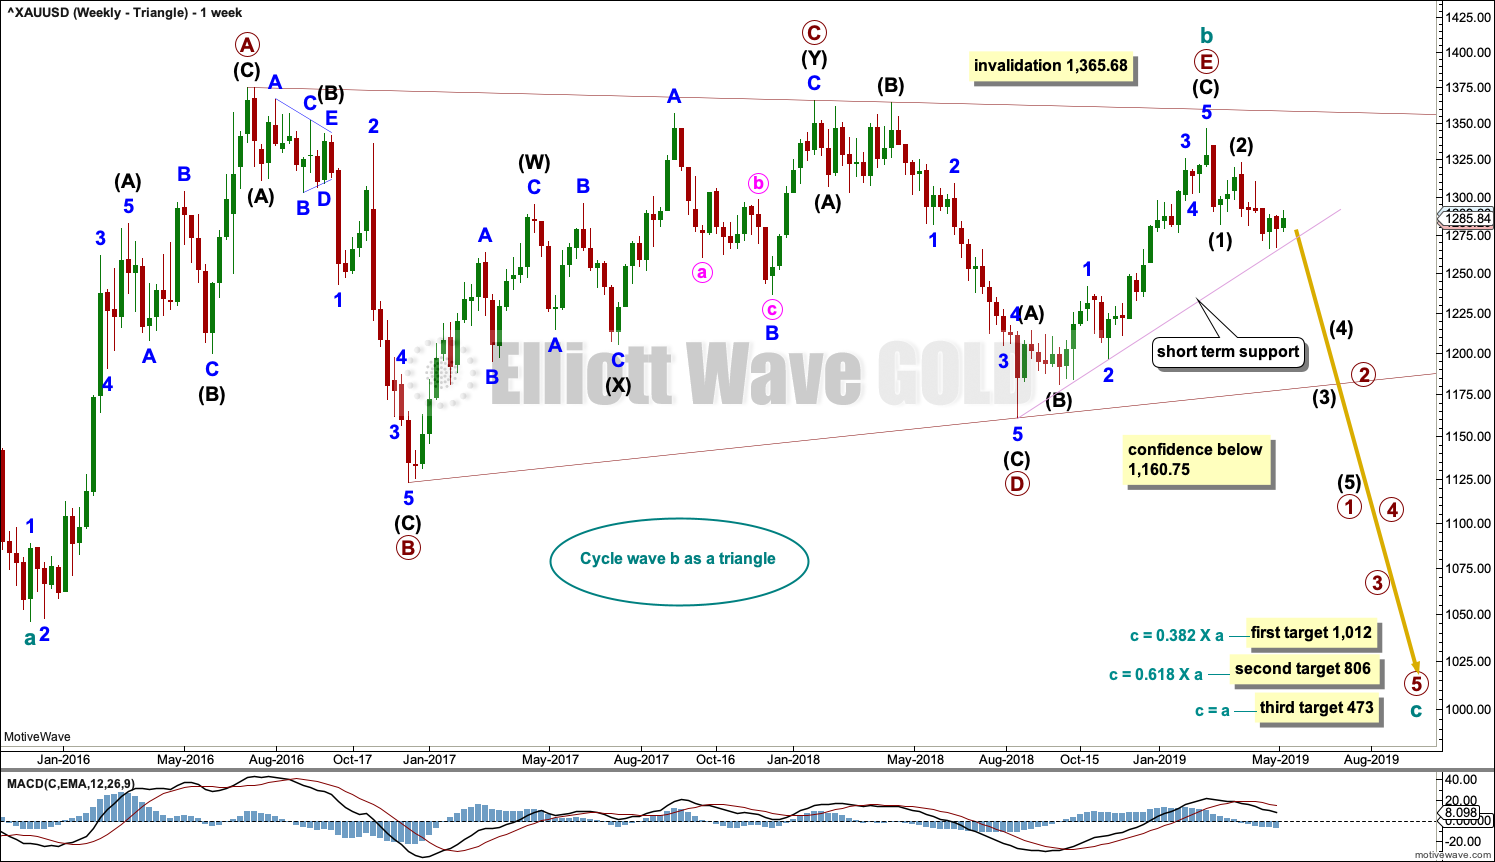
Click chart to enlarge.
The basic Elliott wave structure is five waves up followed by three waves back (in a bull market). At this time, the preferred Elliott wave count sees Gold as still within three waves back, which began at the all time high in September 2011.
Five waves up are labelled 1,2,3,4,5. Three waves back are labelled A,B,C.
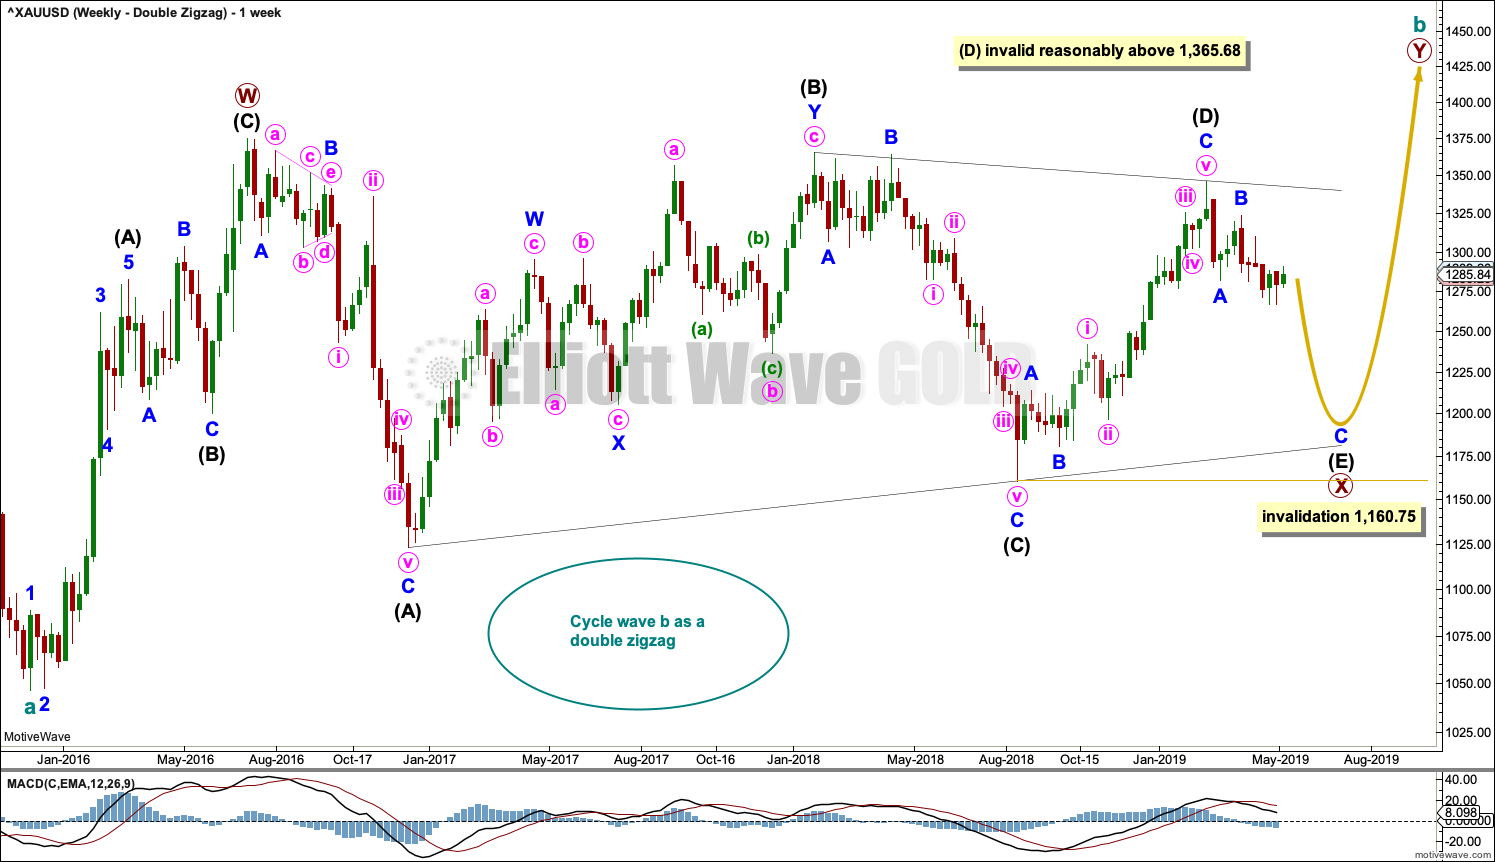
This wave count sees Gold as now about two thirds through the three waves back. The three wave structure is labelled cycle waves a, b and now c just beginning. The Elliott wave corrective structure at Super Cycle degree is a zigzag, which subdivides 5-3-5. Cycle wave a subdivides as a five, cycle wave b is a complete structure, and now cycle wave c is expected to subdivide as as five wave structure.
Cycle wave b for this wave count is seen as a complete regular contracting triangle. Triangles are reasonably common structures for B waves, and the most common type of Elliott wave triangle is a regular contracting triangle.
Within the five sub-waves of an Elliott triangle, one sub-wave usually subdivides as a more complicated double zigzag and the most common sub-wave to do so is wave C. Contracting triangles most commonly end with wave E falling short of the A-C trend line. This triangle follows the most common pattern, and it must be judged in Elliott wave terms to have a high probability.
Within a zigzag, cycle wave c may exhibit a Fibonacci ratio to cycle wave a. Three targets are calculated for cycle wave c to end based upon Fibonacci Ratios to cycle wave a. As price approaches the first target if the structure is incomplete or if price keeps falling through it, then attention will turn to the next target. The same approach will be used for the third target.
Cycle wave c must subdivide as a five wave motive structure, either an impulse or an ending diagonal. An impulse is much more common, so that shall be what is expected as most likely. Within an impulse for Gold, the first wave may start off slowly and then the third wave shows acceleration and often ends with explosive movement. This wave count sees primary wave 1 as the first wave, which is still in its relatively early stages.
DAILY CHART – TRIANGLE
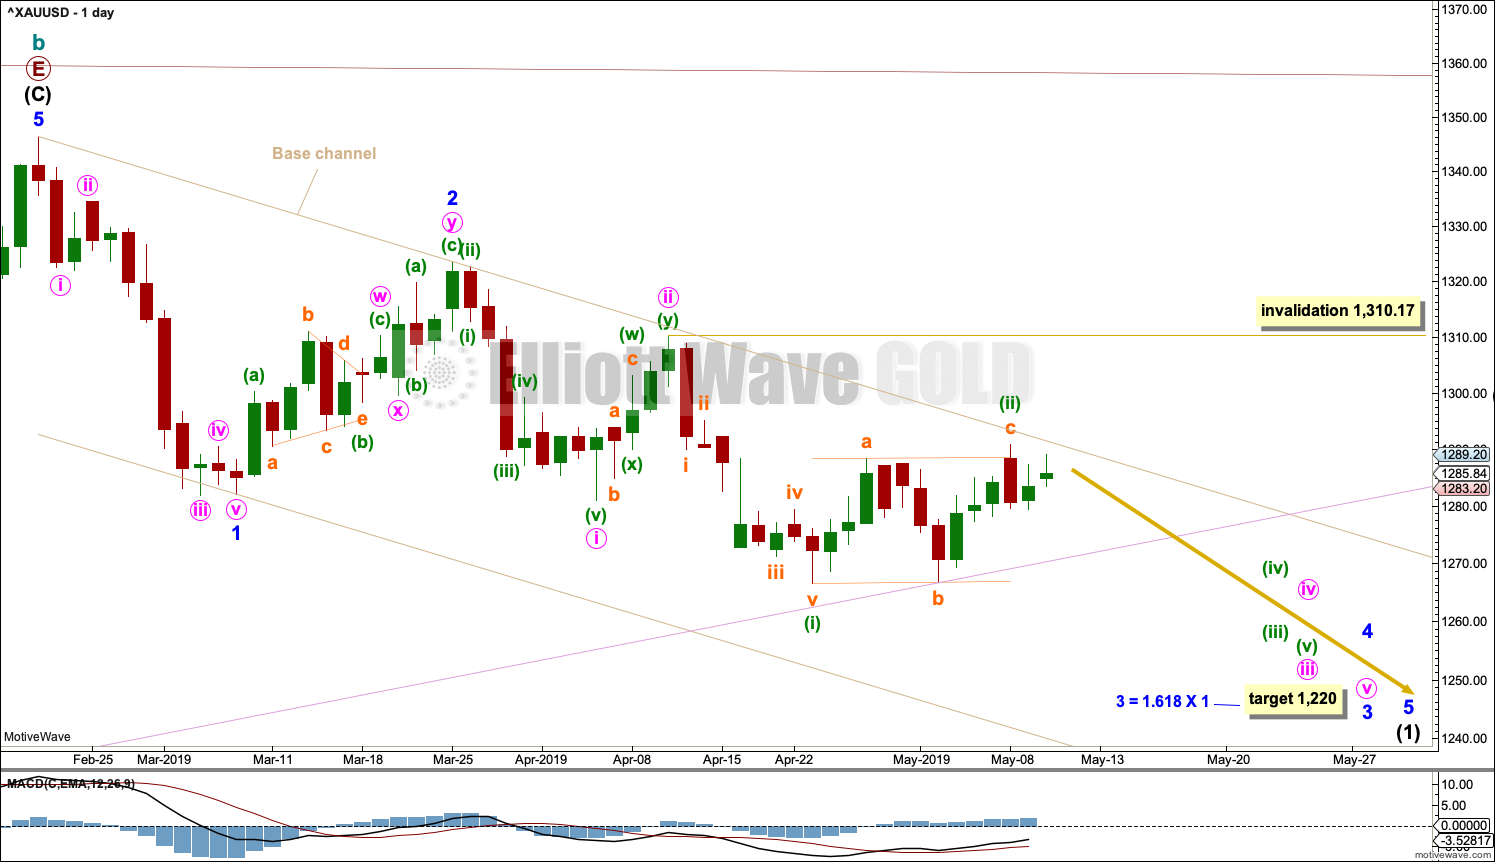
Click chart to enlarge.
Cycle wave c must subdivide as a five wave structure, either an impulse or an ending diagonal. An impulse is much more common and that shall be how it is labelled unless overlapping suggests a diagonal should be considered.
A new trend at cycle degree should begin with a five wave structure on the daily chart, which will be labelled minor wave 1.
A base channel is drawn about minor waves 1 and 2. There will be bounces and consolidations on the way down. The last bounce has found resistance at the upper edge of the base channel. Towards its middle or end the power of a third wave may be able to break below support at the lower edge of the base channel. The upper edge of the base channel may be used to calculate a trailing stop for short positions.
Minor wave 3 may only subdivide as an impulse. Within the impulse, minute waves i and ii may now be complete . Minute wave iii may only subdivide as an impulse. Within minute wave iii, minuette wave (i) may be complete. Minuette wave (ii) may be complete as a regular flat correction. Draw a small channel about minuette wave (ii). Minuette wave (ii) may have ended with a small overshoot of the small channel containing it. This is a typical look for a regular flat.
This wave count now expects there may now be a completed series of three overlapping first and second waves. This expects an increase in downwards momentum as the middle of a third wave unfolds.
It is possible that minute wave iii and / or minor wave 3 may end with a selling climax; either or both may exhibit a swift and strong fifth wave to end the impulse. This behaviour is typical of commodities, and this tendency is especially prevalent for third wave impulses.
WEEKLY CHART – DOUBLE ZIGZAG
Click chart to enlarge.
This wave count is identical to the first weekly chart up to the low labelled cycle wave a. Thereafter, a different Elliott wave corrective structure is considered for cycle wave b.
It is possible that cycle wave b may be an incomplete double zigzag or a double combination.
The first zigzag in the double is labelled primary wave W. This has a good fit.
The double may be joined by a corrective structure in the opposite direction, a triangle labelled primary wave X. The triangle would be about four fifths complete.
Within multiples, X waves are almost always zigzags and rarely triangles. Within the possible triangle of primary wave X, it is intermediate wave (B) that is a multiple; this is acceptable, but note this is not the most common triangle sub-wave to subdivide as a multiple. These two points reduce the probability of this wave count in terms of Elliott wave.
Intermediate wave (E) should continue to exhibit weakness: ATR should continue to show a steady decline, and MACD may begin to hover about zero.
Intermediate wave (E) may not move beyond the end of intermediate wave (C) below 1,160.75.
This wave count may now expect downwards movement for several weeks.
Primary wave Y would most likely be a zigzag because primary wave X would be shallow; double zigzags normally have relatively shallow X waves.
Primary wave Y may also be a flat correction if cycle wave b is a double combination, but combinations normally have deep X waves. This would be less likely.
This wave count has good proportions and no problems in terms of subdivisions.
Intermediate wave (E) should subdivide as a zigzag labelled minor waves A-B-C. Zigzags subdivide 5-3-5, exactly the same the start of an impulse.
The preferred wave count labels downwards movement minor waves 1-2-3, and this wave count labels downwards movement minor waves A-B-C. At the daily chart level, the subdivisions for both wave counts are seen in the same way.
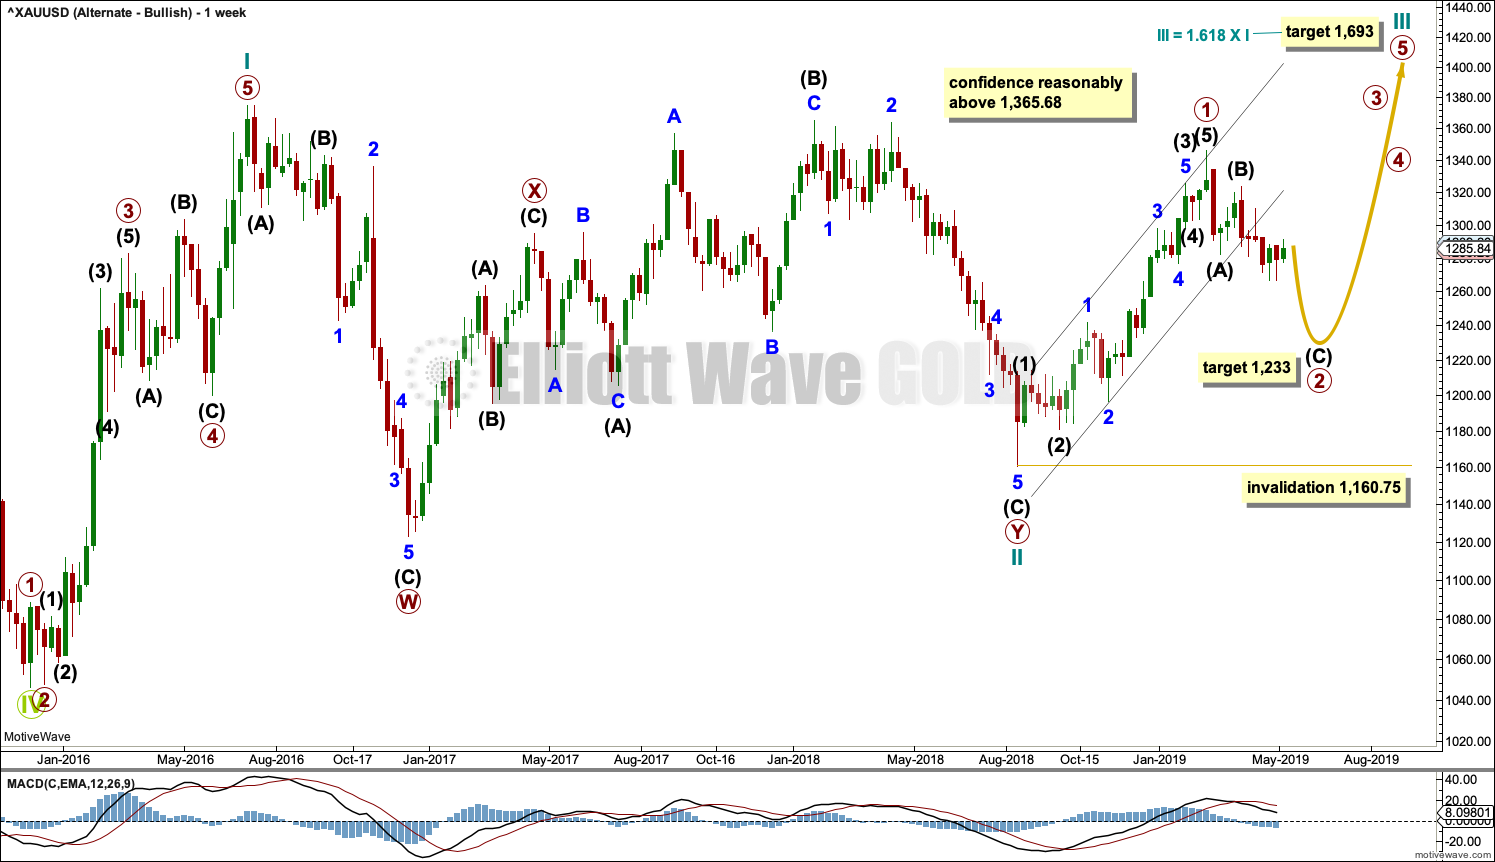
ALTERNATE ELLIOTT WAVE COUNT
WEEKLY CHART
Click chart to enlarge.
This wave count sees the three waves back now complete at the last major low for Gold in November 2019.
If Gold is in a new bull market, then it should begin with a five wave structure upwards on the weekly chart. However, the biggest problem with this wave count is the structure labelled cycle wave I because this wave count must see it as a five wave structure, but it looks more like a three wave structure.
Commodities often exhibit swift strong fifth waves that force the fourth wave corrections coming just prior and just after to be more brief and shallow than their counterpart second waves. It is unusual for a commodity to exhibit a quick second wave and a more time consuming fourth wave, and this is how cycle wave I is labelled. The probability of this wave count is low due to this problem.
Cycle wave II subdivides well as a double combination: zigzag – X – expanded flat.
Cycle wave III may have begun. Within cycle wave III, primary wave 1 may now be complete. The target for primary wave 2 is the 0.618 Fibonacci ratio of primary wave 1. Primary wave 2 may not move beyond the start of primary wave 1 below 1,160.75.
A black channel is drawn about primary wave 1. Primary wave 2 may breach the lower edge of this channel.
Cycle wave III so far for this wave count would have been underway now for 38 weeks. It should be beginning to exhibit some support from volume, increase in upwards momentum and increasing ATR. However, ATR continues to decline and is very low, and momentum is weak in comparison to cycle wave I. This wave count lacks support from classic technical analysis.
TECHNICAL ANALYSIS
WEEKLY CHART
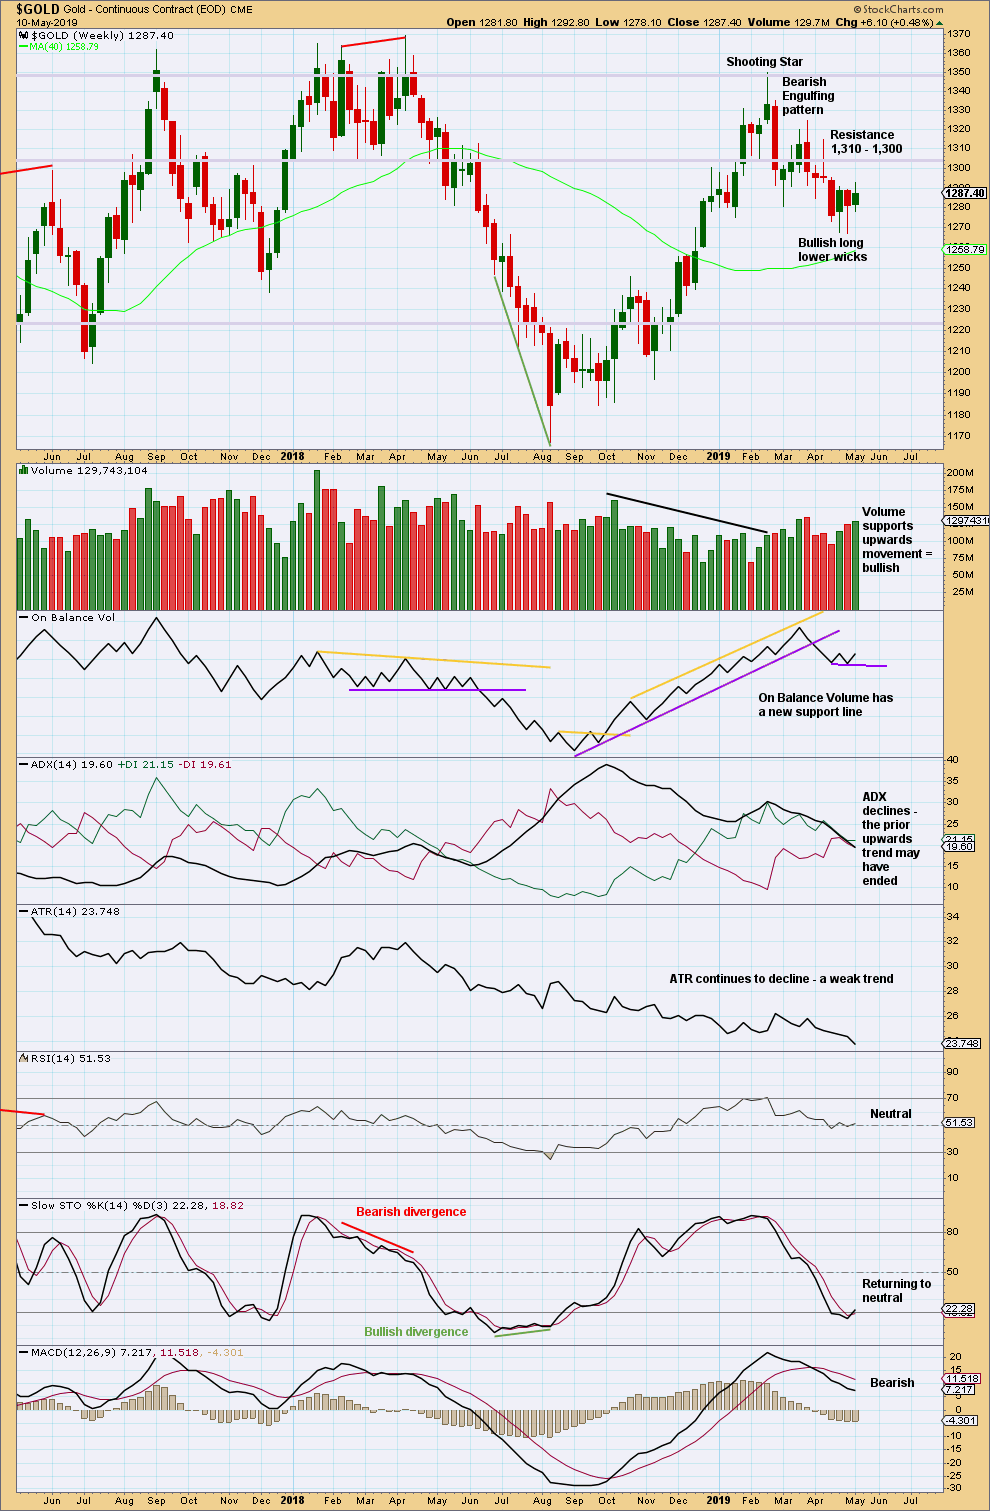
Click chart to enlarge. Chart courtesy of StockCharts.com.
A small range week has some support from volume, but the small range and lack of any bullish candlestick pattern does not make a convincing bounce. This may be a smaller counter trend movement that may continue a little higher before it is done.
DAILY CHART
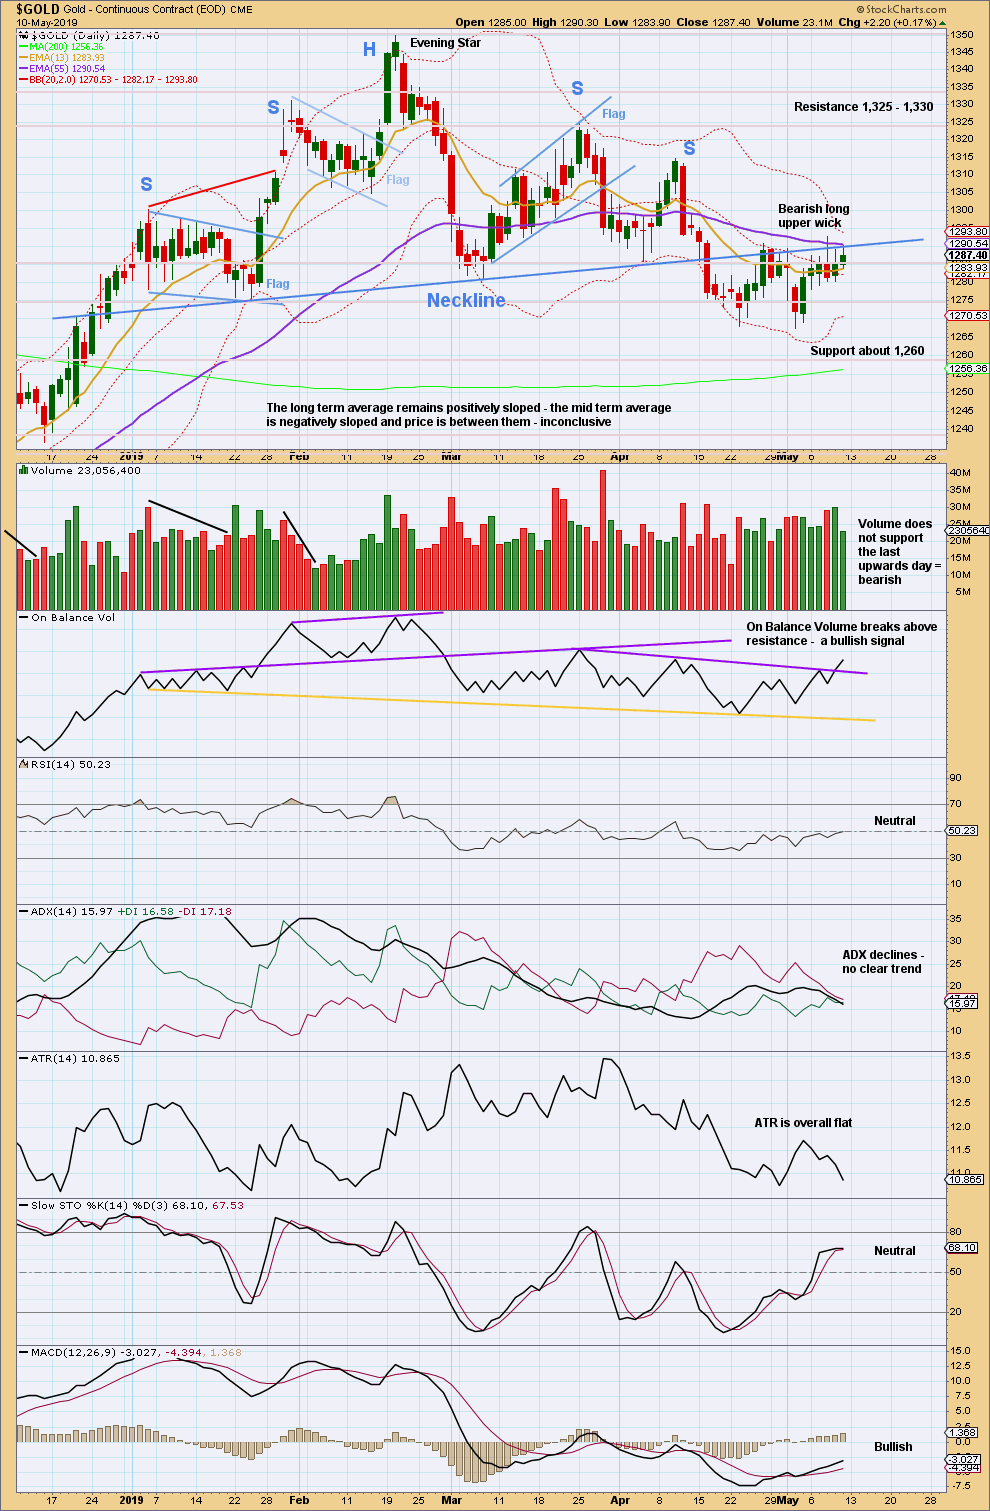
Click chart to enlarge. Chart courtesy of StockCharts.com.
From August 2018 Gold moved higher with a series of higher highs and higher lows. This series remained intact until the 1st of March 2019 when a lower low was made. At that stage, it was possible that Gold had seen a trend change.
There is now a new series of three lower swing highs and three lower swing lows. This supports the idea that there has been a trend change and Gold is in a new downwards trend.
A complex Head and Shoulders pattern is identified. The neck line has been breached. A target is at 1,217.
More weight will be given to resistance and declining volume today than the bullish signal from On Balance Volume.
GDX WEEKLY CHART
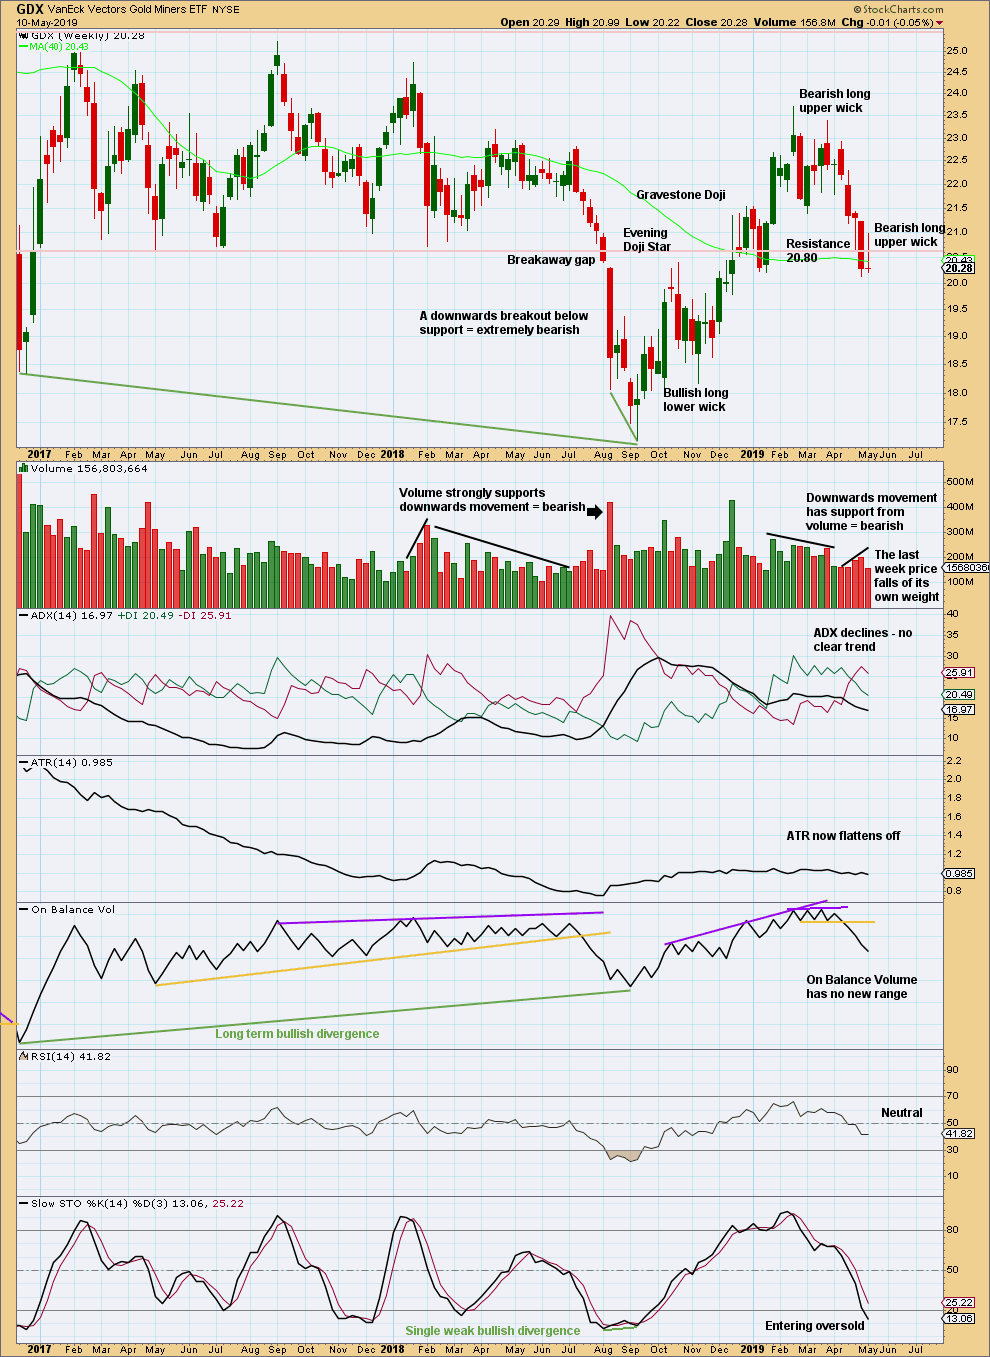
Click chart to enlarge. Chart courtesy of StockCharts.com.
There is now a series of two lower highs and lower lows at the weekly chart level. GDX may have seen a trend change to downwards, but ADX does not yet agree. The bearish signal from On Balance Volume supports this view.
Price has closed below 20.80. Expect downwards movement to continue.
GDX DAILY CHART
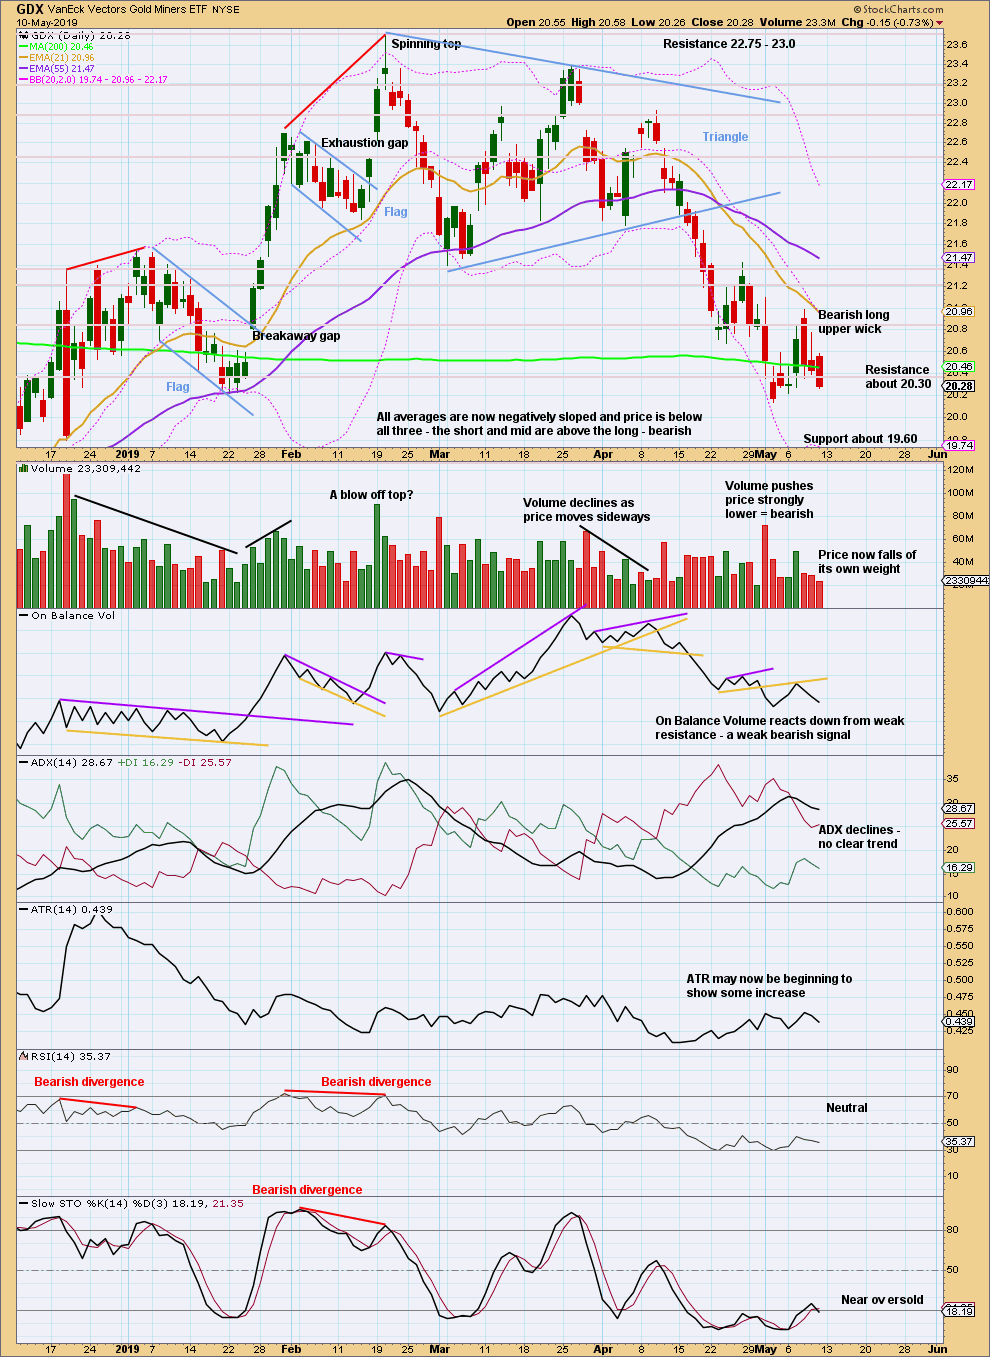
Click chart to enlarge. Chart courtesy of StockCharts.com.
A target calculated from the triangle width is now at 19.58.
The last swing high of the 26th of April at 21.43 may remain intact.
US OIL
Again, price continues lower as the Elliott wave count expected for this week.
Summary: The next wave down may have begun. The final target is now calculated at 10.72.
Further confidence that a high is in place may be had if price makes a new low below 58.20.
MAIN ELLIOTT WAVE COUNT
MONTHLY CHART
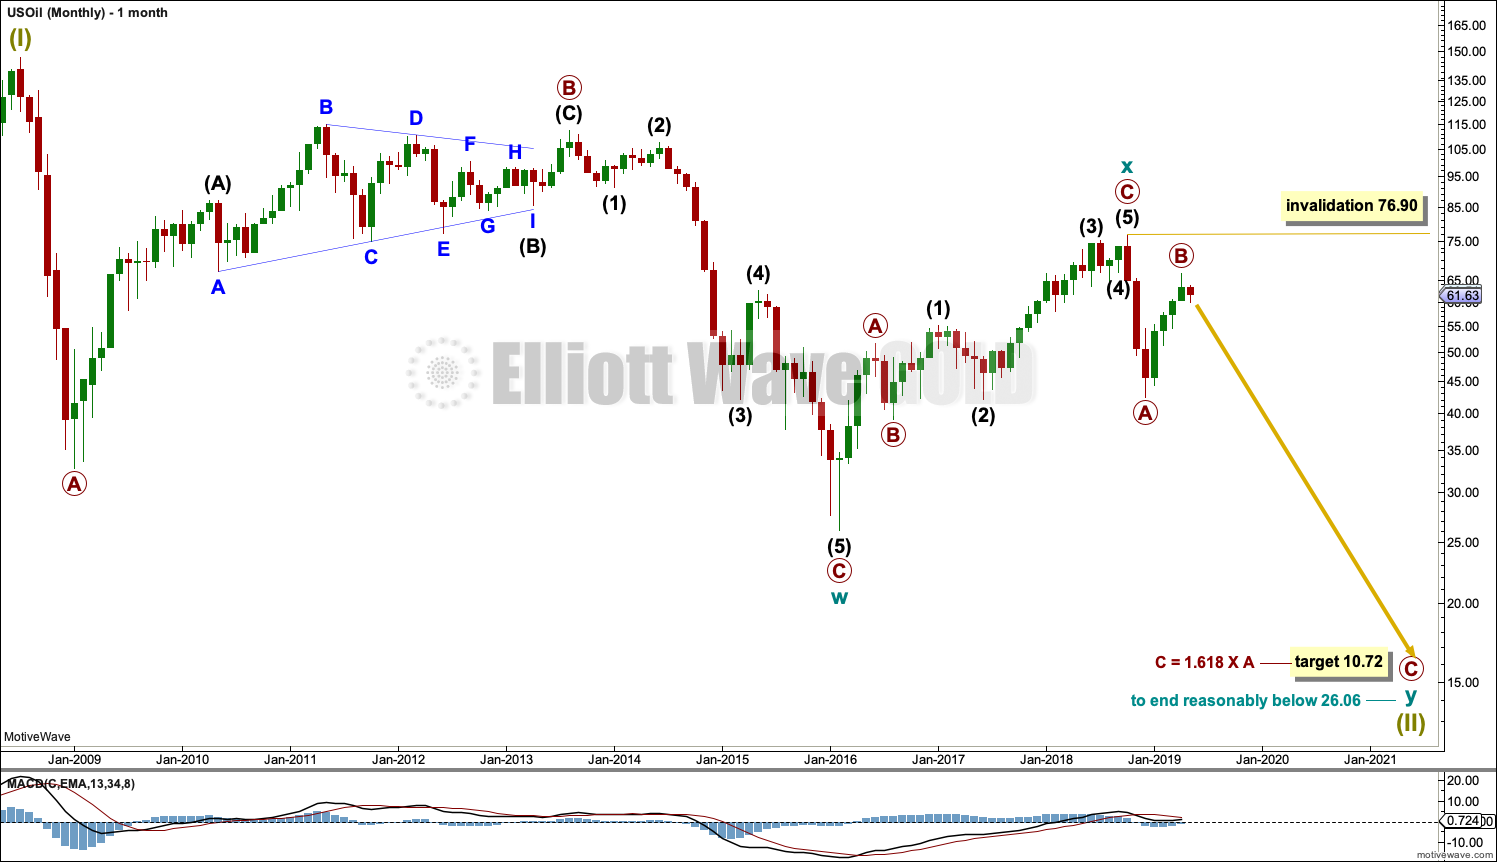
Click chart to enlarge.
The basic Elliott wave structure is five steps forward and three steps back. This Elliott wave count expects that US Oil is still within a three steps back pattern, which began in July 2008. The Elliott wave count expects that the bear market for US Oil continues.
This Elliott wave corrective structure is a double zigzag, which is a fairly common structure. The correction is labelled Super Cycle wave (II).
The first zigzag in the double is complete and labelled cycle wave y. The double is joined by a three in the opposite direction labelled cycle wave x, which subdivides as a zigzag. The second zigzag in the double may now have begun, labelled cycle wave w.
The purpose of a second zigzag in a double zigzag is to deepen the correction when the first zigzag does not move price deep enough. To achieve this purpose cycle wave y may be expected to move reasonably below the end of cycle wave w at 26.06. The target calculated would see this expectation met.
Cycle wave y is expected to subdivide as a zigzag, which subdivides 5-3-5.
If it continues higher, then primary wave B may not move beyond the start of primary wave A above 76.90.
WEEKLY CHART
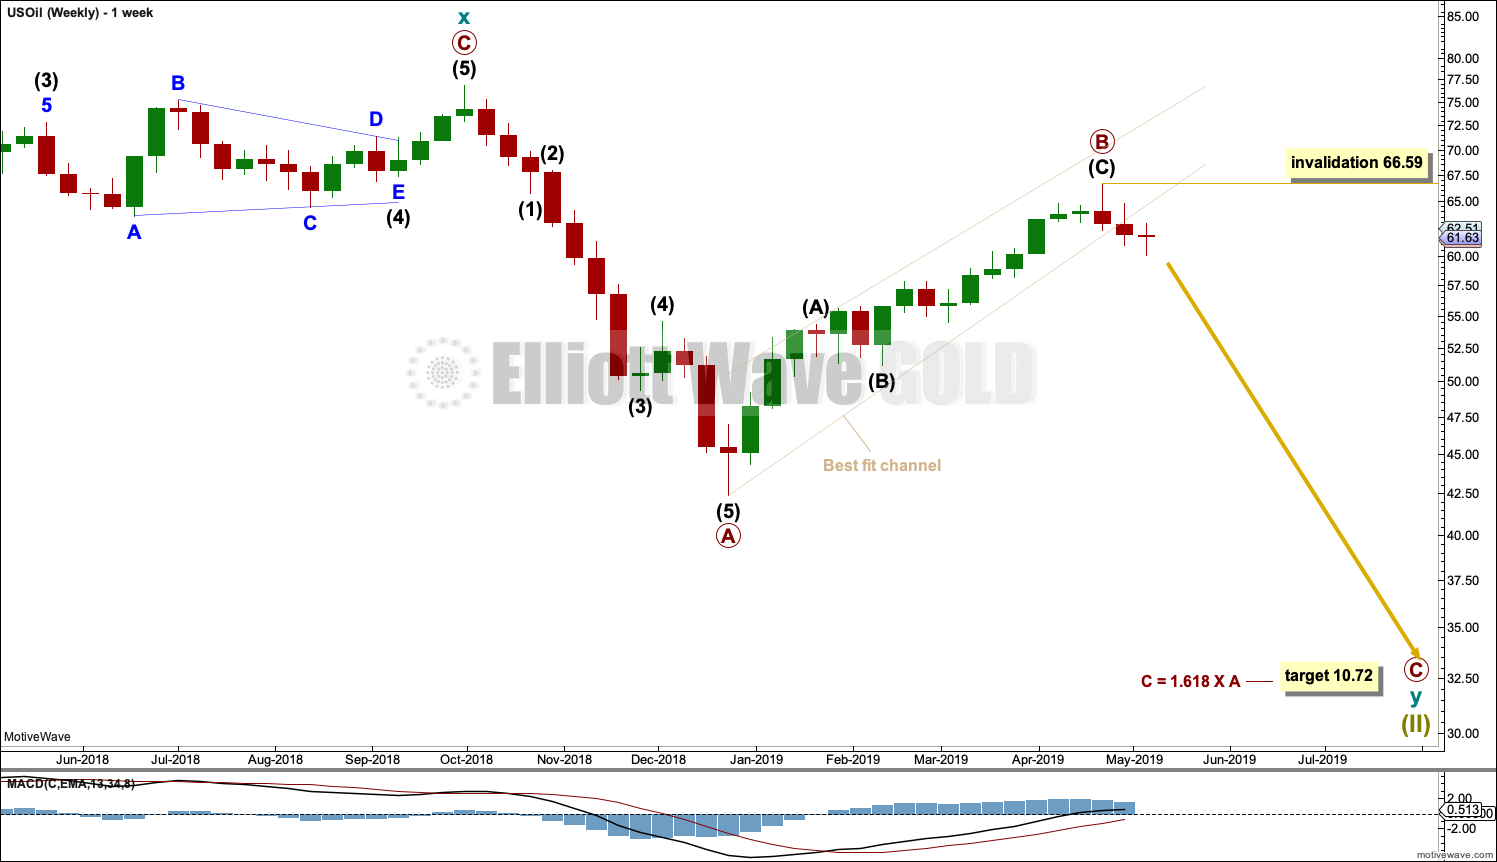
Click chart to enlarge.
This weekly chart is focussed on the start of cycle wave y.
Cycle wave y is expected to subdivide as a zigzag. A zigzag subdivides 5-3-5. Primary wave A must subdivide as a five wave structure if this wave count is correct.
Primary wave A may be a complete five wave impulse at the last low.
Primary wave B may now be a complete single zigzag at the last high.
Primary wave C may have just begun. Primary wave C must subdivide as a five wave structure.
Within primary wave C, no second wave correction may move beyond its start above 66.59.
DAILY CHART
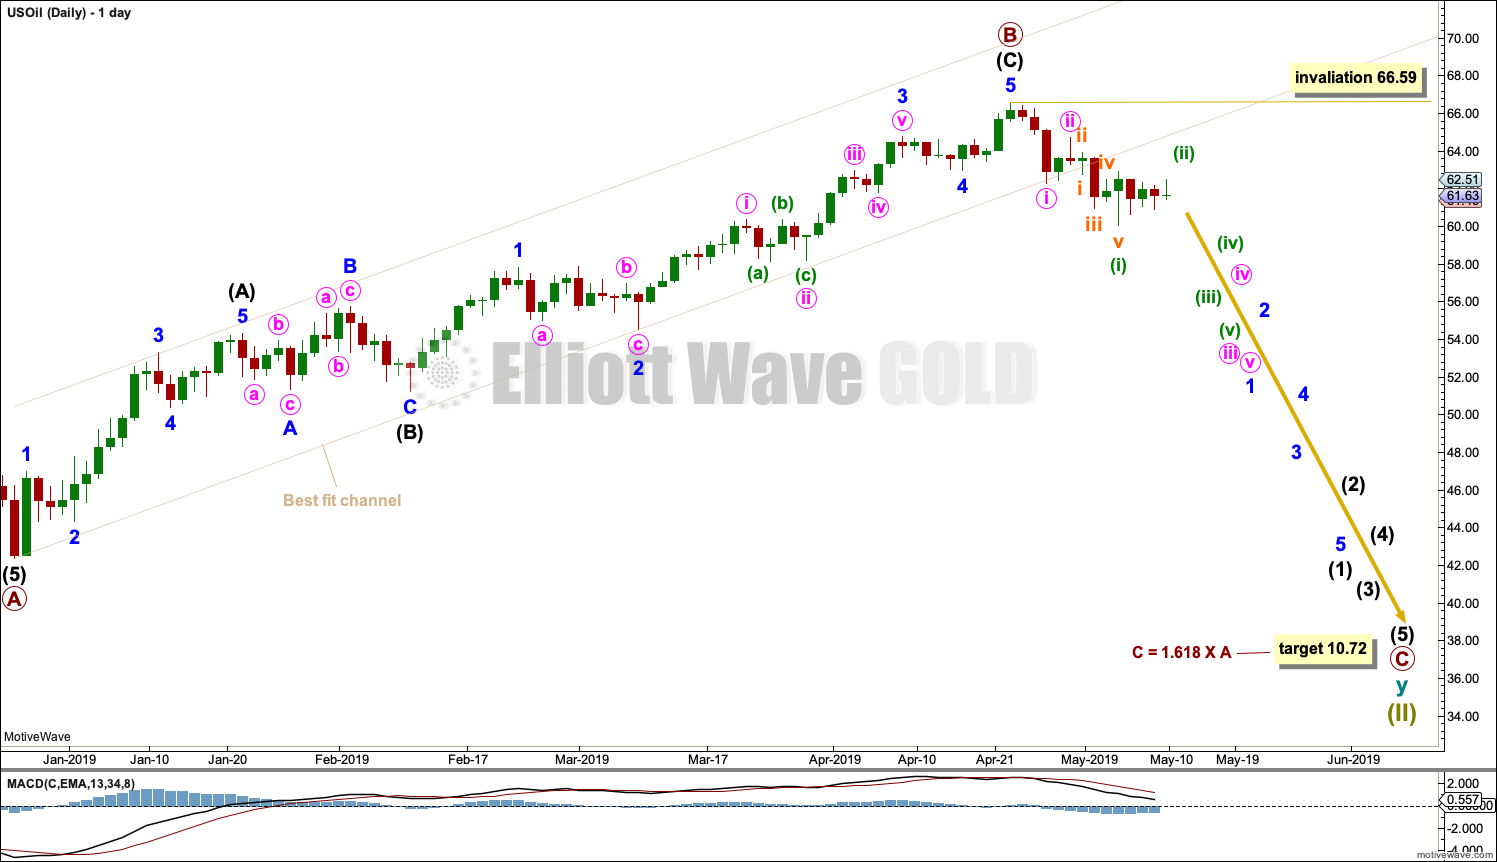
Click chart to enlarge.
Primary wave B is now labelled as a complete single zigzag.
Note that monthly and weekly charts are on a semi-log scale, but this daily chart is on an arithmetic scale. This makes a slight difference to trend channels. Use this channel on a daily chart on an arithmetic scale.
The channel is drawn conservatively to contain all of the bounce of primary wave B. There is now a very clear breach of this channel. This adds confidence now to the labelling of primary wave B as complete.
Within primary wave C, no second wave correction may move beyond its start above 66.59.
Primary wave C may last at least a year, and possibly longer. It may be extended in time; the subdivisions of intermediate waves (2) and (4) may show up at the weekly time frame.
TECHNICAL ANALYSIS
MONTHLY CHART
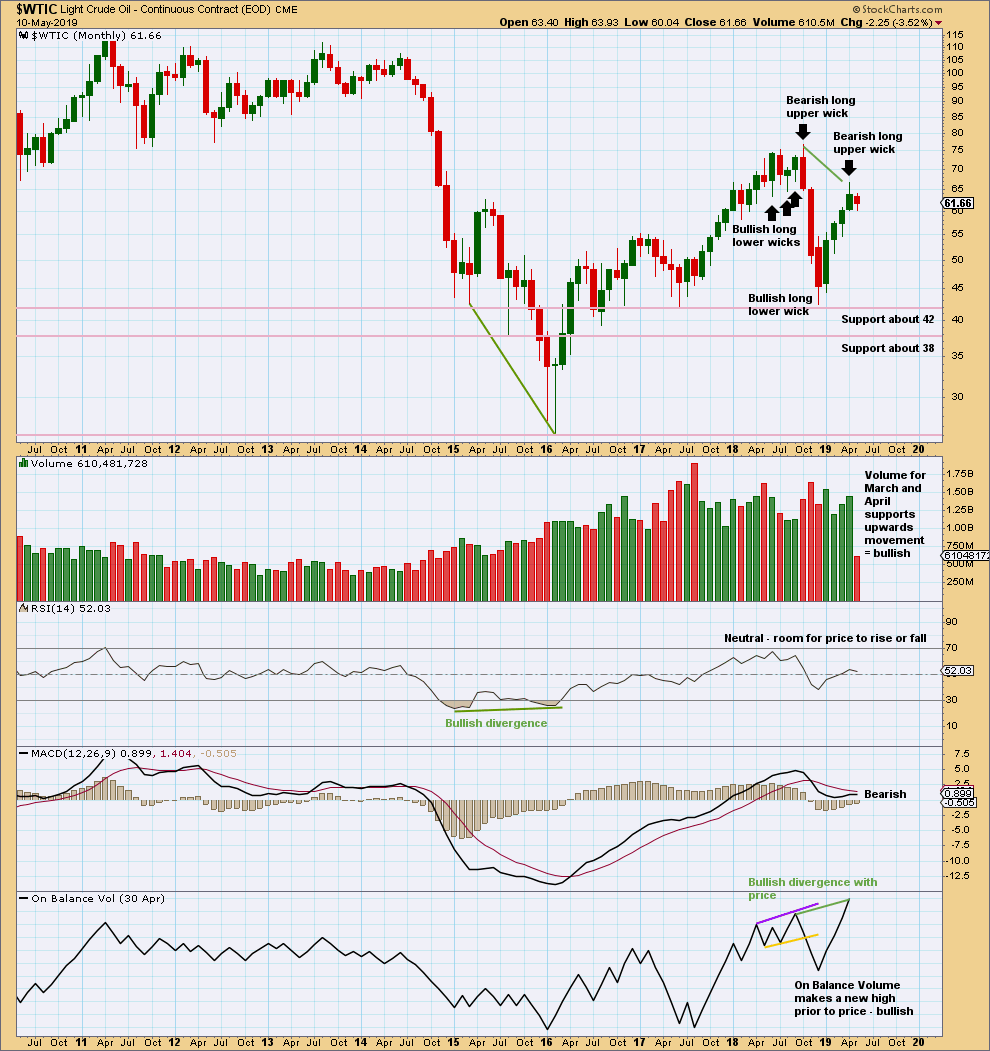
Click chart to enlarge. Chart courtesy of StockCharts.com.
Volume and On Balance Volume are bullish. This suggests the bounce may not be over, and this does not support the Elliott wave count.
The long upper wick on April’s monthly candlestick is bearish. This bearish signal is weaker than the bullish volume profile.
WEEKLY CHART
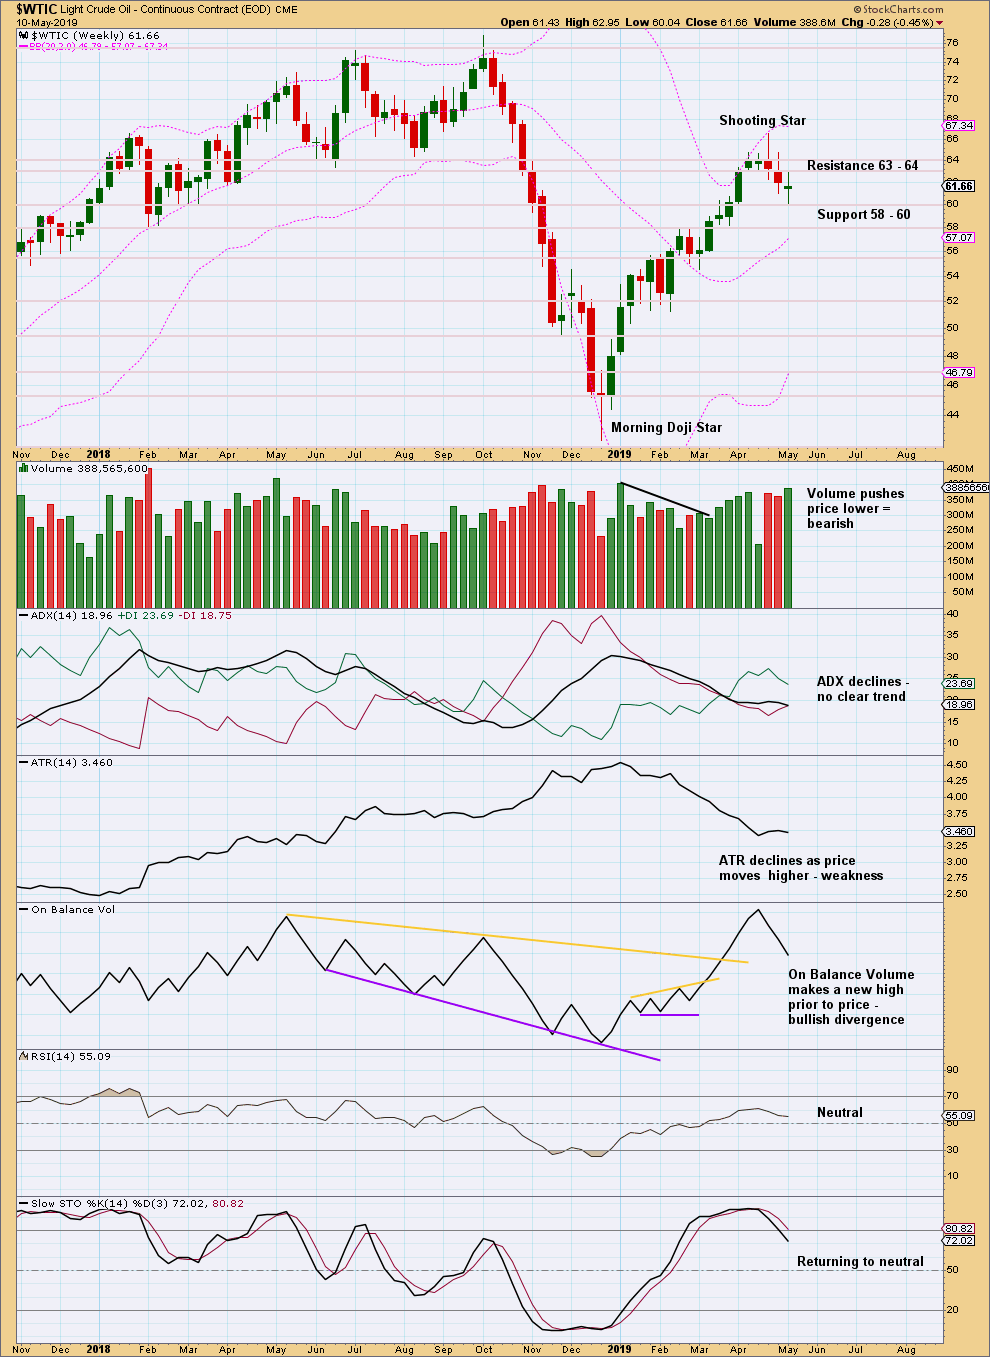
Click chart to enlarge. Chart courtesy of StockCharts.com.
A Shooting Star candlestick pattern is a bearish reversal pattern when it comes at the end of an upwards movement.
This week price moved lower and the balance of volume was downwards. Volume was high, pushing price lower. This is fairly bearish and supports the Elliott wave count.
DAILY CHART
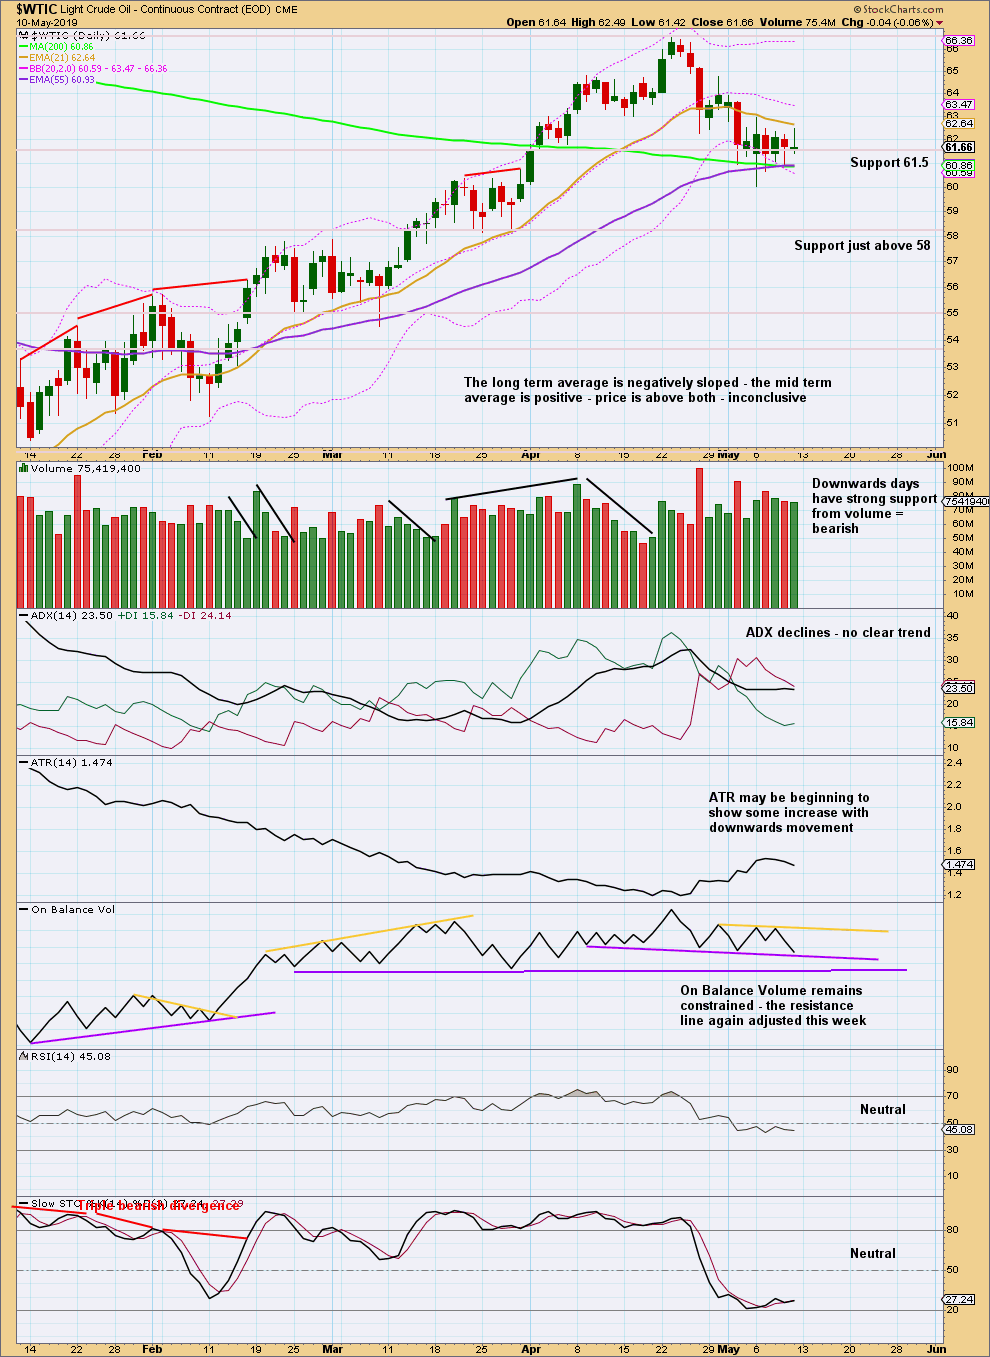
Click chart to enlarge. Chart courtesy of StockCharts.com.
Since the 24th of December 2018 there has been a series of higher highs and higher lows, the basic definition of an upwards trend. Assume this will continue until proven it has ended. A lower low below the low of the 28th of March 2019 at 58.20 would provide evidence the bounce is over.
The short-term volume profile remains fairly strongly bearish and supports the Elliott wave count.
—
Always practice good risk management as the most important aspect of trading. Always trade with stops and invest only 1-5% of equity on any one trade. Failure to manage risk is the most common mistake new traders make.
Often times there’s options hangover the following Monday after a Friday expiration. I’d expect one more move down in the SPX (brief) and then a resumption of the rally.
For gold, I had a nice day trading short, but again, I’d expect a small bounce ($8 to $10) on Monday. I’m going to be hitting gold very hard on the short side after the past 2 days action. Complete failure of 1300 and now back in the channel with a potential mult-3rd wave structure unfolding down.
Also looking to short the T-Bond early next week too.
GLTA and have a great weekend!
Corey
A bit Jekyll and Hyde going on (for me!), but comex gold did have an increase of over 60,000 contracts into the Monday / Tuesday price increase. This is typically bullish. I’m still leaning bearish overall but also fully aware that another tag of 1350 is possible. If the SPX is correcting down to complete a C wave, then I could easily see a spike in gold. Monday will be interesting!
missed completely the move from SPX lows on Monday… 🙁 … AD line doing a new high…. Was this the low?
Thanks
Mathieu
It just looks like a giant B wave… But the AD line is saying otherwise… This is hard.
Thanks Mathieu for all your posting here. I greatly appreciate it as I appreciate all the posts. My opinion is that the current move up from 2801 is all a B wave in an ongoing correction. Lara’s target to complete Primary 2 is still at 2722. With the premarket down 22 SPX points, the C wave of Primary 2 may be beginning now.
The only caveat here is the strong AD line…. I am 50/50 here if this is a B wave…
I am invested in stocks that are not affected by China trade issue like UNH, HUM and CNC.
I’m not seeing what you’re seeing. I see the AD line made its last high two weeks ago with price on the weekly chart, and on the daily chart the last high also was with the last ATH for price on the 3rd of May.
As for the short term high for the AD line on the 15th of May (not a new all time high, but a new short term swing high) this may now be resolved by being followed up by an upwards day. There is no longer any short term divergence.
I’ll go over this carefully in the end of week video, but in short, I can see no bullishness in this upwards movement from the AD line to suggest the pullback is over.
I’ve been pushed around a bit trading last few days so I’ve gone flat. Looking to short SPX at 2865 (50dma) after a clean 5—3—5 zigzag corrective pattern completes. Also looking to go long gold at 1290 area, probably tomorrow. Flat crude for now.
Edit… Just started small positions as described above.
I put in a buy order for SCO 16.28. Holding off on gold for now, got a coin heads up 🙂 . Like your short entry on SPX if we reach it. Divergence showing up in RSI and today was an outside day up.
Whipped again today. I primarily trade gold and exited my short SPX position. Flat gold now after pretty decisive break of 1290. Interesting we are either entering a 3rd of a 3rd of a 3rd down for gold or might tap 1350 again. I’m leaning bearish.
If we tag 1290 back on the underside and it fails then I’m all in short gold again.
Hi Lara
Oil: With the spike and then rapid decline on Monday – does that signal in you opinion that wave 2 is over and we are at the start of wave 3?
This is how I’m labelling it now, so far. I’ve got the first wave down as minute i and the spike as minute ii.
The degree could be moved up one, it could also be minor 1 and minor 2.
And I’m not fully confident the second wave is done either. Sorry, I know that’s not the answer you wanted. The invalidation point and risk remains the same.
But I am fairly confident that there has been a trend change, and the high at 66.59 should not be breached.
It’s just the little bounces and consolidations along the way down which are hard to tell exactly when they’re over.
Once we get the first one complete then we can draw a resistance line to use to show where subsequent bounces may end.
Hi Lara, do you have an opinion on the cup and handle pattern on the Gold chart in terms of TA, now that the complex head and shoulders pattern probability is reduced?
I have an opinion on cup and handle patterns. My opinion is that they’re not very reliable. To me they look too…. loose in definition.
This may not be a popular opinion.
For Gold I’m considering changing the wave count to this.
For the last couple of weeks I’ve been concerned about a continued decline in ATR and weakness in downward movement. This would provide a neat explanation.
Thanks Lara for the midweek update. The count above would make sense if the US equity markets just entered a larger corrective phase. The money from the sale of equities has to go somewhere and some of it could go into gold. While the SPX and gold are not always inversely related with one another, sometimes they are.
I will be liquidating my highly profitable DUST (3X short GDX) position today or in the next couple of days.
Hi Lara, You are showing a potential move higher as an ABC structure but what if the recent low as actually a Wave 4 low out of the Dec 2018 uptrend. If so, a Wave 5 up would breach your triangle to the upside, correct? Implications if this happens?
That could fit on the alternate weekly chart.
And my thoughts on that wave count are in the analysis above.
For that count, the current wave up from the August 2018 low would still best be seen as a complete five up and three down, rather than within the fourth wave of a five up. The proportions don’t look right for that idea.
S&P500:
This pullback looks to be too large to be at intermediate degree today. I’m changing the wave count at the daily chart level for the S&P500. Target for it to end is now 2,722.
There may be a small bounce or consolidation now for intermediate (B), and then new lows for intermediate (C).
Lara, SPX Daily chart looks like 5 waves down into today’s low (so far). We should get a bounce but 5 waves down does not look good to me.
It’s still another pullback within the ongoing bullish trend.
The question though, what degree is it and where is support?
Hi Lara,
Curious, is it possible the cycle wave b triangle might be making one more attempt to the 1355 area to complete the E wave? The latest move down just under 1350 certainly seems *weak* for the start of a c wave down.
The upwards break of the channel today creates some doubt in my mind that we are about to enter a 3rd of a 3rd of a 3rd. Gold seems to very much adhere to channels and trend-lines at key acceleration points. I’ll be very interested to see if a backtest of the channel now holds as support (also will be watching the 50DMA as support now).
Corey
With the downwards channel on Gold now clearly breached, I’m going to have to consider alternate ideas not previously considered.
The first idea would certainly be primary E of the triangle incomplete on the preferred weekly chart.
And I agree, the downwards move did lack real strength. When triangles end the resulting move out of them usually (not always) begins with strength. That was beginning to concern me.
Lara, Gold has broken to the upside of your EW downtrend channel today and it looks like 1280 should now be support. Any comments on today’s price action?
New chart above.
Lara, BitCoin is above your key resistance level so it looks like the bear market is over. Any thoughts on the next pullback opportunity for a wave 2 down?
I’ll be looking for that now too. Will update Bitcoin this week.
Good morning Lara.
I’m one of your subscribers which started and cancelled and started again with following/subscribing to your services here at EWGold. For myself, I found it difficult to apply your analysis to my trading since I don’t have a forex account and thus have to trade on the NYSE. On the NYSE the only product to which you give an analysis of is the GDX alongside your GOLD analysis. Is there a possibility to do a EW analysis of a crude oil product like UWT/DWT along side your analysis of USOIL?
I’m currently following the turn down in Oil with DWT which isn’t looking very good right now. Just hold it and wait or get out and go long with UWT? Any thoughts much appreciated.
I don’t do EW analysis of individual equities nor ETFs as they just don’t usually have sufficient volume for normal looking EW structures.
That’s why I don’t do EW analysis of GDX, just classic technical analysis.
I will look at adding classic TA of UWT/DWT to the end of the US Oil analysis.
For Oil, the bottom line for my analysis at this time is while the last high of the 23rd of April remains intact for WTI Crude I’ll expect there has been a trend change.
The problem you will have which must be recognised is that my EW count of Gold and US Oil is only a rough approximation to what GDX and an ETF for US Oil may be doing. Using my EW count of Gold or US Oil to trade different markets, is not going to give you an EW count of the markets you are actually trading.
Hi Lara.
Thank you so much. UWT Volume is also really quite high with a 20-day average of 7 million/day.
I’m looking forward to your adding the UWT to the USOIL analysis. Thank you so much.
Lara,
What is a good volume for EW analysis?
The volume yesterday and the average volume of some stocks taken from Tradingview are
GDX – 65.64M – 40.46M
AAPL – 57.43M – 38.44M
GOOGL – 2.28M – 2.0M
AMZN – 5.78M – 5.06M
Thanks.
Lara,
I would like to offer my thoughts with respect to the issue of including some analysis on DWT or UWT.
Here is description of UWT from the Yahoo Finance website-
“Fund Summary: The investment seeks to replicate, net of expenses, three times of the S&P GSCI® Crude Oil Index ER. The index tracks a hypothetical position in the nearest-to-expiration NYMEX light sweet crude oil futures contract, which is rolled each month into the futures contract expiring in the next month. The value of the index fluctuates with changes in the price of the relevant NYMEX light sweet crude oil futures contracts.”
DWT is the inverse of UWT, that is, DWT goes up when the price of USOIL goes down.
The prices of these two ETFs, unlike GDX and many other ETFs, are designed to track a single commodity. So, naturally, there would be no added value doing an Elliott Wave analysis on an EFT whose price is designed to reflect (albeit 3X) that of a single underlying commodity. TA analysis might be a different story, but I am not sure of that either.
For several years now I have followed prices for WTI Oil futures as found on charting platforms like TDameritrade’s thinkorswim (/CL) and tradingview (USOIL – CFDs on Crude Oil WTI from FXCM) and found them virtually if not identical to that used for your analysis.
I trade UWT/DWT, but my decisions to trade are based on your weekly and my daily/hourly Elliott Wave analyses of the more time-complete underlying commodity, which trades 24-hours a day for 5 straight trading days. The ETF’s are limited to normal +extended NYSE trading hours, leading to gaps in the Elliott Wave structure and the 3X factor doesn’t help.
I for one very much appreciate all the hard work you do. A very high quality product indeed.
William McCann
Hi Lara,
Have you ever applied the elliott wave analysis to a real estate market? If not, let’s say I were to analyse either the Toronto or Sydney/Australia real estate markets- how would I go about identifying the right data set, and then where would I start my elliott wave count? Could housing sales volumes in either of those markets be high enough to create a legitimate elliott wave count?
Yes indeed. We keep a wave count of the NZ nation wide property market. Volume has been pretty heavy these last few decades, it’s still in a bubble and almost all Kiwi’s are all in at this time. It does appear to have big enough volume for an EW count.
I would expect the the US market would be big enough. Also Canada and Australia.
If there is a specific market you want an EW count on I can do this for you if you can provide me with data in .csv format. You can email it to me at admin@elliottwavegold.com
Awesome, thanks. Sending it now.
Hi Lara,
Thanks to your excellent analysis I am holding a nicely profitable short position in Gold Miners and will continue to hold short as long as the main count remains down.
If you are willing and able to share an Elliott Wave count of the Canadian real estate markets I am also interested….but don’t have the data to supply.
All 3 analyses conveyed with outstanding clarity Lara. Thank you.
Thank you very much John!
I’ll keep focussing on trying to make it all as simple and clear as possible. I keep having people sign up then cancel because EW is complicated… and I’ve not been teaching it as clearly as I could.
Hi Lara,
I hear you when you say the Elliott Wave is not obvious for the S&P 500 since the subdivisions are weird… I am having trouble as well to view the subdivisions…
However, I am questioning your main wave count. Primary Wave 3 is less than 2 months. Since it cannot be the shorter one, primary wave 5 is going to be shorter in time most likely (for a great look), maybe 1 month or so… So that would be the end of the bull market likely in June… Also, would it contradict Lowry’s data for a minimum 4 months divergence of the AD line?
This is tough… But I know one thing…. The AD line is still very bullish…
Thanks again for the great work…
Mathieu
After reviewing your daily alternate (1-2,1-2), I would guess that Lowry’s data for the AD line would support that wave count since the AD line theory contradicts the main Elliott Wave count… What do you think?
I’m thinking the second wave count may actually be right, it does fit with Lowry’s requirement for a minimum 4 months divergence.
Primary 5 (or intermediate (5) ) could also be time consuming, while being short in price. It could have time consuming shallow consolidations within it.
OR…
I do have two alternate wave counts at the monthly chart level, take a look at those. They’re linked to at the beginning of the S&P analysis each week.
In short, I’m going to wait for the structure of cycle V (or primary 5, whichever degree it is) to be a complete five before I begin to worry about what happens next too much. At that point I’ll have to consider all alternates in conjunction with Lowry’s and other technicals. At that point I do hope that the technical data may point to which of several possibilities is most likely.
Understood.
I am going to continue to put a lot of weight on the AD line… It continues to be extremely strong and still outperforming the S&P 500.
So I will stay on the bullish side.
Thanks,
Mathieu
1-2, 1-2 it is… main count invalidated… This is more bullish!…
Mathieu
Since S&P broke thru 2813.49, it appears main wave count is invalidated. The 1-2 that you refer to is the the alternate count at the daily level. Correct? In this wave count we are now in primary wave 2 and primary wave 3 is yet to come so as the bull could run a little longer.
Rich
Yes, Rich, exactly…
I got stopped out of my positions… I am in cash… This move is pretty strong…