

S&P 500
Both the AD line and VIX at the end of the week give the same signal. In conjunction with Lowry’s data, this indicates a more bullish scenario should be dominant.
The Elliott wave count has a new short to mid-term target.
Summary: The low of December 2018 is expected to remain intact, and this pullback is expected to be followed by a strong third wave up to new all time highs.
Three scenarios are possible at the end of this week (judged in order of probability):
1. The pullback is over. Confidence in this view may be had with a new all time high above 2,954.13. The next target would be at 3,033 for another larger consolidation. This target may be met in about a month.
2. Some sideways movement continues next week before a final wave down to about 2,722 completes the pullback in two or three weeks time.
3. A pullback ends next week about 2,740 or 2,722.
The biggest picture, Grand Super Cycle analysis, is here.
Monthly charts were last published here, with video here. There are two further alternate monthly charts here. Video is here.
ELLIOTT WAVE COUNTS
The two Elliott wave counts below will be labelled First and Second rather than main and alternate as they may be about of even probability. When the fifth wave currently unfolding on weekly charts may be complete, then these two wave counts will diverge on the severity of the expected following bear market. To see an illustration of this future divergence monthly charts should be viewed.
FIRST WAVE COUNT
WEEKLY CHART
Click chart to enlarge.
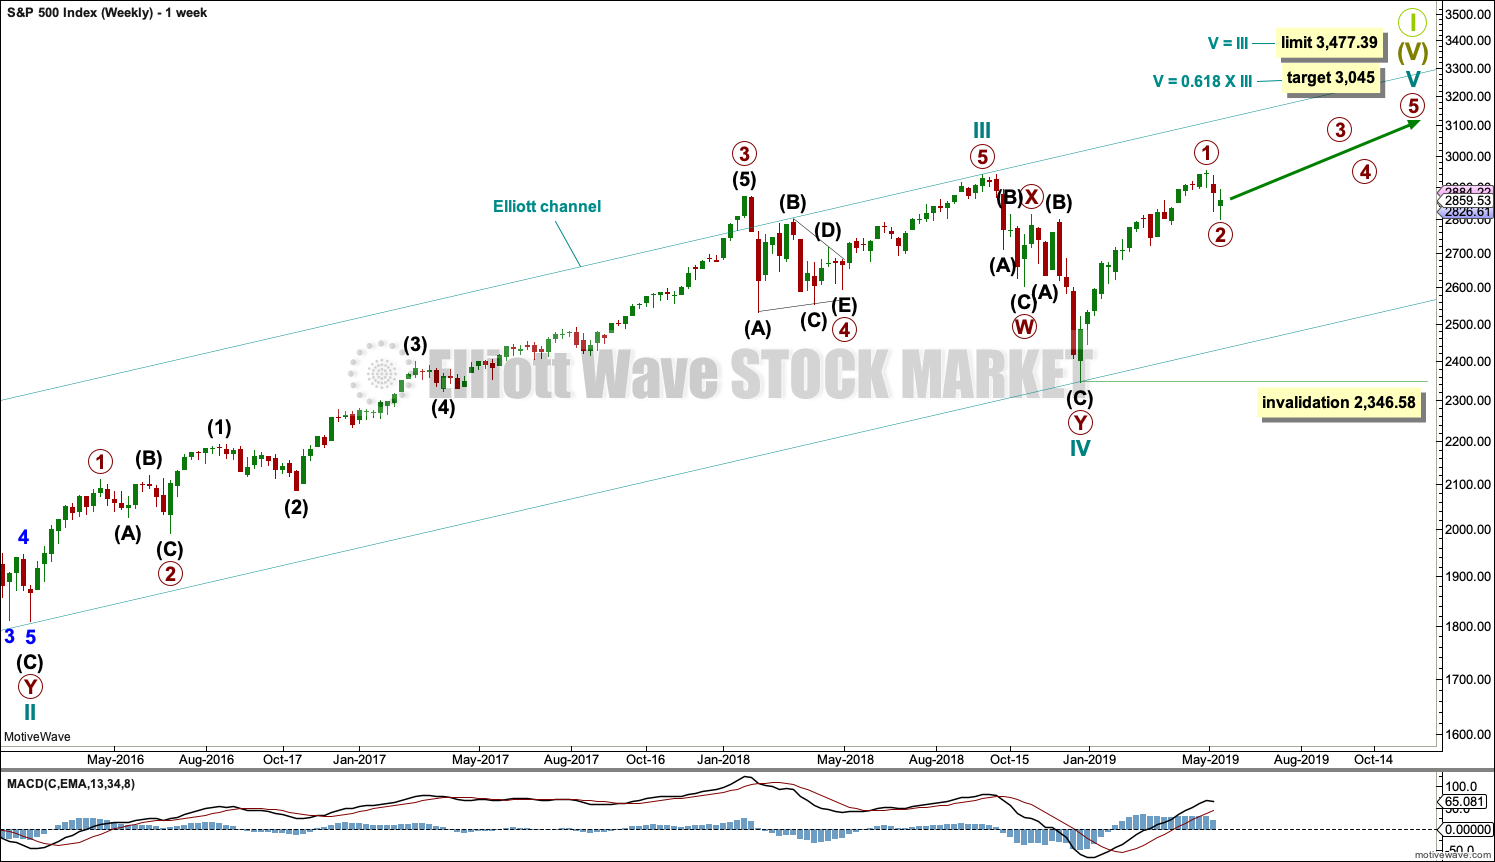
The basic Elliott wave structure consists of a five wave structure up followed by a three wave structure down (for a bull market). This wave count sees the bull market beginning in March 2009 as an incomplete five wave impulse and now within the last fifth wave, which is labelled cycle wave V. This impulse is best viewed on monthly charts. The weekly chart focusses on the end of it.
Elliott wave is fractal. This fifth wave labelled cycle wave V may end a larger fifth wave labelled Super Cycle wave (V), which may end a larger first wave labelled Grand Super Cycle wave I.
The teal Elliott channel is drawn using Elliott’s first technique about the impulse of Super Cycle wave (V). Draw the first trend line from the end of cycle wave I (off to the left of the chart, the weekly candlestick beginning 30th November 2014) to the end of cycle wave III, then place a parallel copy on the end of cycle wave II. This channel perfectly shows where cycle wave IV ended at support. The strongest portion of cycle wave III, the end of primary wave 3, overshoots the upper edge of the channel. This is a typical look for a third wave and suggests the channel is drawn correctly and the way the impulse is counted is correct.
Within Super Cycle wave (V), cycle wave III is shorter than cycle wave I. A core Elliott wave rule states that a third wave may never be the shortest. For this rule to be met in this instance, cycle wave V may not be longer in length than cycle wave III. This limit is at 3,477.39.
A final target is calculated at cycle degree for the impulse to end.
The structure of cycle wave V is focussed on at the daily chart level below.
Within cycle wave V, primary wave 2 may not move beyond the start of primary wave 1 below 2,346.58.
In historic analysis, two further monthly charts have been published that do not have a limit to upwards movement and are more bullish than this wave count. Members are encouraged to consider those possibilities (links below summary) alongside the wave counts presented on a daily and weekly basis.
DAILY CHART
Click chart to enlarge.
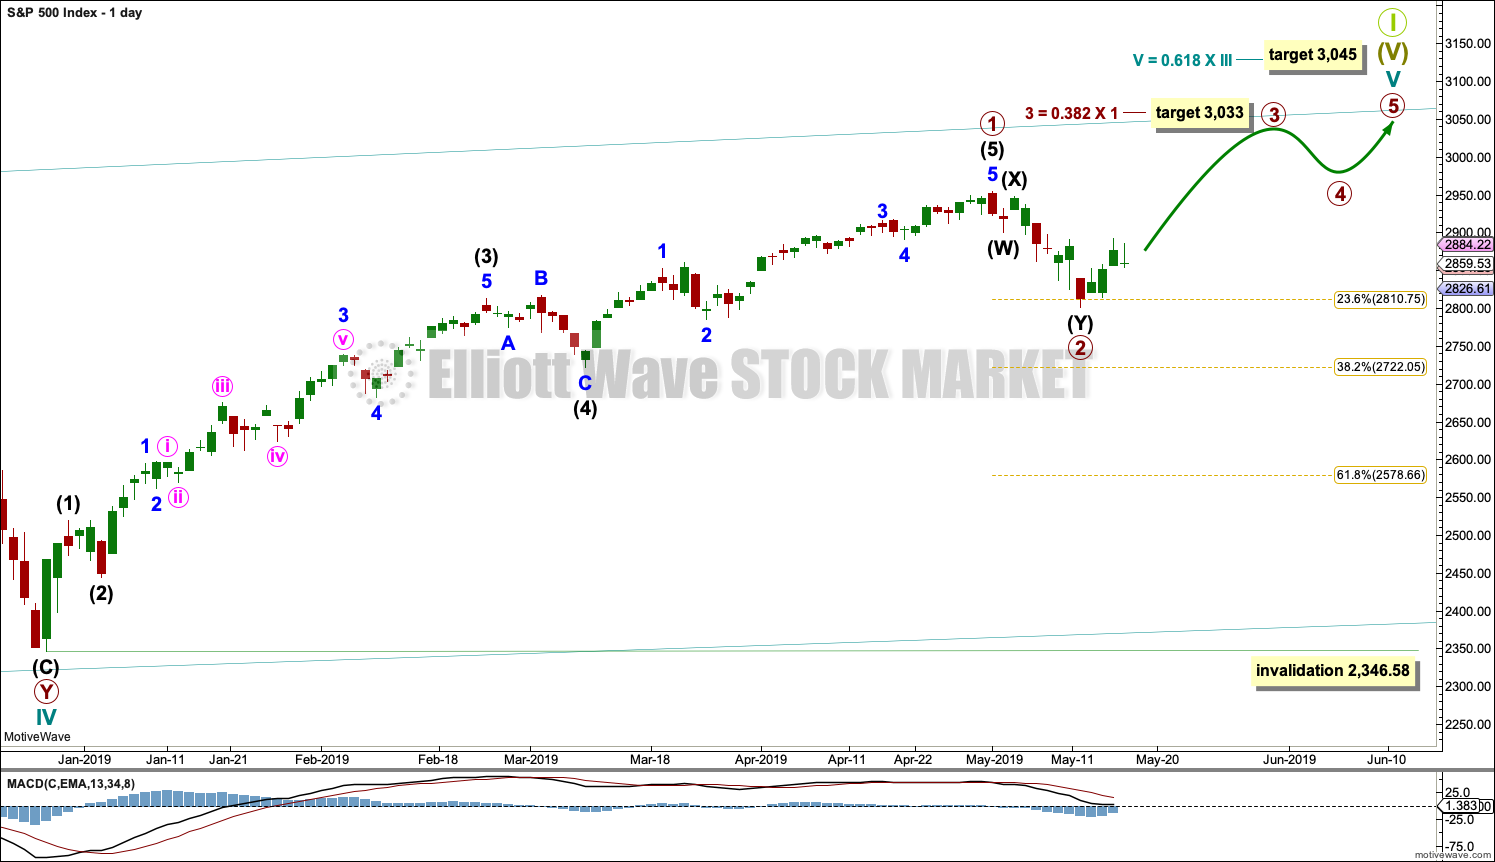
Cycle wave V must subdivide as a five wave motive structure. Within that five wave structure, primary waves 1 and now 2 may be complete. Primary wave 2 may have ended this week as a relatively brief and shallow double zigzag. Double zigzags are fairly common corrective structures.
A new all time high would add confidence to this wave count.
Primary wave 3 must move above the end of primary wave 1. A target is calculated for primary wave 3 that fits with the higher target for cycle wave V to end.
When primary wave 3 is over, then primary wave 4 may be a shallow sideways consolidation that may not move into primary wave 1 price territory below 2,954.13.
Thereafter, primary wave 5 should move above the end of primary wave 3 to avoid a truncation.
At the end of this week, it remains possible that primary wave 2 may not be over and may continue lower. Primary wave 2 may not move beyond the start of primary wave 1 below 2,346.58.
SECOND WAVE COUNT
WEEKLY CHART
Click chart to enlarge.
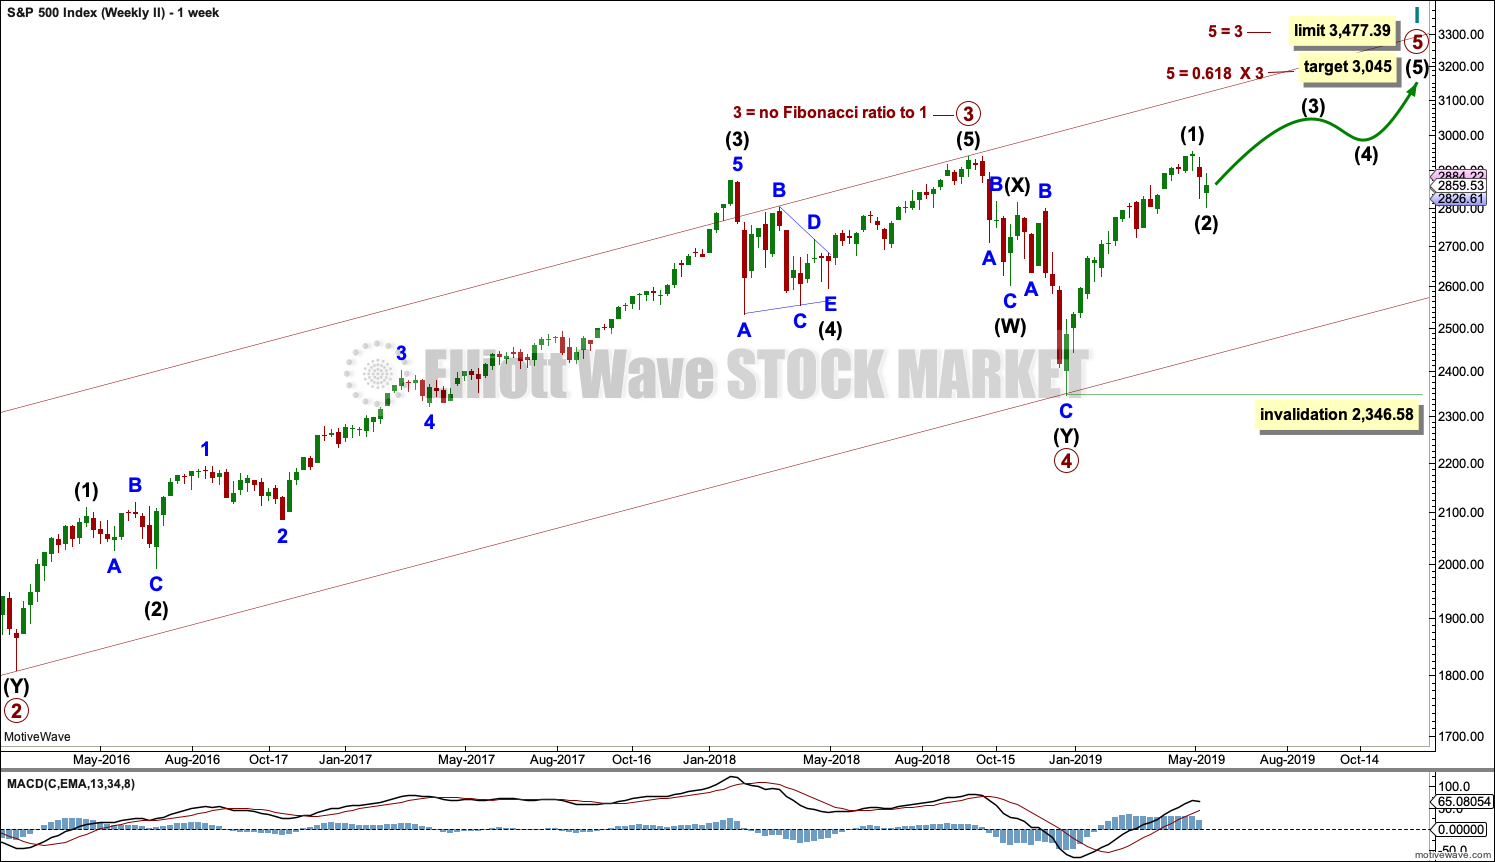
This weekly chart is identical to the first weekly chart, with the sole exception being the degree of labelling.
This weekly chart moves the degree of labelling for the impulse beginning in March 2009 all down one degree. This difference is best viewed on monthly charts.
The impulse is still viewed as nearing an end; a fifth wave is still seen as needing to complete higher. This wave count labels it primary wave 5.
TECHNICAL ANALYSIS
WEEKLY CHART
Click chart to enlarge. Chart courtesy of StockCharts.com.
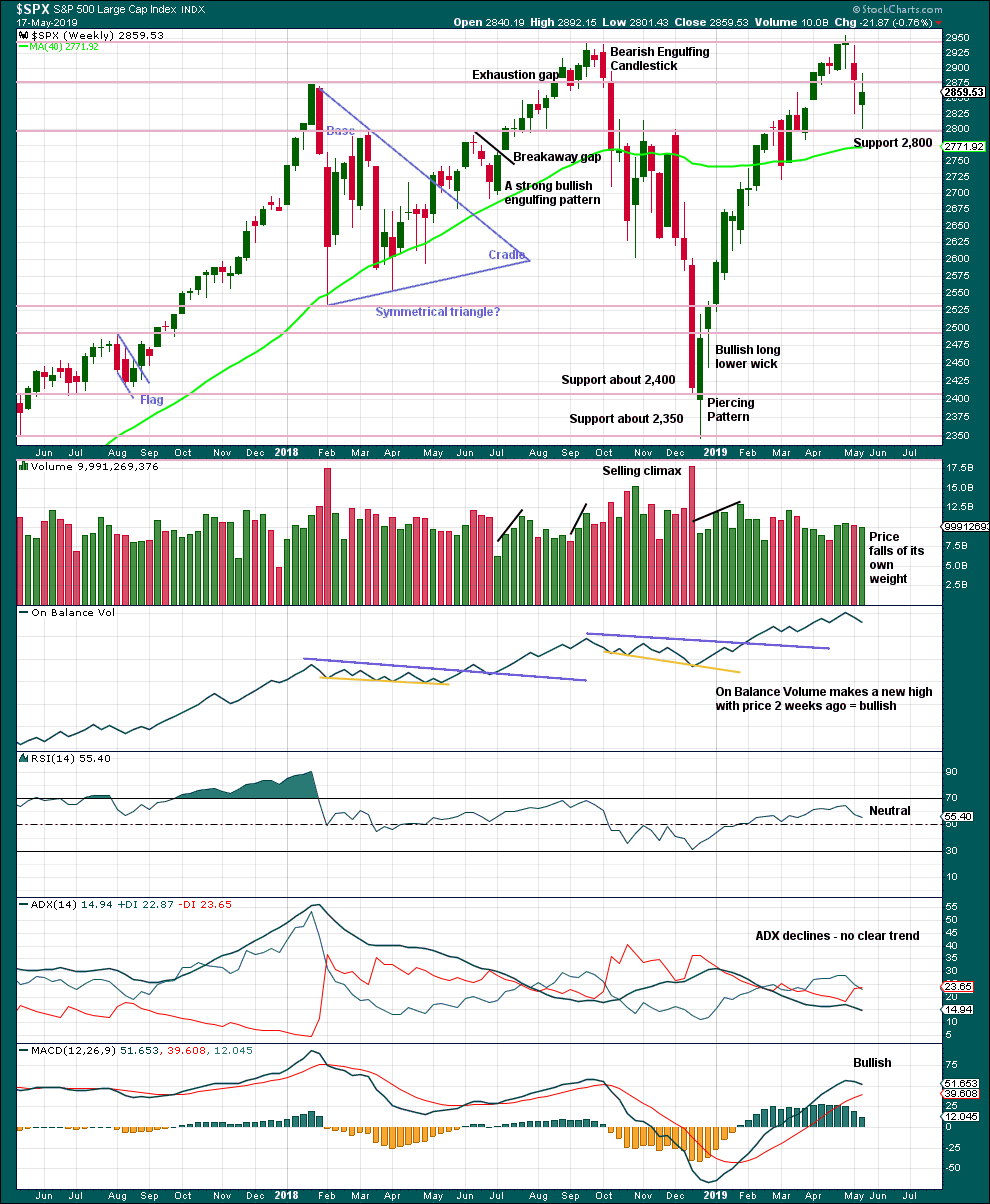
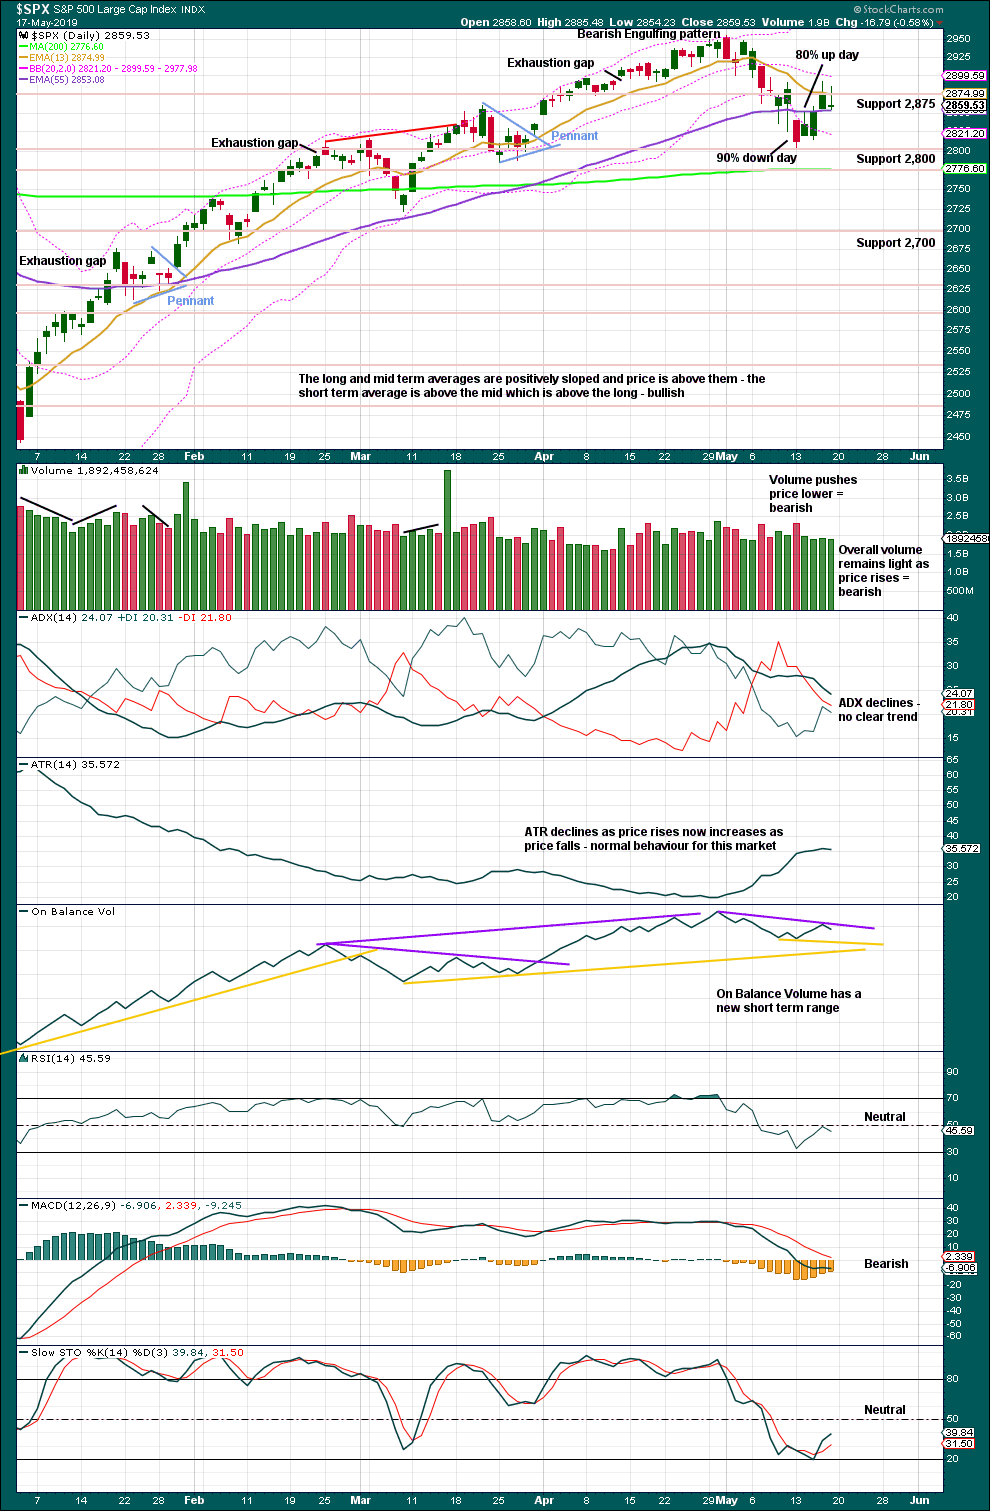
This week looks like a spinning top, although the real body may be too large for a typical spinning top. This puts the trend towards neutral. Support about 2,800 is strong and has so far held this week.
There is an upwards trend from the low in December 2018, a series of higher highs and higher lows with a new all time high on the 30th of April 2019. While the last swing low at 2,785.02 on the 25th of March remains intact, then this view should remain dominant.
The trend is your friend.
DAILY CHART
Click chart to enlarge. Chart courtesy of StockCharts.com.
A 90% downwards day at or immediately prior a low followed immediately afterwards by a 90% upwards day is a strong indication of a low in place. The indication is weaker in this case, but the movement is also weaker. The 80% upwards day of the 14th of May shows an almost 180 degree shift in sentiment after the 90% downwards day immediately prior. This is a pattern seen at minor lows.
The dominant trend is up. Pullbacks in an upwards trend should be used as opportunities to join the trend.
It has been noted before that this market has been rising with light and declining volume at all time frames now for years. A lack of support from volume for upwards movement in the last few sessions is not of a concern in current market conditions.
Watch On Balance Volume carefully next week. A breakout would provide a weak signal that may add a little confidence to the next move from price.
BREADTH – AD LINE
WEEKLY CHART
Click chart to enlarge. Chart courtesy of StockCharts.com. So that colour blind members are included, bearish signals
will be noted with blue and bullish signals with yellow.
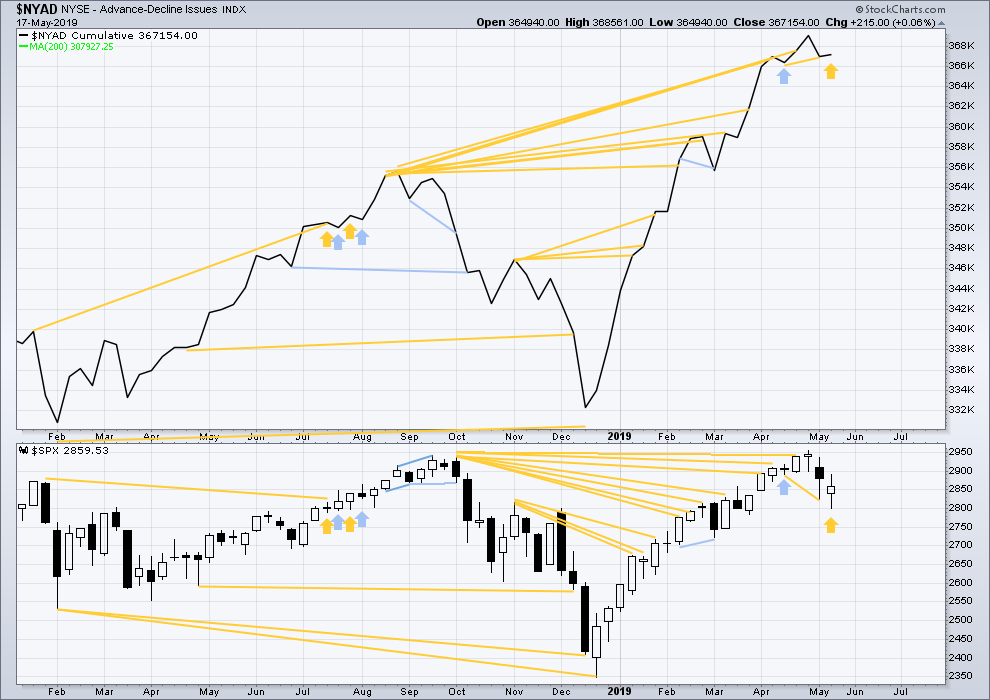
Every single bear market from the Great Depression and onwards has been preceded by a minimum of 4 months divergence between price and the AD line. With the AD line making a new all time high again last week, the end of this bull market and the start of a new bear market must be a minimum of 4 months away, which is the beginning of September 2019 at this time.
This week price has moved lower with a lower low and a lower high, although the candlestick has closed green. The AD line has moved higher this week. This divergence is bullish and supports the view that a low may now be in place.
This week all of large, mid and small caps have moved lower. None have made new swing lows below the low of the 25th of March. There is no divergence.
DAILY CHART
Click chart to enlarge. Chart courtesy of StockCharts.com. So that colour blind members are included, bearish signals
will be noted with blue and bullish signals with yellow.
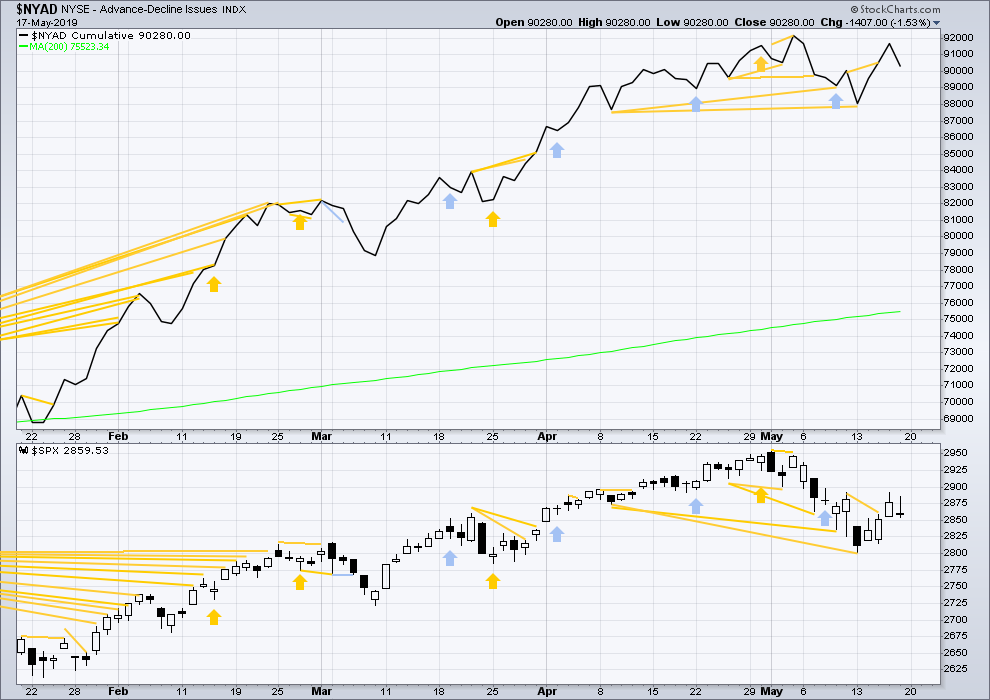
Breadth should be read as a leading indicator.
Mid-term bullish divergence remains and supports the view here that a low may be in place.
On Friday both price and the AD line moved lower. There is no new short-term divergence.
VOLATILITY – INVERTED VIX CHART
WEEKLY CHART
Click chart to enlarge. Chart courtesy of StockCharts.com. So that colour blind members are included, bearish signals
will be noted with blue and bullish signals with yellow.
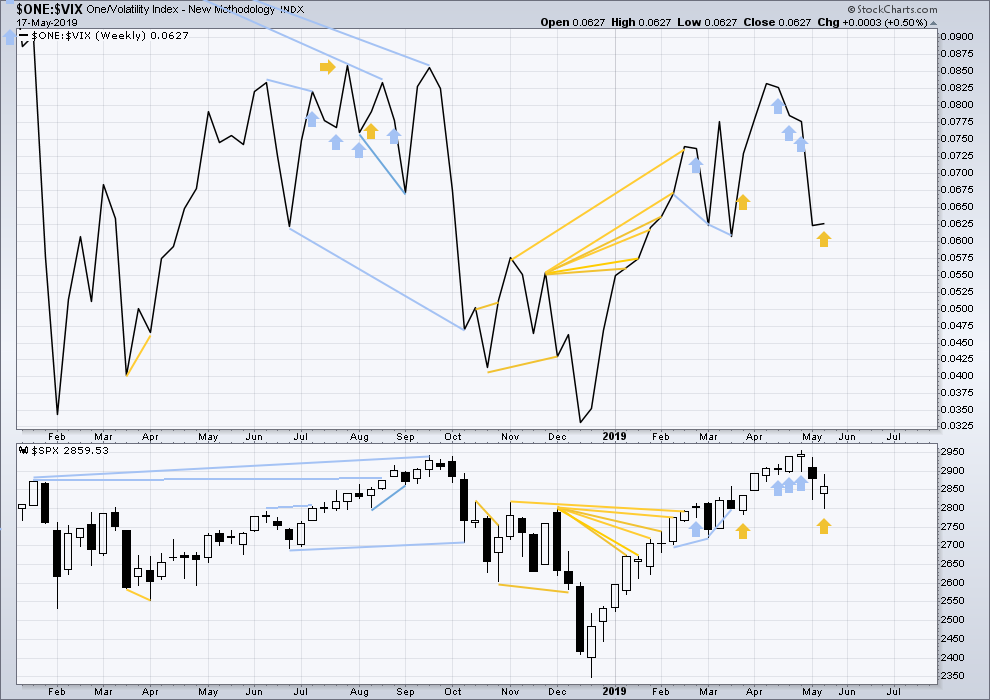
Three weeks in a row of weekly bearish divergence has now been followed by two reasonable downwards weeks. It may be resolved here, or it may yet be an indication of further downwards movement in price.
This week price moved lower, but the candlestick has closed green. Inverted VIX has moved higher. This divergence is bullish.
DAILY CHART
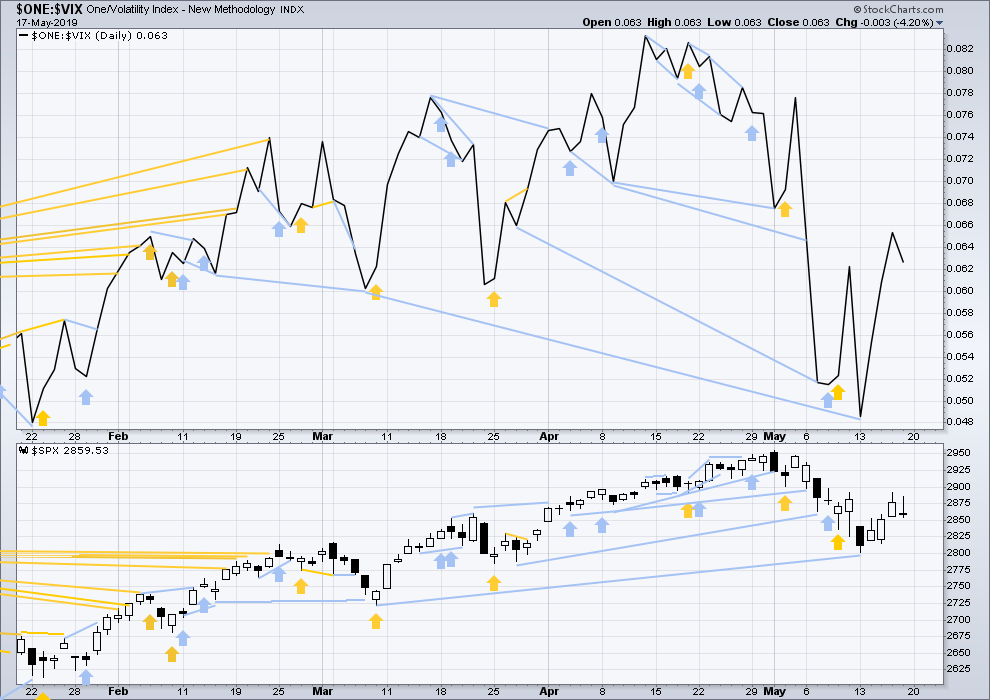
Click chart to enlarge. Chart courtesy of StockCharts.com. So that colour blind members are included, bearish signals
will be noted with blue and bullish signals with yellow.
On Friday both price and inverted VIX have moved lower. There is no new short-term divergence.
DOW THEORY
Dow Theory confirmed a bear market in December 2018. This does not necessarily mean a bear market at Grand Super Cycle degree though; Dow Theory makes no comment on Elliott wave counts. On the 25th of August 2015 Dow Theory also confirmed a bear market. The Elliott wave count sees that as part of cycle wave II. After Dow Theory confirmation of a bear market in August 2015, price went on to make new all time highs and the bull market continued.
DJIA: 23,344.52 – a close on the 19th of December at 23,284.97 confirms a bear market.
DJT: 9,806.79 – price has closed below this point on the 13th of December.
S&P500: 2,532.69 – a close on the 19th of December at 2,506.96 provides support to a bear market conclusion.
Nasdaq: 6,630.67 – a close on the 19th of December at 6,618.86 provides support to a bear market conclusion.
With all the indices moving now higher, Dow Theory would confirm a bull market if the following highs are made:
DJIA: 26,951.81
DJT: 11,623.58
S&P500: 2,940.91 – a new all time high has been made on the 29th of April 2019.
Nasdaq: 8,133.30 – a new high has been made on 24th of April 2019.
GOLD
Price is now range bound. Two Elliott wave counts are used to map out possible movement and targets after a breakout in either direction.
Summary: Resistance is about 1,310 and support is about 1,265.
A downwards breakout may be slightly more likely. The target would then be at 1,219 (which may not be low enough).
However, the target would be at 1,346 if there is an upwards breakout with support from volume.
Grand SuperCycle analysis is here.
Last monthly charts are here. Video is here.
MAIN ELLIOTT WAVE COUNT
WEEKLY CHART – TRIANGLE
Click chart to enlarge.
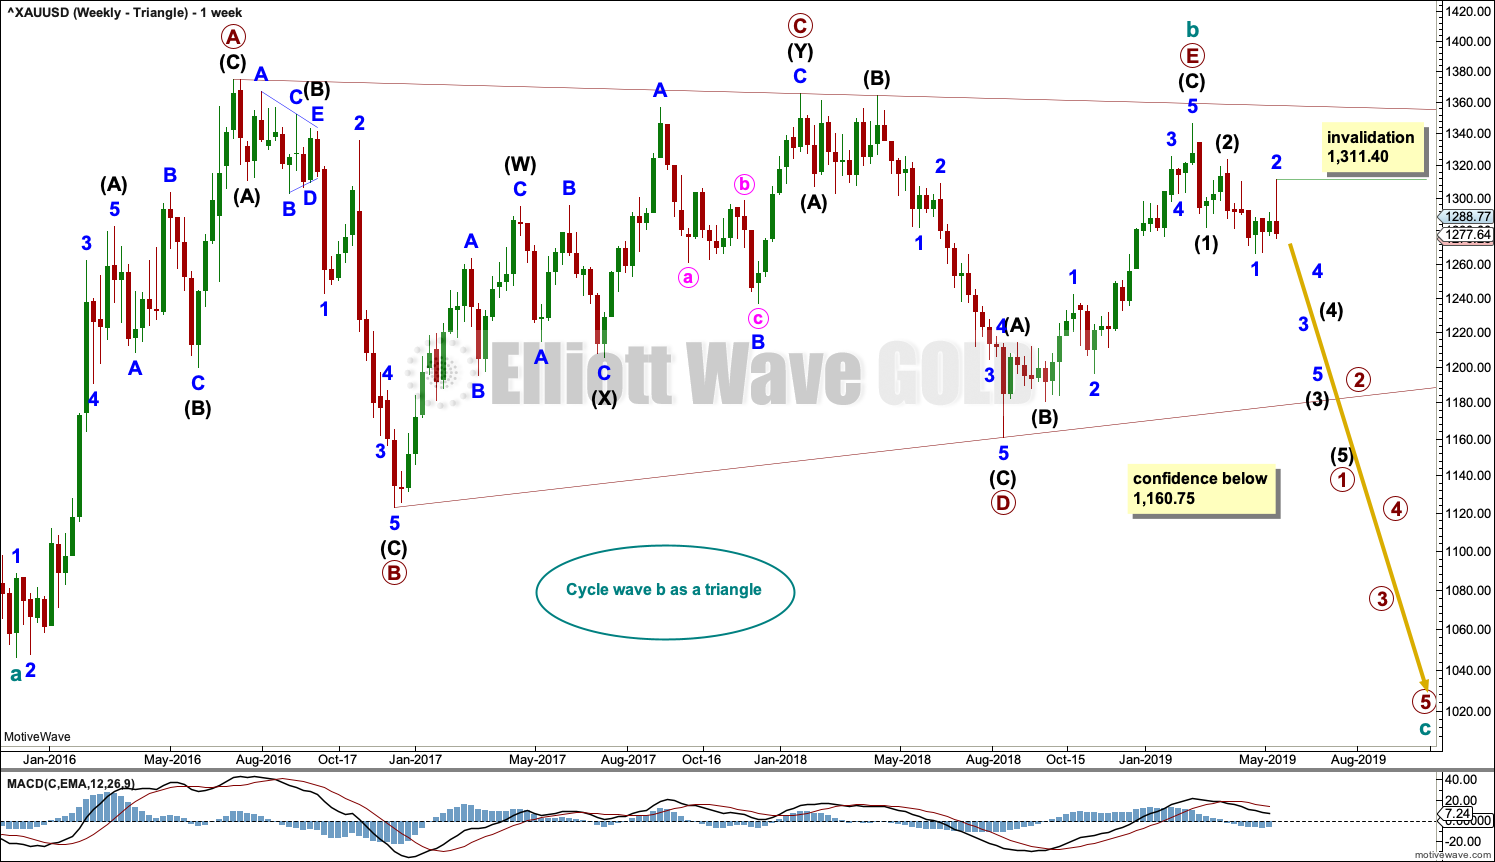
The basic Elliott wave structure is five waves up followed by three waves back (in a bull market). At this time, the preferred Elliott wave count sees Gold as still within three waves back, which began at the all time high in September 2011.
Five waves up are labelled 1,2,3,4,5. Three waves back are labelled A,B,C.
This wave count sees Gold as now about two thirds through the three waves back. The three wave structure is labelled cycle waves a, b and c.
It remains possible that the triangle of cycle wave b is complete and cycle wave c downwards has begun.
Within the final wave of the triangle, primary wave E may be a complete zigzag.
Cycle wave c must subdivide as a five wave structure at primary degree, with primary waves 1, 2, 3, 4 and 5. So far primary wave 1 for this wave count would be incomplete.
Primary wave 1 must subdivide as a five wave structure at intermediate degree. So far intermediate waves (1) and (2) may be complete.
Intermediate wave (3) may only subdivide as a five wave impulse at minor degree. So far minor waves 1 and 2 may be complete.
Minor wave 3 may only subdivide as a five wave impulse at minute degree. Within minor wave 3, minute wave ii may not move beyond the start of minute wave i above 1,311.40.
DAILY CHART – TRIANGLE
Click chart to enlarge.
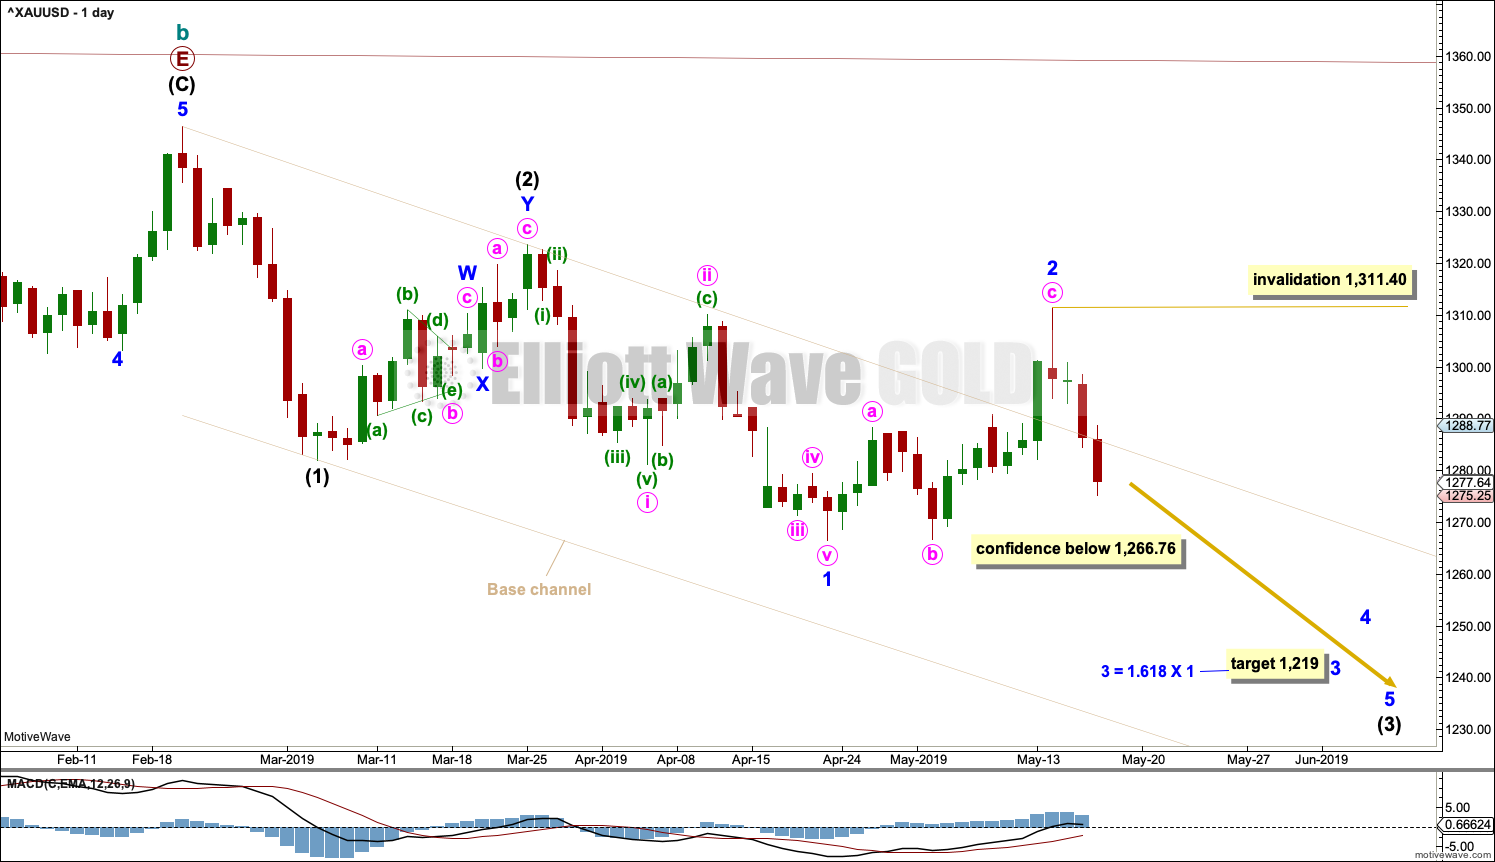
A target is calculated for minor wave 3 to end based upon the most common Fibonacci ratio to minor wave 1.
A base channel is drawn about intermediate waves (1) and (2). The first trend line of a base channel is drawn from the start of the first wave to the end of the second wave, then a parallel copy is placed upon the end of the first wave. Lower degree second wave corrections in a bear market usually find resistance at the upper edge of the base channel. In this instance, minor wave 2 did not find resistance at the upper edge of the base channel; the channel is breached, which does not invalidate the wave count but does reduce the probability. For this reason the alternate below is considered.
However, base channels do not always work. Gold usually begins new trends slowly with deep and time consuming second wave corrections. Sometimes these deep second wave corrections may breach base channels. The trend usually accelerates through the middle of the third wave and may exhibit explosive movement at the end of third waves.
This wave count requires a new low below 1,266.76 now for confidence.
This wave count now expects to see a strong increase in downwards momentum.
WEEKLY CHART – TRIANGLE – ALTERNATE
Click chart to enlarge.
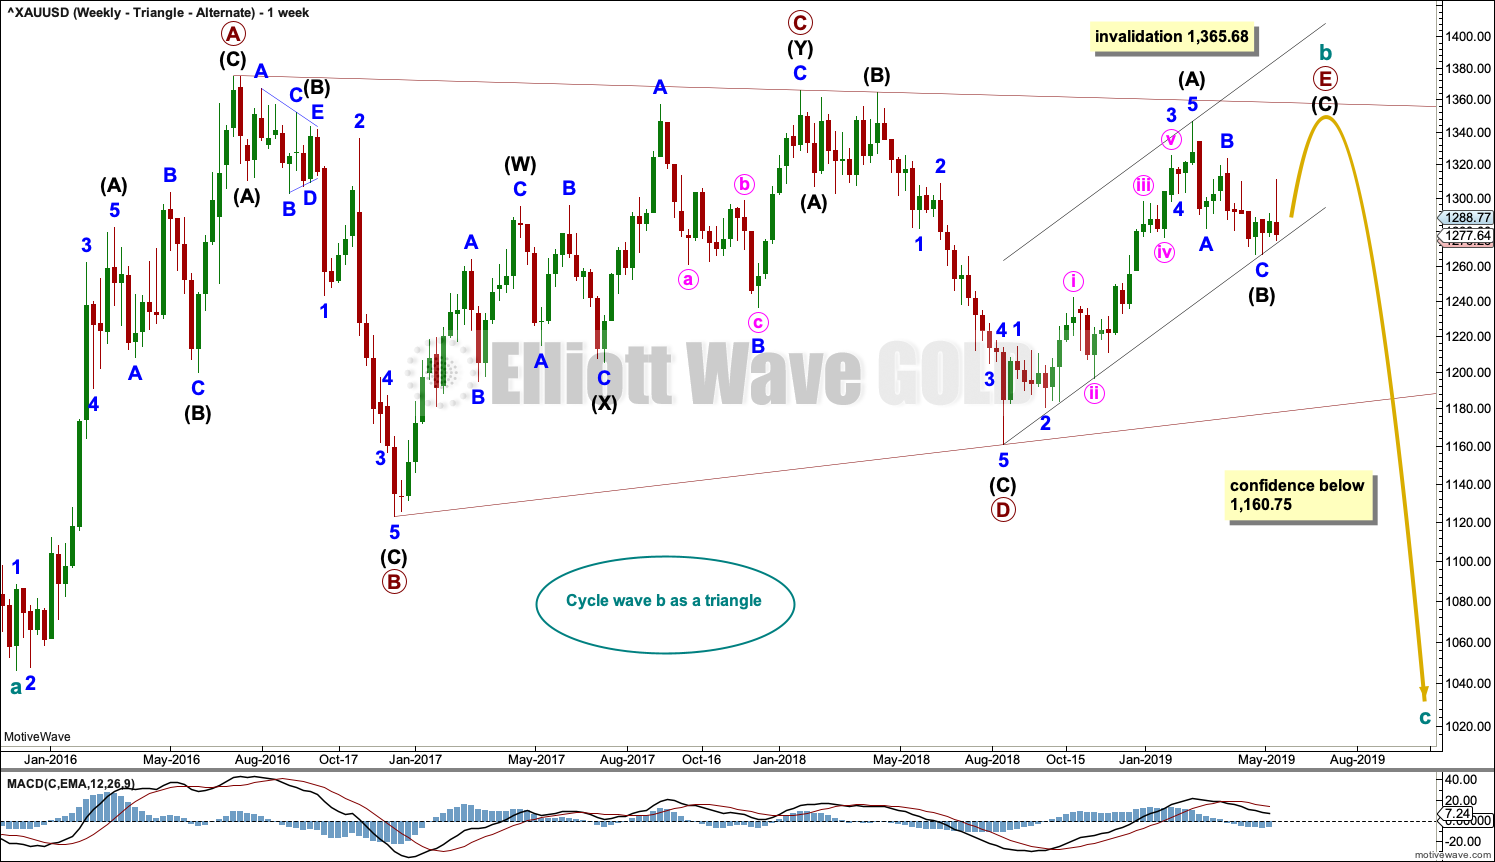
The triangle for cycle wave b may still be incomplete. The final sub-wave of primary wave E may be an incomplete zigzag. Within the zigzag of primary wave E, intermediate wave (C) would be very likely to make at least a slight new high above the end of intermediate wave (A) to avoid a truncation.
Primary wave E may either undershoot or overshoot the A-C trend line. Primary wave E may not move beyond the end of primary wave C above 1,365.68.
Within the five sub-waves of an Elliott triangle, one sub-wave usually subdivides as a more complicated double zigzag and the most common sub-wave to do so is wave C.
DAILY CHART – TRIANGLE – ALTERNATE
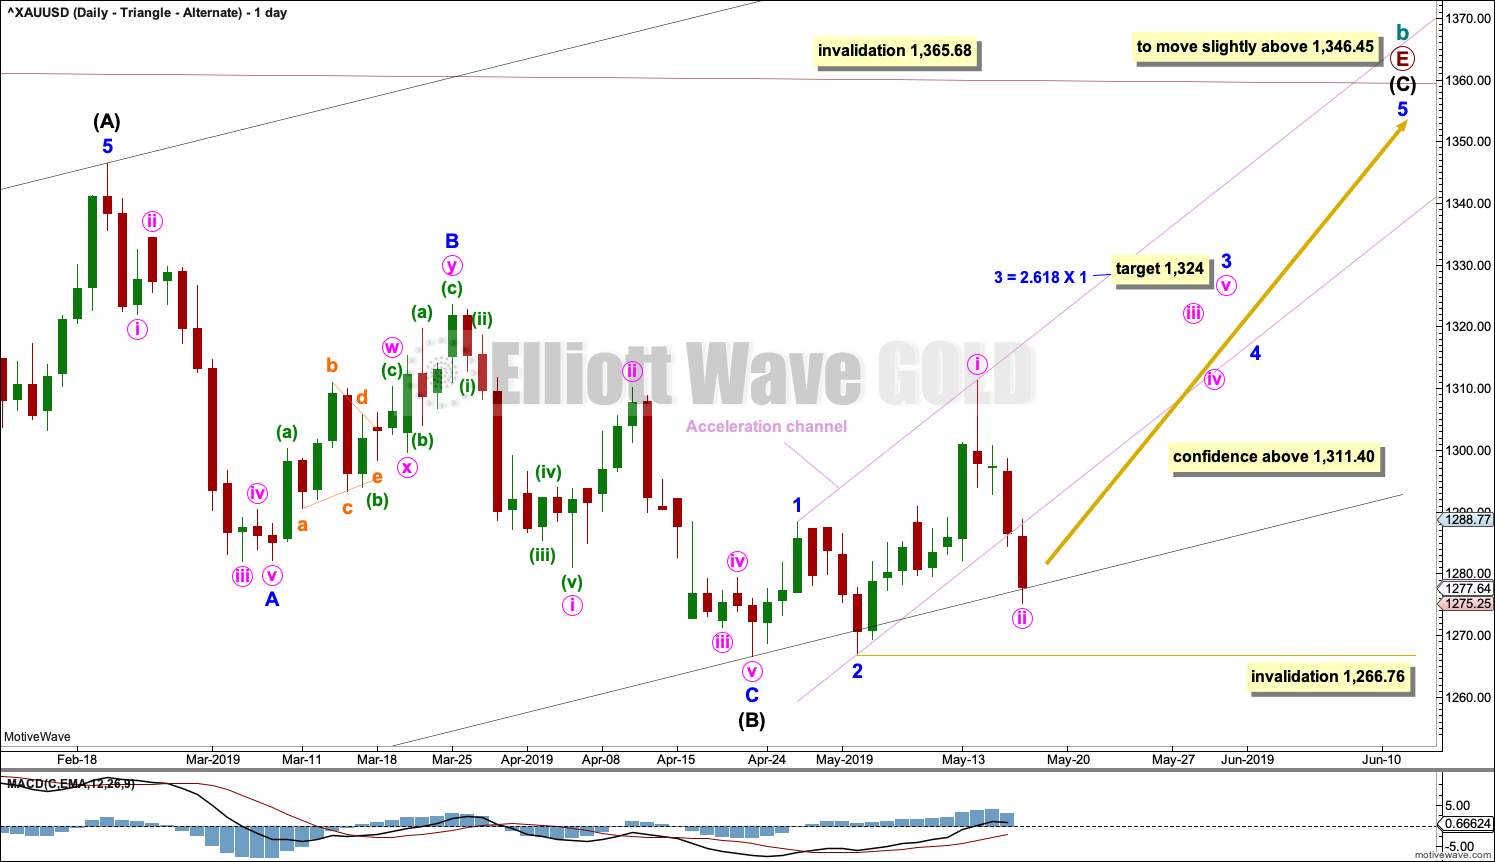
Click chart to enlarge.
The final zigzag of primary wave E must subdivide 5-3-5. Intermediate wave (C) must subdivide as a five wave motive structure, most likely an impulse.
Within the impulse of intermediate wave (C), minor waves 1 and 2 may be complete.
Minor wave 3 may only subdivide as an impulse. A target is calculated for it to end.
Draw an acceleration channel about upwards movement. Draw the first trend line from the end of minor wave 1 to the last high, then place a parallel copy on the end of minor wave 2. Keep redrawing the channel as price continues higher.
Within minor wave 3, minute waves i and ii may be complete. Minute wave ii has strongly breached the lower edge of the acceleration channel. This does not have a normal look and reduces the probability of this wave count now. If it continues lower, then minute wave ii may not move beyond the start of minute wave i below 1,266.76.
This wave count now expects to see a strong increase in upwards momentum as a third wave at two degrees unfolds.
WEEKLY CHART – DOUBLE ZIGZAG

Click chart to enlarge.
This wave count is identical to the first weekly chart up to the low labelled cycle wave a. Thereafter, a different Elliott wave corrective structure is considered for cycle wave b.
It is possible that cycle wave b may be an incomplete double zigzag or a double combination.
The first zigzag in the double is labelled primary wave W. This has a good fit.
The double may be joined by a corrective structure in the opposite direction, a triangle labelled primary wave X. The triangle may be incomplete.
Within multiples, X waves are almost always zigzags and rarely triangles. Within the possible triangle of primary wave X, it is intermediate wave (B) that is a multiple; this is acceptable, but note this is not the most common triangle sub-wave to subdivide as a multiple. These two points reduce the probability of this wave count in terms of Elliott wave.
Intermediate wave (D) of a contracting triangle may not move beyond the end of intermediate wave (B) above 1,365.68.
Intermediate wave (D) of a barrier triangle may end about the same level as intermediate wave (B); as long as the (B)-(D) trend line remains essentially flat the triangle will remain valid. This is the only Elliott wave rule that is not black and white. In practice, intermediate wave (D) may end slightly above intermediate wave (B) at 1,365.68 and this wave count would remain valid.
Primary wave Y would most likely be a zigzag because primary wave X would be shallow; double zigzags normally have relatively shallow X waves.
Primary wave Y may also be a flat correction if cycle wave b is a double combination, but combinations normally have deep X waves. This would be less likely.
This wave count has good proportions and no problems in terms of subdivisions.
It is also possible for this wave count that intermediate wave (D) was over at the last high and that intermediate wave (E) downwards may continue, in the same way as the main wave count above.
ALTERNATE ELLIOTT WAVE COUNT
WEEKLY CHART
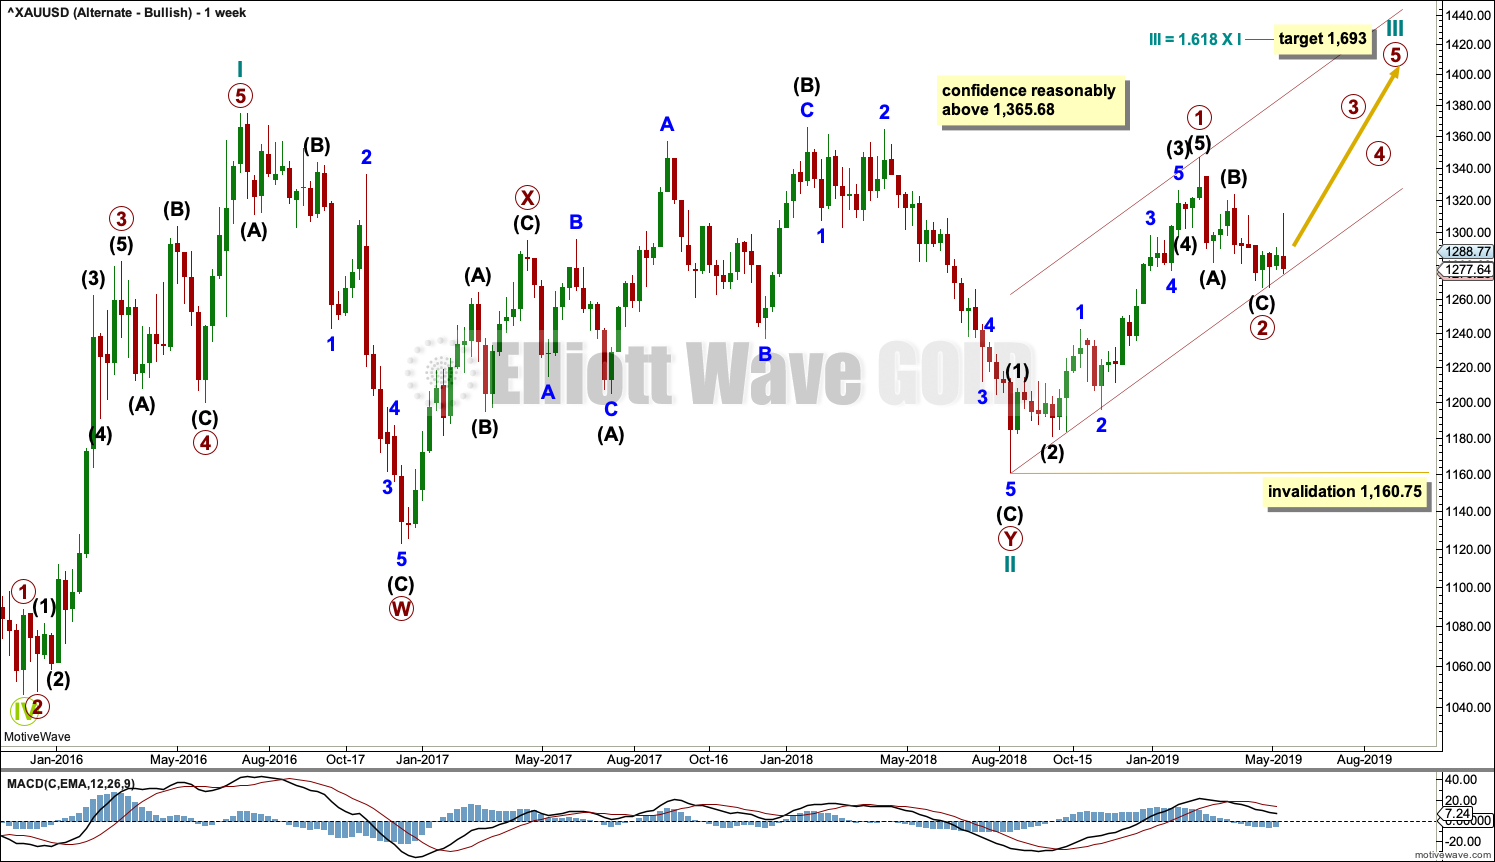
Click chart to enlarge.
This wave count sees the three waves back now complete at the last major low for Gold in November 2019.
If Gold is in a new bull market, then it should begin with a five wave structure upwards on the weekly chart. However, the biggest problem with this wave count is the structure labelled cycle wave I because this wave count must see it as a five wave structure, but it looks more like a three wave structure.
Commodities often exhibit swift strong fifth waves that force the fourth wave corrections coming just prior and just after to be more brief and shallow than their counterpart second waves. It is unusual for a commodity to exhibit a quick second wave and a more time consuming fourth wave, and this is how cycle wave I is labelled. The probability of this wave count is low due to this problem.
Cycle wave II subdivides well as a double combination: zigzag – X – expanded flat.
Cycle wave III may have begun. Within cycle wave III, primary waves 1 and 2 may now be complete. If it continues lower as a double zigzag, then primary wave 2 may not move beyond the start of primary wave 1 below 1,160.75.
Cycle wave III so far for this wave count would have been underway now for 39 weeks. It should be beginning to exhibit some support from volume, increase in upwards momentum and increasing ATR. However, ATR continues to decline and is very low, and momentum is weak in comparison to cycle wave I. This wave count lacks support from classic technical analysis.
TECHNICAL ANALYSIS
WEEKLY CHART
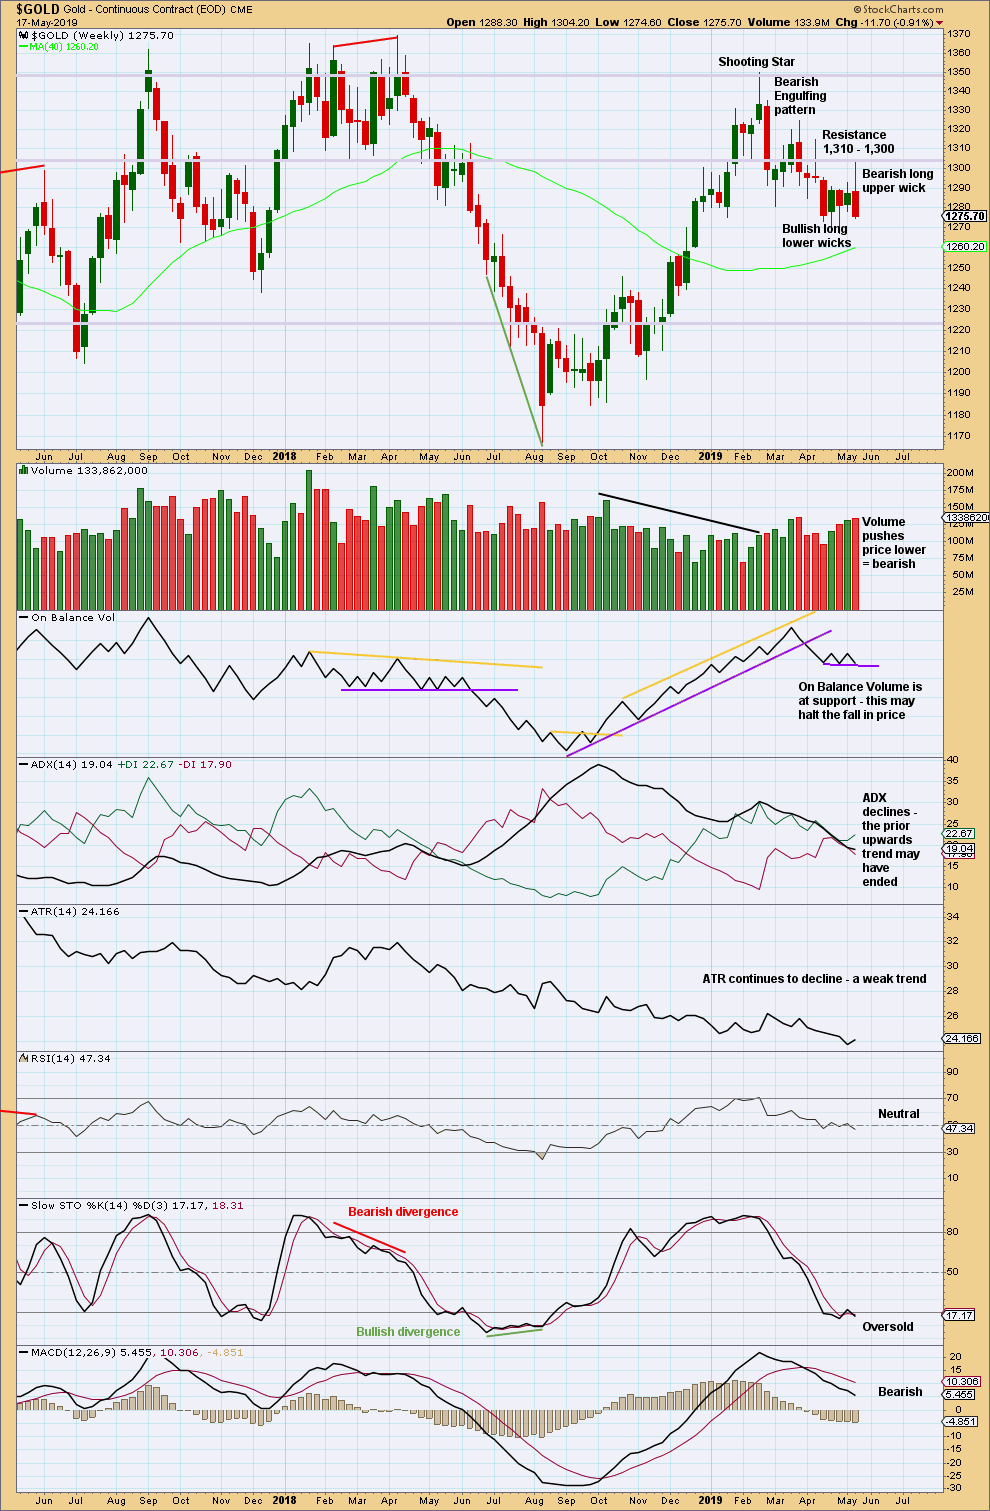
Click chart to enlarge. Chart courtesy of StockCharts.com.
This week closes red with a long upper wick and a little support from volume for downwards movement. Overall, this week looks bearish. With price closing very close to the low for the week, it looks like next week may begin with more downwards movement.
DAILY CHART
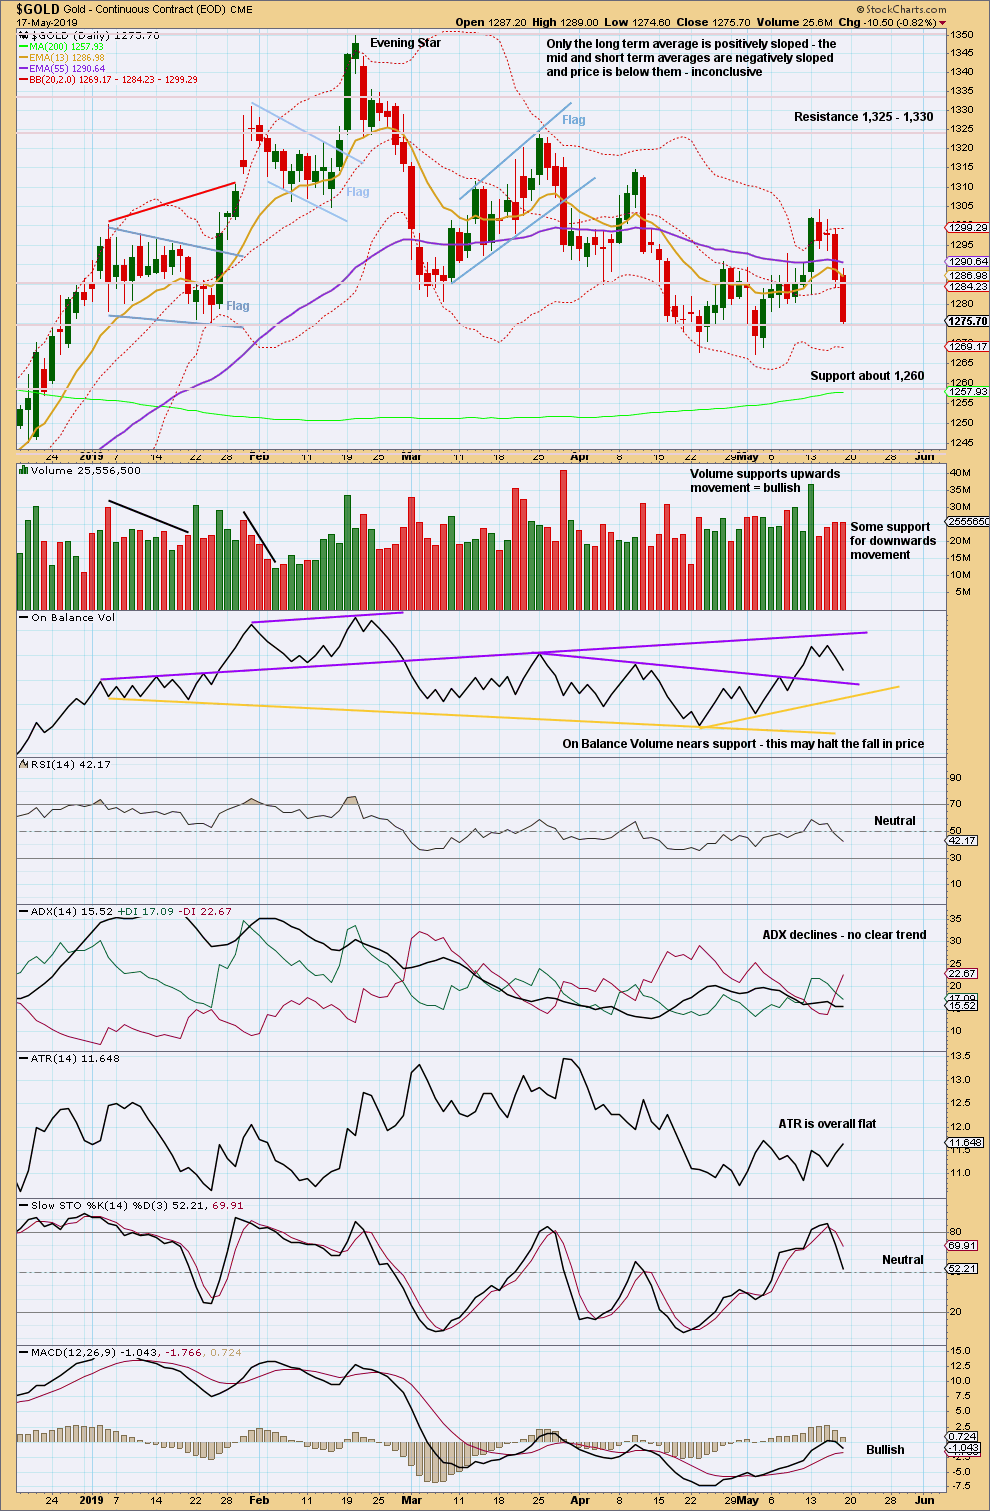
Click chart to enlarge. Chart courtesy of StockCharts.com.
From August 2018 Gold moved higher with a series of higher highs and higher lows. This series remained intact until the 1st of March 2019 when a lower low was made. At that stage, it was possible that Gold had seen a trend change.
There is now a new series of three lower swing highs and three lower swing lows. The last high of the 10th of April still remains intact at the end of this week. A trend change to downwards remains possible.
Volume declined very slightly for Friday’s session, but remains reasonable. Volume is still pushing price lower. The two large range candlesticks for Thursday and Friday are bearish.
GDX WEEKLY CHART
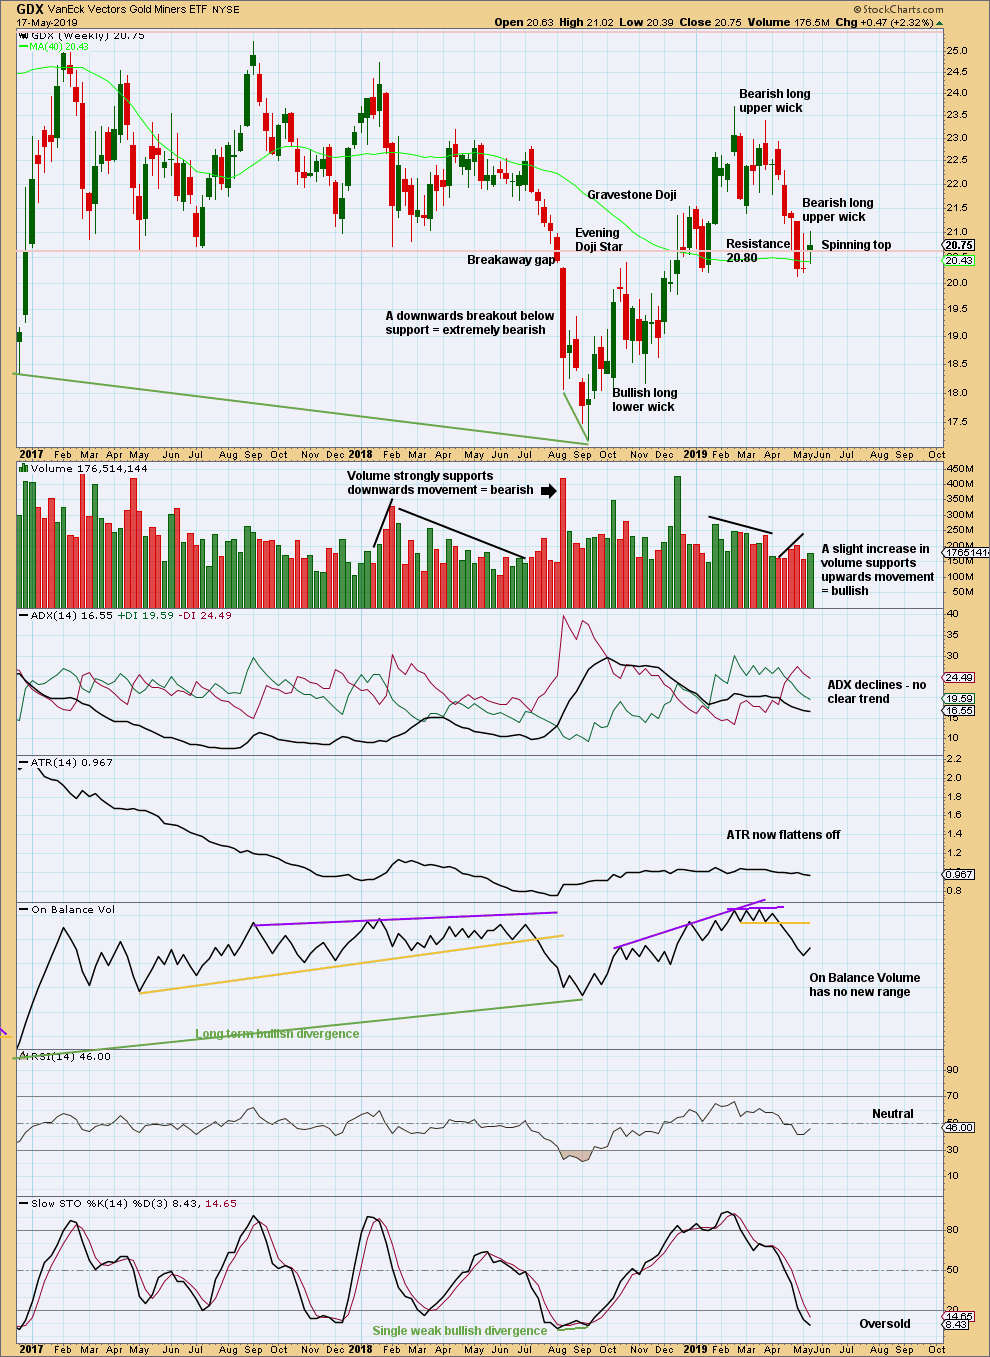
Click chart to enlarge. Chart courtesy of StockCharts.com.
There is now a series of two lower highs and lower lows at the weekly chart level. GDX may have seen a trend change to downwards, but ADX does not yet agree. The bearish signal from On Balance Volume supports this view.
Price has again closed below 20.80. The spinning top candlestick pattern this week is neutral.
GDX DAILY CHART
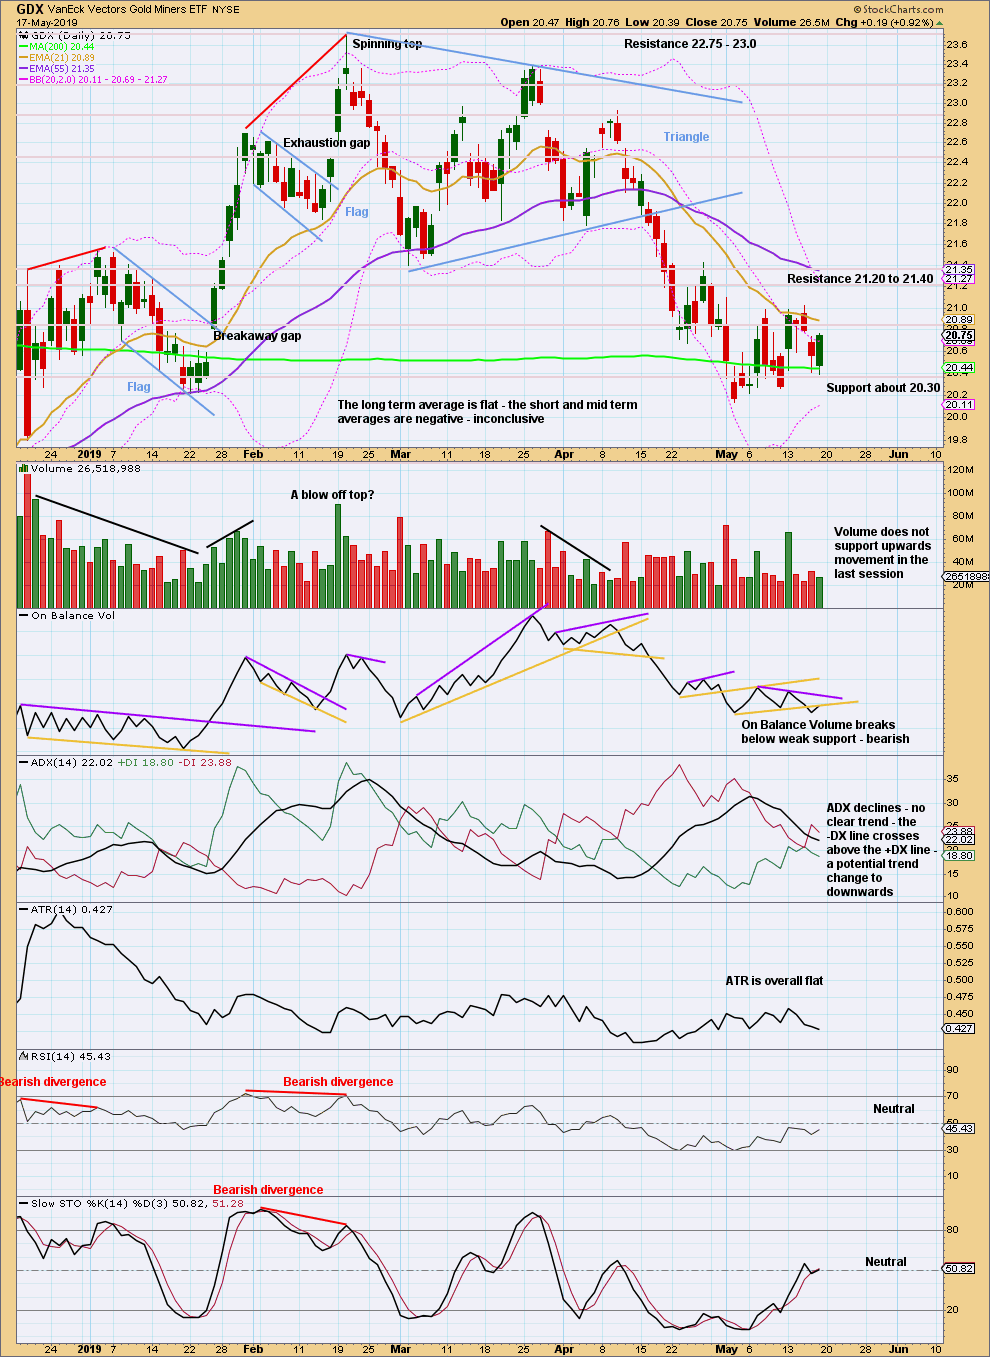
Click chart to enlarge. Chart courtesy of StockCharts.com.
A target calculated from the triangle width is now at 19.58.
The last swing high of the 26th of April at 21.43 may remain intact.
US OIL
An upwards week sees price remain below the invalidation point. Volume analysis is relied upon heavily this week to indicate the direction for next week.
Summary: The next wave down may now begin. The final target is now calculated at 10.72.
Further confidence that a high is in place may be had if price makes a new low below 58.20.
MAIN ELLIOTT WAVE COUNT
MONTHLY CHART
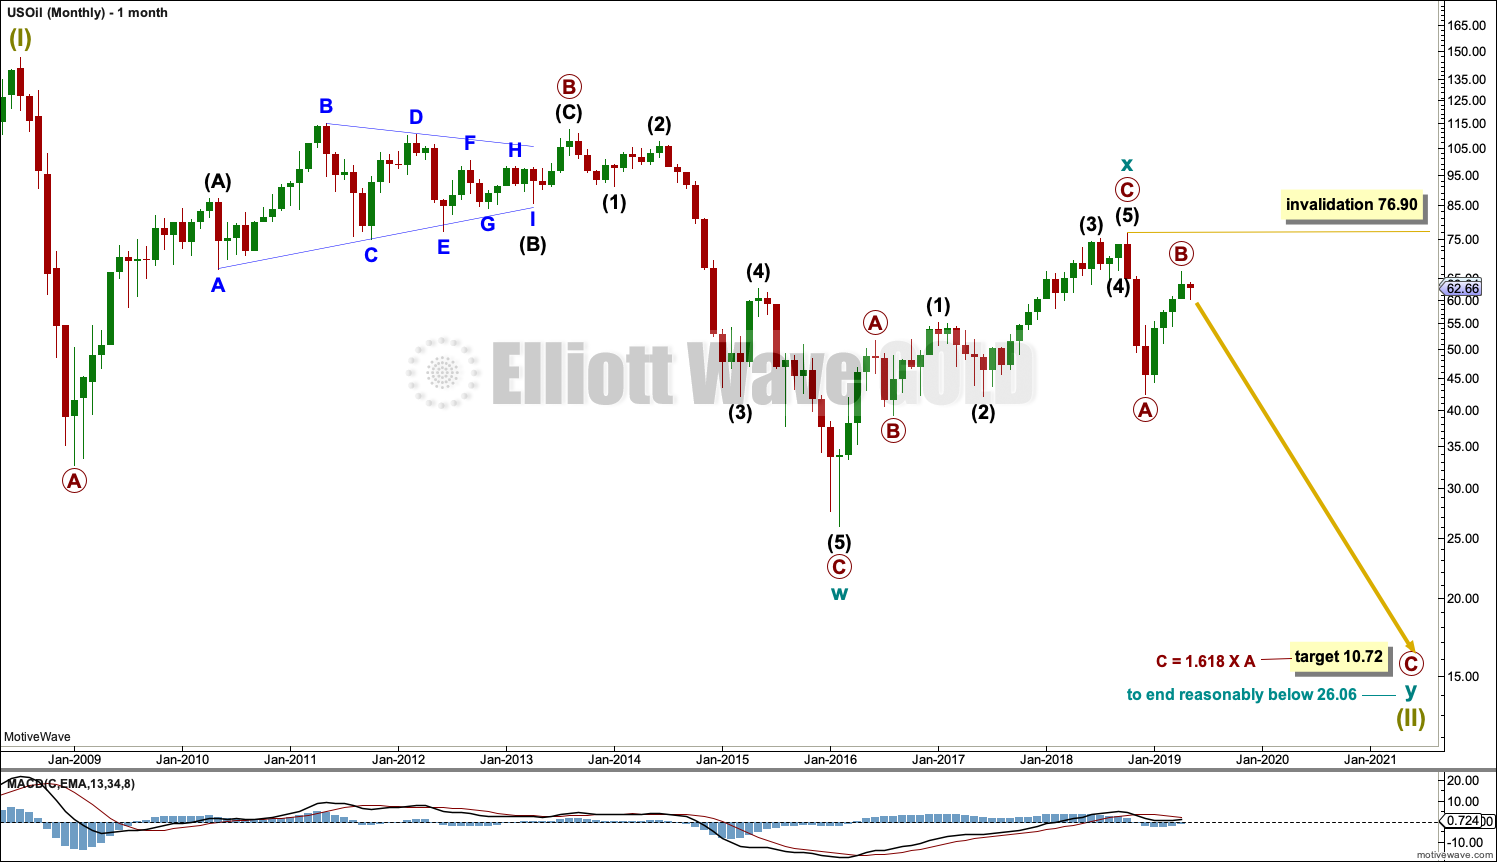
Click chart to enlarge.
The basic Elliott wave structure is five steps forward and three steps back. This Elliott wave count expects that US Oil is still within a three steps back pattern, which began in July 2008. The Elliott wave count expects that the bear market for US Oil continues.
This Elliott wave corrective structure is a double zigzag, which is a fairly common structure. The correction is labelled Super Cycle wave (II).
The first zigzag in the double is complete and labelled cycle wave y. The double is joined by a three in the opposite direction labelled cycle wave x, which subdivides as a zigzag. The second zigzag in the double may now have begun, labelled cycle wave w.
The purpose of a second zigzag in a double zigzag is to deepen the correction when the first zigzag does not move price deep enough. To achieve this purpose cycle wave y may be expected to move reasonably below the end of cycle wave w at 26.06. The target calculated would see this expectation met.
Cycle wave y is expected to subdivide as a zigzag, which subdivides 5-3-5.
Cycle wave w lasted 7.6 years and cycle wave x lasted 2.7 years. Cycle wave y may be expected to last possibly about a Fibonacci 5 or 8 years.
If it continues higher, then primary wave B may not move beyond the start of primary wave A above 76.90.
WEEKLY CHART
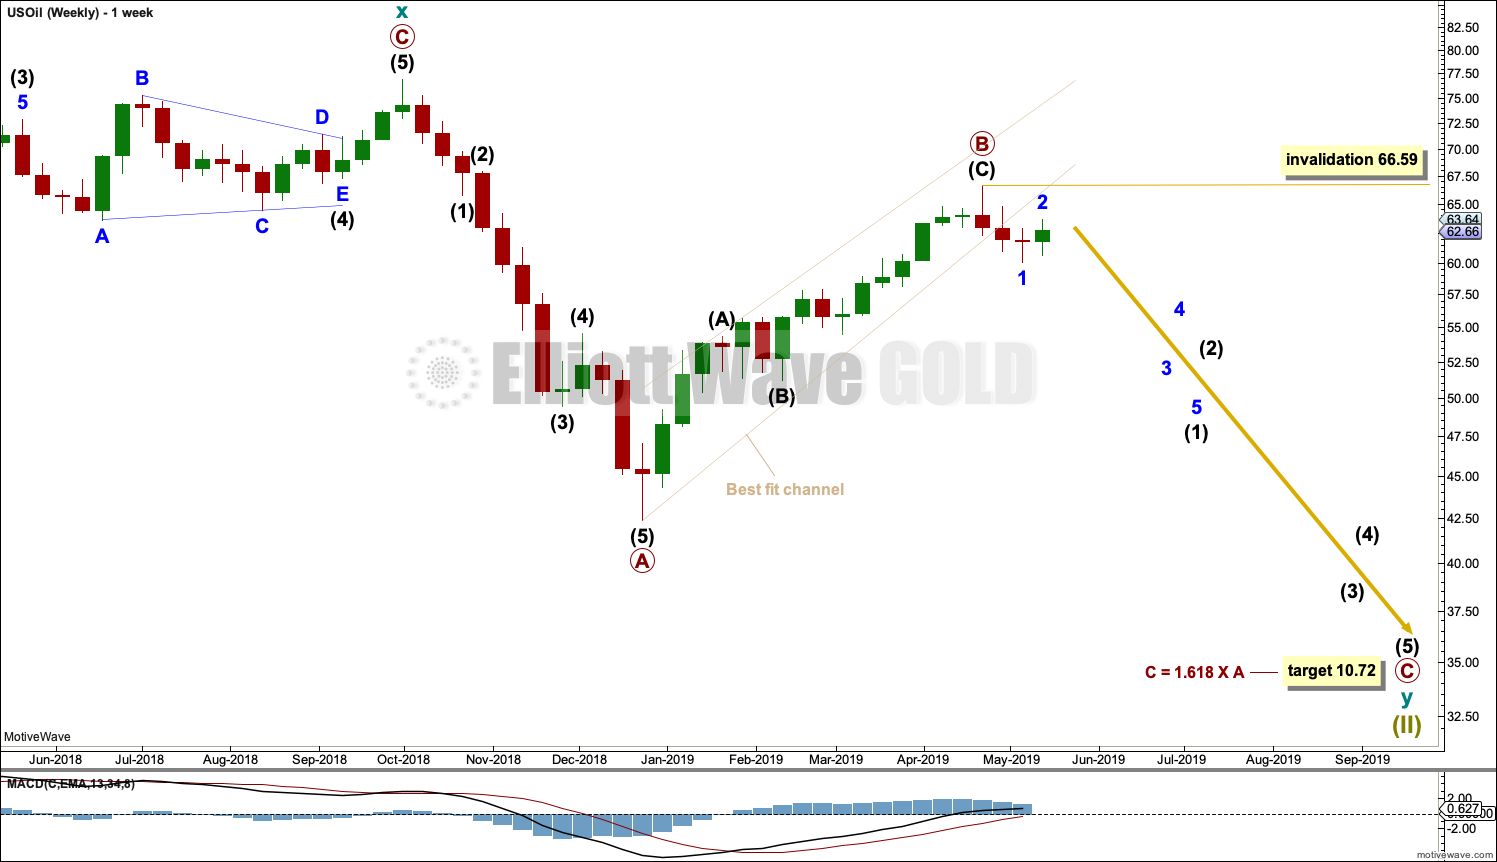
Click chart to enlarge.
This weekly chart is focussed on the start of cycle wave y.
Cycle wave y is expected to subdivide as a zigzag. A zigzag subdivides 5-3-5. Primary wave A must subdivide as a five wave structure if this wave count is correct.
Primary wave A may be a complete five wave impulse at the last low.
Primary wave B may now be a complete single zigzag at the last high.
Primary wave C may have just begun. Primary wave C must subdivide as a five wave structure.
Primary wave A lasted 12 weeks, just one short of a Fibonacci 13.
Primary wave C may be longer in time as well as price. It may last about a Fibonacci 21 or 34 weeks.
Within primary wave C, no second wave correction may move beyond its start above 66.59.
DAILY CHART
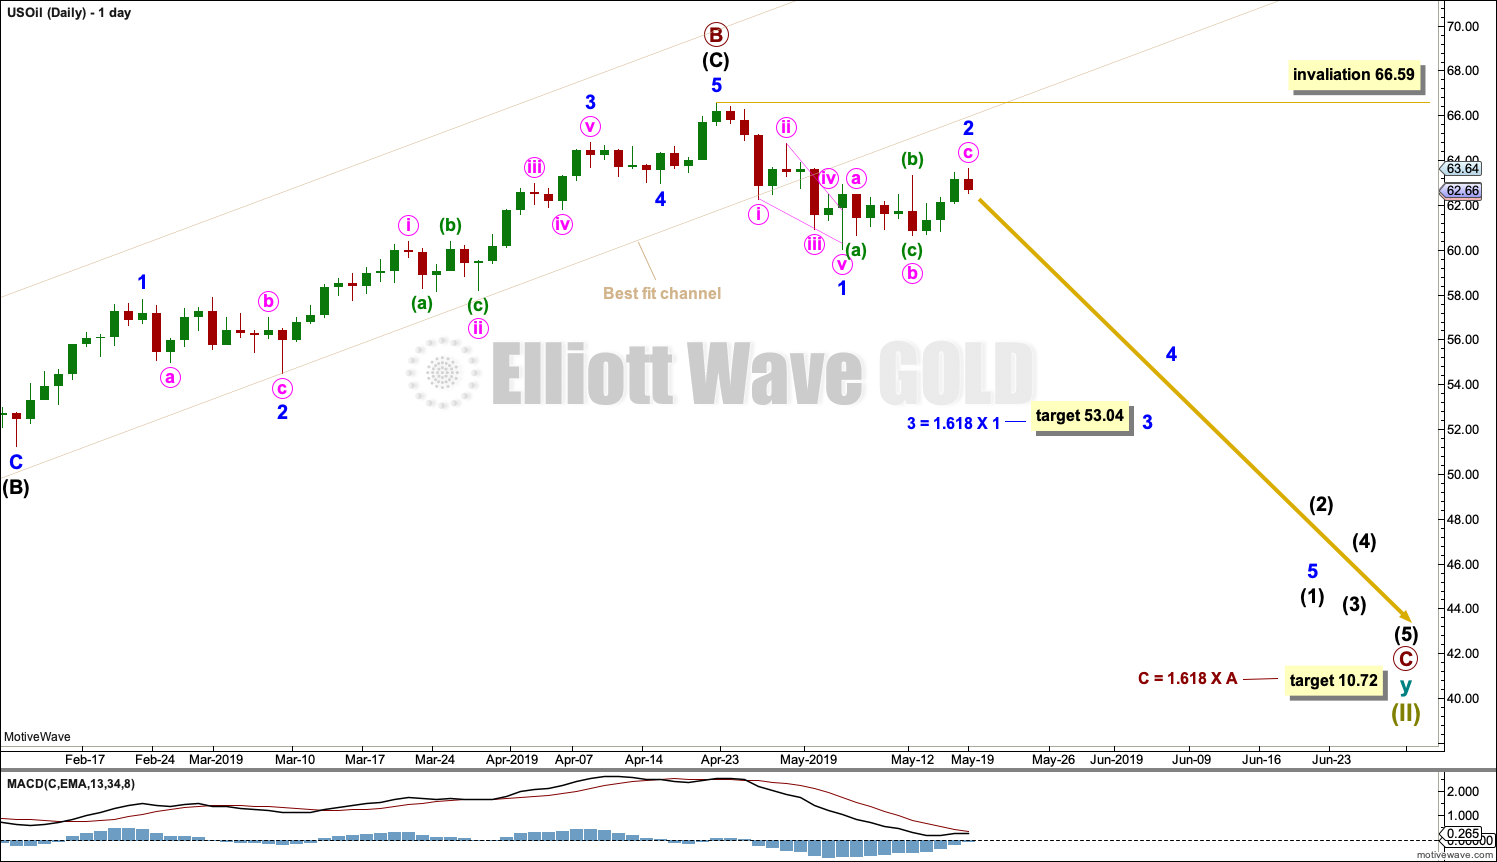
Click chart to enlarge.
Primary wave B is now labelled as a complete single zigzag.
Note that monthly and weekly charts are on a semi-log scale, but this daily chart is on an arithmetic scale. This makes a slight difference to trend channels. Use this channel on a daily chart on an arithmetic scale.
The channel is drawn conservatively to contain all of the bounce of primary wave B. There is now a very clear breach of this channel. This adds confidence now to the labelling of primary wave B as complete.
Primary wave C must subdivide as a five wave structure, most likely an impulse. Within the impulse, minor waves 1 and now 2 may be complete. A target is calculated for minor wave 3 that expects a common Fibonacci ratio to minor wave 1. If the target is wrong, it may not be low enough.
If it continues higher, then minor wave 2 may not move beyond the start of minor wave 1 above 66.59.
Primary wave C may be extended in time; the subdivisions of intermediate waves (2) and (4) may show up at the weekly time frame.
TECHNICAL ANALYSIS
MONTHLY CHART
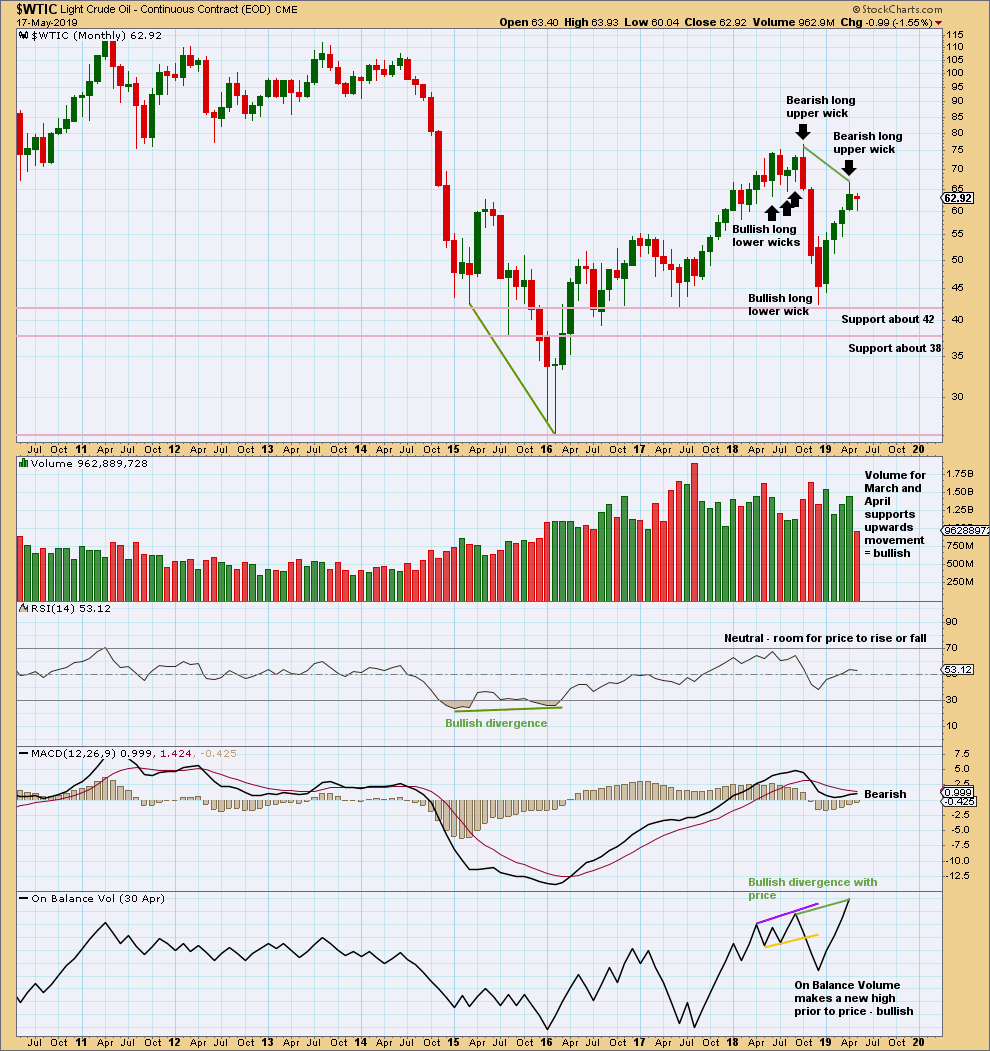
Click chart to enlarge. Chart courtesy of StockCharts.com.
Volume and On Balance Volume are bullish. This suggests the bounce may not be over, and this does not support the Elliott wave count.
The long upper wick on April’s monthly candlestick is bearish. This bearish signal is weaker than the bullish volume profile.
WEEKLY CHART

Click chart to enlarge. Chart courtesy of StockCharts.com.
A Shooting Star candlestick pattern is a bearish reversal pattern when it comes at the end of an upwards movement.
The short-term volume profile is now bearish.
DAILY CHART
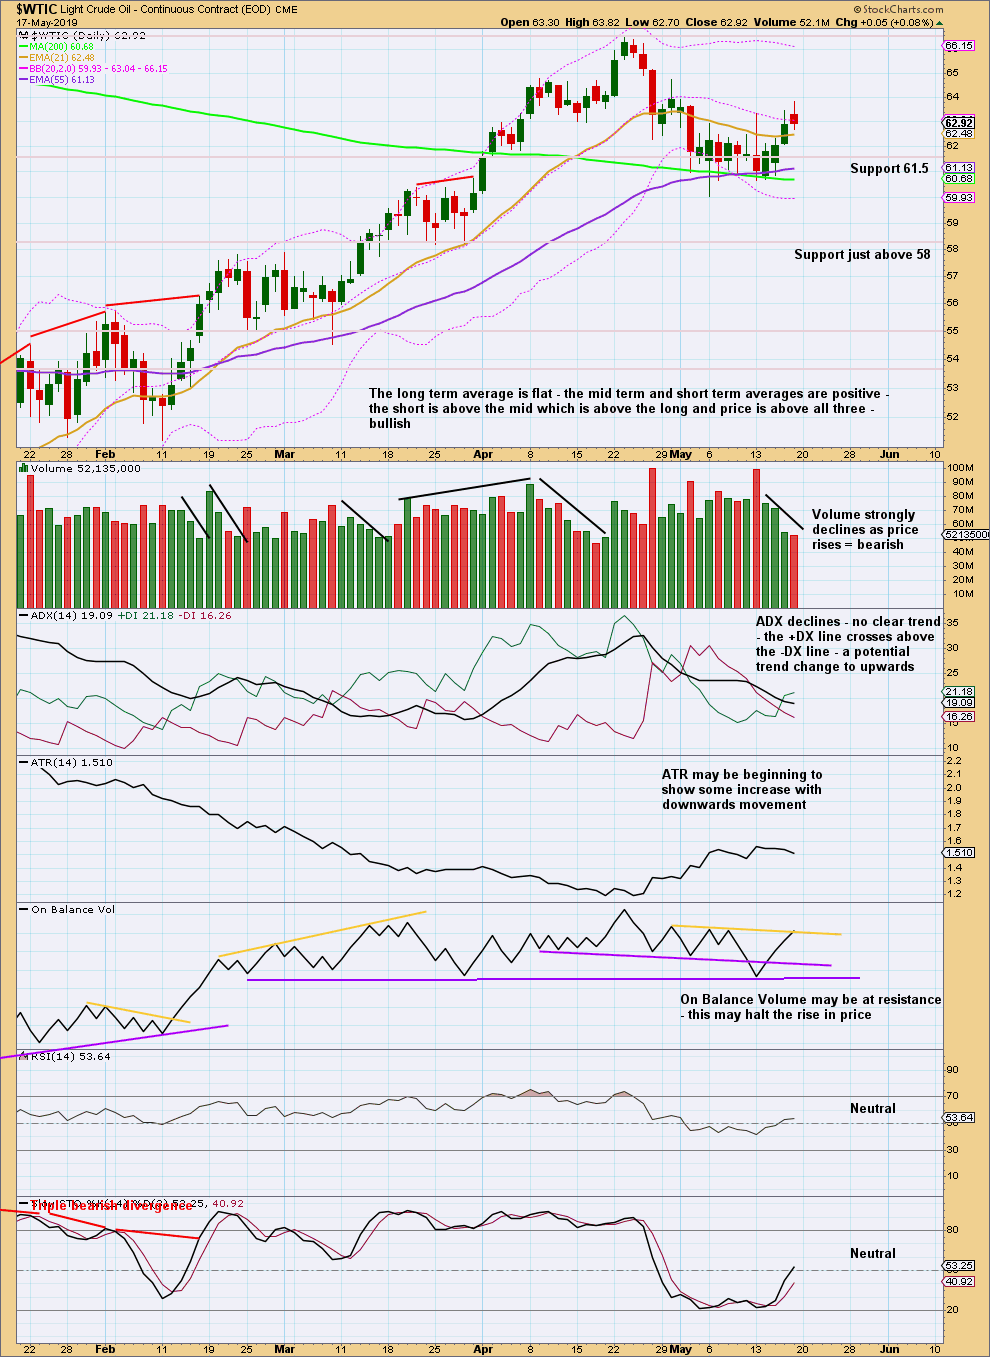
Click chart to enlarge. Chart courtesy of StockCharts.com.
Since the 24th of December 2018 there has been a series of higher highs and higher lows, the basic definition of an upwards trend. Assume this will continue until proven it has ended. A lower low below the low of the 28th of March 2019 at 58.20 would provide evidence the bounce is over.
The short-term volume profile remains fairly strongly bearish and supports the Elliott wave count.
On Balance Volume is right at resistance; it has not clearly broken above the yellow resistance line. If On Balance Volume turns lower from here, that may be taken as a bearish signal.
—
Always practice good risk management as the most important aspect of trading. Always trade with stops and invest only 1-5% of equity on any one trade. Failure to manage risk is the most common mistake new traders make.
Hi Lara,
This is a question for the USD Index analysis, dated 15th November, 2018, posted under Public Analysis
The quarterly bearish EW analysis chart starts with Grand Supercycle 0 (limegreen). It goes down to a Grand Supercycle W-X and potential Y (limegreen). I do not see a Grand Supercycle I before the W-X-Y correction. Would there not be an impulse before a correction? I am sure I am missing something here, but what is it ?? Could you kindly help me understand this, please ?
Thanks,
David
Quick update for the S&P500:
This is now the most likely scenario. Intermediate (B) may still be yet to complete, then intermediate (C) may move lower next week to complete a zigzag for primary wave 2.
The next likely scenario is that intermediate (B) was over on the 16th of May and intermediate (C) will end early next week.
Hey Lara,
I think that makes sense and it has a nice look…
That rally that you have labelled minor A (blue A)… It was hard to make it look like a 5 wave structure… So I think your above count makes sense…. The only thing is that the AD line is still very strong … So to sell at the completion of intermediate (B) would be risky to miss the following up move.
I wouldn’t think that we would reach 2722 because of the AD line strength…
Is it possible that because of the AD line strength that (B) would retrace at least 90% of (A) (and (A) would be a 3 wave structure) and (C) would end near (B) to get a flat or an expanded flat?
Have a nice trip!
Cheers,
Mathieu
Hi everybody. I need to let you know that tonight I’m flying from New Zealand into Texas. Your analysis this week may necessarily be later than usual, I will make every effort to get everything published by Sunday midday EST.
It will of course be earlier if I can get it all done.
Thanks for your patience and understanding. And… here’s hoping they let me in!
Its a pretty friendly place. They’ll let you in. Wear boots
Welcome to North America Lara!!
Enjoy your stay and the spring weather 🙂
Well, they did let me in. And so far everyone’s really nice here. The heat though… coming from a NZ almost winter to 32 degrees (100F) is quite the challenge.
Working now.
Its the humidity thats a killer
Rich
Oil is on the move. Let’s see where it makes a low tonight.
Very nice to see. I’m moving the invalidation point for US Oil down a bit.
Hi Lara, From your previous Bitcoin post, it appears we are in a new bull market. Any chance you can add Bitcoin updates periodically to your Lara’s Weekly updates rather than just posting them for free? I for one would be interested in seeing them.
I’ll not do it on the regular, but I will update when the count needs it or a big move happens.
I may just put up charts with little comment from time to time.
I encourage all members who are interested in Bitcoin to ask for an update if you think the count has changed or Bitcoin has made a big strong move in either direction. I don’t look at it every day, and so if we’re all looking out I can keep the analysis more sharply focussed.
Thanks Lara, If you are expecting new ATH’s in BTC, it should be worth tracking as the upside potential could be explosive as we are now in a move that could be 3x or 4x off the lows in just 6 months. I just don’t see that kind of explosive potential in any other markets.
True, it is extremely likely to be explosive.
you’ll note I have not given any targets for it, that’s because Bitcoin just does not exhibit Fibonacci Ratios between its waves. I gave up on calculating targets using Fibonacci when they were all blown away.
If it does exhibit Fibonacci Ratios, they’re the extreme variety well longer than 2.618 and 4.236. More like 11.09 and greater.
The flip side though of this market with its explosive moves, is after explosive highs it turns quite quickly and corrects sharply. Those explosive profits can disappear pretty quick.
I have also noticed that during bullish uptrends, the 3rd & 5th waves do extend and the 4th waves are always more shallow than you would expect. Only the 2nd waves seem to have a strong pullback. Are these patterns consistent over time is the question?
I’ve done a thorough EW count on Bitcoin and noted the type, depth and length of C:A for every single correction on Bitcoin ever.
The range of depths for fourth waves for Bitcoin is from 0.18 to 0.83 of the third wave it’s correcting, when the fourth wave is a zigzag. From 0.15 to 0.84 when the fourth wave is a triangle, from 0.35 to 0.41 when the fourth wave is a flat, and from 0.44 to 0.63 when the fourth wave is a double zigzag.
So in short, they range from 0.15 to 0.84. Which is… quite a big range.
There is also an ETF called GBTC that allows you to participate in Bitcoin from a brokerage account. Here is an analyst on Twitter that has been posting on GBTC
https://twitter.com/SurfCity_Cycles
Lara,
For the S&P the .236 fib point is better projection for a triangle this looks like a sharp. For a 2nd wave the .382 is better however 2722 would take out March low. On a monthly time frame we have the signs of a bearish reversal bar. I sure hope Bill Williams balance line of 2727 holds next week. Monthly close is going to be very interesting.
Bill
Not sure what you mean. Starting to look like a triangle if thats what you mean which wouldn’t jive for a second wave. It could also be intermediate 2 of primary 3.
Rich
Damenorte,
From my few years of study a shallow retracement can form a triangle. I like Bill Williams alligator indicator it works well keeping us in the trend.
Hi Lara,
In your analysis for Oil, you stated that cycle y may last a Fibonacci 5 or 8 years. Primary A and B have potentially completed in 8 months. You’ve stated that Primary wave C could last about 21 weeks or 34 weeks; That is 5 to 8 months. How can this align with the expectation of cycle y to last 5 years?
Thanks in advance,
Jiten
That’s a good point.
One of those estimates is wrong.
Cycle wave y may be quicker, it may last only 1-2 years.
Hi Lara,
It is too bad that stockcharts.com does have candlesticks for the AD line to show the intraday upper wick… On May 16th, just after the open, the AD line made a new all time high but then it faded at the end of the day…
It is too bad that the VIX and AD line do not have candlesticks… They have ranges that are interesting as well. Instead, we are just have the close which is somewhat deceiving.
I will dig through to see if stockcharts.com keeps the data for the intraday of the AD line…
Thanks,
Mathieu
Now your comment about the strength of the AD line last week makes more sense.
If you find a source of candlesticks for the AD line, let me know.
I do take a look at VIX candlesticks from time to time. But I also put less weight on VIX than the AD line.
I couldn’t find it… The “cumulative” display does not have a “candlestick” mode…
I will send an email to stockcharts.com to see if we can get a candlestick view of the AD line.
Mathieu
Stockcharts.com replied to me saying that they cannot draw cumulative charts with candlesticks. Too bad….
That makes sense actually.