
Last analysis on the 17th of June expected explosive upwards movement to then be followed by a sharp reversal, which is exactly what has happened for Bitcoin.
Summary: A deep pullback is now expected to end at the 0.618 Fibonacci ratio, at 7,240. But Bitcoin’s price history suggests it may be deeper, so more likely somewhere between 7,006 to 3,809. The pullback may end in about 17 weeks.
At its end, this deep pullback may offer a good buying opportunity for Bitcoin.
This will be the last publicly available Bitcoin analysis for a while. While looking for a buying opportunity, Elliott Wave Gold and Elliott Wave Stock Market members will be given preference.
The data used for this analysis comes from Yahoo Finance BTC-USD.
All charts are on a semi-log scale.
MAIN ELLIOTT WAVE COUNT
MONTHLY
Click chart to enlarge.
The degree of labelling within this analysis is today moved down one degree. This makes no difference to targets, invalidation points or expectations of direction for price.
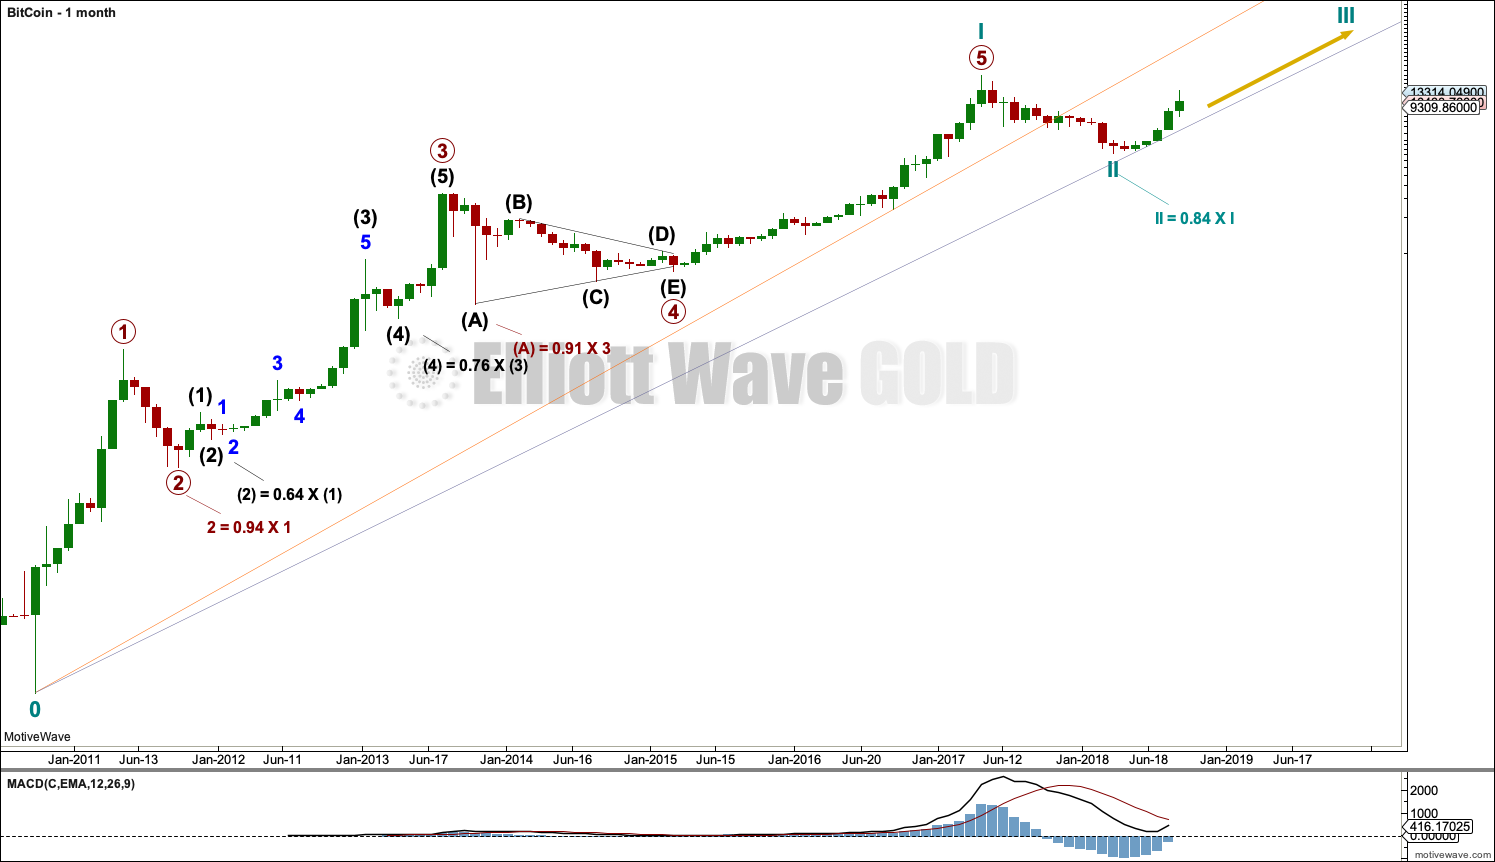
It is possible to see a completed five wave impulse upwards for Bitcoin.
I am unable to find reasonable Fibonacci ratios within this wave count. It appears that Bitcoin may not exhibit Fibonacci ratios very often between its waves, so this makes target calculation impossible. Classic technical analysis was used to identify a high in place on December 23, 2017.
What is very clear from this chart is that Bitcoin forms classic bubbles. It has done so now several times and may now be doing so again. This looks like an even larger bubble than the Tulip Mania. So far each bubble has popped and Bitcoin has collapsed, to then thereafter form a new bubble. Each bubble is larger than the one prior; so if another Bitcoin bubble is forming, it may be expected to take price substantially above the all time high.
Bitcoin tends to behave like an extreme commodity: price moves upwards for about 2 – 4 weeks in a near vertical movement at the end of its rises. Following this vertical movement the resulting downwards movement is very deep (in percentage terms) and often very quick.
The next rise begins slowly with basing action over weeks or months, and then as the rise nears its end another vertical movement completes it. Also, there are volume spikes just before or at the end, which is another feature typical of commodity like behaviour.
This has happened now several times. The most notable instances are the rise up to the week ending 24th November, 2013, and the week ending 5th June, 2011. The following sharp drops were 94% and 93% respectively.
The last instance was the rise up to the last all time high for Bitcoin at 19,870.62 on the 17th of December 2017. The drop thereafter may now be considered as highly likely to be complete. If the drop is complete, it was only an 84% drop.
WEEKLY
Click chart to enlarge.
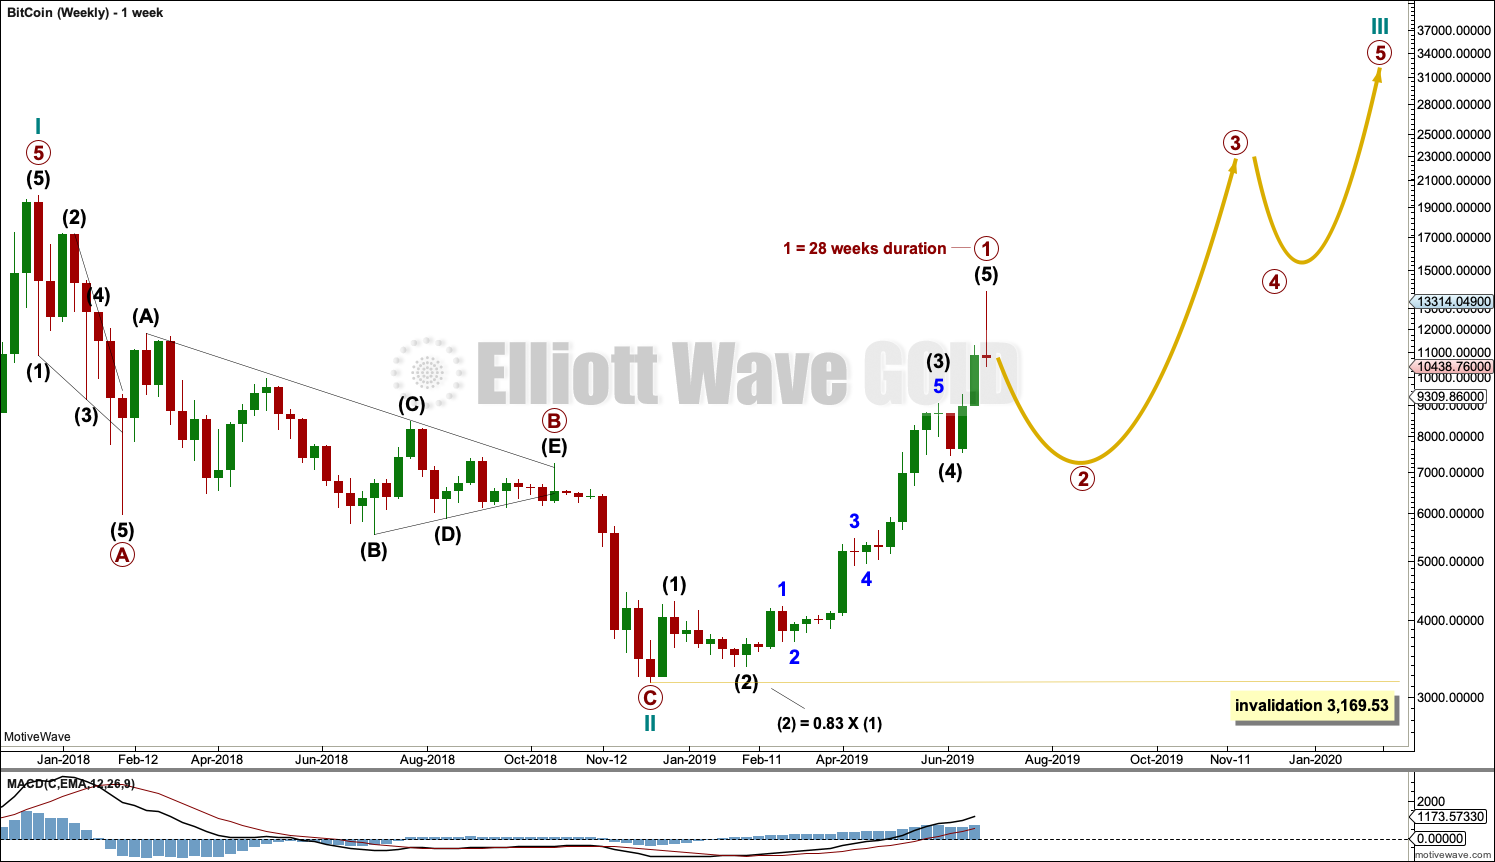
Cycle wave II may be a complete zigzag.
Cycle wave III must move above the end of cycle wave I at 19,870.62. It must move far enough above this point to allow room for cycle wave IV to unfold and remain above cycle wave I price territory.
Cycle wave I lasted 7.2 years and cycle wave II may have been over within just under one year. It would be reasonable to expect cycle wave III to last about 7 years, possibly a Fibonacci 8 or 13 years.
Cycle wave III must unfold as a simple five wave impulse, and within this impulse there should be two large corrections for primary waves 2 and 4. So far primary wave 1 may be complete. Primary wave 2 may now unfold as a three wave structure downwards to possibly last about 17 weeks in duration if it is 0.618 the duration of primary wave 1.
The range of corrections for intermediate, primary and cycle degree corrections for Bitcoin is from 0.64 to 0.94. This gives a potential range for the low of primary wave 2 from 7,006 to 3,809.
DAILY
Click chart to enlarge.
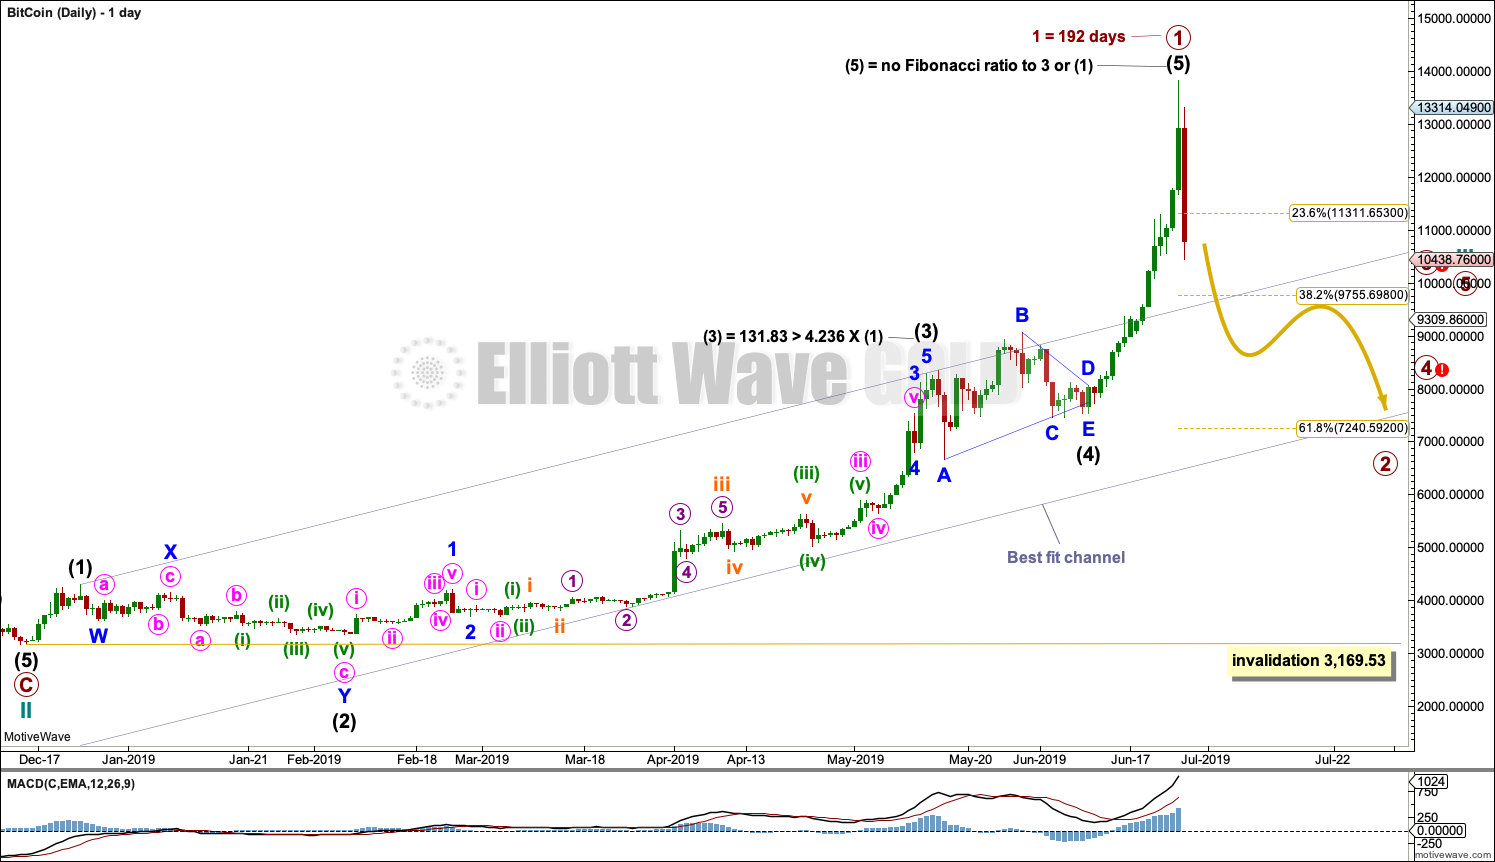
Bitcoin typically forms curved first wave impulses with time consuming and deep second wave corrections, then accelerates through to the end of its third waves, has brief and more shallow fourth wave corrections, and then finishes with explosive fifth waves. This is an extreme behaviour most typically seen in commodities.
This pattern has again been repeated and is seen clearly on an arithmetic chart for primary wave 1.
Intermediate wave (2) was deep and time consuming. It was 0.83 the length of intermediate wave (1) and lasted 44 days. The slope of the wave increases as momentum increases up to the end of intermediate wave (3), and then intermediate wave (4) is more shallow at 0.15 the length of intermediate wave (3) (at its terminus, the deepest portion for minor wave A was 0.33 of intermediate wave (3), which is still shallow) and lasted 27 days.
Thereafter, momentum and the slope shows a further increase to end in near vertical movement. This has now been followed by a very sharp decline.
Primary wave 2 may be expected to most likely subdivide as a zigzag. It may last about 17 weeks if it is 0.618 the duration of primary wave 2, and it may be a very deep correction. Focus of this analysis will now be on identifying the end of primary wave 2 as a potential buying opportunity.
After last analysis, the alternate wave count was discarded based upon a very low probability. To see the logic behind this decision please refer to last analysis here.
TECHNICAL ANALYSIS
WEEKLY
Click chart to enlarge.
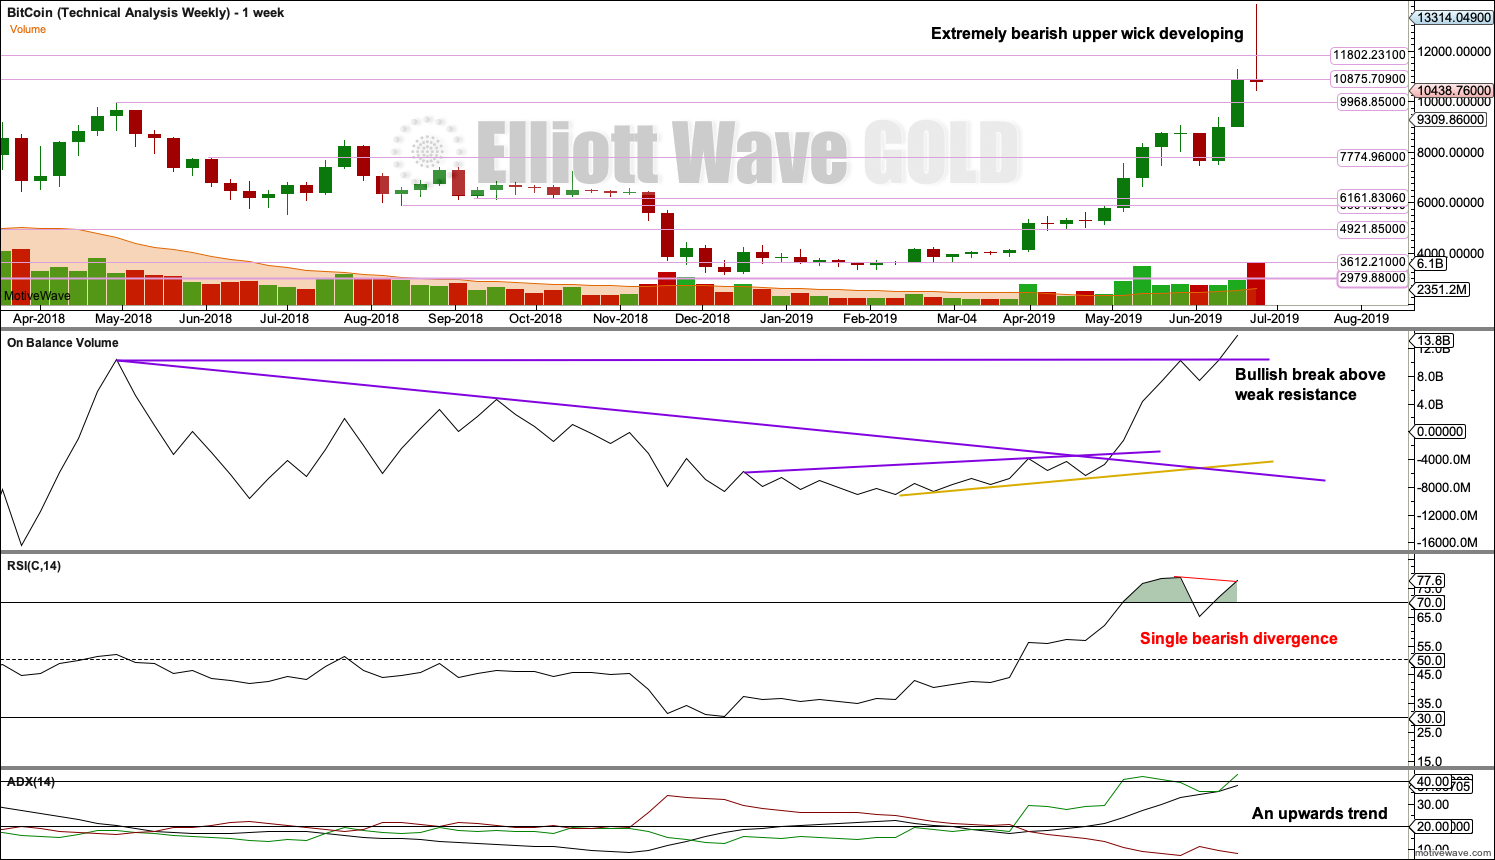
The following characteristics can be noted at the end of prior major highs for Bitcoin:
The first sharp rise to the week beginning 5th June 2011: near vertical movement for several weeks, a sharp volume spike for a blow off top on the final week, and no candlestick reversal pattern on the weekly chart but an Evening Doji Star on the daily chart. The following correction was 0.94.
The next sharp rise to the week beginning 7th April 2013: near vertical movement for three weeks, a sharp volume spike on the final week that closed red and formed a Bearish Engulfing pattern on the weekly chart, a Bearish Engulfing pattern on the daily chart, ADX remained very extreme for most of the rise, and single week bearish divergence between price and RSI at the end. The following correction was 0.82.
The next sharp rise to the week beginning 24th November 2013: vertical movement for four weeks, a strong rise in volume until the last week (which saw volume fall), a Bearish Engulfing pattern on the weekly chart, an Evening Doji Star on the daily chart (the third candlestick of which had strong support from volume), ADX reached very extreme for many days, and RSI reached extreme overbought and there exhibited single bearish divergence. The following correction was 0.93.
The last sharp rise to the all time high at 19,870.62 on the 17th of December 2018: vertical movement for three weeks, a strong increase in volume up to the last week (which saw a fall in volume), a Bearish Engulfing pattern on the weekly chart that had support from volume; on the daily chart, ADX reached very extreme for a coupe of weeks or so, RSI reached overbought and there exhibited single bearish divergence, and early downwards movement from the high had support from volume. The following correction was 0.84.
Some conclusions may be drawn about how to identify a major high in Bitcoin:
– Look for vertical movement on the weekly chart for at least two weeks, and possibly up to several (although when it is more than three the movement may be interspaced with a small pause).
– Look for either a sharp volume spike for a blow off top, or a strong increase in volume then followed by a single week of lighter volume at the possible high.
– A bearish candlestick reversal pattern has been seen so far at every major high for Bitcoin, so an absence of any candlestick reversal pattern at a potential high should be viewed very suspiciously.
– ADX is of no use as it may remain very extreme for long periods of time.
– RSI may also remain very extreme for long periods of time and may not exhibit any divergence, but it may add a little confidence in the high if it does exhibit bearish divergence in conjunction with other indicators being bearish.
The last vertical rise now exhibits enough of the points looked for to have some confidence that Bitcoin may have found an interim top: vertical movement for three weeks, a volume spike on the last week, and a bearish candlestick reversal pattern that may be developing (although this week still has the Friday to Sunday sessions to complete).
DAILY
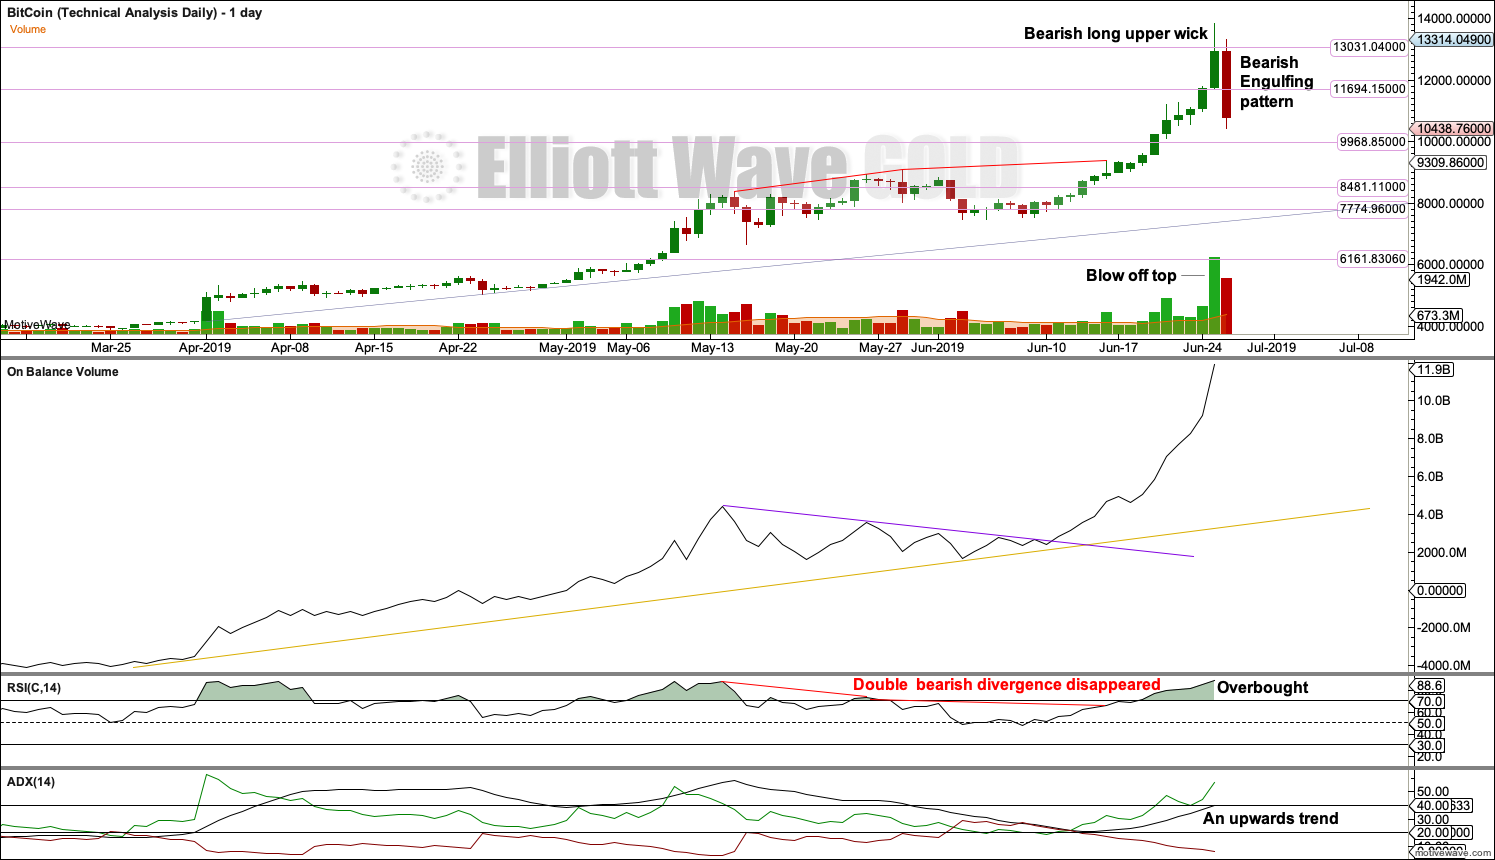
Click chart to enlarge.
It was noted in last analysis that bearish divergence between price and RSI can simply disappear, and this is what happened in mid June.
Vertical price movement has ended with a sharp volume spike on the daily chart. There is now a very strong bearish candlestick reversal pattern complete at the daily chart level.
Support levels are noted as possible lows for the next expected deep pullback.
Published @ 06:00 p.m. EST.
—
Careful risk management protects your trading account(s).
Follow my two Golden Rules:
1. Always trade with stops.
2. Risk only 1-5% of equity on any one trade.
—
New updates to this analysis are in bold.
Great! I am study Elliot and it is useful to learn from your BtcUsd analysis public post! Do you continue updated btcusd anysis for your member? If you have, I would like to subscrible. Thank you so much.
Because I am currently watching Bitcoin to find an opportunity to purchase some for myself, I am posting updated analysis relatively regularly. Whenever I think the wave count has either changed, or the structure is nearing completion, I will update the analysis.
When I see a set up indicating a good entry point I will be publishing that analysis and it will be for members only.
However, Bitcoin is not a part of the subscription. That’s Gold, Oil and Silver. When I’ve purchased Bitcoin I’ll update less frequently, and my focus will be on when to sell. I expect I may hold for several years. When I see the right time to sell that too will be for members only.
I’m making this available for members only at key times because in my experience over the years Bitcoin attracts a lot of emotion, and opening up the analysis and comments to the general public has not worked well for me at all. I also kinda don’t want to offer those people an opportunity to make a substantial profit from my work for free, which may be a bit churlish, but it is a substantial amount of work, backed by years of study, experience and professional qualifications.
thank you for your reply. I am very appreciatted for your free work.
I think alot of people are interesting in short term trading BTC, like me.
Your analysis was awesome.
Have a good day.
Thank you
You’re welcome. I’m really excited about this possible opportunity coming up for Bitcoin. I’ll be watching it almost daily from here on to see when to buy.
Pumping at the moment … Is there a point we’re not confident it’s going back down ?
The high of the 25th June remains intact. Only a new high would indicate obviously that its not in place, at that stage I’d expect another strong vertical movement to significant new highs.