

S&P 500
Further upwards movement continues as expected from the Elliott wave count.
Summary: The low of December 2018 is expected to most likely remain intact.
The next short-term target is at 3,068 (Elliott wave) to 3,079 (classic analysis from the pennant). This next upwards wave may exhibit further strength. Look for corrections to continue to be very shallow and brief.
The mid-term target remains at 3,104 for a more time consuming consolidation or pullback, which may also be shallow.
The biggest picture, Grand Super Cycle analysis, is here.
Monthly charts were last published here, with video here. There are two further alternate monthly charts here. Video is here.
ELLIOTT WAVE COUNTS
The two Elliott wave counts below will be labelled First and Second. They may be about of even probability. When the fifth wave currently unfolding on weekly charts may be complete, then these two wave counts will diverge on the severity of the expected following bear market. To see an illustration of this future divergence monthly charts should be viewed.
FIRST WAVE COUNT
WEEKLY CHART
Click chart to enlarge.
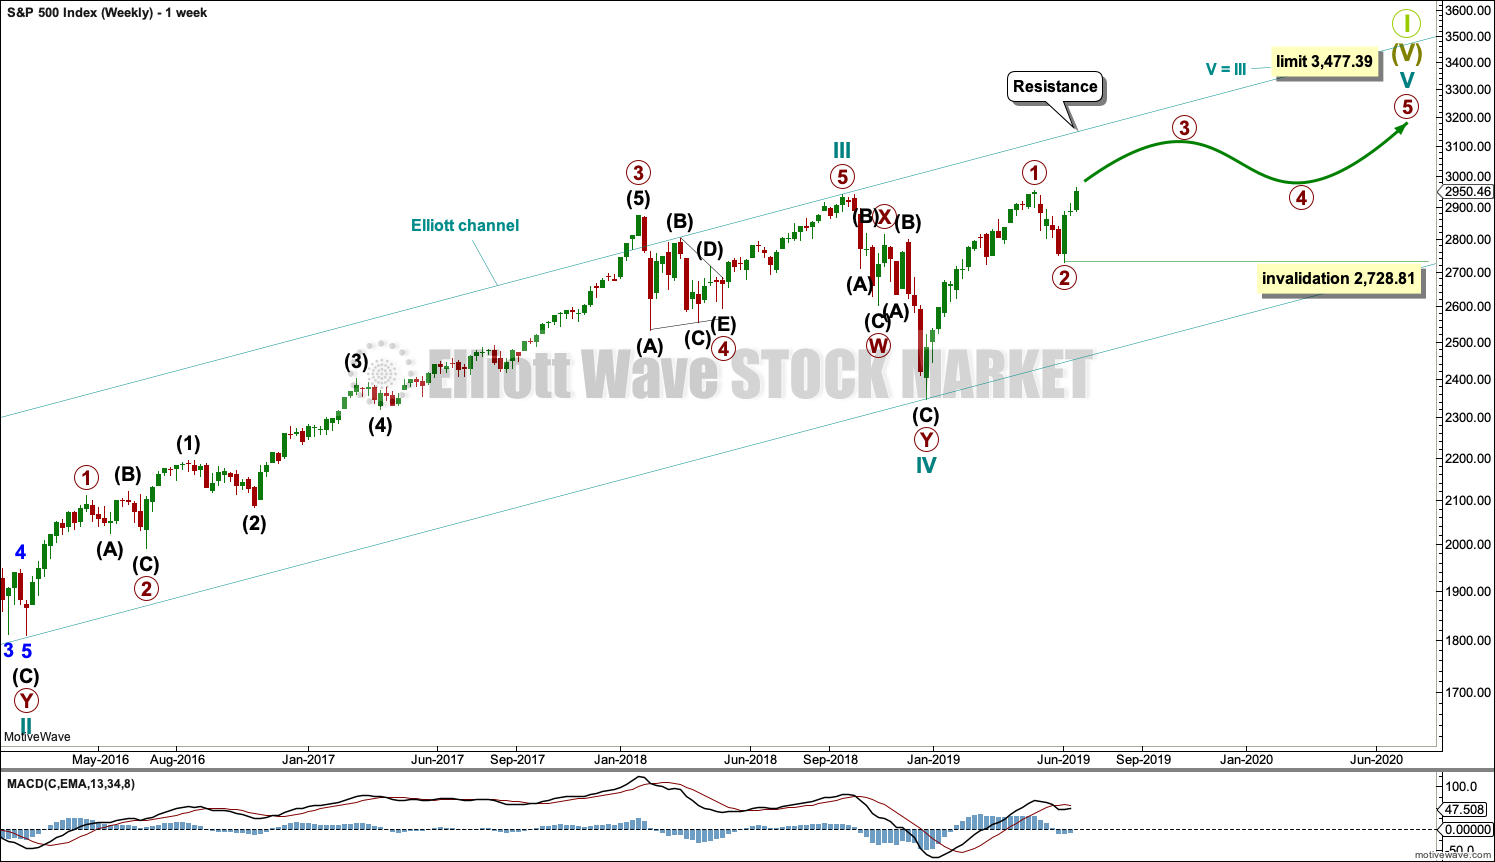
The basic Elliott wave structure consists of a five wave structure up followed by a three wave structure down (for a bull market). This wave count sees the bull market beginning in March 2009 as an incomplete five wave impulse and now within the last fifth wave, which is labelled cycle wave V. This impulse is best viewed on monthly charts. The weekly chart focusses on the end of it.
Elliott wave is fractal. This fifth wave labelled cycle wave V may end a larger fifth wave labelled Super Cycle wave (V), which may end a larger first wave labelled Grand Super Cycle wave I.
The teal Elliott channel is drawn using Elliott’s first technique about the impulse of Super Cycle wave (V). Draw the first trend line from the end of cycle wave I (off to the left of the chart, the weekly candlestick beginning 30th November 2014) to the end of cycle wave III, then place a parallel copy on the end of cycle wave II. This channel perfectly shows where cycle wave IV ended at support. The strongest portion of cycle wave III, the end of primary wave 3, overshoots the upper edge of the channel. This is a typical look for a third wave and suggests the channel is drawn correctly and the way the impulse is counted is correct.
Within Super Cycle wave (V), cycle wave III is shorter than cycle wave I. A core Elliott wave rule states that a third wave may never be the shortest. For this rule to be met in this instance, cycle wave V may not be longer in length than cycle wave III. This limit is at 3,477.39.
The structure of cycle wave V is focussed on at the daily chart level below.
Within cycle wave V, primary waves 1 and 2 may now be complete. Within primary wave 3, no second wave correction may move beyond its start below 2,728.81.
In historic analysis, two further monthly charts have been published that do not have a limit to upwards movement and are more bullish than this wave count. Members are encouraged to consider those possibilities (links below summary) alongside the wave counts presented on a daily and weekly basis.
DAILY CHART
Click chart to enlarge.
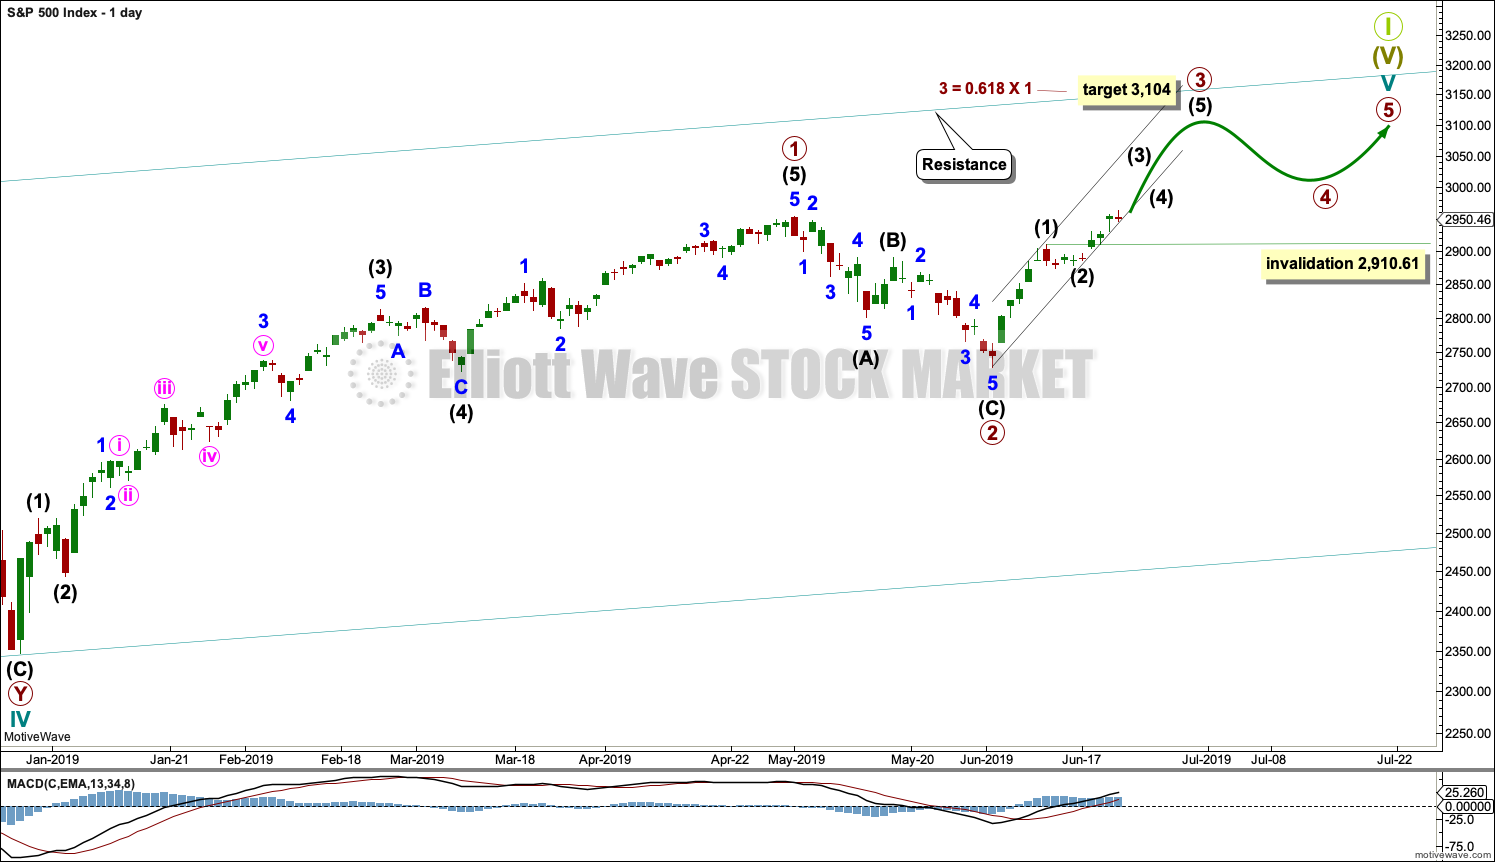
Cycle wave V must subdivide as a five wave motive structure. Within that five wave structure, primary waves 1 and 2 may be complete.
Primary wave 3 must move above the end of primary wave 1. Primary wave 3 may only subdivide as an impulse. Within the impulse, intermediate waves (1) and (2) may be complete. Intermediate wave (3) has moved above the end of intermediate wave (1) meeting a core Elliott wave rule. When it arrives, intermediate wave (4) may not move into intermediate wave (1) price territory below 2,910.61.
When primary wave 3 is over, then primary wave 4 may be a shallow sideways consolidation.
Thereafter, primary wave 5 should move above the end of primary wave 3 to avoid a truncation.
A narrow best fit channel is drawn about primary wave 3. Although the S&P500 does not always fit neatly within channels, along the way up the lower edge of the channel may provide support. If the channel is breached by downwards movement, then the lower edge may provide resistance when price turns back upwards.
Primary wave 1 lasted 86 sessions, 3 short of a Fibonacci 89. Primary wave 2 lasted 22 sessions, 1 longer than a Fibonacci 21. Primary wave 3 may end about a Fibonacci 55 sessions, give or take two or three sessions either side. This is a rough guideline only.
So far primary wave 3 has lasted 14 sessions.
SECOND WAVE COUNT
WEEKLY CHART
Click chart to enlarge.
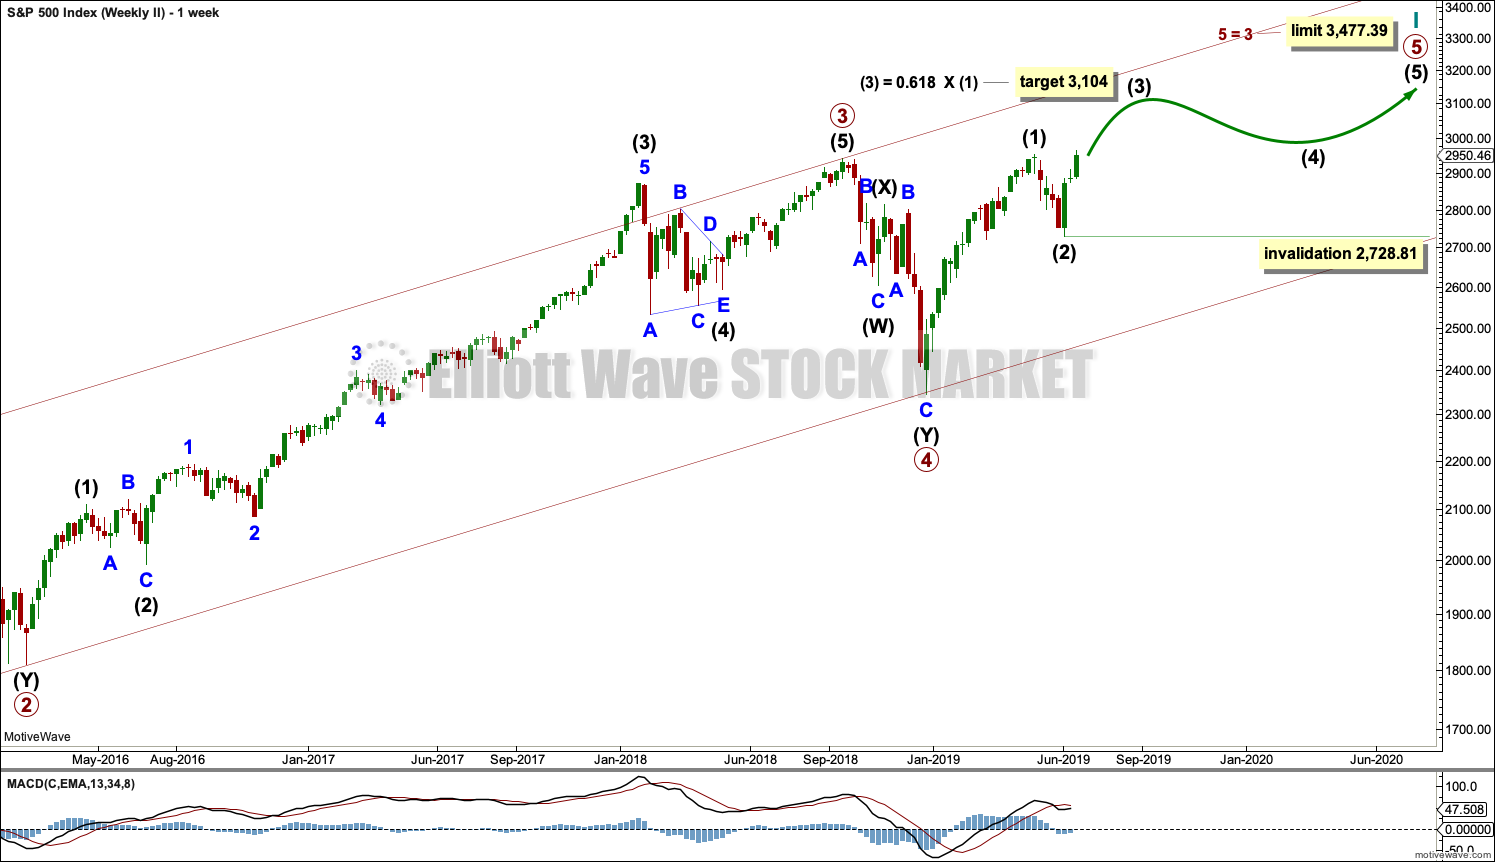
This weekly chart is almost identical to the first weekly chart, with the sole exception being the degree of labelling.
This weekly chart moves the degree of labelling for the impulse beginning in March 2009 all down one degree. This difference is best viewed on monthly charts.
The impulse is still viewed as nearing an end; a fifth wave is still seen as needing to complete higher. This wave count labels it primary wave 5.
TECHNICAL ANALYSIS
MONTHLY CHART
Click chart to enlarge. Chart courtesy of StockCharts.com.
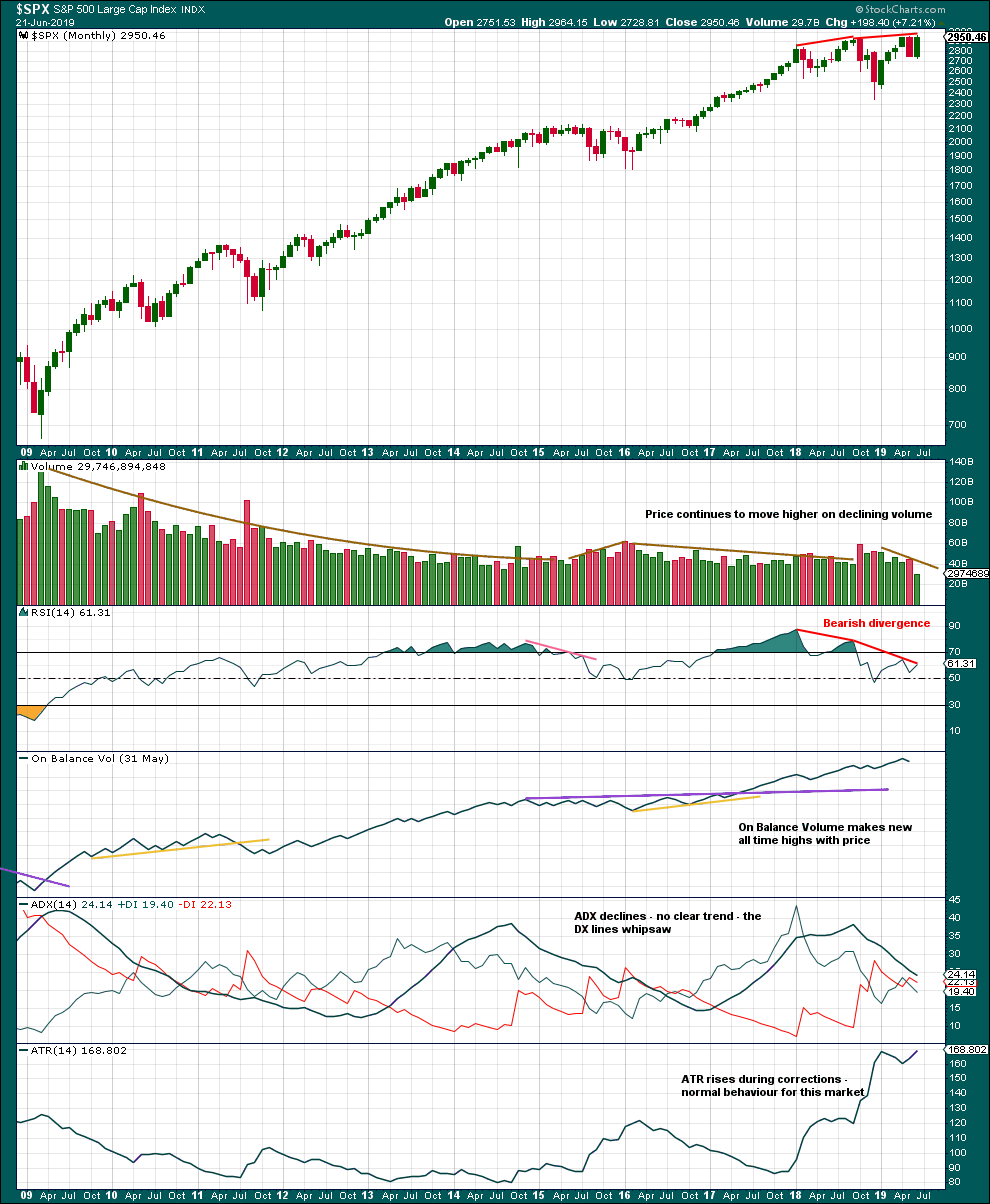
This monthly chart shows the entire bull market from the low in March 2009.
Greatest strength as measured by RSI was in what the Elliott wave count sees as the end of a third wave. This wave count fits with classic technical analysis.
Declining volume persisting for years fits an expectation for a Super Cycle degree fifth wave. This fits the first weekly chart. Although declining volume may also appear within a first wave, this may be less likely.
RSI currently exhibits strong bearish divergence over several months, which is a warning of some underlying weakness developed and persisting. This may continue as a fifth wave comes to an end.
WEEKLY CHART
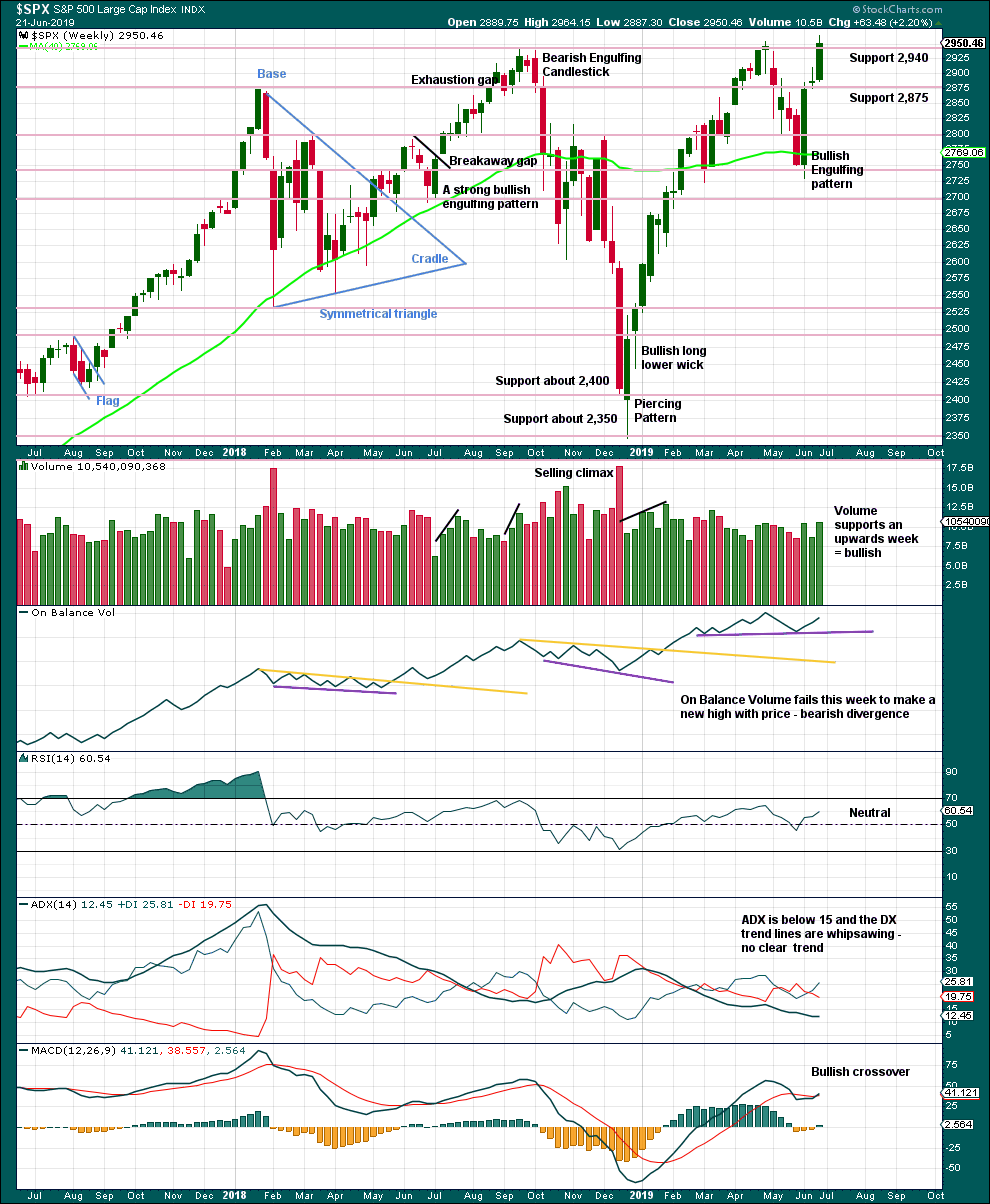
Click chart to enlarge. Chart courtesy of StockCharts.com.
While price has made a new all time high on Friday, it has not closed at a new all time high. However, a strong bullish candlestick with support from volume suggests more upwards movement overall next week.
DAILY CHART
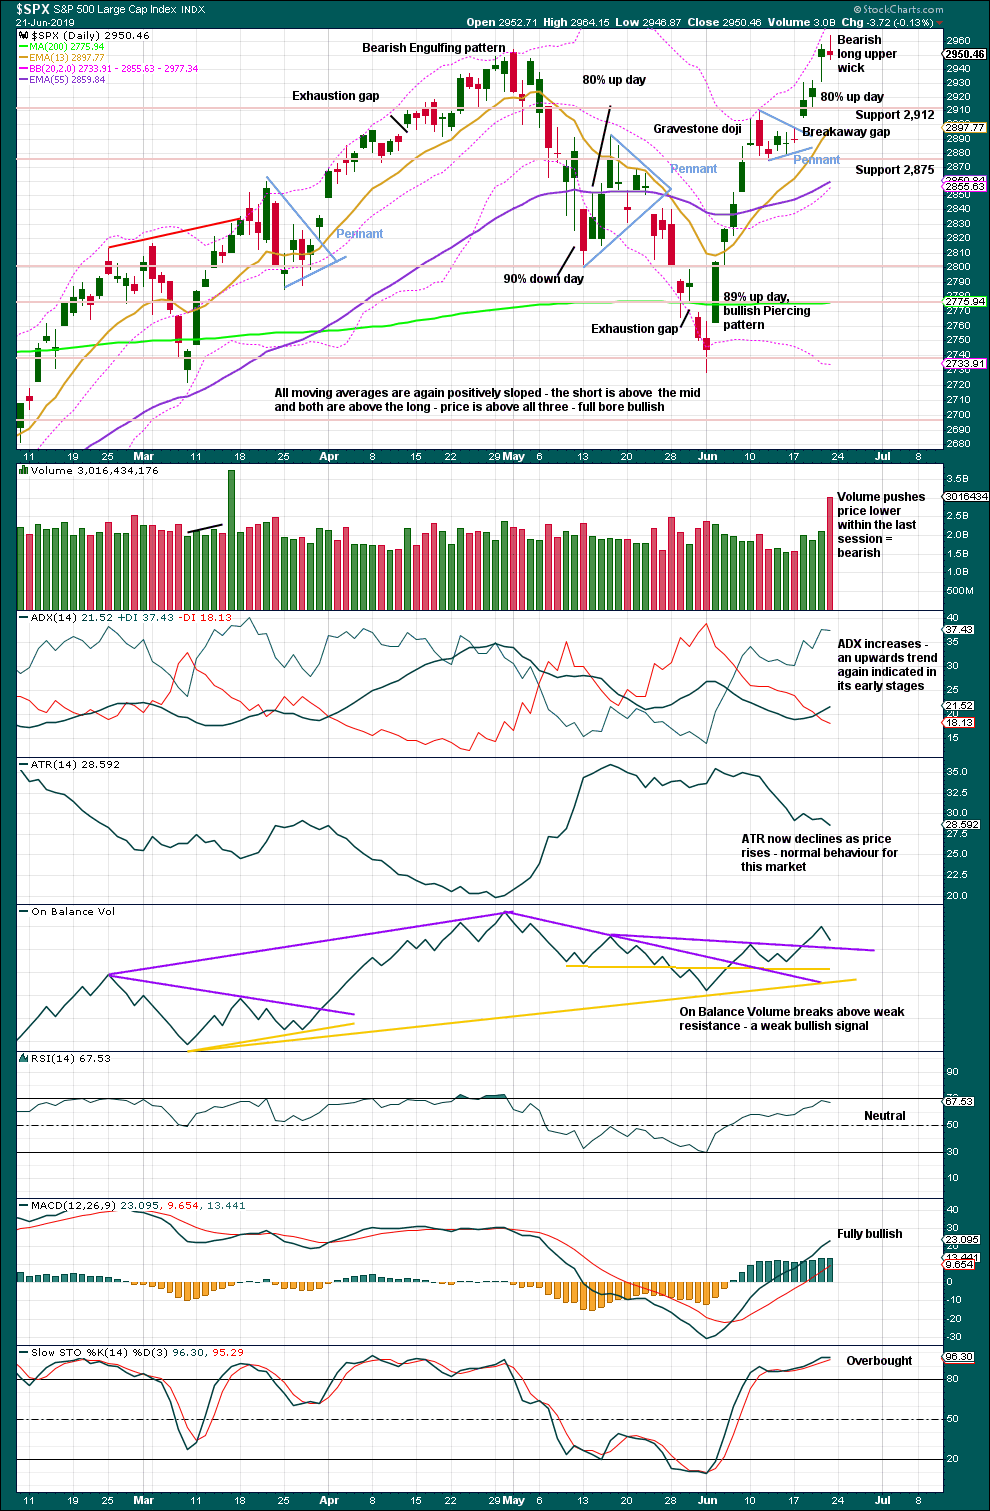
Click chart to enlarge. Chart courtesy of StockCharts.com.
A target from the flag pole is recalculated about 3,079. This is 11 points above the short-term Elliott wave target at 3,068.
The breakaway gap may offer support at 2,897.27.
For the very short term, the bearish long upper wick and push from volume for downwards movement within Friday’s session suggest some more downwards movement on Monday.
BREADTH – AD LINE
WEEKLY CHART
Click chart to enlarge. Chart courtesy of StockCharts.com. So that colour blind members are included, bearish signals
will be noted with blue and bullish signals with yellow.
Bear markets from the Great Depression and onwards have been preceded by an average minimum of 4 months divergence between price and the AD line with only two exceptions in 1946 and 1976. With the AD line making new all time highs this week, the end of this bull market and the start of a new bear market is very likely a minimum of 4 months away, which is mid October 2019.
In all bear markets in the last 90 years there is some positive correlation (0.6022) between the length of bearish divergence and the depth of the following bear market. No to little divergence is correlated with more shallow bear markets. Longer divergence is correlated with deeper bear markets.
If a bear market does develop here, it comes after no bearish divergence. It would therefore more likely be shallow.
This week large caps have made new all time highs, but mid caps are a little distance off doing so and small caps are lagging far behind. This is normal in the latter stages of an aged bull market.
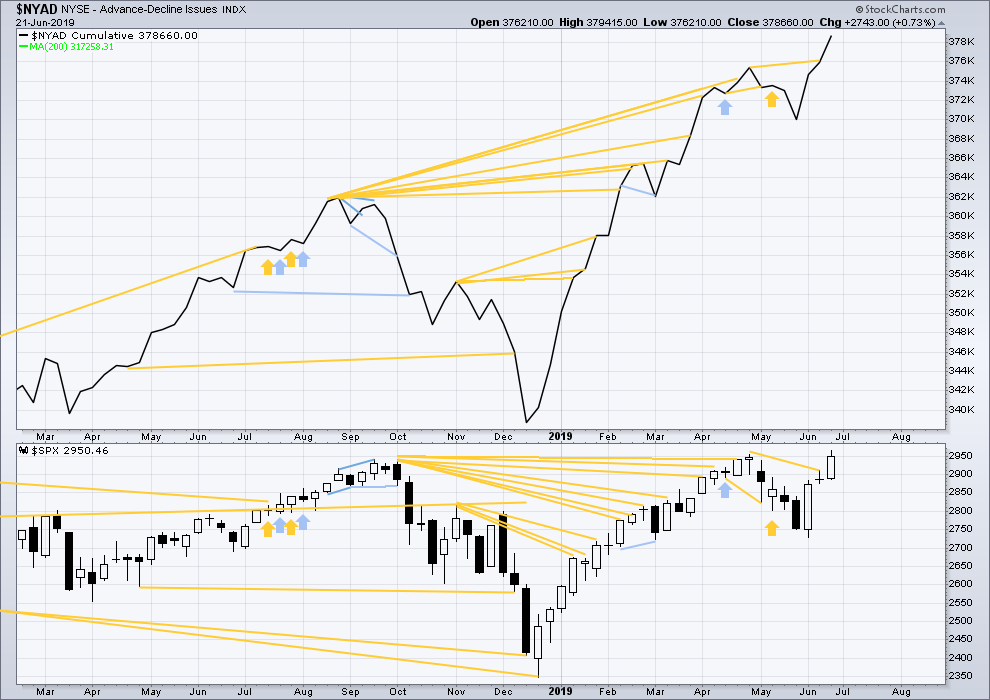
DAILY CHART

Click chart to enlarge. Chart courtesy of StockCharts.com. So that colour blind members are included, bearish signals
will be noted with blue and bullish signals with yellow.
Breadth should be read as a leading indicator.
On Friday price moved higher, but the AD line has moved lower. Upwards movement for Friday did not have support from rising market breadth. This divergence is bearish for the short term.
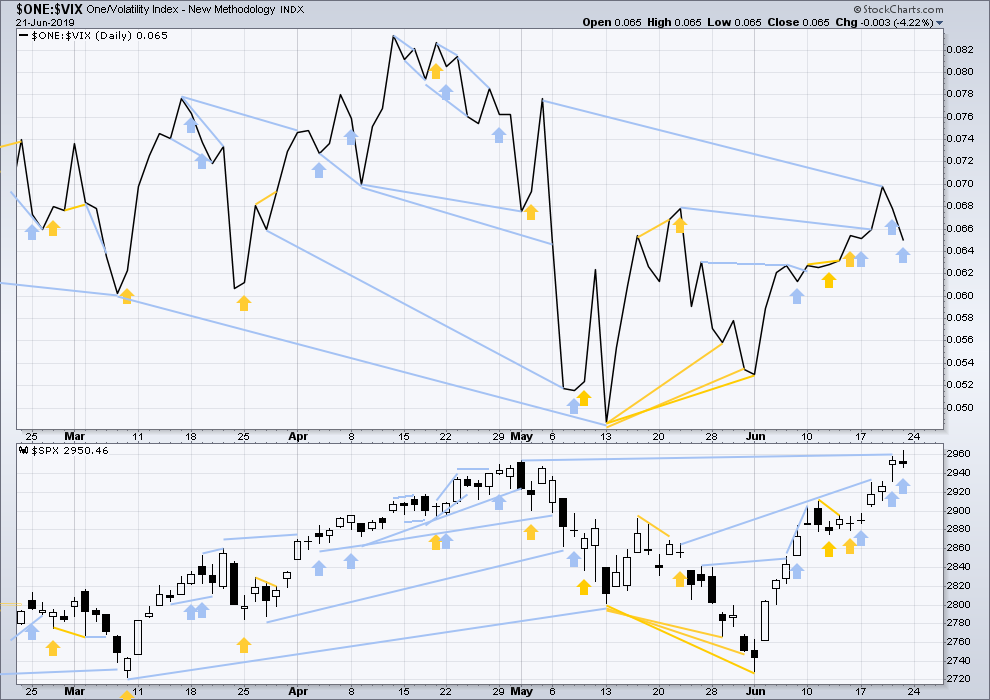
VOLATILITY – INVERTED VIX CHART
WEEKLY CHART
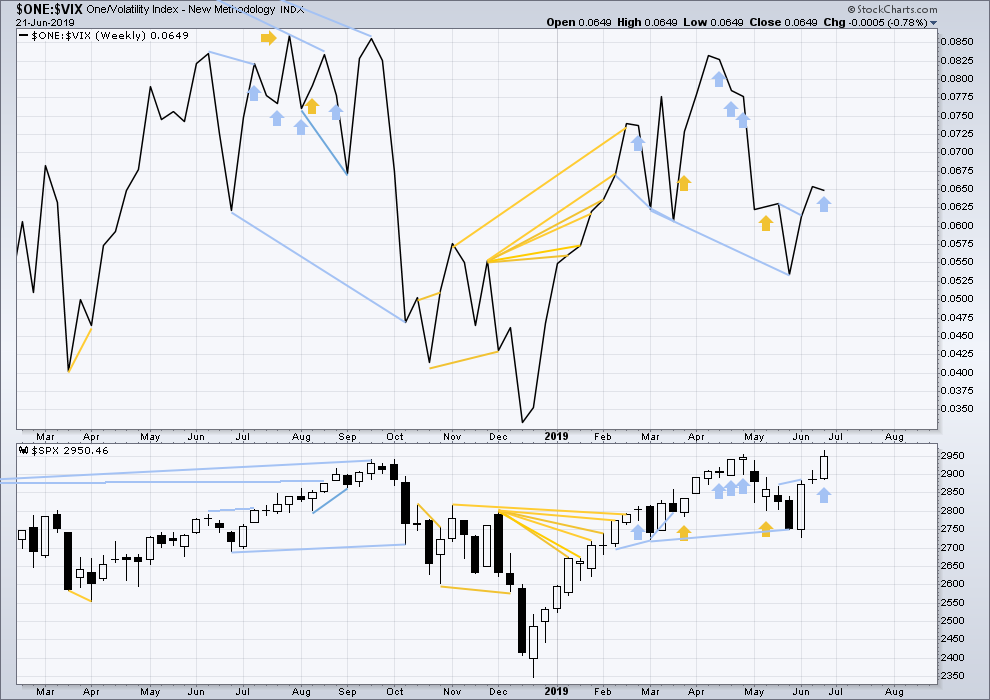
Click chart to enlarge. Chart courtesy of StockCharts.com. So that colour blind members are included, bearish signals
will be noted with blue and bullish signals with yellow.
Long-term bearish divergence remains. It may develop further before the upwards trend ends.
This week price moved higher, but inverted VIX has moved slightly lower. This is a single week of bearish divergence. The divergence may yet develop further before it is followed by reasonable downwards movement.
DAILY CHART
Click chart to enlarge. Chart courtesy of StockCharts.com. So that colour blind members are included, bearish signals
will be noted with blue and bullish signals with yellow.
On Friday price has moved higher, but inverted VIX has moved lower. There are now two sessions in a row of single day bearish divergence. The rise in price to new all time highs does not come with a normal corresponding decline in VIX. This divergence is bearish.
DOW THEORY
Dow Theory confirmed a bear market in December 2018. This does not necessarily mean a bear market at Grand Super Cycle degree though; Dow Theory makes no comment on Elliott wave counts. On the 25th of August 2015 Dow Theory also confirmed a bear market. The Elliott wave count sees that as part of cycle wave II. After Dow Theory confirmation of a bear market in August 2015, price went on to make new all time highs and the bull market continued.
DJIA: 23,344.52 – a close on the 19th of December at 23,284.97 confirms a bear market.
DJT: 9,806.79 – price has closed below this point on the 13th of December.
S&P500: 2,532.69 – a close on the 19th of December at 2,506.96 provides support to a bear market conclusion.
Nasdaq: 6,630.67 – a close on the 19th of December at 6,618.86 provides support to a bear market conclusion.
With all the indices having moved higher following a Dow Theory bear market confirmation, Dow Theory would confirm a bull market if the following highs are made:
DJIA: 26,951.81
DJT: 11,623.58
S&P500: 2,940.91 – a new all time high has been made on the 29th of April 2019.
Nasdaq: 8,133.30 – a new high has been made on 24th of April 2019.
GOLD
After an upwards breakout on Friday, three Elliott wave counts remain valid.
Summary: A shallow consolidation or a pullback to test support after the upwards breakout may now unfold next week. Look for support about 1,370 to 1,375. Thereafter, the upwards trend may resume.
A target for the upwards trend to either end or be interrupted by a major correction may be at 1,489 or 1,565.
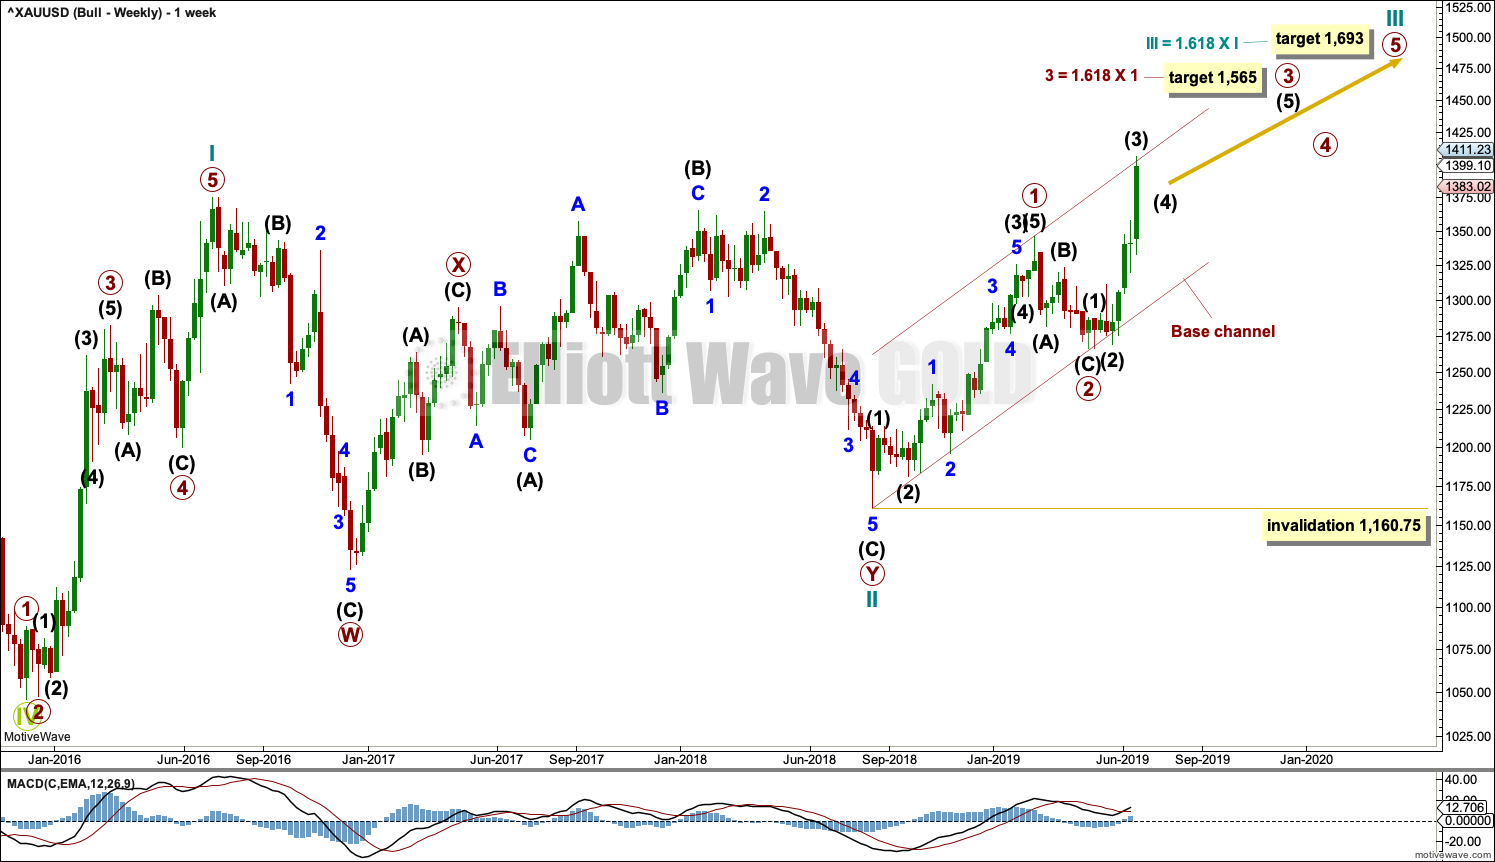
The bullish wave count has a long-term target at 1,693 for cycle wave III to end.
Grand SuperCycle analysis is here.
Last monthly charts are here. Video is here.
Overall, the bearish wave counts still have a higher probability based upon Elliott wave structures. However, it would be best to leave price to invalidate either the bullish or bearish scenario before having confidence in which is correct.
BEARISH ELLIOTT WAVE COUNTS
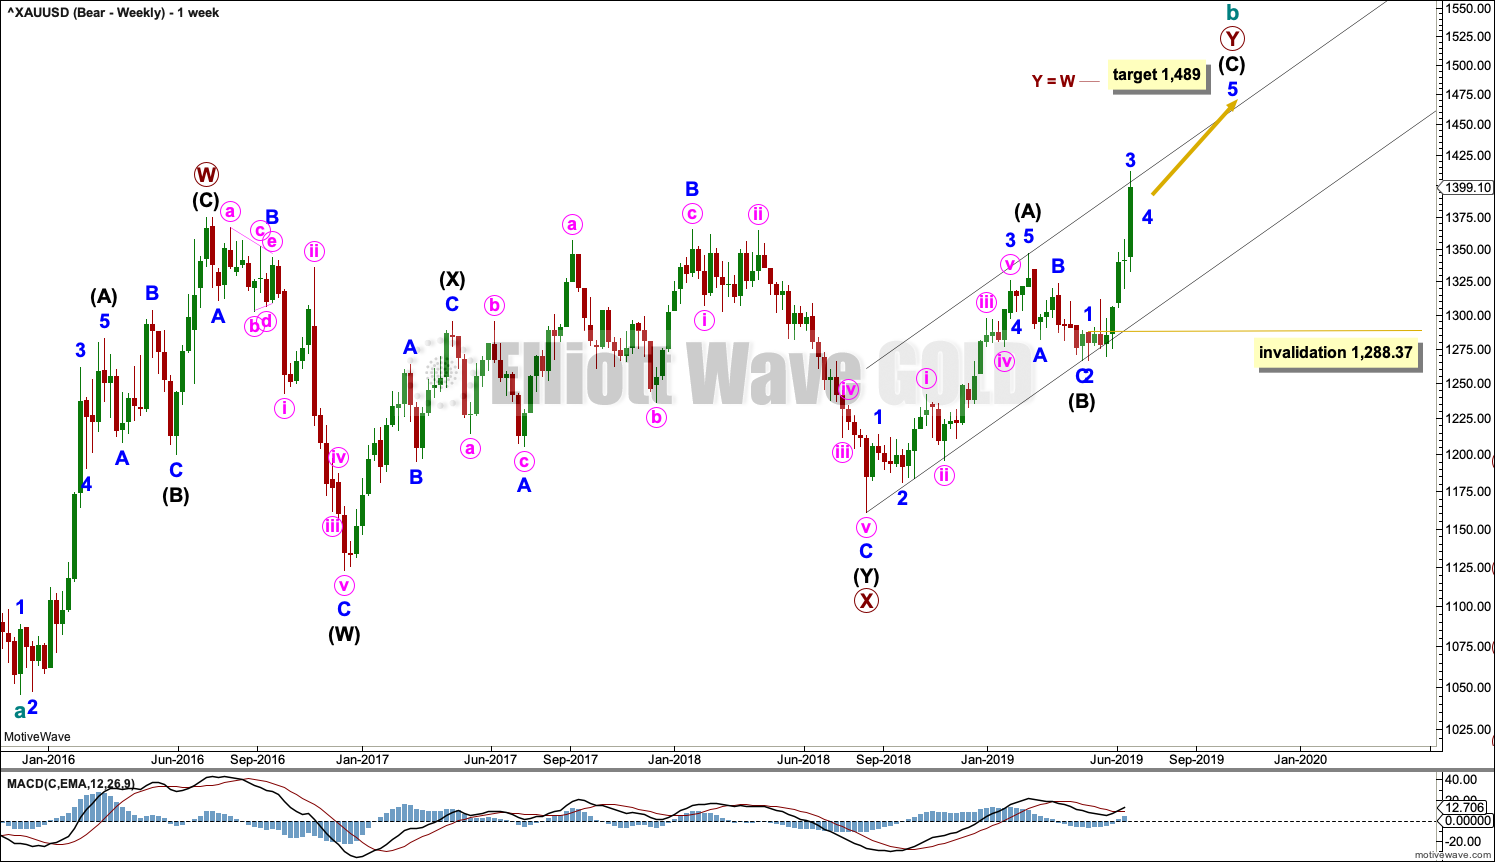
FIRST WEEKLY CHART
Click chart to enlarge.
It remains possible that the bear market for Gold may yet continue when cycle wave b is complete. Cycle wave b may be still be an incomplete double zigzag.
Double zigzags are common structures, but within them their X waves are almost always single zigzags that are relatively brief and shallow. However, X waves may be any corrective structure, including a multiple.
The maximum number of corrective structures in a multiple is three. This count of three refers to W, Y and Z. To label any one of W, Y or Z as multiples violates this Elliott wave rule. However, X waves may be labelled as multiples and here the rule is met. X waves do occasionally subdivide as multiples.
This wave count sees primary wave X as a complete double combination: zigzag – X – expanded flat.
Primary wave Y may be completing higher as a zigzag. The purpose of a second zigzag in a double zigzag is to deepen the correction when the first zigzag does not move price far enough. The target for primary wave Y would see this purpose achieved.
If primary wave Y begins at 1,160.75, then the target for it to reach equality in length with primary wave W is at 1,489.
Primary wave Y is subdividing as a zigzag. Within the zigzag, intermediate waves (A) and (C) are complete. Intermediate wave (C) may only subdivide as a five wave structure. At this stage, it is clear it is an impulse. Within intermediate wave (C), minor wave 4 may not move into minor wave 1 price territory.
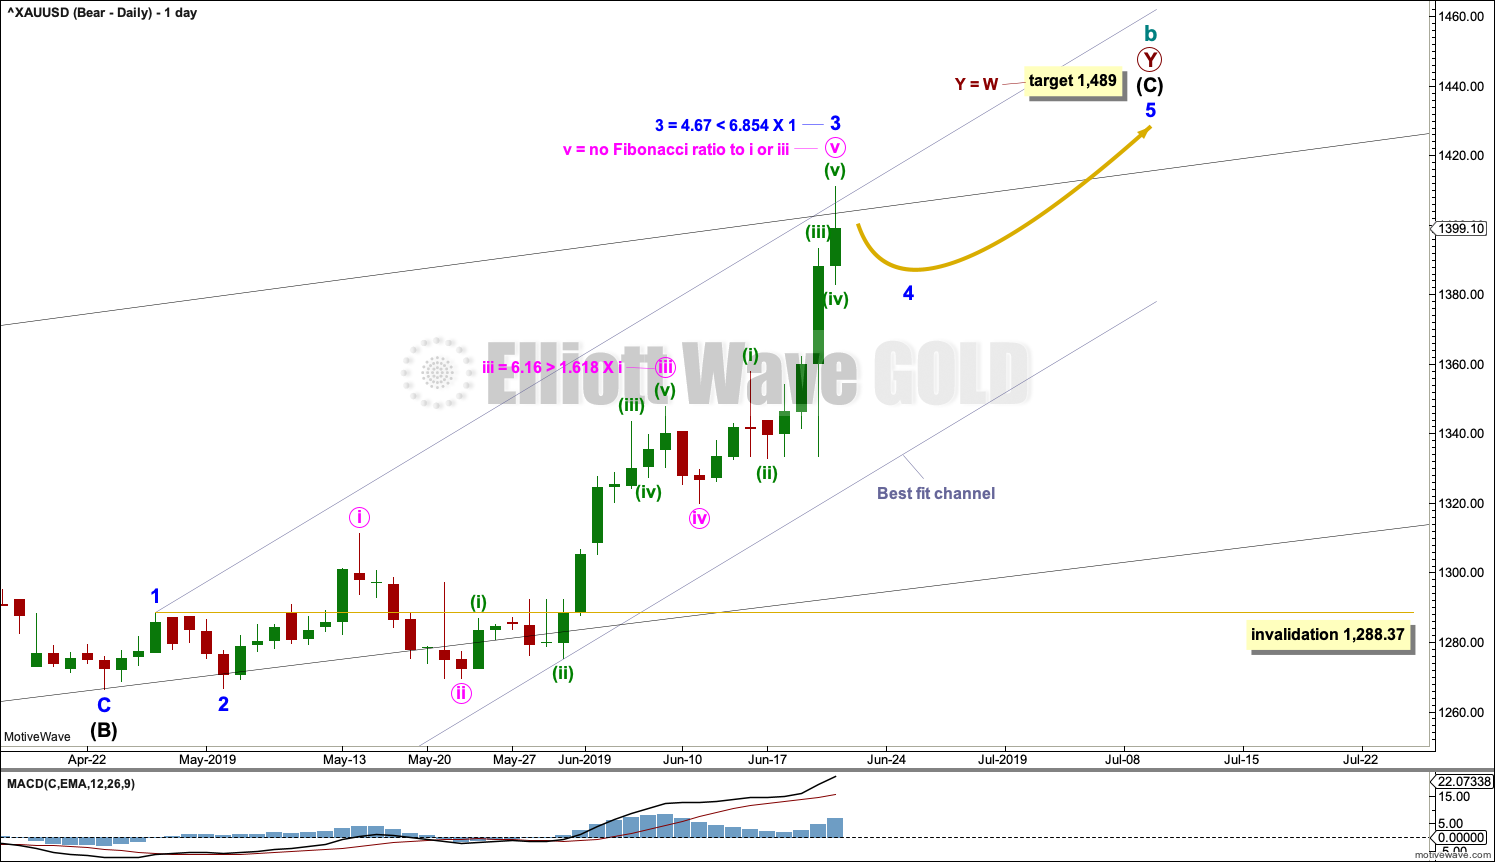
DAILY CHART
Click chart to enlarge.
This chart focusses on the impulse of intermediate wave (C).
Intermediate wave (C) is subdividing as an impulse. Within the impulse, minor waves 1 through to 3 may be complete. Minor wave 4 may now unfold as a shallow sideways correction that may not move into minor wave 1 price territory below 1,288.37.
Minor wave 2 was a deep 0.99 zigzag. Given the guideline of alternation, minor wave 4 may be expected to be a very shallow flat, combination or triangle. Minor wave 2 lasted 4 days. Minor wave 4 may be about equal in duration, or it may last longer as sideways structures tend to be slower than zigzags.
There is no adequate Fibonacci ratio between minor waves 1 and 3. Gold usually exhibits at least one Fibonacci ratio between the three actionary waves of an impulse, and so here it would be very likely to exhibit a Fibonacci ratio for minor wave 5.
When minor wave 4 is complete, then the Fibonacci ratio between minor wave 5 and either of minor waves 1 or 3 may be used to add to the target calculation. At that stage, the target may widen to a small zone or it may change.
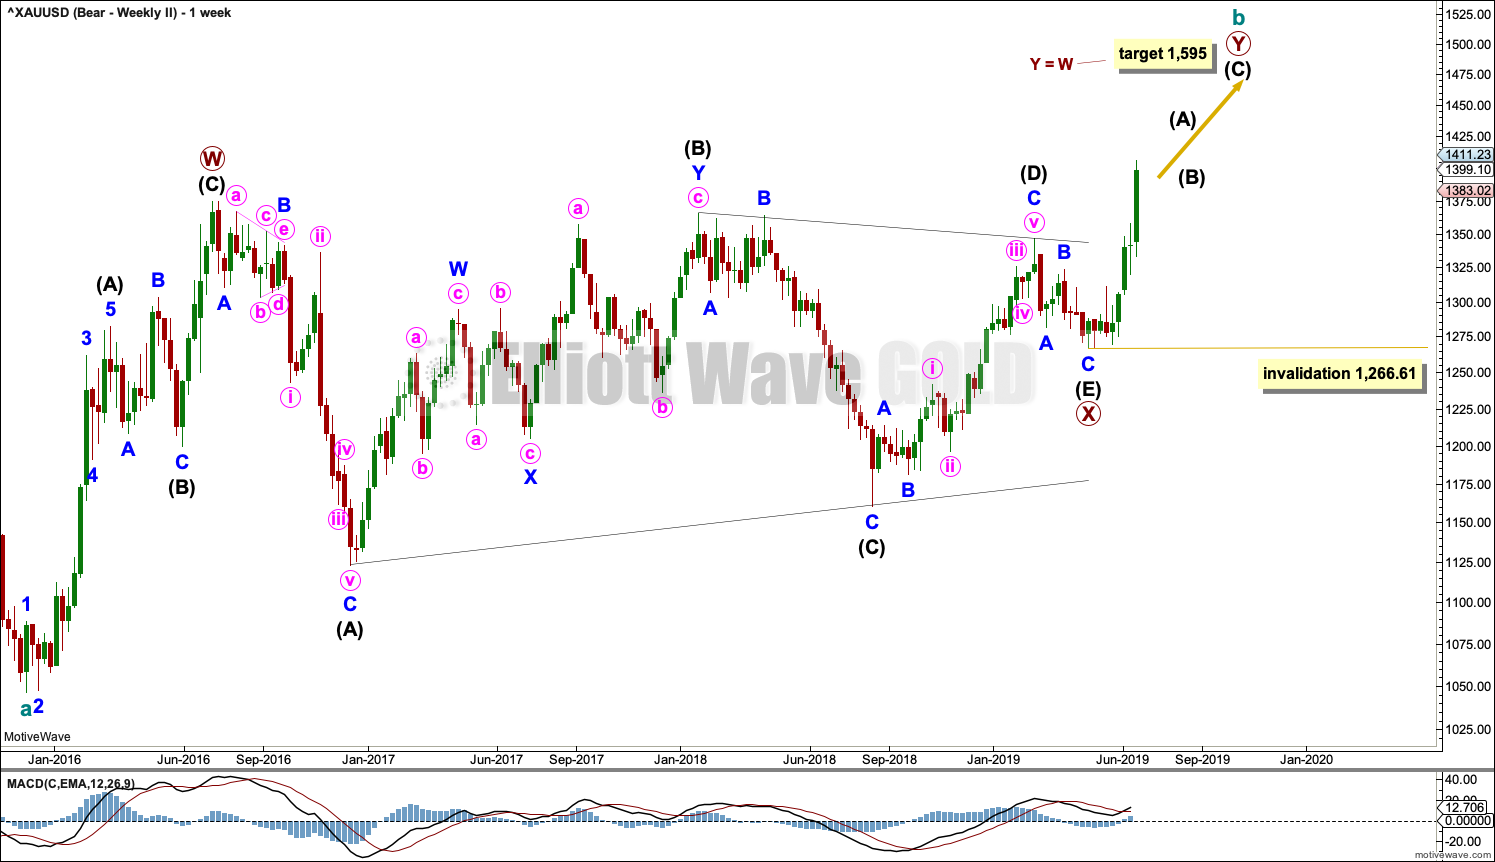
SECOND WEEKLY CHART
Click chart to enlarge.
It is also possible that cycle wave b may be an incomplete double zigzag, with primary wave X within it a complete regular contracting triangle.
The most common point for E waves of Elliott wave triangles to end is to fall reasonably short of the A-C trend line. However, this example sees intermediate wave (E) too short of the (A)-(C) trend line for a normal look. This wave count is possible, but it has as reduced probability for this reason.
If primary wave Y begins at 1,266.61, then the target for it to reach equality in length with primary wave W is at 1,595.
BULLISH ELLIOTT WAVE COUNT
WEEKLY CHART
Click chart to enlarge.
This wave count sees the the bear market complete at the last major low for Gold in November 2015.
If Gold is in a new bull market, then it should begin with a five wave structure upwards on the weekly chart. However, the biggest problem with this wave count is the structure labelled cycle wave I because this wave count must see it as a five wave structure, but it looks more like a three wave structure.
Commodities often exhibit swift strong fifth waves that force the fourth wave corrections coming just prior and just after to be more brief and shallow than their counterpart second waves. It is unusual for a commodity to exhibit a quick second wave and a more time consuming fourth wave, and this is how cycle wave I is labelled. This wave count still suffers from this very substantial problem, and for this reason two bearish wave counts are still considered above as they have a better fit in terms of Elliott wave structure.
Cycle wave II subdivides well as a double combination: zigzag – X – expanded flat.
Cycle wave III may have begun. Within cycle wave III, primary waves 1 and 2 may now be complete. If it continues lower as a double zigzag, then primary wave 2 may not move beyond the start of primary wave 1 below 1,160.75.
Cycle wave III so far for this wave count would have been underway now for 44 weeks. It may be beginning to exhibit some support from volume and increasing ATR. If this increase continues, then this wave count would have some support from technical analysis.
Draw a base channel about primary waves 1 and 2: draw the first trend line from the start of primary wave 1 to the end of primary wave 2, then place a parallel copy on the end of primary wave 1. Primary wave 3 should have the power to break through resistance at the upper edge of the base channel. Copy this channel over to the daily chart.
DAILY CHART
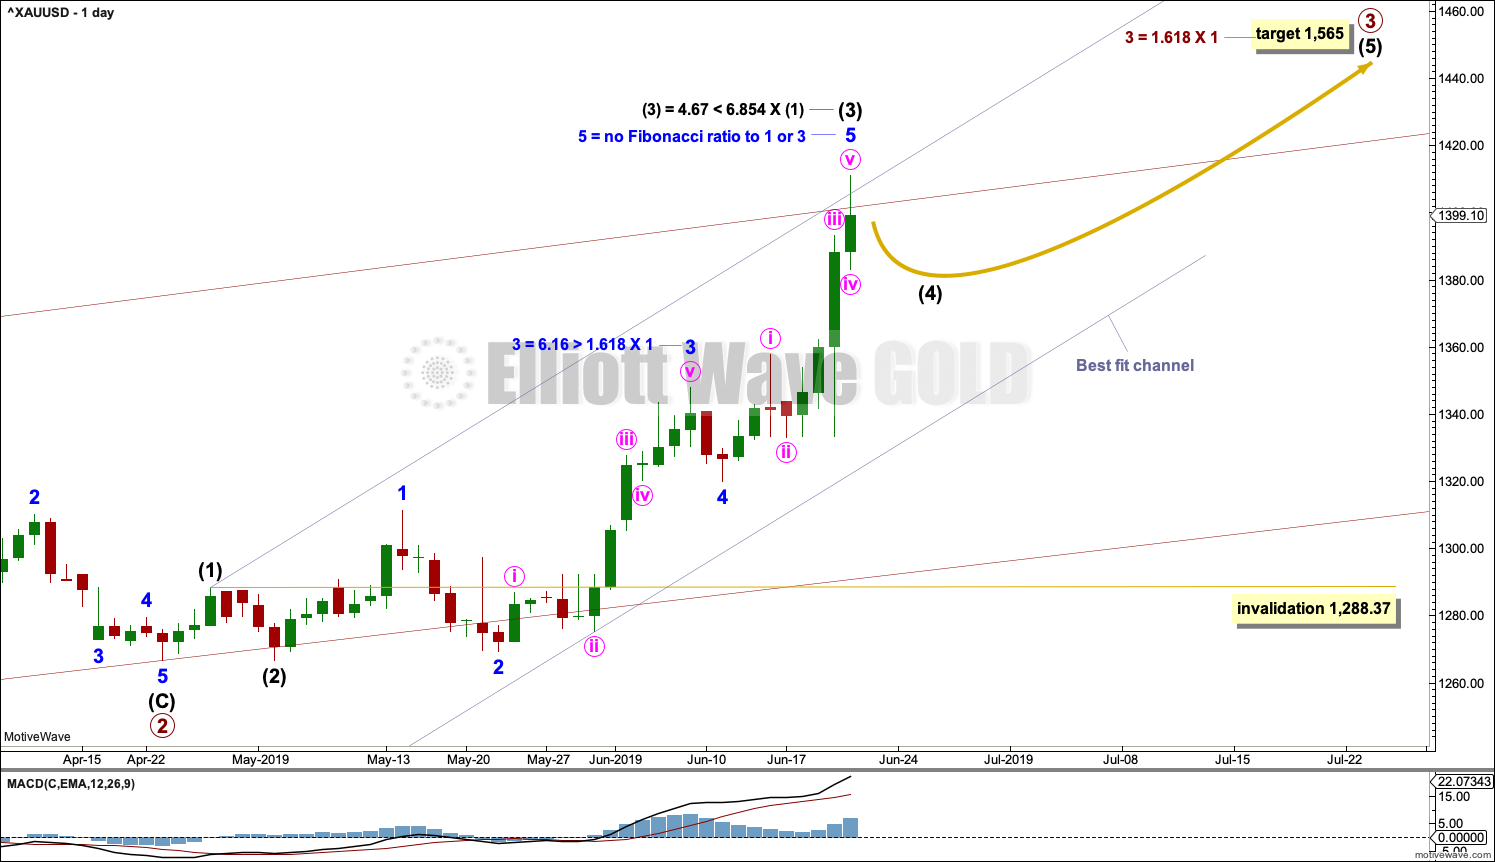
Click chart to enlarge.
This daily chart focusses on the impulse of primary wave 3.
Primary wave 3 may only subdivide as an impulse. Within primary wave 3, minor waves 1 through to 3 may be complete.
The structure of primary wave 3 for this wave count is exactly the same as the structure of intermediate wave (C) for the bearish wave count. Targets, invalidation points and expectations are exactly the same for the mid term.
TECHNICAL ANALYSIS
MONTHLY CHART
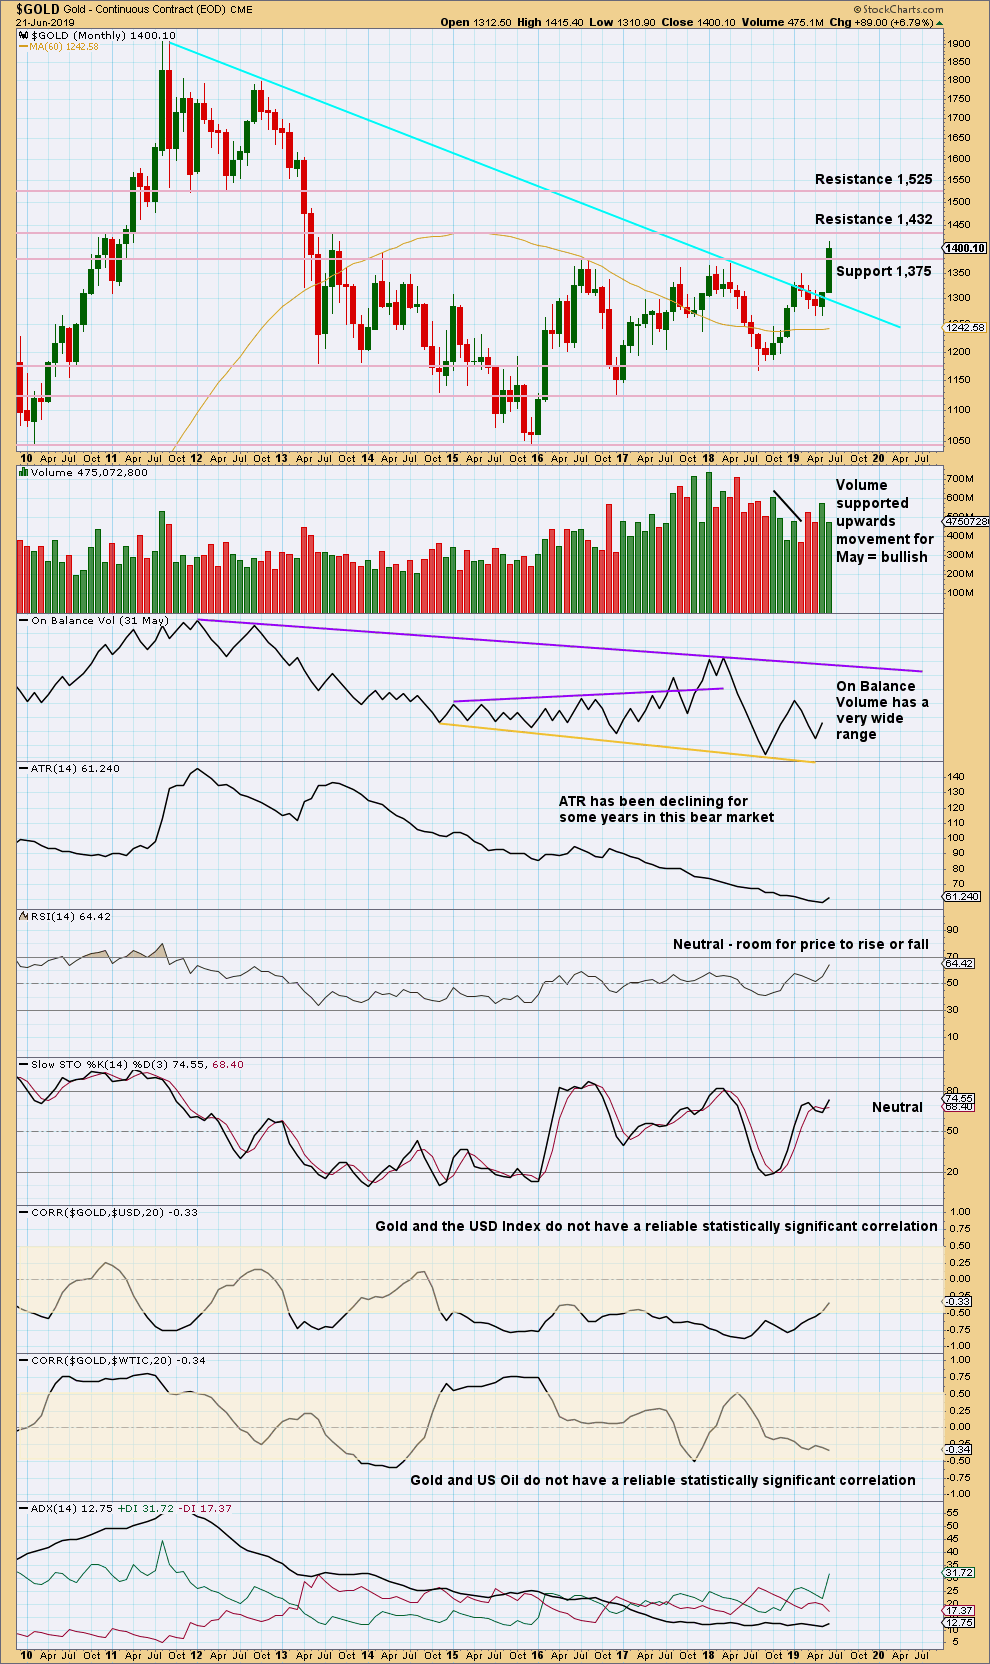
Click chart to enlarge. Chart courtesy of StockCharts.com.
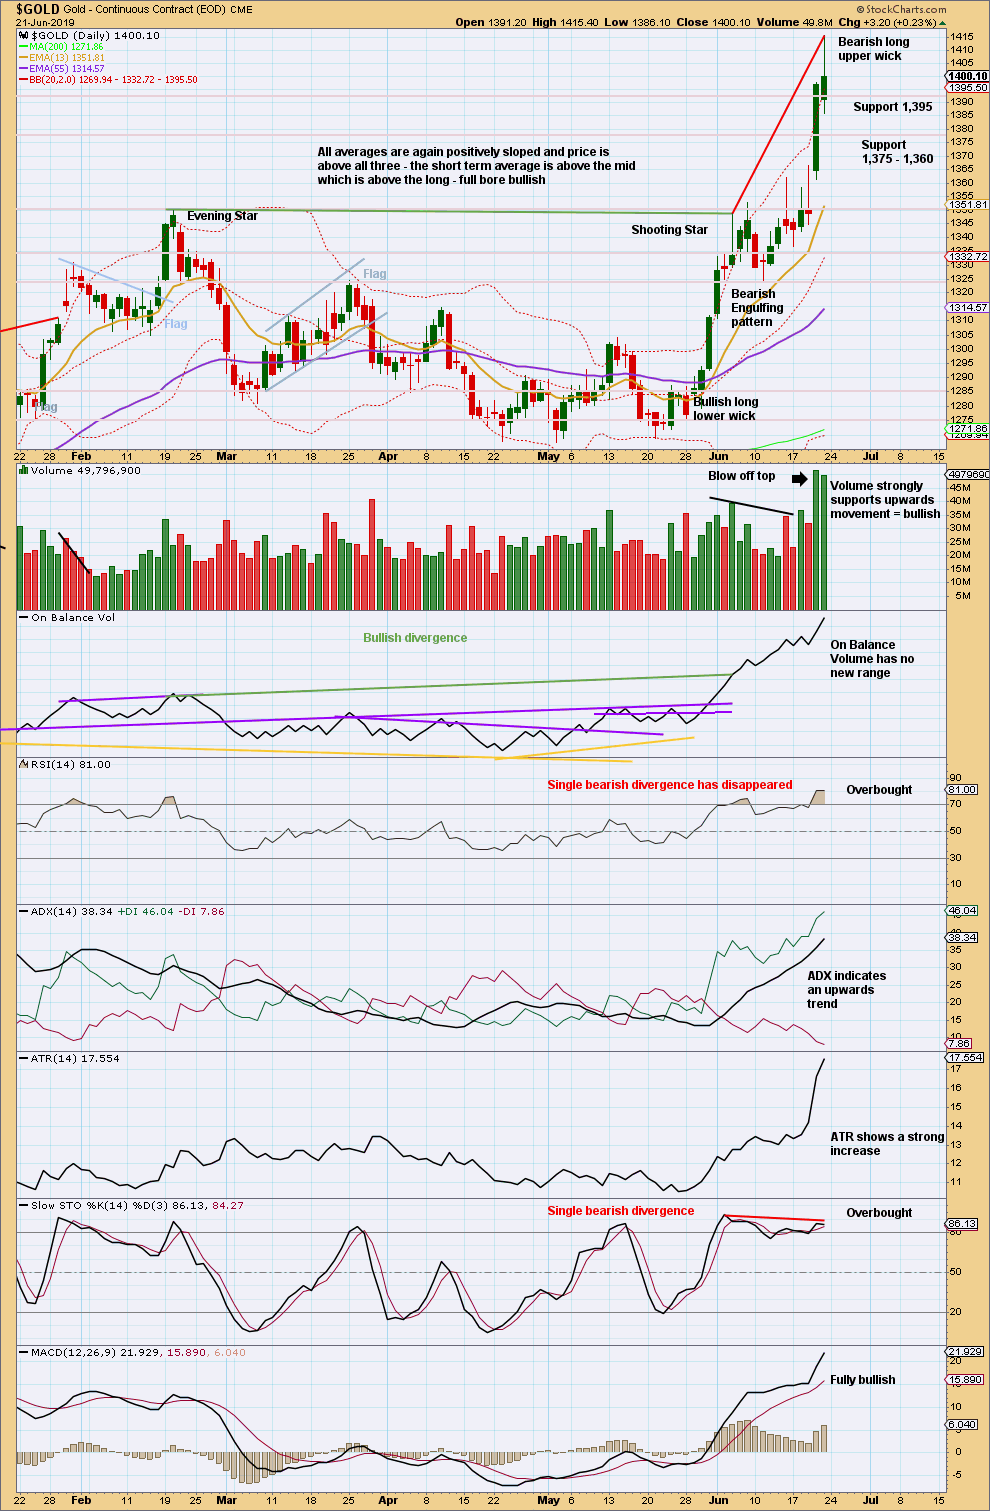
Gold is this week effecting an upwards breakout above multi-year resistance and above the cyan bear market trend line. Look for next resistance identified on the chart.
WEEKLY CHART
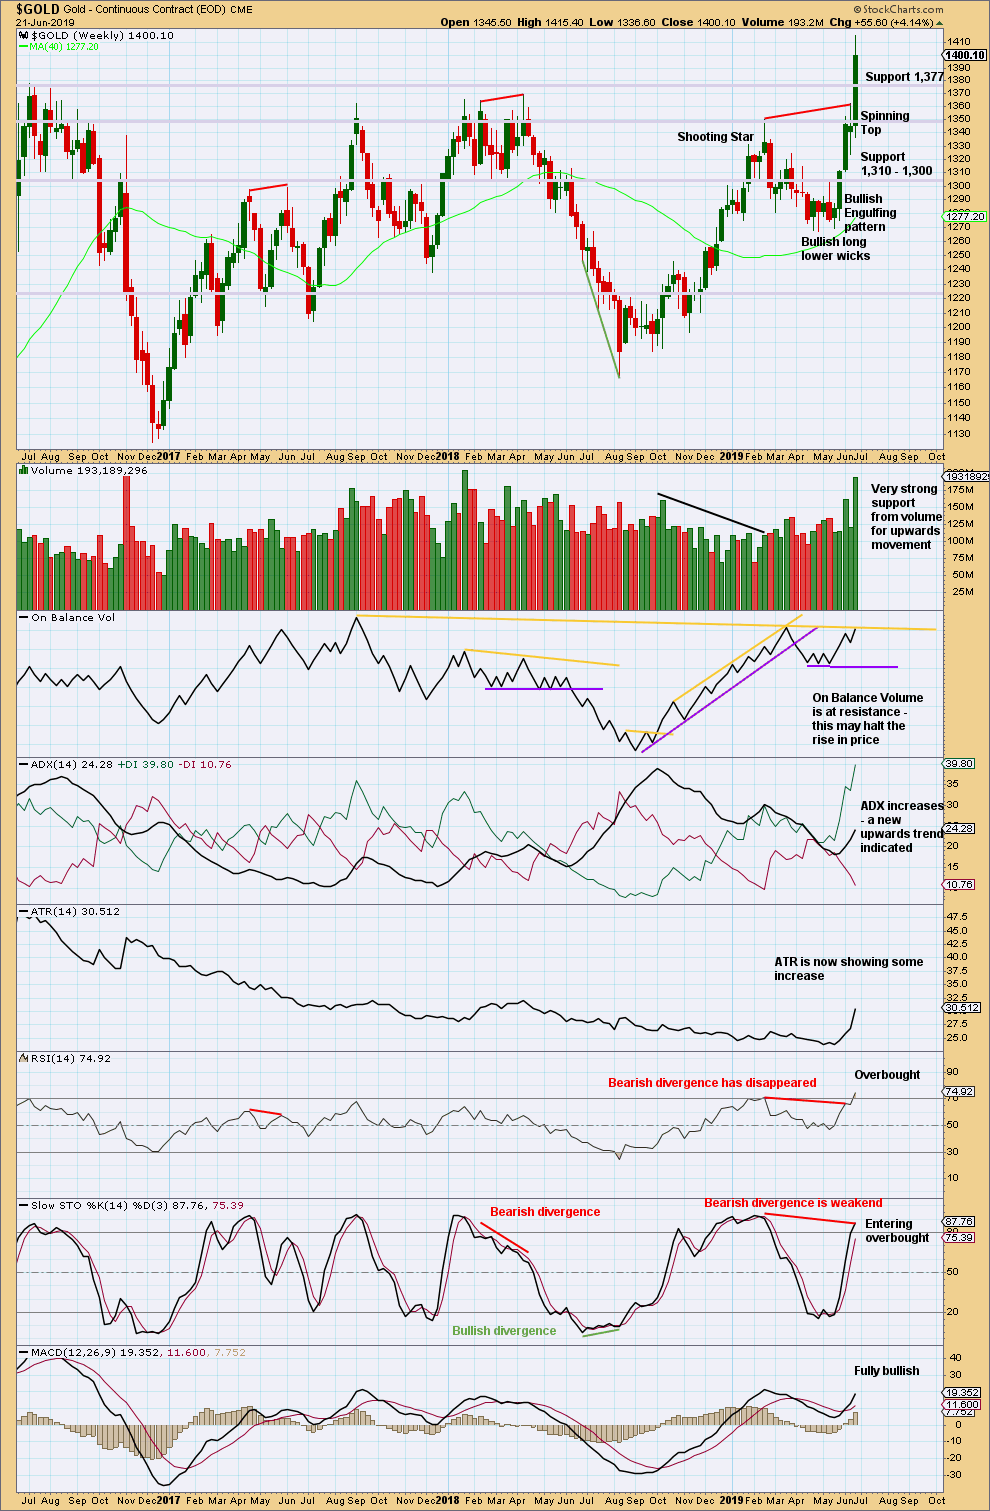
Click chart to enlarge. Chart courtesy of StockCharts.com.
Gold has broken out of a multi-year consolidation, which saw resistance about 1,375. The breakout has support from volume, so confidence may be had in it.
Price now has some strength with rising ATR. Conditions are overbought and On Balance Volume is at resistance. A pullback or consolidation may begin here before the upwards trend resumes.
Look now for strong support about 1,375 for a possible back test.
DAILY CHART
Click chart to enlarge. Chart courtesy of StockCharts.com.
After the upwards breakout, it would be typical to see price curve back down to test support at prior resistance. Extreme overbought conditions may be relieved by a back test.
The trend is upwards. Consolidations and pullbacks are opportunities in an upwards trend to join the trend.
GDX WEEKLY CHART
Click chart to enlarge. Chart courtesy of StockCharts.com.
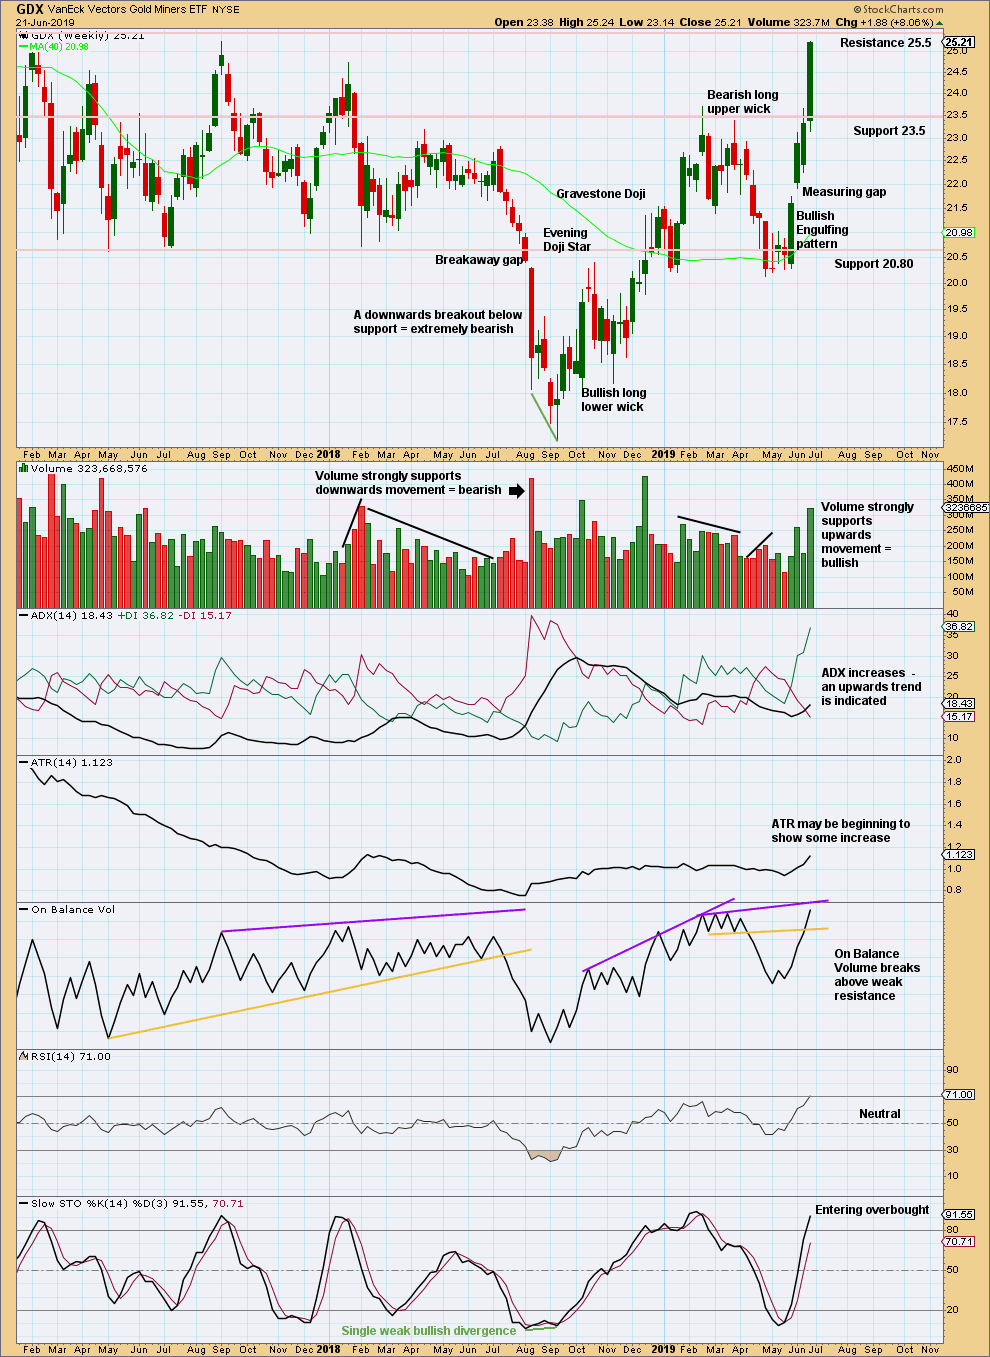
The upwards trend continues. A close near the high for the week suggests more upwards movement next week.
GDX DAILY CHART

Click chart to enlarge. Chart courtesy of StockCharts.com.
A target calculated from the new measuring gap is 25.82. Friday’s candlestick suggests more upwards movement on Monday.
US OIL
A sideways consolidation was expected for the week. Price has moved higher than expected, but it remains below the Elliott wave invalidation point.
Summary: This bounce may either be over here or may continue higher towards 60.53. Final resistance may be found at the upper edge of the maroon Elliott channel.
The larger trend most likely still remains down. The final target is calculated at 10.72.
MAIN ELLIOTT WAVE COUNT
MONTHLY CHART
Click chart to enlarge.
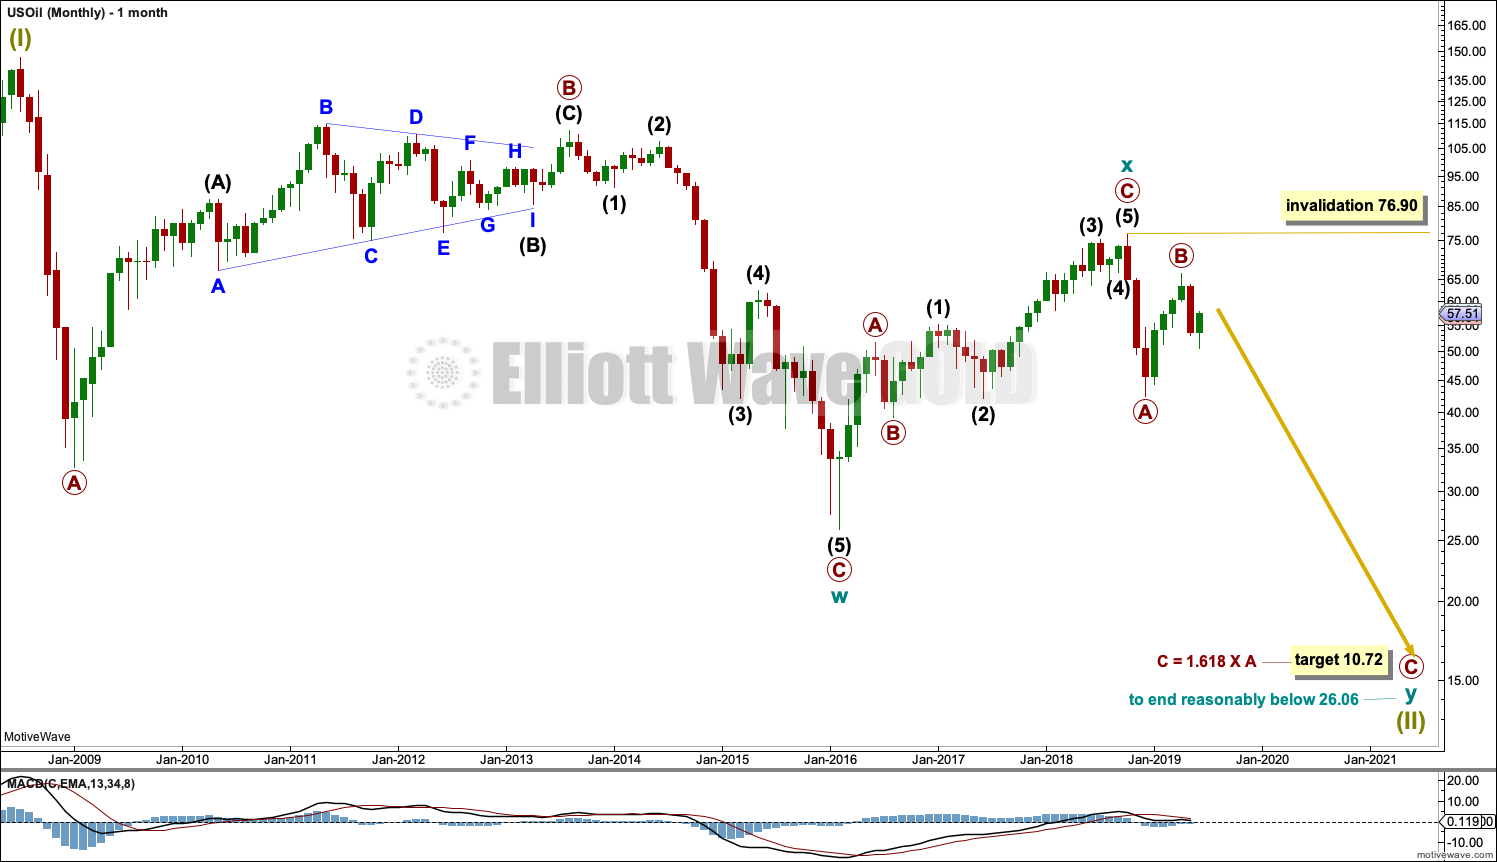
The basic Elliott wave structure is five steps forward and three steps back. This Elliott wave count expects that US Oil is still within a three steps back pattern, which began in July 2008. The Elliott wave count expects that the bear market for US Oil continues.
This Elliott wave corrective structure is a double zigzag, which is a fairly common structure. The correction is labelled Super Cycle wave (II).
The first zigzag in the double is complete and labelled cycle wave y. The double is joined by a three in the opposite direction labelled cycle wave x, which subdivides as a zigzag. The second zigzag in the double may now have begun, labelled cycle wave w.
The purpose of a second zigzag in a double zigzag is to deepen the correction when the first zigzag does not move price deep enough. To achieve this purpose cycle wave y may be expected to move reasonably below the end of cycle wave w at 26.06. The target calculated would see this expectation met.
Cycle wave y is expected to subdivide as a zigzag, which subdivides 5-3-5.
Cycle wave w lasted 7.6 years and cycle wave x lasted 2.7 years. Cycle wave y may be expected to last possibly about a Fibonacci 5 or 8 years.
If it continues higher, then primary wave B may not move beyond the start of primary wave A above 76.90.
The upwards wave labelled cycle wave x would have to be counted as a five wave impulse to see US Oil as within a new bull market. Such a wave count could be made but would look forced. This wave subdivides best as a three.
WEEKLY CHART
Click chart to enlarge.
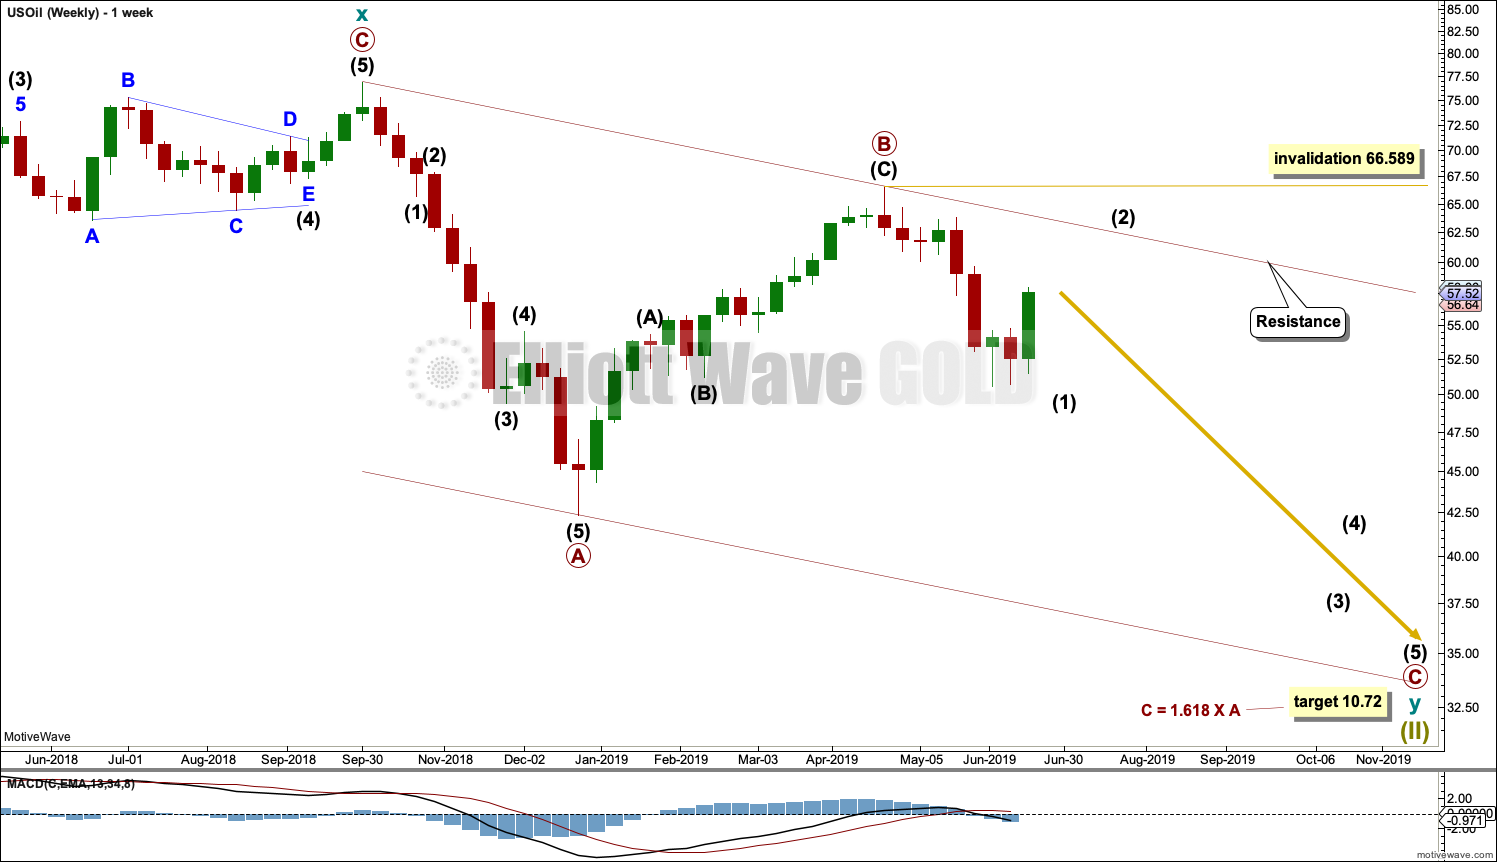
This weekly chart is focussed on the start of cycle wave y.
Cycle wave y is expected to subdivide as a zigzag. A zigzag subdivides 5-3-5. Primary wave A must subdivide as a five wave structure if this wave count is correct.
Primary wave A may be a complete five wave impulse at the last low.
Primary wave B may now be a complete single zigzag at the last high.
Primary wave C may have just begun. Primary wave C must subdivide as a five wave structure.
Primary wave A lasted 12 weeks, just one short of a Fibonacci 13.
Primary wave C may be longer in time as well as price. If cycle wave y lasts a Fibonacci 5 years, then primary wave C within it may take as long as a Fibonacci 233 weeks.
Intermediate wave (1) within primary wave C may be subdividing as an impulse, and the alternate daily chart below considers the possibility that it may be over. Intermediate wave (2) may not move beyond the start of intermediate wave (1) above 66.59.
Draw a channel about the zigzag of primary wave y using Elliott’s technique for a correction. Draw the first trend line from the start of primary wave A to the end of primary wave B, then place a parallel copy on the end of primary wave A. The upper edge of this channel may show where bounces along the way down find resistance. The lower edge of the channel may provide support.
Intermediate wave (2) may be a multi-week bounce that may find resistance at the upper edge of the Elliott channel.
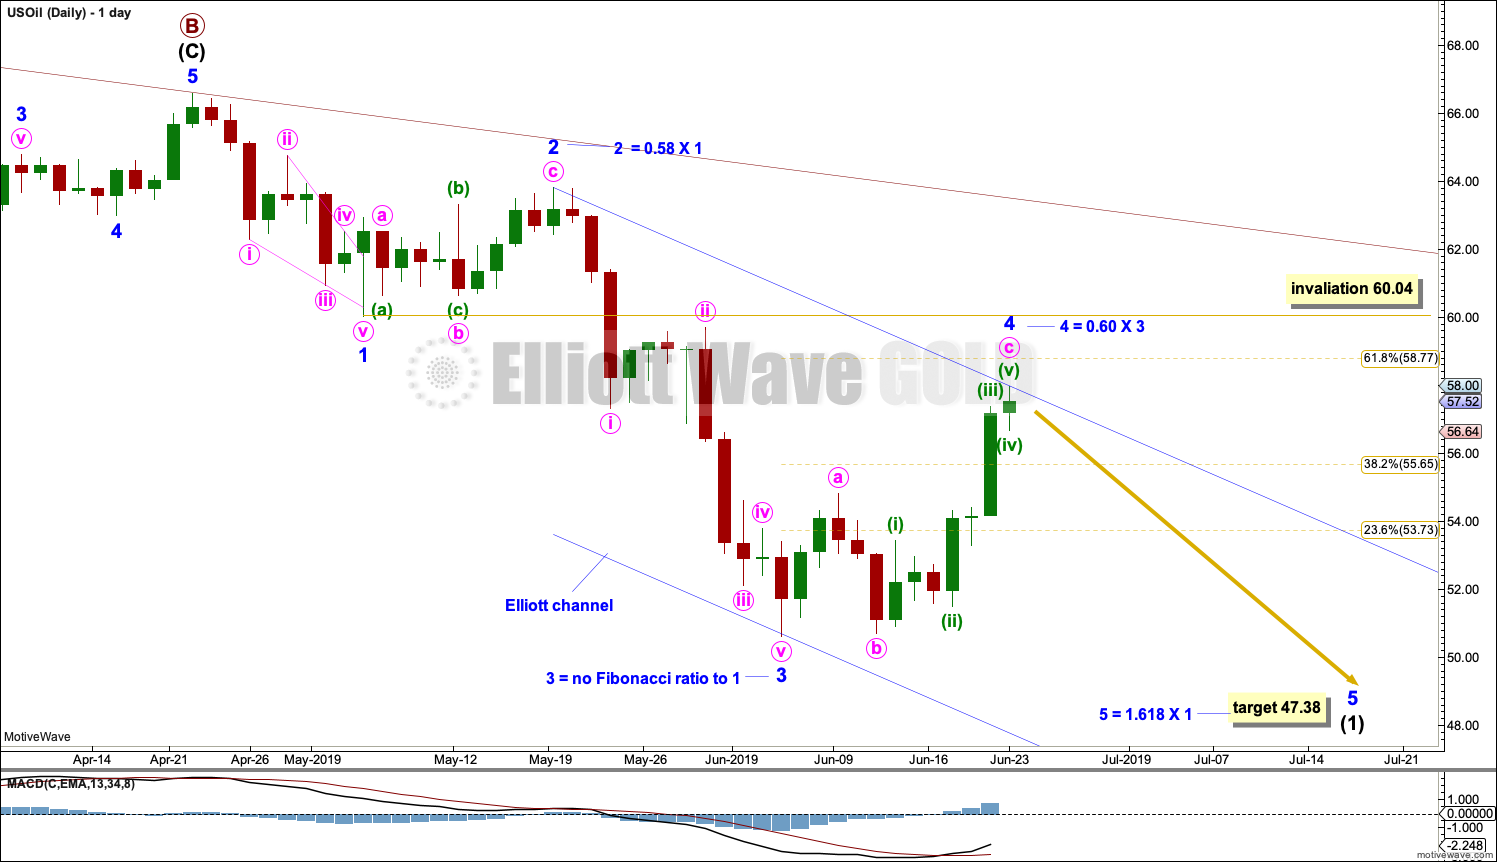
DAILY CHART
Click chart to enlarge.
Note that monthly and weekly charts are on a semi-log scale, but this daily chart is on an arithmetic scale. This makes a slight difference to trend channels.
The daily chart focusses on the structure of intermediate wave (1) within primary wave C.
Intermediate wave (1) may be continuing lower as an impulse. Within intermediate wave (1), minor waves 1 through to 4 may be complete. Minor wave 3 shows an increase in downwards momentum beyond that of minor wave 1. This wave count fits with MACD.
Minor wave 2 was a relatively deep zigzag lasting 10 sessions. Minor wave 4 may be complete as a deep zigzag lasting 12 sessions. The lack of alternation in this wave count reduces its probability. Minor wave 4 is slightly longer in duration than minor wave 2, which further slightly reduces the probability of this wave count. The alternate below may be a reasonable solution.
Minor wave 3 did not exhibit a Fibonacci ratio to minor wave 1. A target is calculated that would expect minor wave 5 to exhibit a Fibonacci ratio to minor wave 1.
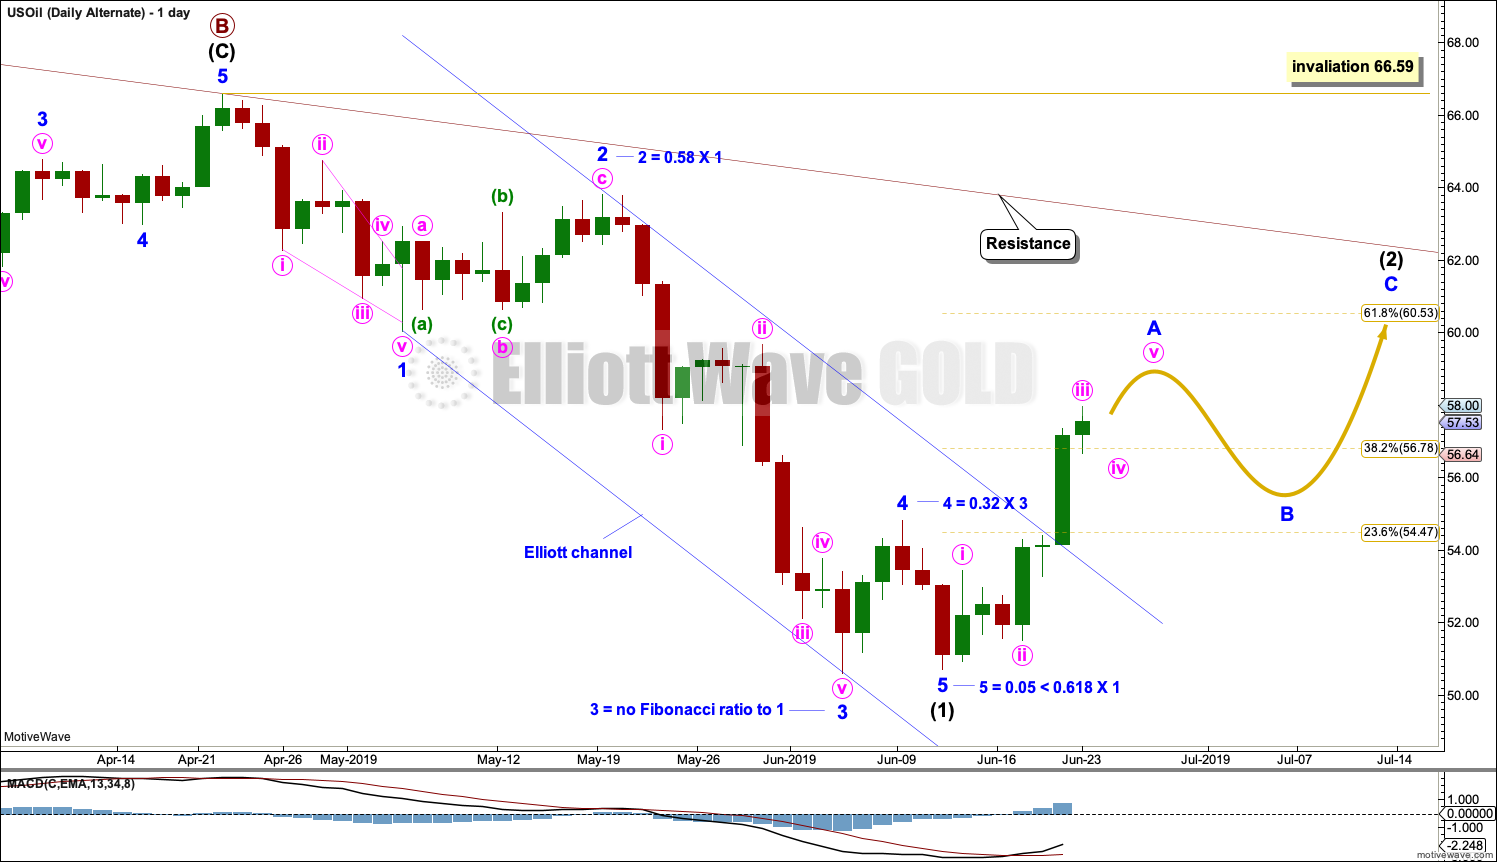
DAILY CHART ALTERNATE
Click chart to enlarge.
It is possible that intermediate wave (1) is complete. Minor wave 4 for this wave count now exhibits some alternation to minor wave 2; minor wave 2 may be a relatively deep zigzag or flat, and minor wave 4 may be a more shallow zigzag.
Minor wave 5 ends with a slight 0.11 truncation. This reduces the probability of this wave count.
Intermediate wave (2) would most likely unfold as a zigzag and may end either about the 0.618 Fibonacci ratio of intermediate wave (1) or about the upper edge of the maroon Elliott channel. Intermediate wave (2) may continue for another one to three weeks.
Intermediate wave (2) may not move beyond the start of intermediate wave (1) above 66.59.
TECHNICAL ANALYSIS
MONTHLY CHART
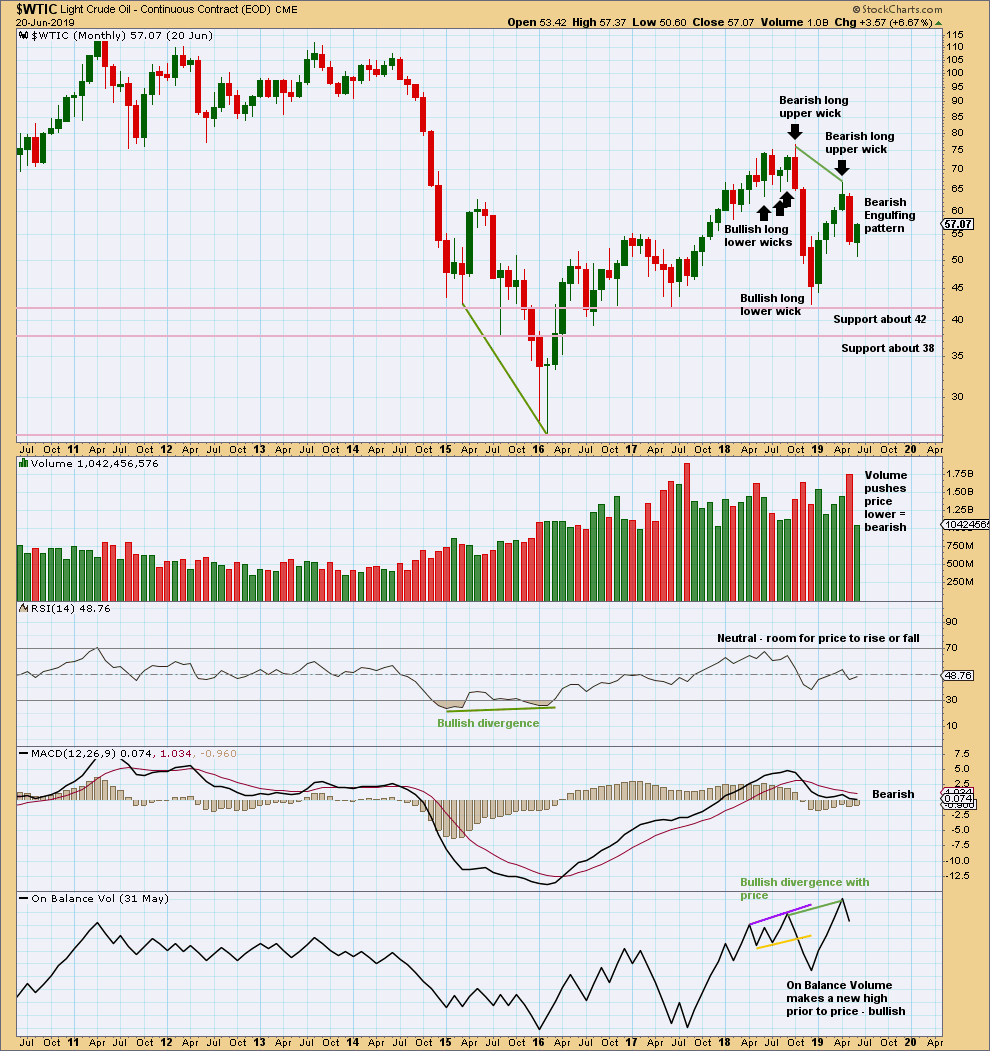
Click chart to enlarge. Chart courtesy of StockCharts.com.
May has closed with a strong Bearish Engulfing candlestick pattern, which has strong support from volume. This supports the Elliott wave count.
WEEKLY CHART
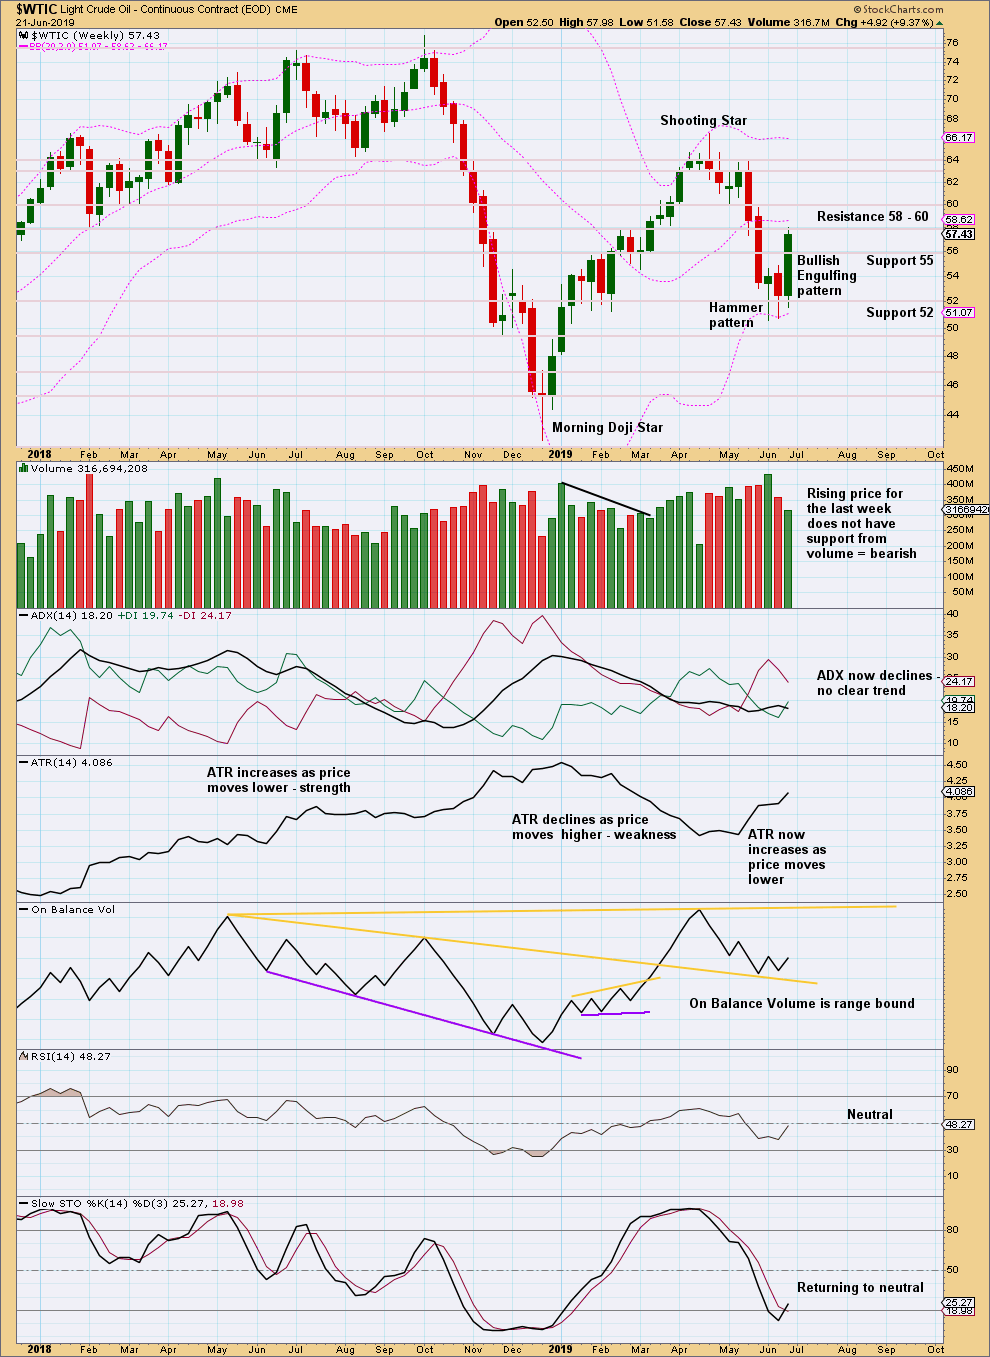
Click chart to enlarge. Chart courtesy of StockCharts.com.
This week’s Bullish Engulfing pattern may reasonably be expected to be followed by either upwards or sideways movement to relive extreme conditions. Volume suggests upwards movement here may be limited.
DAILY CHART
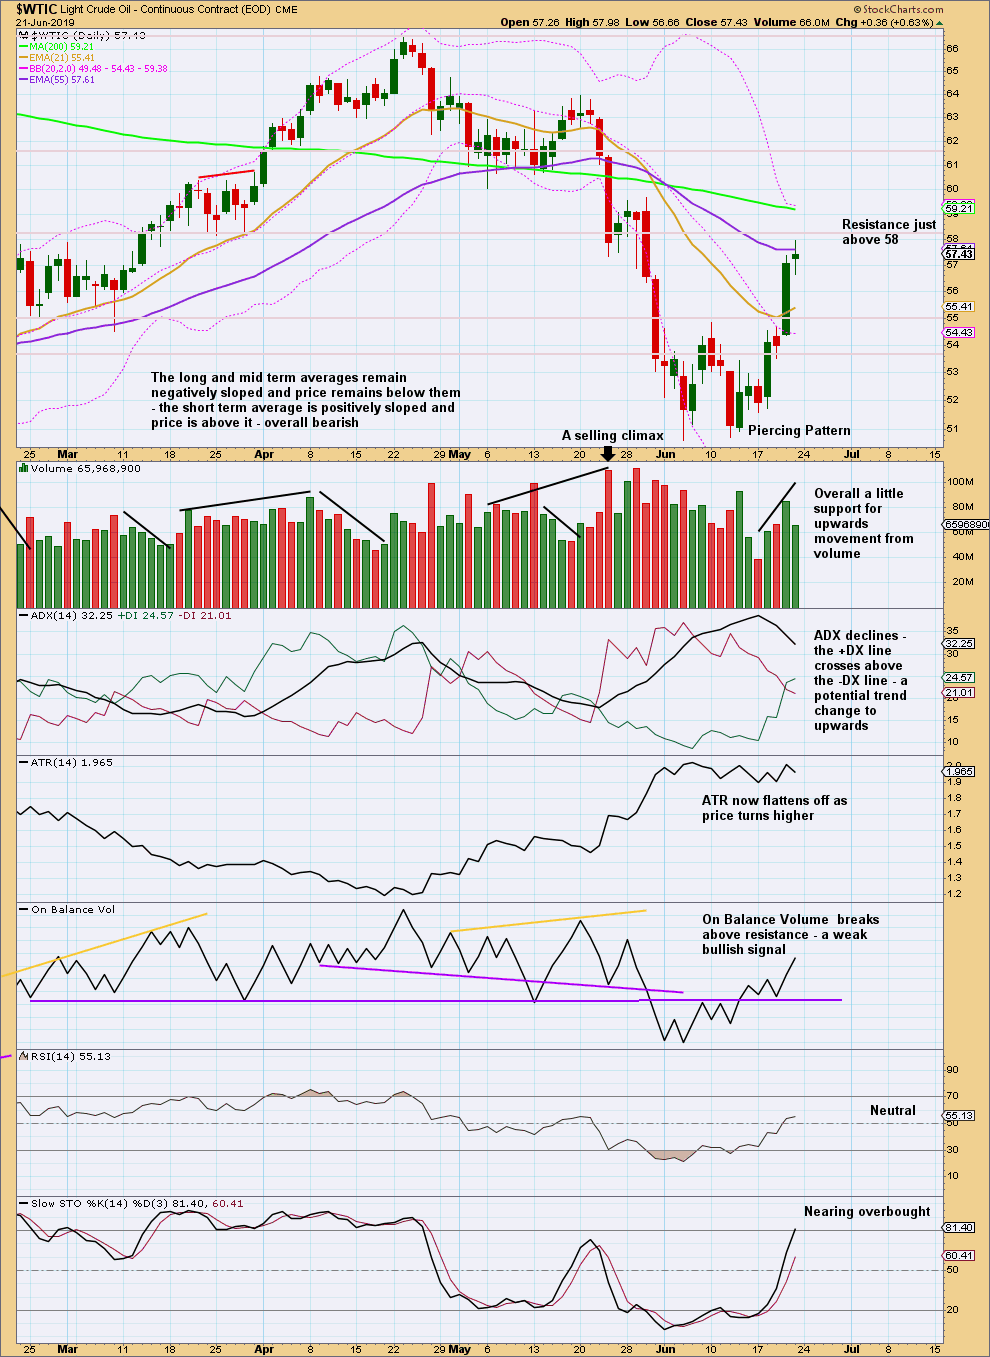
Click chart to enlarge. Chart courtesy of StockCharts.com.
Some upwards movement is relieving extreme conditions. There is room for this bounce to continue.
—
Always practice good risk management as the most important aspect of trading. Always trade with stops and invest only 1-5% of equity on any one trade. Failure to manage risk is the most common mistake new traders make.
Update for the S&P500:
I’m slightly adjusting the short term picture to see intermediate (1) over at the last high and this pullback intermediate (2). The target for it to end in the next day or so is 2,884.
The trend remains up, there is underlying strength to support price.
Hi Lara,
Could we be just finishing minor wave 2 of int wave 3? In this case I’m leaving the top of int wave 1 where you had it originally.
Hi John,
Lara has ruled out that count because it does not have the ‘right look’. If Minor 2 of Intermediate 3 were continuing or over at yesterday’s low, it would be out of proportion with Intermediate 2. On her daily update from June 25th, Lara wrote,
———————————————————————————————
This wave count was the only hourly wave count up to yesterday. Today it is an alternate and may be discarded tomorrow if price continues lower. With deeper than expected movement today and bearish classic analysis suggesting more downwards movement ahead, minor wave 2 now looks out of proportion to intermediate wave (2) one degree higher. This wave count no longer has the right look.
———————————————————————————————–
I hope this helps and I hope it is okay that I posted an hourly comment on the weekly forum. The good news is that a 3rd of a 3rd is about to begin once the current correction completes.
Have a great day all.
Thanks Rodney and yes it does help. Feel free to post away on the weekly board. Wish I could see the daily posts!
You have a great day too!
Thank you very much Rodney for doing that.
Lara, Thankyou for also updating on Bitcoin as well. A number of analysts I follow on Twitter are still very bullish but at some point, it should find a 5th wave top, correct?
https://twitter.com/BigCheds/status/1143134528598413313
Yes, at some point five up should be complete and three down should develop.
BTC likes to form sharp tops. I’m still looking for that . Today it looks like it may have found a high, there’s a sharp vertical movement and a very bearish long upper wick on the last daily candlestick.
I’m waiting for the three down (which may be fairly deep) to complete before I throw some $$ at this.
Lara, Great call on Gold as it seams relentless here, with little to no pullback to take an additional long entry. Fortunately, based on your work and another analyst I follow who is bullish, I already have several long positions based. Nice Call Lara!
https://surfcity.co/2019/06/19/gold-the-usd-midweek-update-4/
It’s possible today that Gold may have found a high; either a major high or a short term high for a curve back down to test support after the breakout.